1
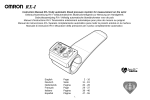
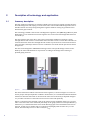
Mosbaek CEV flow regulator Verification Report Verification Report February 2015 This report has been prepared under the DHI Business Management System certified by DNV to comply with ISO 9001 (Quality Management) Approvedby StenLindberg(Headofdepartment,DHI) Approvedby PeterFritzel(Verificationresponsible,ETADanmark) Mosbaek CEV flow regulator Verification Report Prepared for Mosbaek A/S Represented by Torben Krejberg, Technical Director Test facility ProjectNo Classification Version 11530013 Public Final Authors MetteTjenerAndersson,DHI Contents 1 1.1 1.2 1.3 1.4 1.5 1.6 Introduction...................................................................................................................................................3 Nameoftechnology.............................................................................................................................................................3 Nameandcontactofproposer.......................................................................................................................................3 Nameofverificationbodyandresponsibleofverification...............................................................................3 Verificationorganisationincludingexperts.............................................................................................................4 Verificationprocess............................................................................................................................................................4 Deviationsfromtheverificationprotocol.................................................................................................................6 2 2.1 2.2 2.2.1 2.2.2 2.3 2.3.1 2.3.2 Descriptionoftechnologyandapplication..........................................................................................8 Summarydescription.........................................................................................................................................................8 Intendedapplication...........................................................................................................................................................9 Matrix/matrices....................................................................................................................................................................9 Purpose(s)...............................................................................................................................................................................9 Verificationparametersdefinition............................................................................................................................10 FlowatHbumpandHdesign.................................................................................................................................................10 FlowreductionatHdesign.................................................................................................................................................10 3 3.1 3.2 3.2.1 3.2.2 3.2.3 3.3 3.3.1 3.3.2 3.3.3 3.3.4 3.3.5 3.3.5.1 3.3.5.2 3.3.5.3 3.4 3.4.1 3.4.2 3.4.2.1 3.4.2.2 3.4.2.3 3.4.2.4 3.4.3 3.4.3.1 3.4.3.2 3.4.3.3 3.4.3.4 3.4.3.5 3.4.4 3.4.4.1 3.4.4.2 3.4.4.3 3.4.4.4 3.4.5 3.4.6 Evaluation.....................................................................................................................................................11 Calculationofverificationparametersperformance........................................................................................11 Evaluationoftestquality...............................................................................................................................................11 Controldata.........................................................................................................................................................................11 Audits.....................................................................................................................................................................................11 Deviations.............................................................................................................................................................................12 Verificationresults...........................................................................................................................................................12 Performanceparameters...............................................................................................................................................12 FlowatHbumpandHdesign.................................................................................................................................................12 FlowreductionatHdesign.................................................................................................................................................13 Operationalparameters.................................................................................................................................................13 Additionalparameters....................................................................................................................................................14 Usermanual.........................................................................................................................................................................14 Requiredresources..........................................................................................................................................................15 Occupationalhealthandenvironmentalimpact.................................................................................................17 RecommendationfortheStatementofVerification..........................................................................................17 Technologydescription..................................................................................................................................................17 Application...........................................................................................................................................................................18 Matrix.....................................................................................................................................................................................18 Purpose..................................................................................................................................................................................18 Conditionsofoperationanduse................................................................................................................................18 Verificationparametersdefinitionsummary.......................................................................................................18 Testandanalysisdesign................................................................................................................................................18 Laboratoryorfieldconditions....................................................................................................................................18 Matrixcomposition..........................................................................................................................................................20 Testandanalysisparameters......................................................................................................................................20 Testandanalysismethodssummary.......................................................................................................................20 Parametersmeasured.....................................................................................................................................................20 Verificationresults...........................................................................................................................................................21 Performanceparameters...............................................................................................................................................21 Operationalparameters.................................................................................................................................................21 Environmentalparameters..........................................................................................................................................21 Additionalparameters....................................................................................................................................................21 Additionalinformation...................................................................................................................................................22 Qualityassuranceanddeviations..............................................................................................................................22 Verification Report Mosbaek i 4 Qualityassurance.......................................................................................................................................23 5 References....................................................................................................................................................25 Figures Figure1‐1 Figure2‐1 Figure2‐2 Figure3‐1 Figure3‐2 Figure3‐3 Organisationoftheverificationandtest.......................................................................................................................................4 SketchofCEVflowregulatorinstalledinwell.SketchprovidedbyMosbaek...............................................................8 Graphicshowingthegeneralvortexbrakeeffectonwateroutflow,withCEVsoperatingat78%and100% efficiencyandwaterinflowtowelllargerthanoutflowthoughCEV(wellisfillingup).Graphprovidedby Mosbaek.......................................................................................................................................................................................................9 CorrelationbetweenQinflowandQbumpgivenforalltestedCEVs........................................................................................13 A)SketchofCEVflowregulatorinstalledinwell.B)Graphicshowingthegeneralvortexbrakeeffecton wateroutflow,withCEVsoperatingat78%and100%efficiencyandwaterinflowtowelllargerthan outflowthoughCEV(wellisfillingup).BothprovidedbyMosbaek..............................................................................17 Sketchoftestset‐up.............................................................................................................................................................................19 Tables Table1‐1 Table2‐1 Table2‐2 Table3‐1 Table3‐2 Table3‐2 Table3‐3 Table3‐4 Table4‐1 Simplifiedoverviewoftheverificationprocess.........................................................................................................................6 SpecificperformanceclaimsfromtheproposeronQbumpandQdesign..............................................................................10 SpecificperformanceclaimsbytheproposeronflowreductioncomparedtonoCEVinstalledinwell.........10 VerifiedperformanceonQbump.+)BeawarethattheresultsofQbumpareuniquelyinfluencedbyQinflow,see later.............................................................................................................................................................................................................12 VerifiedperformanceonQdesign.*)basedontwotestsonly................................................................................................13 VerifiedperformanceonflowreductioncomparedtonoCEVinstalledinwell.........................................................13 Evaluationofusermanual.................................................................................................................................................................14 Listofcapitalcostitemsandoperationandmaintenancecostitemsperproductunit..........................................16 QAplanfortheverification...............................................................................................................................................................23 Appendices A B C D E Termsanddefinitions SpecificVerificationProtocol Testplan Testreport Auditreports Archiving:Allstandardprojectfiles(documents,etc)arearchivedatETADanmark.Anyotherprojectfiles(set‐upfiles,forcingdata,model output,etc.)arearchivedwiththeinstituteperformingthetestsoranalysis. ii Verification Report Mosbaek 1 Introduction Environmentaltechnologyverification(ETV)isanindependent(thirdparty)assessmentofthe performanceofatechnologyoraproductforaspecifiedapplicationunderdefinedconditions andqualityassurance. Theobjectiveofthisverificationistoevaluatetheperformanceofaverticalcentrifugalflow regulatorforstormwater. ThisVerificationReportandtheverificationofthetechnologyarebasedontheSpecificVerifica‐ tionProtocol,TestPlanandTestReportfortheMosbaekCEVflowregulator,includedasAp‐ pendixB,DandE. 1.1 Name of technology Verticalcentrifugalflowregulator,CEV(CEntrifugalVertical),producedbyMosbaekA/S. MosbaekproducesCEVsforflowcapacitiesfrom0.2l/sto80l/s.Theverificationwillcoverver‐ ificationtestoffourspecificCEVdimensionswithinthisrange. MosbaekhaveselectedfourspecificCEV‐modelstorepresenttheirCEVtechnology,namely: CEV1.4l/[email protected]–100% CEV4.9l/[email protected]–100% CEV10.5/[email protected]–78% CEV10.5l/[email protected]–100% ThenameoftheCEVindicatesthedesignedmaximumflowofforexample1.4l/sandthecorre‐ latingmaximumpressureheightofforexample1.00m.Thepercentage(100%and78%)indi‐ catesthepercentageofthedesignflowatthepoint/bumpwherethevortexisformed. 1.2 Name and contact of proposer MosbaekA/S Værkstedsvej20 4600Køge Denmark Contact:TorbenKrejberg,e‐mail:[email protected],phone:+4556638580 Mosbaekwebsite:www.mosbaek.dk 1.3 Name of verification body and responsible of verification ETADanmarkA/S GöteborgPlads1 2150Nordhavn Denmark Verificationresponsible: PeterFritzel(PF),email:[email protected],phone+4572245900 Verification Report Mosbaek 3 Appointedverificationexpert: MetteTjenerAndersson(MTA),e‐mail:[email protected],phone:+4545169148 1.4 Verification organisation including experts TheverificationwasconductedbyETADanmarkA/SincooperationwithDanishCentreforVer‐ ificationofClimateandEnvironmentalTechnologies,DANETV,whichperformsindependent verificationoftechnologiesandproductsforthereductionofclimatechangesandpollution. TheverificationisconductedtosatisfytherequirementsoftheETVschemeestablishedbythe EuropeanUnion(EUETVPilotProgramme)[1]. TheverificationwascoordinatedandsupervisedbyETADanmark,assistedbyanappointed verificationexpert,whiletestswerecoordinatedandsupervisedbyDHIwiththeparticipation oftheproposer,Mosbaek.ThetestingwasconductedatthepremisesofMosbaekinKøge,where atestfacilityhasbeenconstructed. Aninternalandanexternalexpertareassignedtoprovideindependentexpertreviewofthe planning,conductingandreportingoftheverificationandtests: Internaltechnicalexpert:MortenJustKjølby(MJK),DHI,UrbanandIndustryDept., e‐[email protected] Externaltechnicalexpert:Verificationprotocol:ProfessorTorbenLarsen(TL),Aalborg University,DepartmentofCivilEngineering,e‐[email protected]: IanWalker(IW),WRcplc,e‐[email protected] Thetasksassignedtoeachexpertaregiveninmoredetailinsection4Qualityassurance. Therelationshipsbetweentheorganisationsrelatedtothisverificationandtestaregivenin Figure1‐1. Figure 1-1 1.5 Organisation of the verification and test. Verification process TheprinciplesofoperationoftheDANETVverificationprocessaregiveninTable1‐1 4 Verification Report Mosbaek Table1‐1.Asitcanbeseen,verificationandtestingaredividedbetweentheverificationandthe testbody. Verification Report Mosbaek 5 Table 1-1 Simplified overview of the verification process. Phase Responsible Document Preliminaryphase Verificationbody QuickScan Contract Specificverificationprotocol Testingphase Testbody Testplan Testreport Assessmentphase Verificationbody Verificationreport StatementofVerification Qualityassuranceiscarriedoutbyanexpertgroupofinternalandexternaltechnicalexperts. Twoauditsofthetestsystemwereperformed,startingwithaninternalauditbythetestbody followedbyanexternalauditbytheDANETVverificationbodyunderETADanmark.Reference fortheverificationprocessistheEUETVGeneralVerificationProtocol[1]andETADanmarks internalprocedure[2].AStatementofVerificationwillbeissuedbyETADanmarkaftercomple‐ tionoftheverification.Thisverificationreportwillincludetheotherdocumentspreparedas appendices. 1.6 Deviations from the verification protocol Therewerenodeviationstotheverificationprotocol. 6 Verification Report Mosbaek Verification Report Mosbaek 7 2 Description of technology and application 2.1 Summary description Theflowregulatortechnologyforextremerainfalleventsisbasedonquicklyreachingthemax‐ imumdischargeflowandstayingatorbelowthisvalue.Themaximumdischargeflowistheal‐ lowableamountofwaterpassingthroughtheregulatorwithoutcausinganyproblemstothe downstreampipenetwork. Thetechnologyverifiedistheverticalcentrifugalflowregulator,CEV(CEntrifugalVertical)from Mosbaek.Itisawetmountedvortexflowregulatorforstormwaterwithdesignflowsbetween 0.2and80l/s. TheCEVregulatesthewaterduetothevortexcreatedwhensufficientwaterflowisgoing throughtheunit.Thevortexiscreatedwhenthewaterflowreachesacertainflowrate.Thevor‐ texslowsdownthewaterflowthroughtheCEV.Inthiswaythewaterisstoredinthewelland thewaterflowisthenkeptalmostconstant.AschematicviewoftheCEVinoperationisshown inFigure2‐1. TheCEVcanbedesignedtofulfildifferentdesigncriteria.Thespecificdesigncriteriaarede‐ finedbytheclientandMosbaekincooperationaccordingtothedesignoftheexistingor plannedpipingnetwork. Figure 2-1 Sketch of CEV flow regulator installed in well. Sketch provided by Mosbaek. TheCEVsverifiedhaveinflowinthebottomoftheregulator,asshowninFigure2‐1.Thisisto ensureproperandequalhydraulicconditions.Furthermore,inastandardinstallationMosbaek willensurethatinletandoutletarelocatedatthesamelevelinthewell(asdepictedonFigure 2‐1)inordertobeabletocontrolthewaterlevelriseinthewelloptimally. Figure2‐2showstheflowthroughaCEV.Inthe100%casethemaximumoutlet(Qdesign)ismet twice‐firstwherethevortexisformed(thebumponthegraph)andthenatthespecifiedHdesign, whereHdesigniscalculatedfromtheinvertofthedischargepipetothemaximumwaterlevelin thewell.A78%case(asmallerCEVinawellwithsameheight)withthesameHdesignisalso shown;herethebumpoccursataflowof78%ofQdesign. 8 Verification Report Mosbaek Figure 2-2 Graphic showing the general vortex brake effect on water outflow, with CEVs operating at 78% and 100% efficiency and water inflow to well larger than outflow though CEV (well is filling up). Graph provided by Mosbaek. Theoptimalsolution(100%),whereQbumpequalsQdesign,giveslessrestrictionatlowheadsal‐ lowingabetterflowduringnormaloperatingsituationsandtherebylessriskofblockingdown‐ stream. 2.2 Intended application Theintendedapplicationofthetechnologyforverificationisdefinedintermsofthematrixand thepurpose. 2.2.1 Matrix/matrices TheCEVisforstormwaterandcertaintypesofindustrialwastewaters.TheCEVisinstalledbe‐ forethecombinedsystem(withstormwaterandwastewater),andistherebyrestrictingthe amountofstormwaterintothecombinedsystem.Theverificationthereforeonlycoversthema‐ trixstormwater. 2.2.2 Purpose(s) Thepurposeofthetechnologyistostorestormwateratappropriateplacesbeforeenteringthe pipingsystemduringstormwaterevents.TheCEVisinstalledinwellsandbasinsdependingon thepipingnetwork. Verification Report Mosbaek 9 2.3 Verification parameters definition Thereisnoregulationtofulfilforthistechnology.Theinitialclaimsfromtheproposerare matchingtheclaimsfromothervendors.Noneedhasbeenfoundtoaddanyadditionalperfor‐ manceparameterstothoseinitiallyselectedbytheproposer. MosbaekhastwotypesofclaimsfortheirCEVs,bothdescribedbelow. 2.3.1 Flow at Hbump and Hdesign MosbaekhasspecifiedtheperformanceoffourselectedmodelsoftheCEVthroughperformance graphsandspecifiedthefollowingspecificclaims(fordetails,pleaseconsultAppendixB): 100%model: Qdesign±5%ismetatHbumpandHdesign X%model: X%ofQdesign±5%ismetatHbump Qdesign±5%ismetatHdesign SpecificvaluesforeachofthefourselectedCEVsarelistedinTable2‐1. Table 2-1 Specific performance claims from the proposer on Qbump and Qdesign. CEV model Qbump (l/s) Qdesign (l/s) CEV1.4l/[email protected]–100% 1.4±5% 1.4±5% CEV4.9l/[email protected]–100% 4.9±5% 4.9±5% CEV10.5l/[email protected]–78% 8.2±5% 10.5±5% CEV10.5l/[email protected]–100% 10.5±5% 10.5±5% 2.3.2 Flow reduction at Hdesign MosbaekhasfurtherspecifiedtheirclaimedreductionoftheflowatHdesigncomparedtoawell withnoflowregulator(equaltoaholeinastraightwall,withnoadditionalpiping). Mosbaekclaimsthefollowing: AMosbaekCEV100%modelcanreducetheflowbyafactorof4.25atQdesign PerformingtestswherethetestwellisfilleduptoHdesignwithnoCEVwillrequireveryhigh waterflow.ThereforthisclaimwillbeverifiedusingonlythesmallestofthefourCEVsusedin thetests.SpecificperformanceclaimislistedinTable2‐2. Table 2-2 Specific performance claims by the proposer on flow reduction compared to no CEV installed in well. CEV model Orifice diameter (Ø) Flow reduction factor at Hdesign (mm) CEV1.4l/[email protected]–100% DiametercorrespondingtoCEV 4.25 1.4l/[email protected]–100%outlet 10 Verification Report Mosbaek 3 Evaluation DetaileddescriptionsofthetestdesignandtestresultsarefoundintheTestPlan(AppendixC) andTestReport(AppendixD). 3.1 Calculation of verification parameters performance DetailedinformationonhowtocalculatetheverificationparametersareincludedintheSpecific VerificationProtocolinAppendixB. 3.2 Evaluation of test quality 3.2.1 Control data TestsystemcontrolincludedleakagetestandforCEV1.4l/s@H=1.00m–100%investigationof thevariationwasincludedfortestscarriedoutwithidenticalinletflows.Thevariationwasmin‐ imalandfarlessthan10%,whichmeans‐accordingtotheVerificationProtocol(AppendixB), section5.1.4‐thattriplicatetestswerenotneededfortheremainingCEVs. Testperformanceauditincludedreviewofcalibrationcertificatesforpressuretransducersand flowmeters.TheyarevalidandcanbefoundinAppendixtotheTestPlan(AppendixC).Inaddi‐ tioncalibrationtestswereperformedofpressuretransducersonbothinletandoutletside. Theoutflowcouldnotbemeasureddirectlyduetoairandcirculationintheoutlet.Instead measurementofheadintheoutlettankandoftheoverflowfromtheoutlettankwheremeas‐ ured.Thecalculationtwodifferentmethodswerelisted,seeAppendixBsection6.1Calculation ofperformanceparameters.Method2wasexpectedtomostprecise,whilemethodshouldbe usedforcontrol.Formethod1thetimeserieshadtobesubjectedtointensiveaveragingtoget readableresults.Acomparisonbetweentheresultsobtainedbymeansofmethod1andmethod 2foroneofthemodeltestshasbeenperformed.TheresultsareshownintheAppendixDofthe TestReport(AppendixDtothisreport).Itappearsthatthereis,apartfromthefluctuations,a goodagreementbetweenthetwomethods.However,sincethequalityoftheresultswithmeth‐ od2wasveryreliableand,whiletheresultsobtainedbymeansofmethod1aresubjecttolarge fluctuations,itwaschosentousemethod2only. 3.2.2 Audits Duringtestingandinternaltest,asystemauditwasperformedbyJesperFuchsfromDHIon29 September2014.TheverificationbodyETADenmark,representedbyPeterFritzel,performeda testsystemauditon2October2014. Conclusionsoftheinternalaudit(JesperFuchs): “Thetestisperformedinaccordancewiththetestplanandcarriedoutinasafemanner.Han‐ dlingandstorageofdataissafe”. ConclusionsoftheauditbyETADenmark(PeterFritzel): “Thereisconsistencywiththetestplanandhandlingofmeasurementsiscarriedoutinasafe manner”. ThefullauditreportscanbefoundinAppendixE. Verification Report Mosbaek 11 3.2.3 Deviations Therewerefourdeviationstothetestplan.ThedescriptionofthesecanbefoundinfullinAp‐ pendixCoftheTestReportincludedasAppendixEtothisreport.Asummaryofthedeviations isasfollows: 1. Insteadofestablishingthezerolevelintheinlettankforeachtest,acommonzeroscan wasperformedforeachCEVtype.Thiszeroscanwascarriedoutasanindividualtest insteadofanintegratedpartofeachtest. 2. ThelowestinflowinthetestswithCEV1.4l/[email protected]‐ flow,1.79l/sinsteadof1.9l/s.Withgoodaccuracytheinletflow,whichwillresultina waterlevelriseof0.5mm/s,canbefoundbyinterpolation.Suchinterpolationshows thataninflowofapproximately2.8l/swillresultinawaterlevelriseof0.5mm/s.The correspondingQbumpwouldbeapproximately1.28l/s(seeFigure3.8inTestReport (AppendixE)). 3. Forall100%CEVsthelargestinflowsgavelargerwaterlevelrisethan1.5mm/s,which wasthelargestwaterlevelrisetobetestedandapredefinedoperationalparameter. Duringthetestattemptwasmadetocomecloseto1.5mm/s,butduetothecharacter ofthecurve,withtherapidbump,itwasdifficultinadvancetoestimatethewaterlevel rise.Withgoodaccuracytheinletflows,whichwillresultinawaterlevelriseof 1.5mm/s,canbefoundbyinterpolation.Doingthisisitnicetohaveameasuredvalues ofwaterlevelriseisabove1.5mm/s.Interpolationsshowfor: 4. • CEV1.4l/[email protected] ofapproximately6.1l/s.ThecorrespondingQbumpwouldbeapproximately 1.44l/s(seeFigure3.8intheTestReport(AppendixE)) • CEV4.9l/[email protected] ofapproximately9.2l/s.ThecorrespondingQbumpwouldbeapproximately 4.93l/s(seeFigure3.12inTestReport(AppendixE)) • CEV10.5l/[email protected]‐ flowofapproximately13.9l/s.ThecorrespondingQbumpwouldbeapproxi‐ mately10.4l/s(seeFigure3.16inTestReport(AppendixE)) Thetestwiththeorificewascarriedoutwithalargerinflowthanpredefined.Thiswas done,astheQ–Hrelationforanorificeisindependentofthewaterlevelincrease, whichalsoisdocumentedbycomparingwiththetheoreticalrelation,seeFigure3.23in theTestReport(AppendixE). 3.3 Verification results 3.3.1 Performance parameters Theverifiedperformanceforthetwoparametersislistedbelow.Theresultsaretransferreddi‐ rectlyfromtheTestReport(AppendixE). 3.3.2 Flow at Hbump and Hdesign SpecificperformanceforeachofthefourselectedCEVsislistedinTable3‐1andTable3‐2. Table 3-1 Verified performance on Qbump. +) Be aware that the results of Qbump are uniquely influenced by Qinflow, see later.*) For this flow the water level rise was only 0.19 mm/s, while the operational requirement was >0.5 mm/s, this is an explanation for the deviation from the expected. CEV model 12 Inflow in test Qbump Deviation from model (l/s) (l/s) characteristics (%) Verification Report Mosbaek Mean+ Range CEV1.4l/[email protected]–100% 1.79to6.31 1.34 1.22*–1.45 CEV4.9l/[email protected]–100% 5.89to9.99 4.74 4.50–5.04 ‐4.3(‐13*–3.6) ‐3.3(‐8.2–2.9) CEV10.5l/[email protected]–78% 8.60to12.97 8.17 7.57–8.74 ‐0.2(‐7.6–6.7) CEV10.5l/[email protected]–100% 11.32to15.24 10.18 9.75–10.67 ‐3.0(‐7.1–1.6) Table 3-2 Verified performance on Qdesign. *) based on two tests only. CEV model Inflow in test Qdesign Deviation from model (l/s) (l/s) characteristics (%) Mean Range CEV1.4l/[email protected]–100% 1.79to6.31 1.43 1.42–1.45 2.1(1.4–3.6) CEV4.9l/[email protected]–100% 5.89to9.99 4.78 4‐76–4.80 ‐2.4(‐2.9–(‐2.0)) CEV10.5l/[email protected]–78% 8.60to12.97 10.11 10.09–10.12* ‐3.7(‐3.9–(‐3.6)) CEV10.5l/[email protected]–100% 11.32to15.24 10.56 10.55–10.56 0.6(0.5–0.6) 13.72 6.36 N/A N/A Orifice PleasebeawarethatthereisauniqueinfluenceofQbumbbyQinflow,seeFigure3‐1. 12 Qbump (l/s) 10 8 CEV 1.4 ‐ 100 % 6 CEV 4.9 ‐ 100 % CEV 10.5 ‐ 78 % 4 CEV 10.5 ‐ 100 % 2 0 0 5 10 15 20 Qinflow (l/s) Figure 3-1 3.3.3 Correlation between Qinflow and Qbump given for all tested CEVs. Flow reduction at Hdesign PerformancecomparedtoawellwithnoflowregulatorislistedinTable3‐3. Table 3-3 Verified performance on flow reduction compared to no CEV installed in well. CEV model Orifice diameter (Ø) Flow reduction factor at Hdesign (mm) CEV1.4l/[email protected]–100% DiametercorrespondingtoCEV 4.45 1.4l/[email protected]–100%outlet MosbaekCEV1.4l/[email protected]‐100%isverifiedtoreducetheflowbyafactorof4.45atQdesign. 3.3.4 Operational parameters Duringoperationthefollowingparametersweremeasured: Verification Report Mosbaek 13 Inflow(l/s) Waterlevel/pressureinregulatorwell(mH2O/Pa) Waterlevel/pressureintheoutlettank(mH2O/Pa) Outletfromtheoutlettank(l/s) ThesedatahavecreatedcurvesshownintheTestReport,section3Testresults(AppendixE). Duringthetesttheaveragewaterlevelmustbewithin0.5and1.5mm/s,sincethisiscommon valuesinrunoffsystems. 3.3.5 Additional parameters 3.3.5.1 User manual Theverificationcriterionfortheusermanualisthatthemanualdescribestheuseoftheequip‐ mentadequatelyandisunderstandableforthetypicaltestcoordinatorandtesttechnician.This criterionwasbasedonanumberofspecificpointsofimportance,seeTable3‐4fortheparame‐ terstobeincluded. Adescriptioniscompleteifallessentialstepsaredescribed,iftheyareillustratedbyafigureor aphoto,whererelevant,andifthedescriptionsareunderstandablewithoutreferencetoother guidance. Mosbaekhasprovided: CentrifugalvalveCE/Vwetmounted(Generalinformation) InstallationInstruction.MosbaekFlowRegulators.TypeCEV‐KPS–Sealing MaintenanceandInspectionInstructions.MosbaekFlowRegulators.TypeCEV‐KPS– Sealing Table 3-4 Evaluation of user manual. Parameter Product Principleofoperation Intendeduse Performanceexpected Limitations Preparations Unpacking Transport Assembly Installation Functiontest Operation Stepsofoperation Pointsofcaution Accessories Maintenance Troubleshooting Safety Chemicals Power 14 Complete description Summary description No description Not relevant √ √ √ √ √ √ √ √ √ √ √ √ √ √ √ √ Verification Report Mosbaek 3.3.5.2 Required resources Thecapitalinvestmentandtheresourcesforoperationandmaintenancecouldbeseenasthe sustainabilityoftheproductandwillbeitemizedbaseduponadetermineddesign[3],seeTable 3‐5fortheitemsthatwillbeincluded. ThedesignbasisconsistsofoneinstalledCEVinanexistingwell.Allcostitemsrelevantforthe MosbaekCEVsarelisted.Notethattheactualcostforeachitemisnotcompiledandreported. Verification Report Mosbaek 15 Table 3-5 List of capital cost items and operation and maintenance cost items per product unit. Item type Capital Sitepreparation Buildingsandland Equipment Utilityconnections Installation Startup/training Permits Operationandmaintenance Materials,includingchemicals Utilities,includingwaterandenergy Labor Wastemanagement Permitcompliance Item Number/duration None None TheCEVandmountingfromMosbaek Tighteningmaterialandbolts Rainwatersewersystemandwells Tobeinstalledbysewercontractor None None None Regularinspectionanddrainageof sump/sandcatcher Sump/sand None 1 1 1day 1day AsforotherwellswithnoCEV Evaluationofthefollowingsubjectshasbeenperformedbasedoninformationgainedfrom Mosbaek: • Resourcesusedduringproductionoftheequipmentinthetechnology TheCEVandtheirmountingareproducedfromstainlesssteel,grade1.4404/316L. Forthetestedproductsincl.mountingtheweightsare: CEV1.4l/[email protected]%:5.9kg CEV4.9l/[email protected]%:11.5kg CEV10.5l/[email protected]%:21.5kg CEV10.5l/[email protected]%:25.1kg 80%ofthesteelontheworldmarketisreusedmaterial.Themainpartofthesteelin DenmarkisimportedfromotherEuropeancountries,whiletherestismainlyfrom Taiwan,IndiaandChina.Dependingonthedistancethefreightisbyshiporbytruck. FortheEuropeanmarkedthetransportismainlybytruck.Mosbaekpurchasessteel fromDanishdistributorssuchas:DacapoStainless,Lemvigh‐Müller,SanistålandDam‐ stahl. Theaverageenergyconsumptionforthefinalproductis4.1kWh/kg. • Longevityoftheequipment Theregulatorsaredesignedtolastaslongastheothercomponentsinasewagesystem, approx.50years.Aregulatorwillnotneedtobereplacedunlessinspectionshowscon‐ siderablewearandtear. • Robustness/vulnerabilitytochangingconditionsofuseormaintenance Theregulatorisrobusttochangesintemperatureandenvironment.Asteeperslopeon thecharacteristiccurvegivesrobustnesstowardschangesinpressurehead.Largerori‐ ficeopening,comparedtoothercompetingsolutions,giverobustnesswithrespectto clogging.Maintenanceschemeshouldbeadjustedaccordingtochangesincondition concerningthequalityofthewater.Maintenanceisavisualcheckoftheconditionofthe regulatorandtoremovesignsofclogging. 16 Verification Report Mosbaek Reusability,recyclability(fullyorpartly)andendoflifedecommissioninganddisposal • Aregulatorcanbereusedinanotherlocationwithsimilarconditionsoradjustedtofit otherconditions.Ifreuseisnotpossible,theregulatorcanbesoldasscrapandmolten intonewsteel.Itis100%isrecyclable. 3.3.5.3 Occupational health and environmental impact Therisksforoccupationalhealthandfortheenvironmentassociatedwiththeuseoftheprod‐ uctswillbeidentified.Alistofchemicalsclassifiedastoxic(T)orverytoxic(Tx)forhuman healthand/orenvironmentallyhazardous(N)(inaccordancewiththedirectiveonclassification ofdangeroussubstances[4])willbecompiled.Thetighteningmaterialusedforinstallationis chosenbythesewercontractor.Themainlyusedmaterialissealanttapeorwaterproofsilicone, whicharebothunclassified. Alloperationsinwellsaresubjecttosafetyrisk,andstandardsafetyprecautionshavetobetak‐ enaccordingly. 3.4 Recommendation for the Statement of Verification 3.4.1 Technology description Thetechnologyverifiedistheverticalcentrifugalflowregulator,CEV(CEntrifugalVertical)from Mosbaek.Theflowregulatortechnologyforextremerainfalleventsisbasedonquicklyreaching themaximumdischargeflow,whereitcreatesavortexmakingitstayatorbelowthisdischarge flowwhiletheremainingwaterisstoredinthewell.AschematicviewoftheCEVwithinflowin thebottomisshowninFigure3‐2a. Figure 3-2 A) Sketch of CEV flow regulator installed in well. B) Graphic showing the general vortex brake effect on water outflow, with CEVs operating at 78% and 100% efficiency and water inflow to well larger than outflow though CEV (well is filling up). Both provided by Mosbaek. Figure3‐2bshowstheflowthroughaCEV.Witha100%model,themaximumoutlet(Qdesign)is mettwice,firstwherethevortexisformed(thebumponthegraph)andthenatthespecified Hdesign,whereHdesigniscalculatedfromtheinvertofthedischargepipetothemaximumwater levelinthewell.A78%modelisalsoshown;herethebumpoccursataflowof78%ofQdesign. MosbaekhasselectedfourmodelstorepresenttheirCEV‐series.Themodelsare; Verification Report Mosbaek CEV1.4l/[email protected]–100% CEV4.9l/[email protected]–100% CEV10.5l/[email protected]–78% 17 CEV10.5l/[email protected]–100% 3.4.2 Application 3.4.2.1 Matrix TheCEVisinstalledbeforethecombinedsystem(withstormwaterandwastewater)andisre‐ strictingstormwaterinflowtothecombinedsystem.Theverificationcoversstormwater. 3.4.2.2 Purpose Thepurposeofthetechnologyistostorestormwateratappropriateplacesbeforeenteringthe pipingsystemduringstormwaterevents.TheCEVisinstalledinwellsandbasinsdependingon thepipingnetwork. 3.4.2.3 Conditions of operation and use Maintenanceisneededregularlyasavisualcheckoftheconditionoftheregulatorandtore‐ movesignsofclogging. 3.4.2.4 Verification parameters definition summary Twotypesofparametershavebeenverified: 3.4.3 1. Outflow(l/s)atHbumpandHdesign 2. FlowreductionatHdesign Test and analysis design Thetestwasdesignedforthisverification.Noexistingdatahavebeenincluded. 3.4.3.1 Laboratory or field conditions Thetestwasperformedatatestset‐upatMosbaek’spremisesinKoege,Denmark,seeFigure 3‐3. ThefigureissuggestedtobeanappendixtotheStatementofVerification. 18 Verification Report Mosbaek Figure 3-3 Sketch of test set-up. Theset‐upconsistsofawell(regulatorwell)placedonabase;theCEVregulatorismountedin thiswell.Theregulatorwellisindirectconnectionwithalargediametertank(inlettank), throughapipe,positionedjustoppositetheCEVoutlet.Thewaterlevelsintheregulatorwell andtheinlettankareaccordinglyidentical.Thisset‐upisestablishedinordertosecurethatthe Verification Report Mosbaek 19 increaseofthewaterlevelintheregulatorwellcanbecontrolledandlimitedstillwithareason‐ ablehighflowratetothewell.TheoutletconnectiongoesthroughtheCEVintheregulatorwell totheoutlettank.Apressuretransducerismountedinthebaseoftheregulatorwell.Onthe baseoftheregulatorwell,aPlexiglasriserismountedinordertofollowthewaterlevelinthe wellduringtesting. Theflowtotheinlettankisfedatthetopofthetankthroughapipeplacedinternallyinthetank bymeansofapump,whichispumpingwaterfromafeedingtank.Theflowfromthefeeding tanktotheinlettankismeasuredbymeansoftheflowmeter.Thewaterlevelinthefeeding tankiskeptconstantbypumpingwaterfromacentralreservoirtothefeedingtank;anoverflow weirensuresthatthewaterlevelinthistankiskeptalmostconstant.Inthisway,itispossible tokeepanalmostconstantpressureheadatthepumpandthusanalmostconstantflow. Fromtheregulatorwell,thewaterflowsthroughtheCEVtotheoutlettank.Theoutlettankhas apressuretransducermonitoringthewaterlevelinthistank.Theoutletflowfromtheoutlet tankismeasuredbymeansofaflowmeter. 3.4.3.2 Matrix composition Theusedwaterisfromanoutdoorreservoir. 3.4.3.3 Test and analysis parameters Thefollowingtest‐runswereperformed. CEV model Flow 1 Flow 2 Flow 3 Flow 4 Flow 4’ Flow 4’’ CEV1.4l/[email protected]–100% 1.79 3.12 4.80 6.31 6.18 6.25 CEV4.9l/[email protected]–100% 5.89 6.52 8.20 9.99 CEV10.5l/[email protected]–78% 8.60 9.77 11.40 12.97 CEV10.5l/[email protected]–100% 11.32 12.07 13.75 15.24 Orifice 13.72 TestsoftheperformanceatHbumpandHdesignaremarkedinlightorange. TestoftheflowreductionatHdesignisdonebycomparingtheresultsfromthehatchedtestruns. TherepetitionofCEV1.4l/[email protected]–100%(darkbluemarking)isdonetoseeifthereismore than10%variationbetweenrunswiththesameflow.Therewasverylimitedvariation;there‐ foretherepetitionwasnotdoneforothertestruns. 3.4.3.4 Test and analysis methods summary TheinflowandoutflowfromtheCEVwasmeasuredbytheuseofflowmetersandpressure transducersasdescribedabove. 3.4.3.5 Parameters measured Inflow(l/s) Waterlevel/pressureinregulatorwell(mH2O/Pa) Waterlevel/pressureintheoutlettank(mH2O/Pa) Outletfromtheoutlettank(l/s) OutflowfromCEViscalculatedbyusingthefollowingequation: 20 ∆ 1000 ∆ Verification Report Mosbaek Qoutflow:FlowoutofCEV(l/s) Qoverflow:Overflowfromtheoutlettank(l/s) Aout:Surfaceareaintheoutlettank+riser(m2) Hout:Pressureheadintheoutlettank(mH2O) Δt:TimeforchangingHoutwithΔHout(s) 3.4.4 Verification results 3.4.4.1 Performance parameters TheresultsoftheverificationwithregardstoflowatHbump(Qbump)andatHdesign(Qdesign)are listedinthetable. Basedontheresultsfromatestwith1.4l/[email protected]‐100%andacorrespondingorifice,itcan bestatedthatMosbaekCEVsareverifiedtoreducetheflowbyafactorof4.45atQdesign. CEV model Qbump Qdesign Mean and range Deviation from Mean and range Deviation from (l/s) model charac- (l/s) model character- 1.34(1.22*–1.45) ‐4.3(‐13*–3.6) 1.43(1.42–1.45) 2.1(1.4–3.6) 4.78(4.76–4.80) ‐2.4(‐2.9–(‐2.0)) + teristics (%) CEV1.4l/[email protected]–100% istics (%) CEV4.9l/[email protected]–100% 4.74(4.50–5.04) ‐3.3(‐8.2–2.9) CEV10.5l/[email protected]–78% 8.17(7.57–8.74) ‐0.2(‐7.6–6.7) 10.11(10.09–10.12)# ‐3.7(‐3.9–(‐3.6)) CEV10.5l/[email protected]–100% 10.18(9.75–10.67) ‐3.0(‐7.1–1.6) 10.56(10.55–10.56) 0.6(0.5–0.6) N/A N/A 6.36 N/A Orifice +) Be aware that the results of Qbump are uniquely influenced by Qinflow *) For this flow the water level rise was only 0.19 mm/s, while the operational requirement was >0.5 mm/s, this is an explanation for the deviation from the expected. #) 3.4.4.2 Based on two tests only. Operational parameters Noadditionaloperationalparametersthantheperformanceparametersweremeasured. ThissubchapterwillthereforenotbeincludedintheStatementofVerification. 3.4.4.3 Environmental parameters Noadditionalenvironmentalparametersthantheperformanceparametersweremeasured. ThissubchapterwillthereforenotbeincludedintheStatementofVerification. 3.4.4.4 Additional parameters Theusermanualandotherdescriptionsweredescribedascomplete. ApplicationoftheCEVdoesnotgiverisetoanyspecialriskorcontacttohazardoussubstances. Thoughinstallationinthewellissubjecttosafetyriskasalloperationsinwells,andstandard safetyprecautionsthereforehavetobetakenaccordingly. TheCEVsareproducedofstainlesssteel.Today80%ofthestainlesssteelonthemarkedisre‐ cycled.ItisimportedfromEuropeandcertainplacesinAsia.ThetestedCEVscontainfrom6‐25 kgstainlesssteel,and4.1kWh/kgsteelisusedintheproduction.TheCEVsarereusableor100 %recyclable.Theyhavealifetimeof50years.TheaboveinformationisobtainedfromMosbaek A/S. Verification Report Mosbaek 21 3.4.5 Additional information TheCEVisdesignedtobeeffectivewithinaflowrangeuntilacertainamountofwaterisstored intheconnectedwellorbasin.Thismeansthatifastormwatereventexceedsthedesigncrite‐ ria,thewellorbasinwheretheCEVislocatedwillfloatover.Thissituationisnotincludedinthe verification. TheCEVisdesignedwiththelargestpossibleopeningatthegivenhydraulicsituation.TheCEV ismostofteninstalledasdetachableandifrequired,obstaclescanberemovedinthisway.Atlo‐ cationswithmanyobstaclesinthewater,theCEVcanbeequippedwithagrid.Alltestsarecar‐ riedoutwithwaterwithoutobstacles. Industrialwastewaterandbackwater(backwardsflowthroughtheCEV)arenotincluded,nor arerapidchangesinheadandflow.Suchchangesmayoccurinspecialsituations(e.g.ifpumps arestartedorstopped). Characteristicsobtainedfromtheexperimentsareonly100%validforapplicationswhichhave fullgeometricsimilaritywiththesetupdefinedinFigure3‐2a.Forapplicationswithgeometries whichdifferfromthisfigure,theactualcharacteristiccandeviatefromthecharacteristicfound fromtheverificationexperiment. 3.4.6 Quality assurance and deviations Priortotestingwasperformedleakagetestandreviewofcalibrationcertificatesforpressure transducersandflowmeters.Inaddition,calibrationtestsofpressuretransducerswereper‐ formedonbothinletandoutletside.Duringtesting,internalandexternaltestsystemaudits wereperformedbyDHIandETADanmark. 22 Verification Report Mosbaek 4 Quality assurance Thepersonnelandexpertsresponsibleforqualityassuranceaswellasthedifferentqualityas‐ surancetaskscanbeseeninTable4‐1.AllrelevantreviewsarepreparedusingtheDANETVre‐ viewreporttemplate[5].Auditduringtestinghasbeenperformed. Table 4-1 QA plan for the verification Internal expert Initials Verification body Proposer External experts TL/IW MJK MTA PF Mosbaek Review Reviewandapprove Review Testplan Review Approve Reviewandapprove Testsystemattestsite Audit Testreport Review Review Review Review Review Acceptance Review Tasks Specificverificationprotocol Verificationreport StatementofVerification InternalreviewwasconductedbyMortenJustKjølby(MJK)andatestsystemauditwascon‐ ductedfollowinggeneralauditproceduresbycertifiedauditorPeterFritzel(PF). OnlytheverificationprotocolandverificationreportrequireexternalreviewaccordingtoEU ETVpilotprogrammeGVP[1].Fortheverificationprotocol,externalreviewwasperformedby TorbenLarsen(TL),whiletheverificationreportandStatementofVerificationhavebeenre‐ viewedbyIanWalker(IW). Theverificationbodyhasreviewedandapprovedthetestplanandreviewedthetestreport.The reviewswereperformedbyMetteTjenerAndersson(MTA),whiletheapprovalwasgivenby PeterFritzel(PF). Verification Report Mosbaek 23 24 Verification Report Mosbaek 5 References 1. EUEnvironmentalTechnologyVerificationpilotprogramme.GeneralVerificationProtocol. Version1.1–July7th,2014. ETADanmark.ETV–Verifikation.I30.11,EnvironmentalTechnologyVerification.20‐11‐2013. Gavaskar,A.andCumming,L.:CostEvaluationStrategiesforTechnologiesTestedunderthe EnvironmentalTechnologyVerificationProgram.2001.Battelle. EuropeanCommission:CommissionDirectiveonclassification,packagingandlabellingof dangeroussubstances.2001/59/EC.2001. DANETVTestCentreQualityManual,2013.08.13 2. 3. 4. 5. Verification Report Mosbaek 25 26 Verification Report Mosbaek A P P E N D I C E S Verification Report Mosbaek Verification Report Mosbaek A P P E N D I X A Terms and definitions Verification Report Mosbaek Verification Report Mosbaek ThetermsanddefinitionsusedbytheverificationbodyarederivedfromtheEUETVGeneralVerification Protocol,ISO9001andISO17020. Term DANETV Comments on the DANETV approach Accreditation MeaningasassignedtoitbyRegulation(EC)No ECNo765/2008isonsettingouttherequire‐ 765/2008 mentsforaccreditationandmarketsurveil‐ lancerelatingtothemarketingofproducts Othereffectsthatwillbedescribedbutare None Additionalparameter consideredsecondary Amendment Isachangetoaspecificverificationprotocolor None atestplandonebeforetheverificationortest stepisperformed Application DANETV Theuseofaproductspecifiedwithrespectto Theapplicationmustbedefinedwithapreci‐ matrix,purpose(targetandeffect)andlimita‐ tions sionthatallowstheuserofaproductverifica‐ Danishcentreforverificationofenvironmental None tiontojudgewhetherhisneedsarecomparable totheverificationconditions technologies Deviation Isachangetoaspecificverificationprotocolor None atestplandoneduringtheverificationortest stepperformance Evaluation Evaluationoftestdataforatechnologyproduct None forperformanceanddataquality Experts Independentpersonsqualifiedonatechnology Theseexpertsmaybetechnicalexperts,QA inverification expertsforotherETVsystemsorregulatory experts Generalverificationprotocol Descriptionoftheprinciplesandgeneralpro‐ None (GVP) ceduretobefollowedbytheEUETVpilotpro‐ grammewhenverifyinganindividualenvi‐ ronmentaltechnology. Matrix Operationalparameter Thetypeofmaterialthatthetechnologyis Matricescouldbesoil,drinkingwater,ground intendedfor water,degreasingbath,exhaustgascondensate etc. Measurableparametersthatdefinetheapplica‐ None tionandtheverificationandtestconditions. Operationalparameterscouldbeproduction capacity,concentrationsofnon‐targetcom‐ poundsinmatrixetc. (Initial)performanceclaim Proposerclaimedtechnicalspecificationsof Theproposerclaimsshallbeincludedinthe product.Shallstatetheconditionsofuseunder ETVproposal.Theinitialclaimscanbedevel‐ opedaspartofthequickscan. whichtheclaimisapplicableandmentionany relevantassumptionmade Verification Report Mosbaek A-1 Term DANETV Comments on the DANETV approach Performanceparameters(re‐ Asetofquantifiedtechnicalspecificationsrep‐ Theperformanceparametersmustbeestab‐ visedperformanceclaims) resentativeofthetechnicalperformanceand lishedconsideringtheapplication(s)ofthe potentialenvironmentalimpactsofatechnolo‐ product,therequirementsofsociety(legisla‐ gyinaspecifiedapplicationandunderspeci‐ tiveregulations),customers(needs)andpro‐ poserinitialperformanceclaims fiedconditionsoftestingoruse(operational parameters). Procedure Proposer Detaileddescriptionoftheuseofastandardor Theprocedurespecifiesimplementingastand‐ amethodwithinonebody ardoramethodintermsofe.g.:equipment used Anylegalentityornatural,whichcanbethe Canbevendororproducer technologymanufactureroranauthorised representativeofthetechnologymanufacturer. Ifthetechnologymanufacturesconcerned agree,theproposercanbeanotherstakeholder undertakingaspecificverificationprogramme involvingseveraltechnologies. Purpose (Specific)verificationprotocol Themeasurablepropertythatisaffectedbythe Thepurposecouldbereductionofnitratecon‐ productandhowitisaffected. centration,separationofvolatileorganiccom‐ pounds,reductionofenergyuse(MW/kg)etc. Protocoldescribingthespecificverificationofa None technologyasdevelopedapplyingtheprinci‐ plesandproceduresoftheEUGVPandthe qualitymanualoftheverificationbody. Standard Genericdocumentestablishedbyconsensus None andapprovedbyarecognisedstandardization bodythatprovidesrules,guidelinesorcharac‐ teristicsfortestsoranalysis Test/testing Determinationoftheperformanceofaproduct None formeasurement/parametersdefinedforthe application Testperformanceaudit Quantitativeevaluationofameasurementsys‐ E.g.evaluationoflaboratorycontroldatafor temasusedinaspecifictest. relevantperiod(precisionunderrepeatability conditions,trueness),evaluationofdatafrom laboratoryparticipationinproficiencytestand controlofcalibrationofonlinemeasurement devises. Testsystemaudit Testsystemcontrol Qualitativeon‐siteevaluationoftest,sampling E.g.evaluationofthetestingdoneagainstthe and/ormeasurementsystemsassociatedwith aspecifictest. requirementsofthespecificverificationproto‐ Controlofthetestsystemasusedinaspecific E.g.testofstocksolutions,evaluationofstabil‐ test. ityofoperationaland/oron‐lineanalytical col,thetestplanandthequalitymanualofthe testbody. equipment,testofblanksandreferencetech‐ A-2 Verification Report Mosbaek Term DANETV Comments on the DANETV approach nologytests. Verification Provisionofobjectiveevidencethatthetech‐ None nicaldesignofagivenenvironmentaltechnolo‐ gyensuresthefulfilmentofagivenperfor‐ manceclaiminaspecifiedapplication,taking anymeasurementuncertaintyandrelevant assumptionsintoconsideration. Verification Report Mosbaek A-3 A-4 Verification Report Mosbaek A P P E N D I X B Specific Verification Protocol Verification Report Mosbaek Verification Report Mosbaek A P P E N D I X C Test Plan Verification Report Mosbaek Verification Report Mosbaek A P P E N D I X D Test Report Verification Report Mosbaek Verification Report Mosbaek A P P E N D I X E Audit reports Verification Report Mosbaek Verification Report Mosbaek


![Expanding Grain Model [EGM v1.0] - Illinois Institute of Technology](http://vs1.manualzilla.com/store/data/005895685_1-bff858b86f7bc344864531d7e5f7cd87-150x150.png)