1
KINET User’s Manual
3
3. OVERVIEW OF INSTRUCTIONS TO USERS
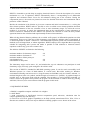
KINET consists of two files, KINET.EXE and KINET.BAN. These must be in the same directory on
floppy or hard disk. During operation, a 60 Kb temporary file will be created on disk; make sure the disk
has enough free space and it is addressable for writing.
To run KINET, simply type KINET and press ENTER.
No command-line parameters are necessary. If the computer has a Hercules video card, Microsoft's
driver MSHERC.COM should be installed before KINET is run, otherwise, it will be impossible to use
the graphics mode. When KINET comes up, the "KINET" logo is shown. Continue by pressing any key.
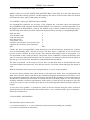
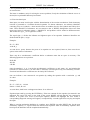
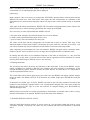
The following menu will be presented. Choose the desired action by entering its corresponding number.
Enter new data
View & edit the data
Load data from a file
Save data in a file
View kinetic curves
Calculate concentrations at one point in time
Optimize rate constants (inverse problem)
Quit
1
2
3
4
5
6
7
ESC
Usually, just after accessing KINET, initial data needs to be entered using the keyboard (the 1st menu
item), or downloading from a file (the 3rd item). The latter choice is applicable if data saved from a
previous session is desired. Previous versions of the program used binary format for storing data, so it
was impossible to edit it with text editors. The present version of KINET recognizes both binary (files
with .kin extension) and text formats (files with .txt extension). To familiarize yourself with the syntax of
data storage, you can just view attached files of the demonstrational problems.
The data, once entered, can be saved in a file for later use (4th menu item) or downloaded from a file,
viewed and edited (2nd menu item). New data may also be viewed and edited employing this option as
well.
With the initial data entered, proceed to solving the direct, or reverse, kinetic problem.
To solve the direct problem select either the 5th or 6th menu item. These items are independent and
differ only in that the 5th item will initiate the calculation and graph representation of the kinetic curves
up to the stated reaction time; while the 6th selection will initiate the calculation of the concentrations of
all substances at different given moments of reaction time, the result being output to a file. This selection
facilitates obtaining a numerical representation of the results as a table that can be printed out. This file
can also be used as a source of future input data for some standard graph software packages (MS Excel,
Origin).
To solve the reverse problem - to optimize the values of the rate constants using the criteria of the best
agreement between the experimental data and the kinetic curves calculated with a given mechanism choose the 7th menu item.
4. DATA INPUT AND EDITING
The initial data consist of three parts:
a. a reaction mechanism, i.e., a set of elementary reactions and corresponding rate constants;
b. the initial concentrations of substances;