1
L1 User Manual
LMI Technologies Inc.
th
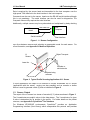
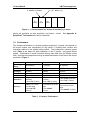
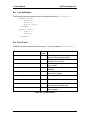
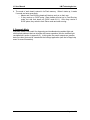
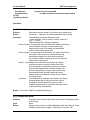
Yk = (k * deltay) + y0
k position in stream
Xk-1
value
Xk
value
Xk+1
value
Figure 3. L1 Sensor output is a stream of encoded (x,y) values
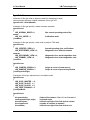
simple call interfaces for data acquisition and sensor
DynaVision® Taxi Interface for further information.
1.4
control.
See Appendix A:
Performance
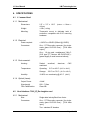
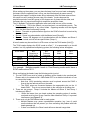
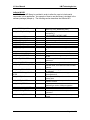
The ultimate performance of a scanning system employing L1 sensor s will depend on
the actual number and configuration of the sensor s, including their location and
orientation relative to the objects being profiled. The performance numbers quoted
here (Table 1) are based on static calibration of the L1 sensor using good diffuse
targets. Performance in actual industrial settings may differ from the results quoted
here. Note that the measurement range is determined relative to the face of the sensor
as shown in Figure 4.
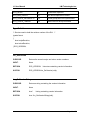
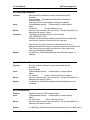
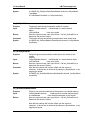
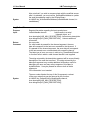
L1-16-20-24 (125)
Operating
Range
Standoff
Field of View
(at range)
Field of View
Scan Rate
Resolution
Accuracy
L1-16-6-15
L1-16-20-15
20" (508mm)
6" (152mm)
20" (508mm)
16" (406mm)
24" (610mm) @ 36"
(914mm)
36°
60 profiles/sec
X-axis: 0.010"
(0.25mm)
Y-axis: 1/8" (3.2mm)
X-axis: ± 0.020 0.060" (0.5-1.5mm)
over the range
Y-axis: ±0.125"
(3.2mm)
16" (406mm)
15" (381mm) @ 22"
(558mm)
39°
60 profiles/sec
X-axis: 0.005"
(0.15mm)
Y-axis: 1/16" (1.6mm)
X-axis: ±0.010 - 0.025"
(0.25-0.65mm) over the
range
Y-axis: ±0.063"
(1.6mm)
16" (406mm)
15" (381mm) @ 36"
(914mm)
22°
60 profiles/sec
X-axis: 0.010" (0.25mm)
Y-axis: 1/16" (1.6mm)
X-axis: ±0.015 - 0.050"
(0.5-1.5mm) over the
range
Y-axis: ±0.063" (1.6mm)
Table 1. L1 sensor Performance
Page 8 of 71