1
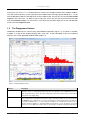
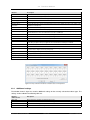
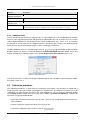
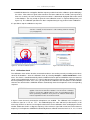
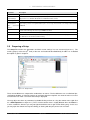
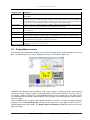
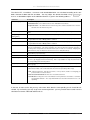
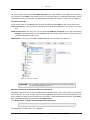
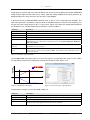
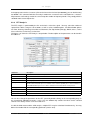
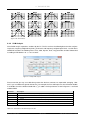
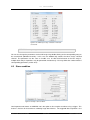
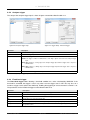
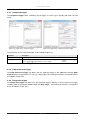
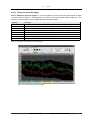
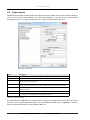
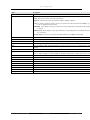
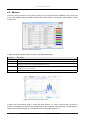
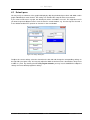
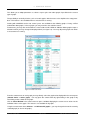
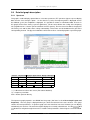
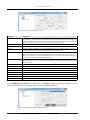
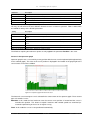
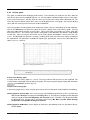
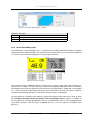
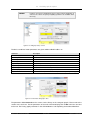
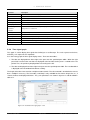
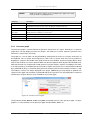
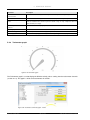
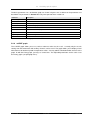
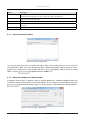
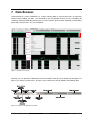
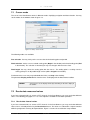
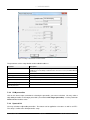
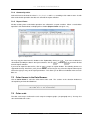
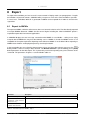
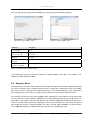
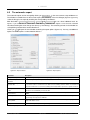
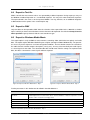
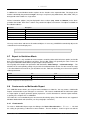
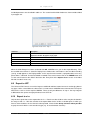
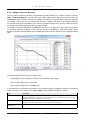
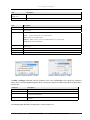
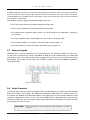
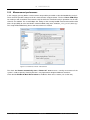
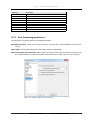
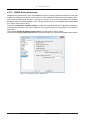
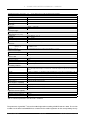
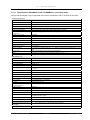
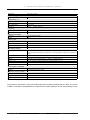
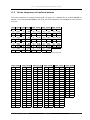
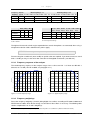
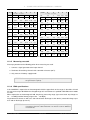
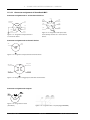
5.4
NOTICE!
Detailed graph description
Similar to the history graph a cursor is available for this graph in the replay
mode (for details see paragraph 5.4.2).
Parameter
Description
Axis unit
Always the same for time signals (time).
Division
Enter the number of grid divisions. The main grid dividers (lines) are emphasised in most cases and
are labelled at the axis. The lines of the sub-grid have no labels at the axis.
Time
Enter the length of the time frame in seconds.
Enable scroll for
time signal
Check this box to display the data in a scrolling pane (time frame > 2 s). If unchecked, the data are
displayed in blocks similarly to an oscilloscope.
Main grid
Click here to adjust the main grid settings.
Sub-grid
Click here to adjust the main sub-grid settings.
Font
Click here to adjust the font settings for the x-axis.
Table 5.17: Parameters time signal - x-axis
5.4.7
Pure tone graph
The Pure tone graph is used to examine the presence of pure tones in a signal. Basically it is a spectrum
graph which can only display one trace for analysis: the minimum 1/3 octave spectrum (spectrum of the
minimum 1/3 octave levels over time).
The graph has a cursor which can be positioned by clicking with the mouse or using the arrow keys on
the keyboard. The 1/3 octave centre frequency as well as the 1/3 octave value at the cursor position are
displayed as a figure in the header of the graph and in the value window. A pure tone graph detects which
levels of the minimum 1/3 octave spectrum differ from their two adjacent levels by more than defined value.
After that the levels are compared to a band spectrum using the loudness contours (according to ISO 226).
If no value (in phones) in the band spectrum exceeds or equals the contour, the 1/3 octave band is indicated
by a yellow/red flashing 1/3 octave bar during the measurement; after the measurement a red bar is used.
The loudness contours are always displayed in the graph. Additionally you may display an optional FFT
spectrum in the graph. No calculation is performed with the FFT spectrum; it is only displayed as a reference
and therefore not given above as trace available in a pure tone graph.
Figure 5.18: Parameters Pure Tone graph
The parameters below General, x-axis and y-axis correspond to those of the spectrum graph, see paragraph 5.4.1. The parameters for the pure tone graph are described in table 5.18.
SINUS Messtechnik GmbH
69 of 132
Manual SAMURAI