1
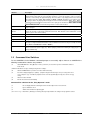
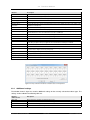
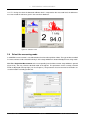
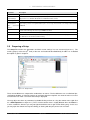
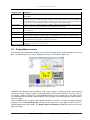
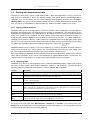
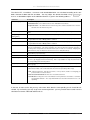
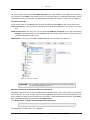
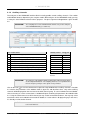
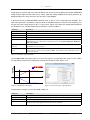
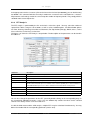
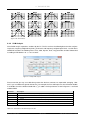
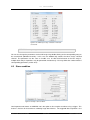
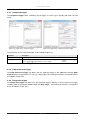
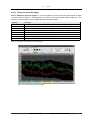
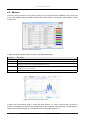
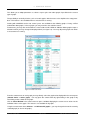
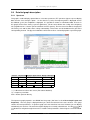
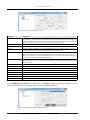
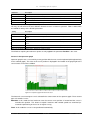
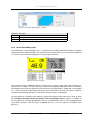
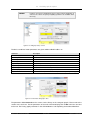
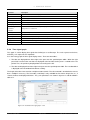
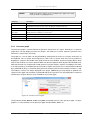
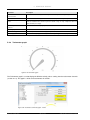
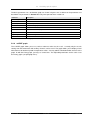
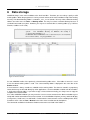
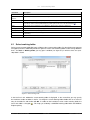
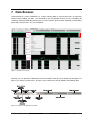
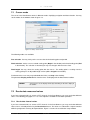
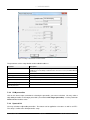
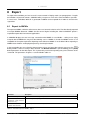
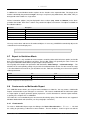
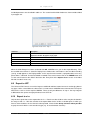
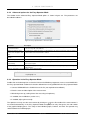
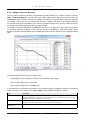
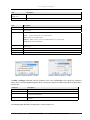
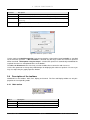
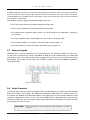
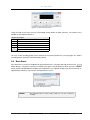
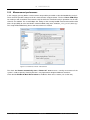
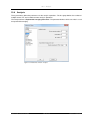
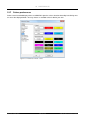
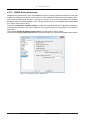
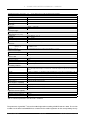
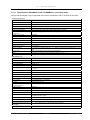
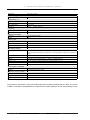
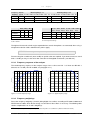
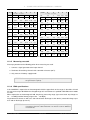
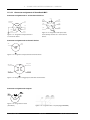
5.4
Detailed graph description
The basic parameters for a tachometer graph are shown in figure 5.20. In table 5.19 the parameters are
described. The parameters in General basically correspond to those in table 5.6.
Parameter
Description
Result displayed
Select the source channel for the values.
Scale Start
Enter the start value for the scale division.
Scale Stop
Enter the stop value for the scale division.
Show scale as RPM x 100 Set scale change by the factor 100.
Scale font
Select the font of the scale labels.
Unit font
Select the font of the displayed unit.
Digit font
Select the font of the RPM value.
Digit background
Select the background colour of the RPM value.
Needle color
Select the colour of the display needle.
Table 5.19: Parameters tachometer graph - Level 0
5.4.9
vsXREF graph
The vsXREF graph allows you to use various reference values for the x-axis. Currently only the results
coming from the tachometer and auxiliary channels can be used. The graph allows you to display a level
with reference to rotational speed or temperature values. You may add an unlimited number of traces to the
graph. As with the history graph, you may use several axes. The adjustable parameters are the same as for
the history graph (see paragraph 5.4.2).
SINUS Messtechnik GmbH
71 of 132
Manual SAMURAI