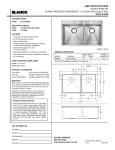
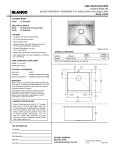
1
407 – 15216 North Bluff Road White Rock, BC Canada V4B 0A7 Phone: 604.424.9092 SiteView Toll Free: 1.877.352.9158 Fax: 1.877.453.0658 Email: [email protected] Web: www.microedgeinstruments.com Site-Log Data Logger Software User’s Manual Microedge Instruments Inc. 407 – 15216 North Bluff Road White Rock, BC, Canada, V4B 0A7 Toll Free: 1.877.352.9158 www.microedgeinstruments.com ABOUT THIS MANUAL This manual contains operational information for SiteView software. Copyright © 2010, Microedge Instruments Inc. Limits of Liability and Disclaimer of Warranty: The manual contained in this document is furnished for informational use only and is subject to change without notice. Microedge Instruments Inc. shall not be liable for errors contained herein or for incidental or consequential damages in connection with the furnishing, performance, or use of this material. Copyright and Trademarks This manual contains proprietary information which is protected by copyright. All rights are reserved. No part of this document may be photocopied, reproduced, or translated to another language without prior written consent of Microedge Instruments Inc. Microedge Instruments Inc., Site-Log, SiteView are the trademarks of Microedge Instruments Inc. All other trademarks and registered trademarks are the property of their respective owners. End User License Agreement End User License Agreement is available for download on our website. PLEASE DOWNLOAD AND READ THE SOFTWARE LICENSE AGREEMENT CAREFULLY BEFORE DOWNLOADING OR USING THE SOFTWARE. Microedge Instruments Inc. 407 – 15216 North Bluff Road White Rock, BC, Canada, V4B 0A7 Toll Free: 1.877.352.9158 Web-Site: www.microedgeinstruments.com Email: [email protected] Revision 2.4 For SiteView 2.0, Jan, 2013 SiteView User’s Manual – Microedge Instruments Inc. 1/211 Table of Contents ABOUT THIS MANUAL ................................................................................................................... 1 LIMITS OF LIABILITY AND DISCLAIMER OF WARRANTY: ................................................................... 1 COPYRIGHT AND TRADEMARKS ......................................................................................................... 1 END USER LICENSE AGREEMENT ....................................................................................................... 1 CHAPTER 1 - INTRODUCTION ..................................................................................................... 8 FEATURES .......................................................................................................................................... 8 SYSTEM REQUIREMENTS .................................................................................................................... 8 CHAPTER 2 - INSTALL SITEVIEW .............................................................................................. 9 INSTALL SITEVIEW ............................................................................................................................ 9 CONNECT DATA LOGGER................................................................................................................. 14 ACTIVATE SITEVIEW ....................................................................................................................... 17 CHAPTER 3 – PROTECT YOUR LOGGER ............................................................................... 19 TYPES OF USER ACCOUNT AND PRIVILEGE ...................................................................................... 19 CREATE ACCOUNTS ......................................................................................................................... 19 CHAPTER 4 - COMMUNICATE WITH LOGGER .................................................................... 24 USB PORT CONNECTION ................................................................................................................. 24 Start Communication .................................................................................................................. 24 Adjust USB Settings .................................................................................................................... 25 USB DEVICE SERVER CONNECTION ................................................................................................ 26 Prepare USB Device Server: ...................................................................................................... 27 Start Communication .................................................................................................................. 31 Adjust Ethernet Settings .............................................................................................................. 33 SERIAL PORT CONNECTION .............................................................................................................. 33 Start Communication .................................................................................................................. 33 Adjust Serial Port Settings .......................................................................................................... 35 SERIAL DEVICE SERVER CONNECTION (ETHERNET) ........................................................................ 36 Start Communication .................................................................................................................. 36 Adjust Ethernet Settings .............................................................................................................. 39 MODEM CONNECTION ...................................................................................................................... 39 Initialize Remote Modem ............................................................................................................ 40 Initialize Local Modem ............................................................................................................... 42 Start Communication .................................................................................................................. 43 CHAPTER 5 - VIEW STATUS OF LOGGER .............................................................................. 44 WHAT IS THE STATUS OF LOGGER ................................................................................................... 44 GENERAL STATUS ............................................................................................................................ 45 ALARM AND EXCITATION STATUS ................................................................................................... 45 KNOW IF LOGGER OPERATE PROPERLY? ......................................................................................... 46 CHAPTER 6 - DOWNLOAD LOGGER DATA ........................................................................... 47 CHOOSE FILENAME AND TIME SPAN ................................................................................................ 47 SiteView User’s Manual – Microedge Instruments Inc. 2/211 HOW DEFAULT FILENAME CREATED ............................................................................................... 49 PLOT DISPLAYING OPTIONS ............................................................................................................. 50 CHAPTER 7 - CONFIGURE LOGGER ........................................................................................ 52 CLOCK OF DATA LOGGER ................................................................................................................ 53 DECIDE WHEN TO START AND WHEN TO STOP LOGGING ............................................................... 53 DECIDE HOW OFTEN THE LOGGER SAMPLES SOURCES.................................................................... 54 DECIDE WHICH CHANNELS TO LOG ON .......................................................................................... 54 DECIDE HOW TO CONVERT TO PHYSICAL MEASUREMENT .............................................................. 54 Role of Equation ......................................................................................................................... 55 Decide What Equation to Use ..................................................................................................... 55 MANAGE ALARM AND EXCITATION CONTROL................................................................................. 55 Configure Channel Alarms ......................................................................................................... 55 Decide what to do when in Alarm State ...................................................................................... 56 Configure Excitation Control ..................................................................................................... 56 ADD CUSTOM CHANNELS ................................................................................................................ 57 QUICK WAY TO CALIBRATE LOGGER .............................................................................................. 57 Understand Cali. Low & Cali. High ........................................................................................... 57 Calibrate Channel....................................................................................................................... 58 SAVE SETTINGS AND START NEW SESSION ...................................................................................... 58 CHAPTER 8 - REAL-TIME CHART VIEWING/RECORDING .............................................. 59 DISPLAY REAL-TIME DIALOG .......................................................................................................... 59 SAVE REAL-TIME DATA .................................................................................................................. 60 CHANGE VIEWS PROPERTIES ........................................................................................................... 61 CHAPTER 9 - CALIBRATE LOGGER ........................................................................................ 62 On-Line Calibrate ....................................................................................................................... 62 Off-Line Calibrate....................................................................................................................... 67 CHAPTER 10 - RECEIVE ALARM NOTIFICATIONS ............................................................. 69 HOW SITEVIEW RECEIVE ALARMS .................................................................................................. 69 CONFIGURE PARAMETERS FOR RECEIVING ALARMS ........................................................................ 69 ACTIONS WHEN ALARM RECEIVED ................................................................................................. 70 Execute a program or play music: .............................................................................................. 70 Send out email: ........................................................................................................................... 71 ALARM CENTRE ............................................................................................................................... 73 CHAPTER 11 - WORK WITH EQUATIONS .............................................................................. 75 WHAT IS EQUATION ......................................................................................................................... 75 BUILT-IN EQUATIONS ...................................................................................................................... 75 Equations for Temperature Channels ......................................................................................... 75 Equations for Relative Humidity Channel .................................................................................. 75 Equaitons for Voltage Channels ................................................................................................. 76 Equations for Current Channels ................................................................................................. 76 TEMPERATURE EQUATION FOR THERMISTOR .................................................................................. 76 CUSTOM EQUATION ......................................................................................................................... 78 SiteView User’s Manual – Microedge Instruments Inc. 3/211 CREATE EQUATION .......................................................................................................................... 79 IMPORT/EXPORT EQUATIONS ........................................................................................................... 81 APPLY EQUATION TO LOGGER ......................................................................................................... 84 CREATE CUSTOM-LINE EQUATION .................................................................................................. 85 ADD CUSTOM-LINE EQUATION TO PLOT.......................................................................................... 86 CALL/INVOKE OTHER CUSTOM EQUATIONS .................................................................................... 87 CHAPTER 12 - WORK WITH UNITS .......................................................................................... 89 WHAT IS UNIT .................................................................................................................................. 89 OPEN UNIT CATEGORY DIALOG....................................................................................................... 90 CREATE UNIT ................................................................................................................................... 91 IMPORT/EXPORT UNITS.................................................................................................................... 92 USE UNIT ......................................................................................................................................... 95 Apply Unit Category in Equation ............................................................................................... 95 Change Unit ................................................................................................................................ 95 Change Unit in Plot .................................................................................................................... 95 CHAPTER 13 - WORK WITH SETTINGS & PLOT PREFERENCES ................................... 96 PLOT PREFERENCES ......................................................................................................................... 96 GLOBAL SETTINGS ........................................................................................................................... 97 CHAPTER 14 – UPGRADE SITEVIEW & FIRMWARE........................................................... 99 UPGRADE SITEVIEW ........................................................................................................................ 99 UPGRADE FIRMWARE....................................................................................................................... 99 CHAPTER 15 - WORK WITH PLOT ......................................................................................... 101 BASIC VIEWS ................................................................................................................................. 101 Plot View ................................................................................................................................... 102 Tabular View............................................................................................................................. 102 Statistics .................................................................................................................................... 103 OPEN SITEVIEW FILES ................................................................................................................... 103 Open SiteView files ................................................................................................................... 103 Merge SiteView files With Current Plot.................................................................................... 104 SAVE AND EXPORT PLOT ............................................................................................................... 105 Save the Change........................................................................................................................ 105 Save a copy of SiteViw File ....................................................................................................... 105 Save As Image File.................................................................................................................... 106 Save as Text File ....................................................................................................................... 108 PRINT PLOT .................................................................................................................................... 109 CHANGE PLOT SETTINGS ............................................................................................................... 111 Change Axis Settings................................................................................................................. 111 Change Line Settings ................................................................................................................ 111 Change Plot Title Settings ........................................................................................................ 112 Change Legend Settings............................................................................................................ 112 Change Other Settings .............................................................................................................. 113 ZOOM PLOT.................................................................................................................................... 113 Zoom-In ..................................................................................................................................... 113 SiteView User’s Manual – Microedge Instruments Inc. 4/211 Zoom-Out .................................................................................................................................. 115 Un-zoom-All .............................................................................................................................. 115 Time-Zoom ................................................................................................................................ 116 ADD CUSTOM CHANNELS .............................................................................................................. 116 ADD CUSTOM LINES ...................................................................................................................... 117 ADD ANNOTATION AND COMMENT................................................................................................ 118 Add an Annotation .................................................................................................................... 118 Add a Comment ......................................................................................................................... 119 OTHER FEATURES OF PLOT ............................................................................................................ 120 Use Context Menu ..................................................................................................................... 120 Copy Plot to Clipboard ............................................................................................................. 122 Show Point Value ...................................................................................................................... 122 View Mouse-Point Values ......................................................................................................... 123 Fast Draw Mode ....................................................................................................................... 123 Change View Layout ................................................................................................................. 124 CHAPTER 16 - USER INTERFACE REFERENCES................................................................ 125 MENU BAR..................................................................................................................................... 125 File ............................................................................................................................................ 125 View........................................................................................................................................... 126 Tools.......................................................................................................................................... 126 Help ........................................................................................................................................... 127 TOOL BAR ...................................................................................................................................... 128 COMMUNICATION BAR .................................................................................................................. 129 USB ........................................................................................................................................... 130 USB Device Server.................................................................................................................... 131 Serial Port ................................................................................................................................. 134 Serial Device Server (Ethernet) ................................................................................................ 136 LOGGER STATUS VIEW .................................................................................................................. 138 Tool Bar Buttons ....................................................................................................................... 139 General ..................................................................................................................................... 140 Alarm & Excitation ................................................................................................................... 141 DOWNLOAD DIALOG ...................................................................................................................... 143 Filename & Browse .................................................................................................................. 143 Start Time & End Time ............................................................................................................. 144 LOGGER CONFIGURATION DIALOG ................................................................................................ 144 General Settings ........................................................................................................................ 144 Channel Settings ....................................................................................................................... 146 Alarm and Excitation Settings .................................................................................................. 147 REAL-TIME DIALOG....................................................................................................................... 149 Tool Bar Buttons:...................................................................................................................... 150 Other Settings............................................................................................................................ 151 EQUATION DIALOG ........................................................................................................................ 153 Tool bar Buttons ....................................................................................................................... 154 Other Fields .............................................................................................................................. 155 New Equation Dialog................................................................................................................ 155 Import Equation Dialog ............................................................................................................ 157 SiteView User’s Manual – Microedge Instruments Inc. 5/211 Export Equations Dialog .......................................................................................................... 158 Polynomial Equation Dialog .................................................................................................... 160 CUSTOM LINE EQUATION DIALOG ................................................................................................. 162 UNIT CATEGORY DIALOG .............................................................................................................. 163 Tool bar buttons ........................................................................................................................ 163 Other Fields .............................................................................................................................. 164 Add New Unit Category Dialog ................................................................................................ 165 Export Units Dialog .................................................................................................................. 166 Import Units Dialog .................................................................................................................. 167 PLOT PREFERENCE DIALOG ........................................................................................................... 167 Buttons ...................................................................................................................................... 168 Other fields................................................................................................................................ 169 New Plot Prefernce ................................................................................................................... 169 DIAGNOSTIC LOG PANEL ............................................................................................................... 170 GLOBAL SETTING DIALOG ............................................................................................................. 172 General ..................................................................................................................................... 172 Download .................................................................................................................................. 173 Diagnostic Log .......................................................................................................................... 174 Real-Time Log........................................................................................................................... 175 Alarm......................................................................................................................................... 176 Modem....................................................................................................................................... 178 USB Device Server.................................................................................................................... 179 PLOT WINDOW............................................................................................................................... 180 Tool Bar Buttons ....................................................................................................................... 180 Menu Items ................................................................................................................................ 182 Select Time Span Dialog ........................................................................................................... 186 Dataset View ............................................................................................................................. 186 Statistics .................................................................................................................................... 187 Axis............................................................................................................................................ 187 Line ........................................................................................................................................... 189 Plot Title.................................................................................................................................... 191 Legend ....................................................................................................................................... 192 Others........................................................................................................................................ 193 ALARM CENTER ............................................................................................................................. 194 Connections............................................................................................................................... 194 Alarm Events ............................................................................................................................. 194 Log ............................................................................................................................................ 195 Buttons ...................................................................................................................................... 195 CHAPTER 17 - EQUATION REFERENCES ............................................................................. 196 C# LANGUAGE SOURCE CODE REFERENCES .................................................................................. 196 Basic data types ........................................................................................................................ 196 Basic Operators ........................................................................................................................ 196 Basic Math Methods ................................................................................................................. 200 ACCESSIBLE OBJECTS .................................................................................................................... 201 EQUATION EXAMPLES.................................................................................................................... 202 Dew Point Temperature ............................................................................................................ 202 SiteView User’s Manual – Microedge Instruments Inc. 6/211 Carbon Dioxide Transmitter (0 – 5000 PPM) .......................................................................... 202 External Thermistor .................................................................................................................. 203 Previous Hour Average............................................................................................................. 203 APPENDIX ...................................................................................................................................... 205 MODEM AT COMMAND SET .......................................................................................................... 205 SiteView User’s Manual – Microedge Instruments Inc. 7/211 CHAPTER 1 - INTRODUCTION Congratulations on using SiteView - the complete software package working closely with Site-Log and VersaLog series data loggers for device configuration, data downloading, plotting and analyzing. Features Supports Serial Port, USB, Ethernet and Modem connections for easy local and remote access of data loggers. Allows downloading multiple data loggers simultaneously. Provides powerful custom equation functionality solving scientific and laboratory algorithm difficulties. Displays both tabular data and plot view. Zooming function provides detailed view of specific data section. Annotation/Comment highlights the important data points and sections. Custom channel and custom line allow adding more channels to the logger and plot lines to the plot view. Allows real-time chart and list views of the data logger, replacing paper chart recorder. Receives alarm notifications from data logger and takes actions like sending email, playing music etc. Access remote data loggers via LAN/Internet as if they were connected directly to the local computer. User Account Control to protect data loggers and important settings. System Requirements Computer: CPU: 1.0 GHZ or above Memory: 256M or above Port: 1 USB port or 1 COM port Hard Drive: 1GB or above Operating System: Window XP with SP2 or later, Windows Vista, Windows 7, 8 SiteView User’s Manual – Microedge Instruments Inc. 8/211 CHAPTER 2 - INSTALL SITEVIEW NOTE: Before the installation, please make sure the product key is available. Install SiteView 1. Configure for Windows 8 User: Please skip this section if your operating system is NOT Windows 8! For Windows 8 user, in order to install the USB Driver properly, the following steps must be followed before the installation of SiteView software: A. B. C. D. E. F. G. Mouse over the lower-right corner of the screen, then select Settings. Select Change PC Settings. Navigate to General and under Advanced Startup. Click Restart Now. Now Windows 8 will restart in the advanced menu options, click on Troubleshoot. Click on Advanced options. Click the Startup Settings option from the menu. The Startup Settings will allow you to change various Windows configuration options. Click Restart. H. Now Windows 8 will reboot. But instead of going to the Desktop it will start in the Startup Settings page. Choose option: 7) Disable driver signature enforcement by pressing F7 or the number 7. Then the windows will boot to the mode allowing the USB Driver to be installed. Windows 8 is now ready for SiteView installation. For on-screen step by step configuration please visit: http://www.microedgeinstruments.com/Win8Configurations.pdf 2. Install SiteView and Data Logger USB Driver Insert the included CD to the CD Drive. The installation should start to run automatically. Follow the on-screen instructions to complete the installation. SiteView User’s Manual – Microedge Instruments Inc. 9/211 Click “Next >” button to proceed to the next page. SiteView User’s Manual – Microedge Instruments Inc. 10/211 Please read the License Agreement carefully. If you accept the terms click “I Agree”, then click “Next >” button. Otherwise click “Cancel” to cancel the installation. In this dialog select a destination folder where SiteView will be installed. We recommend you keep the default folder. Once you are ready, click “Next >” button to proceed to the next page. SiteView User’s Manual – Microedge Instruments Inc. 11/211 This confirmation page gives you the chance to modify previously selected options. Click “Next >” button to start the installation. SiteView User’s Manual – Microedge Instruments Inc. 12/211 As SiteView is being installed the above dialog shows the installation progress by percentage. Depending on the operating system, you may see the dialog similar to the one below displayed. Please select “Continue Anyway” or “Install this driver software anyway” to allow the software and the driver to be installed. Once the installation is complete, the below dialog appears: Click “Close” button to finish the installation and close the dialog. SiteView User’s Manual – Microedge Instruments Inc. 13/211 Connect Data Logger Connect the logger to the computer’s USB port. Windows Vista and Windows 7, 8 will automatically recognize the data logger. For Windows XP user, the following dialog window will appear: Select "No, not this time" from options available and then Click "Next >" to proceed with the installation. SiteView User’s Manual – Microedge Instruments Inc. 14/211 Select "Install the software automatically (Recommended)” as shown in the above figure and then click "Next >". Select the item with Manufacturer of Microedge Instruments Inc and click “Next>” to proceed. SiteView User’s Manual – Microedge Instruments Inc. 15/211 In the following message dialog, click "Continue Anyway" to continue with the installation: The screen below will be displayed as Windows copies required driver files: Windows should then display a message indicating the installation was successful: SiteView User’s Manual – Microedge Instruments Inc. 16/211 Activate SiteView After the installation SiteView needs to be activated by the Product Key you obtained when you bought SiteView. If the above installation of SiteView was successful, SiteView can be launched by either one of the following: Double click on SiteView icon on the desktop: Or: Using Windows Start Menu, select Start : All Programs: Microedge Instruments Inc.: SiteView. Double click SiteView icon on the desktop, the following dialog appears: SiteView User’s Manual – Microedge Instruments Inc. 17/211 Enter the Product Key, then click Activate button. If the Product Key is accepted the following confirmation dialog will appear: Click OK button to finish the activation. From now you can start using SiteView. SiteView User’s Manual – Microedge Instruments Inc. 18/211 CHAPTER 3 – PROTECT YOUR LOGGER When SiteView is first installed there are no user account and password protections. We strongly recommend you to create user accounts as early as possible in order to protect your logger and system. Types of User Account and Privilege Administrator: Change all fields of the system and configure data logger. Add, modify and delete other users. You can only have one Administrator account in the system. Master: Has the same privilege as Administrator except Master can not create, modify and delete other users. Standard User: Can view logger status, download data and view plots. Some system settings are not allowed to view. Can not change most of settings. Create Accounts To enable User Account and create one or more users with SiteView system: 1. Display Global Settings dialog: 2. Click "User Account" tab then "Click Create Account" button to create an Administrator account: SiteView User’s Manual – Microedge Instruments Inc. 19/211 3. Fill out the registration dialog and click "OK" button. Make note of your user ID, password and put them in a safe place. SiteView User’s Manual – Microedge Instruments Inc. 20/211 4. You may create other user accounts by clicking "Add New User" button after you have created the administrator account. SiteView User’s Manual – Microedge Instruments Inc. 21/211 Once you have created users, on the next start of SiteView you are prompted with User Login dialog. Only valid users can log in to the system and start using SiteView: You can also display the above dialog to log off the system if you want to prevent other people from using SiteView. To display the above dialog within SiteView, click Log in/off button: SiteView User’s Manual – Microedge Instruments Inc. 22/211 Then click "Log Off" button on the above User Login dialog. The system will automatically log off if you have not interact with the system for a period of time that you can set from General tab of Global Settings dialog: Change "Log Off Timer" to a decent value. SiteView User’s Manual – Microedge Instruments Inc. 23/211 CHAPTER 4 - COMMUNICATE WITH LOGGER All Site-Log series data loggers come with an USB and an AUX ports. The USB port is for connecting directly to the computer. The AUX port is for connecting to a serial communication device like a Modem or a Serial Device Server when the logger needs to be accessed remotely. NOTE: Please make sure SiteView and USB driver are installed correctly. Refer to Chapter 2 for details on the installation. USB Port Connection Start Communication To communicate with the logger via USB port: 1. Connect accompanied USB cable from the logger to a computer's USB port. USB Port USB Port USB Computer 2. Launch SiteView application by double clicking on SiteView icon on the desktop: SiteView application starts running and the logger icon is showing in the USB tab page of the communication panel: SiteView User’s Manual – Microedge Instruments Inc. 24/211 3. Double click the logger icon. If the communication is successful the logger's status page will appear. Adjust USB Settings Each time when you selected a USB icon under USB Port list, the settings for that port will be displayed under the properties section. You may change the settings based on the communication quality. For detailed explanation of each setting please refer to User Interface References chapter. SiteView User’s Manual – Microedge Instruments Inc. 25/211 USB Device Server Connection USB Device Server Connection is for the communications with data logger via USB Device Server over LAN/Internet . A USB Device Server can be a Site USB Device Server hardware or SiteView software with USB Device Service function enabled. USB Device Server Connection with Site USB Device Server SiteView User’s Manual – Microedge Instruments Inc. 26/211 USB Device Server Connection with Computer as Device Server Prepare USB Device Server: If the data logger is connected to a Site USB Device Server hardware, please refer to Site USB Device Server Manual for detailed instructions on installation, obtaining IP address, port number (default: 5678) and password (default: 12345). If the data logger is connected to a computer and the computer will act as the USB Device Server: 1. Connect a data logger to the computer which will act as the Device Server. 2. Launch SiteView by double clicking on SiteView icon on the desktop: SiteView User’s Manual – Microedge Instruments Inc. 27/211 3. Enable Device Service by opening Tools -> Global Settings -> USB Device Server menu item: SiteView User’s Manual – Microedge Instruments Inc. 28/211 The factory default password is 12345. Check Enable USB Device Service to enable the service. Click OK button to close the dialog. For security purpose, Windows system may display the following alert. You can just click Unblock to accept. SiteView User’s Manual – Microedge Instruments Inc. 29/211 4. Obtain the IP address by opening USB Device Service -> Show Service Log: The IP Address and port are listed in caption area of the following dialog: SiteView User’s Manual – Microedge Instruments Inc. 30/211 Start Communication To communicate with the USB Device Server: 1. Launch SiteView. Click USB Device Server tab in the Communication panel SiteView User’s Manual – Microedge Instruments Inc. 31/211 2. Click New button to create a new Ethernet connection: In the following pop-up dialog, enter the IP address and the port of the Site USB Device Server. Give a meaningful description of the connection, enter the password and click OK button to close the dialog. SiteView User’s Manual – Microedge Instruments Inc. 32/211 3. Double click on the icon to start the communication. If the communication is successful the logger's icon will appear under the connection you just created. Double click on the logger icon the logger status page will appear. Adjust Ethernet Settings Each time when you selected an Ethernet icon under IP Address list, the settings for that address will be displayed under the properties section. You may change the settings based on the communication quality. For detailed explanation of each setting please refer to User Interface References chapter. Serial Port Connection Start Communication To communicate with the logger via Serial Port: SiteView User’s Manual – Microedge Instruments Inc. 33/211 4. Connect one side of SL-RS232 Converter to the logger’s AUX port, connect another side to one of the computer’s COM port. If your computer does not have a COM port you may need to use a USB-Serial Converter. AUX Port COM Port SL-RS232 Converter Computer 5. Launch SiteView application by double clicking on SiteView icon on the desktop: SiteView application starts running. Click Serial Port tab in the communication panel, SiteView User’s Manual – Microedge Instruments Inc. 34/211 6. Double click on the correct COM port. If the communication is successful the logger's status page will be displayed. Adjust Serial Port Settings Each time when you selected a COM port icon under Serial Port list, the settings for that port will be displayed under the properties section. You may change the settings based on the communication quality. For detailed explanation of each setting please refer to User Interface References chapter. SiteView User’s Manual – Microedge Instruments Inc. 35/211 Serial Device Server Connection (Ethernet) Start Communication To communicate with the logger via Ethernet Connection: 1. Connect the logger, the SL-RS232 Converter and the Device Server as illustrated below: 2. Locate the IP address of the Device Server: The Device Server was pre-configured with the correct parameters. You can use Link Local and multicast DNS (also known as Bonjour) to locate the Device Server and its IP address. Bonjour Browser can be downloaded from our website at:www.microedgeinstruments.com/resourcedownload.php. SiteView User’s Manual – Microedge Instruments Inc. 36/211 Once you run Bonjour Browser and select Web Server(HTTP) on the left hand side you will see a window similar to the following Write down the IP address besides the SitePlayer Telnet. 3. Launch SiteView application by double clicking on SiteView icon on the desktop: SiteView application starts running. Click Ethernet tab in the communication panel. SiteView User’s Manual – Microedge Instruments Inc. 37/211 4. Click New button to create a new Ethernet connection: In the following pop-up dialog, enter the IP address that you obtained from the preceding step. Give a meaningful description of the connection and click OK button to close the dialog. If you use other brand Device Server you may need to adjust Port and Packet Size values accordingly in order to make a successful connection. SiteView User’s Manual – Microedge Instruments Inc. 38/211 Notice a new connection icon was added to the list. 5. Double click on the icon to start the communication. If the communication is successful the logger's status page will appear. Adjust Ethernet Settings Each time when you selected an Ethernet icon under IP Address list, the settings for that address will be displayed under the properties section. You may change the settings based on the communication quality. For detailed explanation of each setting please refer to User Interface References chapter. Modem Connection When you use Modem to communicate with a logger, you need one local Modem to connect to the computer where SiteView is running, and another remote Modem to connect to the logger. The following figure illustrates the correct connection between a computer and a logger. AUX Port COM Port SL-RS232 Converter Modem Modem Computer The Modem settings are under the Serial Port connection: SiteView User’s Manual – Microedge Instruments Inc. 39/211 In order to make the connection, both local and remote Modems must be initialized correctly. Initialize Remote Modem If the remote Modem has not been initialized by SiteView, the Modem needs to be initialized. The default initialization string that works with US Robotics is: AT&F&D0&K0&Q0\N1%C0S0=1S37=9M0&M0-V90=0E0&W To initialize a remote Modem: 1. Connect the remote Modem to the computer. 2. Run SiteView, go to Global Settings -> Modem dialog. SiteView User’s Manual – Microedge Instruments Inc. 40/211 3. 4. 5. 6. Change the Initialization String. Choose the correct COM port that is connected to the Modem. Click Initialize MODEM button. You should get the confirmation dialog if the initialization was successful. The following table explains each command in Default Initialization String: Command AT &F &D0 Description Get the Modem’s attention Return the configuration to the factory settings. Control data terminal ready (DTR). &D0: Ignore DTR signal. &K0 DTE/Modem Flow Control. &K0: Disable flow control Asynchronous/Synchronous mode select. &Q0: Select asynchronous operation in the Direct mode. Operation Mode Control. \N0: Select normal speed buffering mode. &Q0 \N0 SiteView User’s Manual – Microedge Instruments Inc. 41/211 %C0 S0= x M0 &M0 E0 &W NOTE: Compression Control %C0: Disable data compression. Read or write to S registers. S0 = 1: Auto answer after 1 ring. S37 = 9: Attempt to connect at 9600 bps speed. Control Speaker On/Off M0: Speaker is always off. Communication Mode. Command Echo E0: Inhibit the echoing of commands. Store user profile. Different Modem may have different AT commands. The default initialization string is for US Robotics 33K Modem. Please refer to Appendix -> Modem AT Commands for details. Initialize Local Modem The local Modem gets initialized before SiteView tries to dial the number for the Modem connection. The default initialization string that works with US Robotics 32K Modem is: AT&F &D0 &K0 &Q0 \N1 %C0 S37=13 E0 &W The default initialization string is located under each COM port bar: You may change the string based on the Modem you are using. SiteView User’s Manual – Microedge Instruments Inc. 42/211 Start Communication To communicate with the logger via Modem: 1. Connect both Modems correctly. 2. Go to COM Port page and highlight the COM port that is connected to the local Modem. 3. Make sure Is Modem check box is checked. Make sure Phone No. text-box has the valid phone number the remote Modem is connected. Make sure Modem Initialization is correct. 4. Double click the COM port icon to start the communication. If the communication is successful the logger's status page will appear. SiteView User’s Manual – Microedge Instruments Inc. 43/211 CHAPTER 5 - VIEW STATUS OF LOGGER What is the Status of Logger The status of a logger is a set of properties that are saved inside the logger. The properties are used by the logger and SiteView software. When SiteView communicates with the logger, it first retrieves all properties of the logger, parses them into meaningful information and populates them on the graphical user interface. If the communications between SiteView and the logger was established successfully from the above chapter, the status of the logger appears in a tab page illustrated below: The tab page caption shows the name and the serial number of the logger to identify this tab page. The status page shows the general, the channel level, the alarm and excitation properties grouped in sub-tab pages. SiteView User’s Manual – Microedge Instruments Inc. 44/211 The status page is for viewing purpose only. To edit and save the properties, please go to Logger Configuration dialog by clicking the Configure tool bar button. Through the tool bar buttons you can finish other tasks described in the following chapters. Please refer to User Interface References chapter for the detailed explanation of each field. General Status This page specifies the basic logger status information like start and end time, memory usage, logging mode etc. Channel properties specify how many channels the logger has and each channel’s information such as if the channel is enabled or disabled, the description and the applied equation etc. Alarm and Excitation Status This page specifies how the logger acts if there is an alarm: dial-out to a Modem and send out the alarm notifications or send out the alarm notification directly via the port, or ignore the alarm. It also shows how each channel affects the alarm conditions. Excitation Control status is displayed in this page like Excitation Warm-up Delay and if the excitation control connects to the terminal pole. Please refer to Receive Alarm Notifications chapter for detailed instructions on how to set up the alarm information properly and receive alarm notifications within SiteView. SiteView User’s Manual – Microedge Instruments Inc. 45/211 Know If Logger Operate Properly? It is important to know that the logger is operating properly. What status can we use to tell if the logger has stopped logging data and is operating abnormally? The first status you should look at is the blue bold section just above the Channel information: This status tells you if the logger is logging data or has stopped. Other information it reports can be: 1. The logger has not started logging data. It will start at XXXX. The logger is in start-delay mode and is counting down the timer. Once the timer goes to zero the logger will start logging data. If you set Time to Start field to a time in the future you will see the above status. If you want the logger to record data right after the logger is configured you can set this field to now or a time in the past. 2. The logger has stopped logging data and has been dormant for XXXX. If the logger is in dormant mode, it stops logging data and waits for SiteView to download the data. Usually, this is because the When Memory Full field was set to Stop Logging when the logger was configured, and when the memory is full the logger will stop logging and in dormant mode. If you want the logger to keep recording data you can set When Memory Full field to Continue Logging. 3. Data has rolled over and in FIFO mode If the logger is in First-In-First-Out mode, the logger keeps overwriting the oldest data with the new measured data. If you are only interested in a specific time frame, you may need to set When Memory Full field to Stop Logging. In this case, the logger will stop logging when the time passed the Time to End parameter. Another status you should focus is the battery level. If the on-board battery level is too low you will get the red warning sign indicating it’s time to replace the battery. SiteView User’s Manual – Microedge Instruments Inc. 46/211 CHAPTER 6 - DOWNLOAD LOGGER DATA Downloading Logger Data is the process transferring the recorded measurements inside the logger to the computer and saving them in a file that SiteView can recognize – SiteView file (.svf). If the logger is in normal sampling mode (sampling interval >= 5 seconds), the downloading process does not interrupt the logging operation. If the logger is in fast sampling mode (sampling interval is less than 5 seconds) logger will stop logging data from the time SiteView communicates with the logger. SiteView can choose to download whole available data or only the interesting section for the specific period of time. Choose Filename and Time Span If you are already in logger status page, click Download button, Download Logger dialog window will appear: SiteView User’s Manual – Microedge Instruments Inc. 47/211 Each time when Download Logger dialog appears a default filename is created based on the properties in Global Setting -> Download page and is loaded in the Filename field. You may specify a different file name by clicking Browse to select a file name. Once you have selected the file name to save and specified the start and end time, click OK button to start the downloading process. After the download the plot and the tabular data will appear: SiteView User’s Manual – Microedge Instruments Inc. 48/211 How Default Filename Created The Download page in Global Settings dialog specifies the properties regarding download. Default Download Folder specifies the default folder to save all SiteView files. Download File Prefix specifies a string added in front of the filename. Download File Format specifies how to build the filename. The available selections are: Prefix + Serial Number + Date + Time Serial Number + Date + Time Serial Number Date + Time Prefix + Serial Number Prefix + Date + Time Prefix + Model + Seial Number + Time For example, if you selected: Prefix + Serial Number + Date + Time, the logger serial number is 0101FF-065282, and the prefix string is “LAB01-”, the system will generate the default file name looks like: SiteView User’s Manual – Microedge Instruments Inc. 49/211 LAB01SN010101065282-2010-09-02-07-07-11.svf Plot Displaying Options If you check Display Plot After Download in the above Global Settings dialog, the plot will be displayed after the download process. Otherwise, SiteView just saves the data and the plot will not show. If you check Load Plot in Separate Window in General page of the above Global Settings dialog, the plot will be displayed in a separate window after the SiteView file is loaded. Otherwise the plot will be displayed within the current SiteView main frame. SiteView User’s Manual – Microedge Instruments Inc. 50/211 SiteView User’s Manual – Microedge Instruments Inc. 51/211 CHAPTER 7 - CONFIGURE LOGGER WARNING: By clicking OK or Apply buttons, all recorded data in the logger will be lost. If the data is important please ALWAYS download the data before configuring the logger. Configuration of the logger is the procedure to change the properties of the logger and start a new session of logging. If you are already in the Logger Status page, clicking on the Configure button will bring up the Logger Configuration dialog: SiteView User’s Manual – Microedge Instruments Inc. 52/211 Clock of Data Logger Each Site-Log data logger synchronizes its clock with the computer which is used to configure the data logger. If you have multiple computers used to configure data loggers please make sure all computers are synchronized with the same clock source. Or only one computer will be used to start new logging session. Decide When To Start and When To Stop Logging The new session can be started immediately after the logger is configured or start in the future by adjusting the Time to Start field. If you want the logger to stop at a specific time: 1. Adjust Time to End field to a time later than Time to Start field. 2. Set When Memory Full to Stop Logging. If you want the logger to stop logging after a specific period of time: 1. Adjust Total Time Span to desired period of time. 2. Set When Memory Full to Stop Logging. If you want the logger to continue logging for a specific period of time: 1. Adjust Time to End field to the time later than Time to Start field. You will see Total Time Span fields updated with the new set of values. Or you can adjust Total Time Span to a desired period of time. 2. Set When Memory Full to Continue Logging. If the start time is unknown and you want to activate the new session in the field: 1. Adjust Time to Start field to a time far beyond the estimated start time (for example, one year ahead) so the logger will be in start-delay mode. 2. Adjust Total Time Span to desired period of time. 3. Set When Memory Full to Stop Logging or Continue Logging based on your application. 4. When you decide to activate the session, press the activation button located on the logger until the LED starts to blink. Release the button. NOTE: The activation button is used for starting the session, not for stopping the session. Once the logger has started logging, the activation button is ignored. SiteView User’s Manual – Microedge Instruments Inc. 53/211 Decide How Often the Logger Samples Sources When the logger is operating, the logger samples the source channels in a preset time interval (sampling interval). Most of Site-Log loggers can run as fast as sampling one channel every 20 milliseconds, or as slow as sampling all channels every 12 hours. If the sampling interval is set 5 seconds or bigger, the logger will operate in normal sampling mode. In this mode, if the logger is logging data, the logger will continue operating while it is communicating with the host device. If the sampling interval is set below 5 seconds, the logger will operate in fast sampling mode. In this mode, the logger needs the external power supply for the logging period and the communications with the logger will force the logger to stop logging. TIPS: The proper steps to configure the logger for fast sampling mode is: 1. Adjust the sampling interval to 4 seconds or less. 2. Adjust Time to Start to the time when you want the logger to start logging. 3. Apply the external supply to the logger before the logger starts logging. If the logger tries to start fast logging and the external power supply is not applied, the logger will stop. Then you have to reconfigure the logger. Decide Which Channels To Log On When the logger is operating, the logger measures the input of each ENABLED channel. Be sure to enable the channel if you want the channel be recorded. If one channel’s measurement relies on other channels’ measurements (A custom equation may use other channels’ measurements for the current channel’s calculation), be sure to enable those dependent channels. Some of the Site-Log loggers are featured with software programmable channels. The input range of those channels can be changed via SiteView. When the range is changed to better fit the actual input signal’s range, better resolution and accuracy can be obtained. For instance, changing the Input Range of a programmable voltage channel to 0 – 2 V will get better resolution if you know the input source’s range will be within 0 – 2 V. Decide How to Convert To Physical Measurement When the logger saves the data the logger saves the data in digital format. SiteView converts the digital values to the physical measurements after the data is downloaded to the computer. SiteView User’s Manual – Microedge Instruments Inc. 54/211 Role of Equation SiteView does the data conversions by using equations. An equation is a software entity handling the conversion from one data format to another. SiteView contains the built-in equations for those predefined channel types and the customer-defined equations that can be applied to all channel types. A custome-defined equation (custom equation) is a piece of script (C# source code) in the format of function implementing the data conversion. When a channel is configured, an equation is applied to the channel. After SiteView has retrieved the logger status SiteView locates the equation entity by the equation name saved inside the logger. Once the equation entity is identified the equation entity will handle the data conversion. Decide What Equation to Use This depends on the physical measurement and the input source parameters. If you are using 0 – 10 VDC channel to record a voltage source, you can use a built-in equation “VoltageDC”. If you are recording a 0 – 10 VDC transducer as the source input, and the transducer has the measurement range of 0 – 5000 PPM CO2, you need to write your custom equation like this: public double CO2Equation(double Input) { } double output; output = 5000 * Input / 10 ; return output; The above equation implements the relationship between the input voltage value and the output physical PPM value. A voltage is converted proportionally to a PPM value. Please refer to Work with Equations chapter for detailed instructions on how to write a custom equation. Manage Alarm and Excitation Control Configure Channel Alarms When the logger is recording data, it compares the current reading with Low/High Alarm values that is previously saved in the logger for each channel. If all the following conditions are met, the logger will be in Alarm state: 1. The current reading is beyond the Low/High Alarm values. 2. Alarm is enabled for that channel. 3. Alarm-On Delay’s counter is counted down to zero. SiteView User’s Manual – Microedge Instruments Inc. 55/211 In the figure illustrated below, you can check “Alarm Enabled” check-box if you want to enable the Alarm of the channel. And you can adjust “Low Alarm” and “High Alarm” values so that when the measurement is below “Low Alarm” or above “High Alarm” it will trigger the alarm. Decide what to do when in Alarm State If the logger is alarm state, the logger can energize Alarm1 and/or A2/E terminals in order to control the external devices like siren auto dialer etc. It can also report the alarm to SiteView via Modem dial-out. At the left side of the above figure, you can change Alarm/Excitation Selection to decide which terminals the logger will work with when there is an alarm. You can also change Notify Alarm via Modem to decide if the logger will dial out the connected Modem to the remote Modem which is connected to the PC where SiteView is running. Please refer to Receive Alarm Notifications chapter for detailed instructions on how to make the logger to report the alarm to SiteView. Configure Excitation Control Excitation output is used when you need to save the electric power of the device that provides the signal source to the data logger. When there is no local power available and a battery pack is used to power the transducer, excitation control greatly reduces power consumption by turning on the transducer only when it samples the data and turning off the transducer after the sampling. A2/E on the terminal strips can be configured by for excitation purpose. In order to enable A2/E, one of the following Alarm/Excitation Selection must be selected: Excitation control to A2/E, both high and low alarm to Alarm1 Excitation control to A2/E, low alarm to Alarm1 Excitation control to A2/E, high alarm to Alarm1 SiteView User’s Manual – Microedge Instruments Inc. 56/211 Excitation Warm-up Delay is used to specify how much delay will be set after the excitation terminal is activated and before the logger is taking the sample. If the measurement source device needs certain time to stabilize the signal output you may need to set this parameter so the logger will wait certain time before it takes the sample. Please refer to User Interface References for the detailed explanation of each field. Add Custom Channels A custom channel is a virtual channel that SiteView can add to a data logger. Because there is no physical measurement source for a custom channel, the logger can not save the channel’s data in the logger’s memory. Instead, the channel’s data is parsed in SiteView. A custom channel is useful when you need a new measurement in addition to the measurements of existing physical channels and the new measurement relates to those existing channels. For example, if a logger has one temperature channel and one relative humidity channel, and you want to calculate the dew point from the temperature and the relative humidity measurements, a custom channel can be added to the logger for the new dew point measurement. You can add maximum of eight custom channels to a logger. Quick Way to Calibrate Logger Although you can go through the procedure in Calibrate Logger chapter to calibrate a logger, you can also use Logger Configuration dialog to do a quick calibration for all channels of the logger. Understand Cali. Low & Cali. High These two fields specify the calibration values that are used for measurement adjustment. Cali. Low value specifies the digital value that is over zero when the input value is the lowest value (for 0 – 5 VDC channel the lowest value is zero volt). For instance, if you apply zero volt input and the logger measured 100 as the digital value, then Cali. Low should be 100 digits. The equation entity will subtract this value when resolving the correct lowest digital value. Cali. High value specifies the digital value that is over 65535 when the input value is the highest value (for 0 – 5VDC channel the high range is 5 volt). For instance, if you apply 5 volt voltage to the channel and the logger measured 65100 as the digital value. Then Cali. High is “- 435” (calculated from 65100 – 65535). The equation entity will subtract this value (-435) from the digital value when resolving the highest digital value. SiteView User’s Manual – Microedge Instruments Inc. 57/211 The valid range for these two parameters is from –32768 to 32767. The following figure illustrates the relationship between an ideal data line and a measured data line and how Cali. Low and Cali. High correct the measured data line. Measured Data Ideal Data Output Max. = 65535 Cali. Span = 65100 - 65535 = - 435 Max. = 65100 Min. = 100 Cali. Zero = 100 – 0 = 100 Min. = 0 Input Max. = 65535 After Correction, Min. Value = 100 – 100 = 0 After Correction, Max. Value = 65100 – ( - 435) = 65535 Calibrate Channel Cali. Low and Cali. High parameters for each channel are editable in Logger Configuration dialog. You can simply change them and use real-time table to check if the parameters are changed correctly. To calibrate a channel: 1. Click Real-Time button to enable Real-Time table. Notice the real-time readings are updated in Reading cells for all channels. 2. Check the difference between the reading you see and the reading it is supposed to be. Adjust Cali. Low and Cali. High parameters to make the readings as close as to the desired value. 3. If you are satisfied, click Apply button to save the parameters to the logger or click OK button to save the parameters and close the dialog. Save Settings and Start New Session Once you have finished making changes to the available settings, you can click OK button to save the settings to the logger. The logger will start to record data from the Time to Start field you have set. Please refer to User Interface References for the detailed explanation of each field. SiteView User’s Manual – Microedge Instruments Inc. 58/211 CHAPTER 8 - REAL-TIME CHART VIEWING/RECORDING If the logger is in normal sampling mode (sampling interval is 5 seconds or bigger), SiteView can view the real-time measurements while the logger is still logging data. The real-time display shows the list of the latest real-time measurements of all enabled channels, and the trend chart of the realtime measurements for a given latest period of time. Display Real-Time Dialog The Real-Time dialog can be displayed by clicking on Real-Time tool bar button in the logger status page. SiteView User’s Manual – Microedge Instruments Inc. 59/211 Save Real-Time Data The real-time data can be saved in the pre-defined file and the tabular data can be viewed by clicking on Dataset button. Real-Time Log page of Global Settings dialog specifies if, where and how the real-time data will be saved. If you are real-time logging the data for more than a day, the real-time file can be split either daily or monthly. You can specify the folder to save the real-time data file. SiteView User’s Manual – Microedge Instruments Inc. 60/211 Change Views Properties Both List and Chart views can be displayed or hidden by toggling List View Visible and Chart View Visible buttons. They can be displayed either vertically or horizontally by switching between Vertical View and Horizontal View buttons. More properties can be edited by clicking on Settings button: Line Properties table specifies if a line will be displayed, the width and the colour of the line. Axis Properties table specifies if a Y-Axis will be displayed, how the Y-axis scales the reading: Auto Scale or Manual Scale on the given Min and Max range. List Properties section specifies if the channel index and description will be displayed and if the line colour will be applied to the colour of the list text. Click OK button to save the changes. SiteView User’s Manual – Microedge Instruments Inc. 61/211 CHAPTER 9 - CALIBRATE LOGGER SiteView software provides two-point calibration for most of the loggers. If the source signal like voltage or current can be connected to the logger while the logger is connecting to the computer, you can calibrate the logger on-line. If the source signal like a temperature or relative humidity is not available for on-line calibration, you can calibrate the logger off-line after the logger has recorded the low and high point data. On-Line Calibrate Click Calibrate button on the top of the logger status page in SiteView and choose On-Line Calibrate menu. The following dialog appears: SiteView User’s Manual – Microedge Instruments Inc. 62/211 Select the channel you want to calibrate on and click OK button. The following dialog appears: SiteView User’s Manual – Microedge Instruments Inc. 63/211 The above page allows you to calibrate the low point. Please adjust your input which connects to the channel terminal strip to a low point value closes enough to the lowest value of the channel. In the above example “0” is the lowest value. Click Start Calibration button to start the low point calibration. After the click, Start Calibration button changed to Stop Calibration. During the calibration process the current real-time value is showing in Current Reading field. If you think this value is stable you may click Stop Calibration button. Click Next to proceed to the next page. SiteView User’s Manual – Microedge Instruments Inc. 64/211 The above page allows you to calibrate the high point. Please adjust your input which connects to the channel terminal strip to a high point value closes enough to the highest value of the channel. In the above example “50000” mV is the highest value. Click Start Calibration button to start the high point calibration. After the click, Start Calibration button changed to Stop Calibration. During the calibration process the current real-time value is showing in Current Reading field. If you think this value is stable you may click Stop Calibration button. Click Next>> to proceed to the next page. SiteView User’s Manual – Microedge Instruments Inc. 65/211 The above page shows all parameters you have input as well as the values the system have calculated. Two important values can be saved back to the logger by clicking Save Parameters to the logger. Those two parameters are: Calibration Low Value and Calibration High Value. If you click Save Parameters to the logger button you will get the below warning dialog. Click Yes to confirm the saving process. If the system saved the parameters back to the logger successfully, at the bottom side of the dialog The calibration is finished! will appear. You may click Done button to close the dialog. SiteView User’s Manual – Microedge Instruments Inc. 66/211 On the logger status page the Cali. Low and Cali High values for this channel were updated with the new values. The calibration is finished! Off-Line Calibrate Click Calibrate button on the top of the logger status page in SiteView and choose Off-Line Calibrate menu. The following dialog appears: In Step 1, it instructs you how to configure the logger to record low and high point values and retrieve them in the downloaded file. SiteView User’s Manual – Microedge Instruments Inc. 67/211 Once you have obtained those four parameters, enter them into their fields respectively. Click Calibrate button to calculate the final parameters and save them back to the logger. The following dialog appears: Click Yes button to save the parameters. The calibration is finished! SiteView User’s Manual – Microedge Instruments Inc. 68/211 CHAPTER 10 - RECEIVE ALARM NOTIFICATIONS How SiteView Receive Alarms In order to receive any alarms, SiteView must have Alarm Centre opened. Alarm Centre can be displayed by clicking on Alarm Centre menu item under Tools menu. There are two ways that a logger can report the alarm condition: 1. Via Modem Connection: If the connection between the logger and the computer is Modem connection, and Sent Out via Modem/Pager was selected in Alarm Sent-out Selection, the logger will send out the alarm notification via Modem connection by dialling out the phone number and send out the alarm. In this case, SiteView can receive alarms from any logger that can access the Modem connection. 2. Via Direct Connection: If the connection between the logger and the computer is USB, Ethernet or direct Serial Port, SiteView will retrieve the alarm condition of the logger periodically. In this case, SiteView keeps the USB, Ethernet connection or the serial port open all the time. Configure Parameters for Receiving Alarms Before the logger was sent out to the field, the logger must be configured properly for alarm notification. The parameters can be configured are through Logger Configuration dialog. SiteView User’s Manual – Microedge Instruments Inc. 69/211 Configure Channels for Alarming In Alarm & Excitation tab, there is Channel Alarm Settings table. If you want the alarm of the channel to be enabled you need to check Alarm Enabled field. The alarm thresholds can be set by Low Alarm and High Alarm fields. If the value is below the Low Alarm the channel is considered to be in Low Alarm state. If the value is beyond the High Alarm the channel is considered to be in High Alarm state. Configure How to Send out Alarm Notify Alarm via Modem checkbox specifies if the logger sends out an alarm notification via Modem. To let the logger report the alarm via Modem dial-out, you select Sent Out via Modem/Pager. Configure When to Send out Alarm Alarm-On Delay specifies if the logger will wait for a period of time before it treats the alarm to be a true alarm. During this period of time, if the value goes below the alarm thresholds the alarm will be cleared. Configure The Phone Number for Modem If you have selected Notify Alarm via Modem checkbox, you need to provide the phone number the logger needs to dial for the Modem connection. The phone number should be the PSTN line connected to the Modem and the computer where SiteView is running. Actions When Alarm Received When SiteView received an alarm notification, it can run a program and/or send out email: Execute a program or play music: In order to run a program and / or play a music the following parameters must be set in Global Setting -Alarm tab page: SiteView User’s Manual – Microedge Instruments Inc. 70/211 If you want to run a program or play a music, you need to check Run Executable/Play Music check-box and click Browse (…) button to select the file. You may click Test button to see if the selected file is valid. Send out email: If you want to send an alarm email you need to check Send Email To: check-box and fill out the email text-box with the recipient. You may click Send out a Test Email button to test if a test email can be sent to the recipient correctly. You must configure the SMTP email account correctly before sending out any email. SMTP Configuration can be displayed by clicking Configure SMTP Email Account button. SiteView User’s Manual – Microedge Instruments Inc. 71/211 Please refer to User Interface References for the detailed explanation of each field. Below is an example of Alarm Notification Email sent out by SiteView Alarm Center: SiteView User’s Manual – Microedge Instruments Inc. 72/211 Alarm Centre If all above settings are configured correctly, you must open Alarm Centre dialog to receive the alarm and take the specified actions. To open Alarm Centre, you click on Alarm Centre menu item under Tools menu. The following Choose Connections dialog appears. You need to select one ore more connections that will be used to communicate with the connected loggers. If you have selected one or more connections and clicked OK button, the system will check if the loggers are connected to the computer for the non-Modem connections. Upon the success, the Alarm Center dialog will appear. SiteView User’s Manual – Microedge Instruments Inc. 73/211 If there is an alarm, a red-color row will be added to the Alarm Event List and the further action will be taken based on the settings you have already configured. You may change the settings by clicking Settings button. Please refer to User Interface References for the detailed explanation of each field. SiteView User’s Manual – Microedge Instruments Inc. 74/211 CHAPTER 11 - WORK WITH EQUATIONS What is Equation Data logger records a channel input measurement in digital value, which does not represent the physical measurement. In order to do the correct conversion Equation is introduced. Equation is a software functionality handling the conversion from one data format to another. SiteView uses equation name up to 16 characters to identify an equation. Each time when SiteView loads status of the logger it locates the equation by the equation name saved in the logger. If the equation is predefined (built-in equation), SiteView uses predefined function to convert the data. If the equation is customer defined (custom equation), SiteView loads the contents of the equation from the equation file and does the conversion. Built-In Equations The following tables contain all built-in equations: Equations for Temperature Channels Channel Type Internal Thermistor Equation Name Equation Description Temperature Resistance Temperature Resistance Temperature Resistance Temperature Resistance Temperature Temperature ThermocoupleB ThermocoupleE ThermocoupleJ ThermocoupleK ThermocoupleN ThermocoupleR ThermocoupleS ThermocoupleT VoltageDC Thermocouple Equations External Thermistor Temperature Thermocouple Voltage DC Equations for Relative Humidity Channel Channel Type Relative Humidity Equation Name RelativeHumidity SiteView User’s Manual – Microedge Instruments Inc. Equation Description Relative Humidity 75/211 Equaitons for Voltage Channels Channel Range 0-2 VDC 0-5 VDC 0-10 VDC 0-20 VDC -5 to + 5 VDC -2 to +2 VDC Equation Name VoltageDC VoltageDC VoltageDC VoltageDC VoltageDC VoltageDC Equation Description Voltage DC Voltage DC Voltage DC Voltage DC Voltage DC Voltage DC Equations for Current Channels Channel Range 4-20 mA 0-50 mA Equation Name Current DC CurrentDC Equation Description Current DC Current DC If the physical measurement is same as the measurement that the built-in equation generates, you can pick the built-in equation when you configure the channel. If built-in equations do not meet the requirement, you can create a custom equation. Temperature Equation For Thermistor A thermistor is a type of resistor whose resistance varies significantly with temperature. All Site-Log data loggers except LRHT-1/2 have on-board thermistor channel to record the ambient temperature. External thermistor channels of LPTH-1 are for user to connect nearly any type thermistors. The Steinhart-Hart equation is widely used for thermistors for a wide range of temperatures with high precision: When you use 'Temperature' equation for an external thermistor channel, you need to specify a, b and c coefficients which you can get from the thermistor manufacturer. SiteView User’s Manual – Microedge Instruments Inc. 76/211 The above screenshot is part of Logger Configuration dialog. After you selected "Temperature" as the equaiton for channel #1 External Thermistor, "Change Coefficients" button will display in "Action" column to allow you change those a, b and c values: SiteView User’s Manual – Microedge Instruments Inc. 77/211 After you changed those values and click "OK" button the above dialog will close. Then in the Logger Configuration Dialog once you applied the changes the equation will be transferred to the logger. Custom Equation A custom equation is a piece of script that user can create to implement the physical measurement conversion. SiteView uses .Net C# language as the script. The script or the source code is in the format of function call. A function specifies the name of the function, the types and number of parameters it expects to receive, and its return type. The body of the function implements the conversion from one unit measurement to another. A simple custom equation looks like this: public double CO2Equation(double Input) { } double output; output = (5000 / 10 ) * Input ; return output; The above equation has the name “CO2Equation”. The name must be unique and with maximum of 16 characters. The function has one parameter named Input. This value is read-only and it is the result of the caller function or the conversion from digital value to the unit measurement for that channel type if there is no caller function. In the latter case, Input refers to a value within the range of 0 – 10 volt for a 0 – 10 VDC channel type. The function must return a value, which is the result of the conversion. The above equation is illustrated below. It indicates that for the input range 0 – 10, the output is proportional to the range of 0 – 5000. For instance, A CO2 transducer has output of 0 – 10 VDC representing 0 – 5000 PPM of CO2. The transducer is connected to the 0 – 10 VDC channel of the logger. When the transducer outputs 0 Volt, the physical measurement should be 0 PPM of CO2. When the transducer outputs 10Volt, the physical measurement should be 5000 PPM of CO2. When you apply the above equation to the channel you should get the correct conversion. SiteView User’s Manual – Microedge Instruments Inc. 78/211 Output 5000 PPM 2500 PPM Input 0 5V 10 V Output = (5000 / 10) * Input Create Equation To create a custom equation: Click Equation button from Main tool bar. In the equation dialog, click Create button to create a new equation: SiteView User’s Manual – Microedge Instruments Inc. 79/211 In the pop-up dialog, enter the name and description of the equation. If the equation is a linear equation, type in the Input Value pair and Output Value pair. In the above example, the correct parameters are: Minimum Input Value = 0 Maximum Input Value = 10 Minimum Output Value = 0 Maximum Output Value = 5000 SiteView User’s Manual – Microedge Instruments Inc. 80/211 You need to choose a unit for the new equation. If this is a new unit you need to use Unit Dialog to create a unit prior to this dialog. Click OK button to close the dialog and return to the Equation dialog. The new equation is added to the equation list on the left-hand side and the contents of the equation are displayed on the right-hand side panel. Click Apply button to save the new created equation. Import/Export Equations Import/export equation function is used when a batch of equations need to be copied from one SiteView system in one computer to another SiteView system in another computer. To export a series of equations: Click Export button. In the pop-up Export Equations dialog, check each equation you want to export and click Export button. SiteView User’s Manual – Microedge Instruments Inc. 81/211 In the Save As dialog give a filename to save and click Save button to close file-save dialog. The equations were exported to an equation package file, which can be imported to other SiteView system. To import an equation package: Click Import button. Browse for the equation package file and click Open button to choose the file and close the File-Open dialog. SiteView User’s Manual – Microedge Instruments Inc. 82/211 The following Import Equation dialog appears: SiteView User’s Manual – Microedge Instruments Inc. 83/211 Check the equations you want to import from the left-hand side list and click Import button to import. Click Close button to close the Import Equation dialog. Apply Equation to Logger If you are in Logger Configuration dialog, when you click on the combo-list in the Equation column cell, all custom equations will be displayed in the list. Choose the one and click Apply button to save the equation information to the logger. SiteView User’s Manual – Microedge Instruments Inc. 84/211 Create Custom-Line Equation A custom-line equation is used when you add a custom line to the plot. The value of the new line relates to the values of other existing lines on the plot. The relationship is specified in the customline equation. A custom-line equation is similar to a standard custom equation. The only difference is a custom equation accesses Lines object instead of Logger and Channels objects. To create a custom-line equation: Click Custom-Line Equation button from Main tool bar. In the Custom-Line Equation dialog, click Create button to create a new equation: SiteView User’s Manual – Microedge Instruments Inc. 85/211 In the pop-up dialog, type in the name and click “OK” button. The new equation is added to the equation list on the left-hand side and the contents of the equation are displayed on the right-hand side panel. You may update the description of the equation and add your source code in the body of the equation. Click Apply button to save the new created equation. Add Custom-Line Equation to Plot If you have created a custom line equation, you can apply it to a new created line: 1. Open a SiteView file that you want to add a new custom line to. 2. Click on Tools -> Add Custom Line of the Plot View: 3. In the pop-up Add Custom-Line dialog pick the custom line equation you want to apply to the current plot and click OK button: SiteView User’s Manual – Microedge Instruments Inc. 86/211 A new line was added to the plot. Call/Invoke Other Custom Equations If you have created a custom equation for certain measurement conversion and this conversion may be useful to other custom equations, then you can call/invoke this equation inside other equations. All available custom equations are listed under Available Objects list: SiteView User’s Manual – Microedge Instruments Inc. 87/211 For example, if you have created DewPointEquation to calculate the dew point value and HourAverage equation to calculate the previous hour average value, you can create a third equation to call these two equations for the previous hour average value of the dew point values like this: //A custom equation for previous hour average of dew point. public double HourAveDewPoint(double Input) { double val = DewPointEquation(Input); val = HourAverage(val); return val; } SiteView User’s Manual – Microedge Instruments Inc. 88/211 CHAPTER 12 - WORK WITH UNITS What is Unit A Unit is a definite magnitude of a physical quantity, defined and adopted by convention and/or by law, that is used as a standard for measurement of the same physical quantity. For example, Temperature is a physical quantity or a Unit Category. The Celsius is a unit of Temperature that represents a definite predetermined temperature. When we say 25 Celsius (or 25°C), we actually mean 25 times the definite predetermined temperature called "Celsius". A unit category may have multiple units associated to it. For example, Fahrenheit and Kelvin are other two units under temperature category and their relationships are: Fahrenheit = 1.8 * Celsius + 32 Kelvin = Celsius + 273 In the SiteView system, each unit category can have only one primary unit. In the above example, Celsius is defined as the primary unit. Only the primary unit has its slop = 1 and intercept = 0. All other units under the same unit category relate to the primary unit. In SiteView system, each unit category can have one user selectable default unit. For example, if you are in the United States you may choose Fahrenheit as your default unit. The following tables specify the SiteView built-in units for some unit category: Temperature Category: Unit Celsius Fahrenheit Kelvin Slop 1 1.8 1 Intercept 0 32 273 Voltage Category: Unit Volt Killovolt Millivolt Microvolt Slop 1 0.001 1000 1000000 Intercept 0 0 0 0 Current Category: Unit Amp Milloamp Slop 1 1000 Intercept 0 0 SiteView User’s Manual – Microedge Instruments Inc. 89/211 Microamp 1000000 Relative Humidity Category: Unit Slop RH 1 0 Intercept 0 Unit category is used by an equation. Without the unit, the measurement calculated by the equation does not have meaning. Open Unit Category Dialog Click Unit Category button on main tool bar: The following Unit Category dialog appears: SiteView User’s Manual – Microedge Instruments Inc. 90/211 Create Unit To create a unit under existing unit category: Click Add Unit button in Unit Category dialog: The following Add New Unit dialog appears: Fill out the fields in the above dialog and click “OK” button to close Add New Unit dialog. To create a unit and unit category: Click Add Unit Category button in Unit Category dialog: SiteView User’s Manual – Microedge Instruments Inc. 91/211 The following Add New Unit Category dialog appears: Add each unit under the new category and click OK button to close Add New Unit Category dialog. Import/Export Units To export unit package: Click Export Units button in Unit Category dialog: The following Export Units dialog appears: SiteView User’s Manual – Microedge Instruments Inc. 92/211 Check the units you want to export and click Export button to choose a file to save. Click Close button to close Export Units dialog. To import a unit package: Click Import Units button in Unit Category dialog. The following Open dialog appears: SiteView User’s Manual – Microedge Instruments Inc. 93/211 Browse for the unit package file in Open dialog. The following Import Unit dialog appears: SiteView User’s Manual – Microedge Instruments Inc. 94/211 Check units you want to import to and click Import button to add the units to the system. Use Unit Apply Unit Category in Equation A unit category is used by an equation. When you create an equation you need to specify what unit category you want the equation to use. You choose the unit in Step 4 of New Equation dialog: Change Unit If you prefer other unit other than the existing default unit under Unit Category, you can change it in Unit Category dialog: In the above diagram, unit Celsius is the current default unit under Temperature category. You can change this setting by checking Default check box for Fahrenheit or Kelvin row. Change Unit in Plot If you prefer a different unit for a channel displayed in the plot, you can change this by selecting a different unit under Unit column in Axis Tab: SiteView User’s Manual – Microedge Instruments Inc. 95/211 CHAPTER 13 - WORK WITH SETTINGS & PLOT PREFERENCES Plot Preferences Plot Preferences are the properties regarding SiteView plot view. The default Plot Preferences are applied in a new created SiteView file. All plot preferences are managed in Plot Preferences dialog opened by clicking Plot Preferences main tool bar button: The following Plot Preferences appears: You may add, delete and set default for the selected plot preferences item in the left-hand side list. SiteView User’s Manual – Microedge Instruments Inc. 96/211 Any property you changed will reflect the changes in the Preview plot. Click OK or Apply button to save the changes. Global Settings Global Settings are the properties categorized in groups that are used for the default settings in SiteView. Global Settings are managed by Global Settings dialog opened by clicking Global Settings main menu item: The following Global Settings dialog appears: SiteView User’s Manual – Microedge Instruments Inc. 97/211 General section specifies the general properties like if Log Panel and Comm Panel are displayed in the main frame, how the tool bars and buttons are rendered etc. Download section specifies the default download folder and the format of the default file name etc. Diagnostic Log specifies if the log information will be saved to the file and the default folder for the log file. Real-Time Log specifies if the real-time log will be saved to the file and the default file name format. Alarm specifies when an alarm notification is received how SiteView acts on it. Modem specifies how to initialize a Modem. USB Device Server specifies the properties when SiteView enables USB Device Service. User Account manages the user accounts. Please refer to Global Settings User Interface References chapter for detailed explanation for each field. SiteView User’s Manual – Microedge Instruments Inc. 98/211 CHAPTER 14 – UPGRADE SITEVIEW & FIRMWARE SiteView 1.0.1 or above has a new feature to on-line upgrade SiteView and data logger firmware. Please do this periodically for the bug-fixing and updates. Upgrade SiteView Click Get Latest SiteView menu item|: Click Yes in the following dialog: SiteView will check and install the latest updates. Upgrade Firmware If SiteView found the current firmware of the connected data logger is older than the firmware SiteView has, SiteView will show “Upgrade Firmware” button at the right side of the status form: If you would like to upgrade the firmware click “Upgrade Firmware” button. The following dialog will show. If you decide to upgrade the firmware be sure to download the data first. Upgrading of the firmware will cause clearing of the data in the logger. SiteView User’s Manual – Microedge Instruments Inc. 99/211 Click Yes button to upgrade the firmware. SiteView User’s Manual – Microedge Instruments Inc. 100/211 CHAPTER 15 - WORK WITH PLOT Chapter 14 - Work With Plot After the data of the logger is downloaded into the computer, the data is saved in SiteView file (with “svf” as the file extension) and the data is presented in plot and tabular views by SiteView: The top section is the plot view and the bottom section contains Dataset, Statistics, Axis settings, Line settings, Plot Title settings, Legend settings and Others settings. Basic Views The view of the plot contains Plot View, Tabular View and Statistics. SiteView User’s Manual – Microedge Instruments Inc. 101/211 Plot View The above plot view shows the downloaded data of a logger. X axis shows the date and time the data is within. Two Y axes show the measurement ranges with the units in the current time frame. Title of the plot is located at the top section. Below the Title is the Legend, then the actual plot. You can add curve annotations and labels in the plot area. You can change the looks and feels by going through Change plot settings page. Tabular View The above tabular view shows the downloaded data of the logger in the detailed tabular format. The first column shows the date and time when the measurement was taken, the following columns display the data values of all recorded channels. SiteView User’s Manual – Microedge Instruments Inc. 102/211 Statistics Plot statistics are a set of properties about the opened SiteView files and the current plot view. The statistics are under Statistics tab page: If you opened multiple files, each statistics information associated with its file is listed separately. Each statistics information starts with its file name. Then it specifies the logger type, sampling interval, logged time and total data points. If you have zoomed the plot, it specifies the properties for the zoomed view. At last it specifies the properties about each channel: channel type, calibration information, minimum, mean and maximum values etc. Open SiteView Files Open SiteView files You can open one or more SiteView files into one plot view. Click Open SiteView File under File menu: Choose one or more SiteView files from the pop-up Open file dialog: SiteView User’s Manual – Microedge Instruments Inc. 103/211 In order to choose multiple files, press Ctrl key while selecting the files. Merge SiteView files With Current Plot If you are already in a SiteView Plot View/Window, you can add another SiteView files to the existing plot by clicking Add menu item under File menu of the plot view: SiteView User’s Manual – Microedge Instruments Inc. 104/211 Save and Export Plot Save the Change If you have made some changes to the plot view, you can save the plot back to the SiteView file: Click Save menu item under File menu of the plot view: If the file was saved successfully, you will get the confirmation dialog like this: Save a copy of SiteViw File Click Save As… toolbar button: SiteView User’s Manual – Microedge Instruments Inc. 105/211 Edit a new file name in the pop-up Save As dialog and click Save button to save the file: Save As Image File The plot view can be saved to the following image file formats: Enhanced Metafile Format (EMF) Portable Network Graphics (PNG) Graphics Interchange Format (GIF) Joint Photographic Experts Group (JPEG) Tagged Image File Format (TIFF) Bitmat (BMP) Click Save As Image File menu item under File menu of the plot view: SiteView User’s Manual – Microedge Instruments Inc. 106/211 Enter the file name you want to save and select a image file format from Save as type list. Then click Save button to save the image: SiteView User’s Manual – Microedge Instruments Inc. 107/211 Save as Text File The logger and channel properties and the current tabular data can be saved in text file format. The file is TAB separated and can be opened by Note Pad, Excel or other text editing software. Click Save As Text File menu item under File menu of the plot view: Enter a file name to save in the Save As dialog: SiteView User’s Manual – Microedge Instruments Inc. 108/211 If the file was saved successfully, you will get the confirmation dialog like this: Print Plot There are three sections that SiteView can print: The plot, the statistics and the dataset. To print the plot: 1. Click Print button. 2. In the pop-up dialog, select the interesting sections: SiteView User’s Manual – Microedge Instruments Inc. 109/211 3. Click OK button to display Print dialog: 4. Make changes of printer, orientation and other properties, click Print button to print out the plot. Before printing you can set up page by clicking Page Setup button or preview the plot by clicking Print Preview button. SiteView User’s Manual – Microedge Instruments Inc. 110/211 Change Plot Settings NOTE After the changes are made, you must click Apply button to apply the changes to the current plot. Change Axis Settings A plot view contains one X Axis indicating the time frame of the current view and one or more Y Axis indicating the current line scales of the current view. Each plot curve/line must associate to one X axis and one Y axis, if multiple lines share the same unit they will share the same Y axis. A Y axis can be visible or hidden by toggling “Show” check box. A Y axis can be in Auto Scale mode: the Y axis will automatically scale to the current range of the line. Or Manual Scale mode: the Y axis will use “Min Value” and “Max Value” as the scale. The Y axis can use different unit under the same unit category. For example you can choose Fahrenheit or Celsius as the unit for a temperature axis. Change Line Settings A line is the representation of the readings of a channel for the current time frame. The line can be visible or hidden by toggling Visible check box. The description of the line shows in the legend area of the plot. You may change to a different equation to force the readings of the line to be recalculated based on the new equation. SiteView User’s Manual – Microedge Instruments Inc. 111/211 Change Plot Title Settings Plot Title is the text that is displayed on the top of the plot view. When the SiteView file was first created the description of the logger was chosen to be the plot title. After the plot was loaded, text of the title, the font and the colour of the text can be changed via Plot Title tab page. Change Legend Settings Each plot view contains a legend shows each line’s name/description. By default the descriptions of all channels were selected to be the legend when the SiteView file was first created. You can change the legend’s location, the font and the visibility by accessing Legend tab page: SiteView User’s Manual – Microedge Instruments Inc. 112/211 Change Other Settings When a SiteView file was first created, the current default Plot Preferences entry was used to generate the properties of the plot view. When you are in the plot view, those properties can be changed by access Others tab page: Zoom Plot Zooming of the plot is to adjust the scales of axes. Zoom-In Zoom-In is to focus on one section of the plot so it can be displayed in details. There are two types of Zoom-In: Box Zoom: Zoom the plot to the enclosed area, which involves both X and Y axes’ changing. Scale Zoom: Zoom the plot to the enclosed area, which only affects the time axis (X axis). The Y axis will be automatically adjusted based on the scale settings. Switching between Box Zoom and Scale Zoom can be achieved by clicking on the tool bar buttons: To Zoom In: Press down the mouse at a spot of the plot, drag the mouse to make a rectangle, release the mouse. The plot will be zoomed into the enclosed area: Before Scale Zoom: SiteView User’s Manual – Microedge Instruments Inc. 113/211 After Scale Zoom: Before Box Zoom: SiteView User’s Manual – Microedge Instruments Inc. 114/211 After Box Zoom: Zoom-Out Zoom-Out is to restore the axes’ scales to the previous view. Click Zoom Out button to zoom out the view. Un-zoom-All Un-zoom All is to restore the axes’ scales to the first view. SiteView User’s Manual – Microedge Instruments Inc. 115/211 Click Un-zoom All button to zoom the plot to the first view. Time-Zoom Time-Zoom zooms the plot to the specific time frame. Click Time Zoom button to display the time span selection dialog: Pick the start and end time and click OK button to zoom the plot to the specified time span. Add Custom Channels A custom channel is a virtual channel that can be added to the plot. A custom channel is useful when you need a new measurement in addition to the measurements of existing physical channels and the new measurement relays to those existing channels. For example, if a logger has one temperature channel and one relative humidity channel, and you want to calculate the dew point from the temperature and the relative humidity measurements, a custom channel can be added to the plot for the new dew point measurement. To add a custom channel: Click Add Custom Channel menu item under Tools menu: SiteView User’s Manual – Microedge Instruments Inc. 116/211 Choose an equation in the Add Custom Channel dialog and click OK button: Add Custom Lines A custom Line is a line/curve that can be added to the plot and resolves its line values from the existing lines in the plot. For example, if there are two lines representing voltage and current readings, you can add the third line representing the power consumption for the current time frame. To add a custom Line: Click Add Custom Line menu item under Tools menu: SiteView User’s Manual – Microedge Instruments Inc. 117/211 Choose an equation in Add Custom Line dialog and click OK button: Add Annotation and Comment An annotation is a note (label) that user can add to the plot area to explain an associated data point. A comment is a note (label) that user can add to the plot area to explain the plot. The difference between an annotation and a comment are: 1. An annotation goes with the data point. If the data point is zoomed off the plot area, the associated annotation will be off the plot area. Whereas a comment does not associate to any data point, it associates to the plot. Thus the location of a comment refers to the coordinates of the plot area. 2. An annotation has an arrow links the annotation to the data point. Whereas a comment does not have an arrow. Add an Annotation 1. Move the mouse over a data point of a plot curve. Once the mouse pointer changed to hand icon, right click to display the context menu: SiteView User’s Manual – Microedge Instruments Inc. 118/211 2. Click Add Annotation menu item. A default annotation was added to the plot area and was pointed to the highlighted data point: 3. The default text of the annotation contains the date and time and the value of the data point. The default colour of the text is the colour of the plot curve the data point belongs to. To change the properties of the annotation, double click on the annotation to display the Annotation Properties dialog: Add a Comment 1. Move the mouse to the interesting place inside the plot area, right click to display the context menu: SiteView User’s Manual – Microedge Instruments Inc. 119/211 2. 3. Click Add Comment menu item. A default comment was added to the place where the mouse pointed. The default colour of the text is the Comment Colour under Plot Preferences. To change the properties of the comment, double click on the comment to display the Comment Properties dialog: Other Features of Plot Use Context Menu Context Menu is a pop-up menu displayed when the mouse is right clicked on the plot area. The number of enabled and visible menu items depends on the area and object the mouse is clicked on. A right mouse click on a blank area will display the following context menu: SiteView User’s Manual – Microedge Instruments Inc. 120/211 Note that Zoom Out and Unzoom All are disabled. This is because the plot’s zoom is at the first level. If you have zoomed in once or more times, those two items will be enabled. Add Comment item is displayed to allow adding a comment at the spot the mouse was just clicked at. A right mouse click on a previously added comment will display the following context menu: Property item is visible to allow displaying the Comment Properties dialog for editing the comment. Delete Comment item is visible to allow deleting the comment. A right moue click on a data point of a curve will display the following menu: Add Annotation item is visible to allow adding an annotation. SiteView User’s Manual – Microedge Instruments Inc. 121/211 The default annotation will use the colour of the data point as its text and arrow colour, and the content of the label will be [date and time] + [measurement value] + [measurement unit]. A right mouse click on the previously added annotation will display the following menu: Property item is visible to allow displaying Annotation Properties dialog for editing the annotation. Delete Annotation item is visible to allow deleting the annotation. Copy Plot to Clipboard The plot view can be copied to the clipboard by clicking on Copy button or Copy menu item: Show Point Value If you turn on Show Point Value, when the mouse is hovering on any data point on the plot the time and the value will be displayed in the tip box: SiteView User’s Manual – Microedge Instruments Inc. 122/211 To toggle on/off Show Point Value property, click on Show Point Value button: View Mouse-Point Values When the mouse is moving on the plot area, the status bar of the plot window will display each line’s value at the time stamp where the mouse is pointing at: Fast Draw Mode If the plot is in Fast Draw Mode, the plot will figure out the appropriate number of points to draw based on the current view port size. This will save dramatic drawing time if the plot contains big amount of data points. Note: In Fast Draw Mode, there is a chance where some spike data points may be missed out. To toggle on/off Fast Draw Mode, click on Fast Draw Mode menu item under View of the plot view. SiteView User’s Manual – Microedge Instruments Inc. 123/211 Change View Layout By default, the plot view is at the top and the dataset view is at the bottom side of the plot window. This is Horizontal View Layout. You can toggle between horizontal and vertical view layout by clicking on Horizontal View and Vertical View button: SiteView User’s Manual – Microedge Instruments Inc. 124/211 CHAPTER 16 - USER INTERFACE REFERENCES Menu Bar File Open SiteView File: Click to open SiteView files and load them into the plot. Open SiteView Daabase File: Click to open SiteView Database files and load them into the plot. For detailed information about SiteView Database file please refer to the manual of logSync application or contact Microedge. Open Equation: Click to open an equation package file and import it to the system. Open Unit: Click to open a unit package file and import it to the system. Open Diagnostic Log: Click to open a diagnostic log file. Recent Files: Click to view and open a recent opened file. Exit: Click to close SiteView application. SiteView User’s Manual – Microedge Instruments Inc. 125/211 View Diagnostic Log Panel: Toggle to show/hide the diagnostic log panel. Comm Bar: Toggle to show/hide the communication panel. Log Plot in Separate Window: Toggle to either display the plot in a separate window or display the window within the current main frame. Tools Unit Category: Click to display Unit Category dialog for managing the units. Equation: Click to display Equation dialog for managing the equations. Custom-Line Equation: Click to display Custom Line Equation dialog for managing the custom line equations. SiteView User’s Manual – Microedge Instruments Inc. 126/211 Plot Preferences: Click to display Plot Preferences dialog for managing the plot preferences. Global Settings: Click to display Global Settings dialog for managing the global wise settings. Special Characters: Click to display Special Characters dialog for input of special characters. Alarm Center: Click to display Alarm Center dialog for receiving the alarm notifications. Enable USB Device Service: Click to enable USB Device Service. When enabled, other computers can access the data loggers connected to the USB ports of this computer. Help Contents: Click to show the contents of the help: Index: Click to show the index of the help: Get Latest SiteView: Click to on-line check if there is a latest SiteView to upgrade. About: Click to show the About dialog of SiteView. About dialog shows the version of SiteView and company information. You can also re-activate SiteView from About dialog. SiteView User’s Manual – Microedge Instruments Inc. 127/211 Tool Bar Tool Bar provides the shortcut for the respective menu items. Unit Category: Same as Unit Category menu item. Equation: Same as Equation menu item. Custom-Line Equation: Same as Custom-Line Equation menu item. Plot Preferences: Same as Plot Preferences menu item. Special Characters: Same as Special Characters menu item. USB Device Service: Pull down button to display USB Device Service related menu items: SiteView User’s Manual – Microedge Instruments Inc. 128/211 Enable/Disable USB Device Service: click to enable/disable the service. Show Service Log: click to show the service log dialog: Log in/off: Log in to the system or log off the system. Communication Bar Communication Bar handles the communications between SiteView and data loggers. SiteView supports USB, USB Device Server, Serial Port and Serial Device Server communications that are handled by their tab pages of the Communication Bar. SiteView User’s Manual – Microedge Instruments Inc. 129/211 USB This tab page handles the communications over USB ports of the computer. All Site-Log data logger have Plug-And-Play feature in that when the logger is plugged in one of the USB ports the logger icon will show in the USB Port list. If the logger is unplugged from the port the logger icon will be removed from the list. Contact: Click this button to start the communication with a data logger connected to a USB port of the computer. If the communication is successful, the logger status page will appear in the main frame. SiteView User’s Manual – Microedge Instruments Inc. 130/211 Before clicking this button please make sure you have selected a logger icon in the list. Scan: Click this button to scan the USB bus for connected data loggers. Property: This section deals with the properties of the USB communications. Timeout: This field specifies how much time in millisecond SiteView waits before cancelling the communication. Retry: This field specifies how many times SiteView retry the communication when communication failed. Packet Size: This filed specifies the size of a packet for download. The bigger the packet size is the faster the download is. In case the communication is poor you may lower the packet size. Change Properties: Click this button to open a dialog for editing the properties. USB Device Server This tab page handles the communications with a remote USB Device Server. SiteView User’s Manual – Microedge Instruments Inc. 131/211 Contact: Click this button to start the communication with a remote USB Device Server. The Server can be a Site USB Device Server hardware or another computer with USB Device Service enabled.. If the communication is successful, the logger icon will appear under the connection. To display the status page of the logger you can double click the logger icon or select the logger icon and click Contact again. Property: This section deals with the properties of the TCP. IP Address: This field specifies the IP address of the remote computer you want to communicate with. Port: This field specifies the port that the remote computer will use to receive the communication request. Timeout: This field specifies how much time in millisecond SiteView waits before cancelling the communication. Retry: SiteView User’s Manual – Microedge Instruments Inc. 132/211 This field specifies how many times SiteView retry the communication when communication failed. Packet Size: This filed specifies the size of a packet for download. The bigger the packet size is the faster the download is. In case the communication is poor you may lower the packet size. Password: This filed specifies the password that this computer will send to the remote computer for the client authorizaiton. Change Properties: Click this button to open a dialog for editing the properties. New: Click this button to create a new connection icon. Delete: Click this button to delete the highlighted connection icon. SiteView User’s Manual – Microedge Instruments Inc. 133/211 Close: Click this button to disconnect the communications to the selected IP connection. Serial Port This tab page handles the communications over COM ports of the computer. Contact: Click this button to start the communication with a data logger connected to a COM port of the computer. If the communication is successful, the logger status page will appear in the main frame. SiteView User’s Manual – Microedge Instruments Inc. 134/211 Before clicking this button, please make sure the logger is connected to the COM port you have highlighted. Property: This section deals with the properties of the COM Port communications. Timeout: This field specifies how much time in millisecond SiteView waits before cancelling the communication. Retry: This field specifies how many times SiteView retry the communication when communication failed. Baud Rate: This field specifies the communication speed over the selected COM port. The faster the baud rate is the faster the download is. In case of poor communications you may need to lower the baud rate. Packet Size: This filed specifies the size of a packet for download. The bigger the packet size is the faster the download is. In case the communication is poor you may lower the packet size. Is Modem Connected: This check box specifies if the COM port is for Modem communication. Check this box if you are using the Modem. Phone No.: This field specifies the phone number SiteView will dial for the Modem communications. Modem Init.: This field specifies the initialization string SiteView will send to Modem before using it. Change Properties: Click this button to open a dialog for editing the properties. SiteView User’s Manual – Microedge Instruments Inc. 135/211 Close: Click this button to close the selected COM port. Serial Device Server (Ethernet) This tab page handles the communications over Ethernet. SiteView User’s Manual – Microedge Instruments Inc. 136/211 Contact: Click this button to start the communication with a data logger connected to the Device Server device that has the same IP address of the selected icon. If the communication is successful, the logger status page will appear in the main frame. Property: This section deals with the properties of the Ethernet port. IP Address: This field specifies the IP address of the remote serial device server. Port: This field specifies the port that the remote device server will use to receive the communication request. Timeout: This field specifies how much time in millisecond SiteView waits before cancelling the communication. SiteView User’s Manual – Microedge Instruments Inc. 137/211 Retry: This field specifies how many times SiteView retry the communication when communication failed. Packet Size: This filed specifies the size of a packet for download. The bigger the packet size is the faster the download is. In case the communication is poor you may lower the packet size. Change Properties: Click this button to open a dialog for editing the properties. New: Click this button to create a new connection icon. Delete: Click this button to delete the highlighted connection icon. Close: Click this button to disconnect the communications to the selected IP connection. Logger Status View Logger Status View can be displayed by double clicking on the Connection Icon in Communication bar. SiteView User’s Manual – Microedge Instruments Inc. 138/211 Tool Bar Buttons Real-Time: Click to display Real-Time dialog. Please refer to Real-Time Dialog for detailed explanation. Refresh: Click to communicate with the logger and update each field. Download: Click to start download the data of the logger. Refer to Download Dialog for detailed explanation. Configure: Click to configure the logger for new session. Refer to Logger Configuration Dialog for detailed explanation. Clear: Click to clear the logger and start a new session. SiteView User’s Manual – Microedge Instruments Inc. 139/211 Calibrate: Click to start on-line/off-line calibration of a channel: General This sub tab page displays the general properties of the logger. LED Light When Sampling: If this check box is checked the on-board LED is enabled. Description: This field specifies the description of the logger. The maximum characters for this field is 30. Sampling Interval: This field specifies the current sampling interval of the logger. Sampling interval is the time delay between two samples the logger is taking. Most Site-Log loggers have the interval from 20 milliseconds to 12 hours. Start Time: This field specifies the time when the logger took the first sample or in FIFO mode, the earliest sample time. End Time: This field specifies the time when the logger took the last sample. If the logger is still operating, the time refers to the last sample time before SiteView contacted the logger. Logging Method: This field specifies if the logger will continue recording data (FIFO) or stop recording data when the memory is full. Total Memory: This field specifies the total available on-board memory for logging. User Selected Memory: This field specifies the memory size that user have selected for logging. If the total memory is capable of logging for one year but you only need one month of data, you may select one month as the logging time span and. In this case the User Selected Memory will be smaller than the Total Memory and you always get one month of data from the logger. The logger was last configured at: SiteView User’s Manual – Microedge Instruments Inc. 140/211 This field specifies the last time when it was configured. The logger is currently logging data: This field specifies the current logging status of the logger. Channel Level Properties: Channel#: This column specifies the channel index. Each channel of the logger is identified by the channel#. Enabled: This column specified if the channel is enabled or disabled. The logger will not log data for any disabled channel. Description: This column specified the description of the channel, maximum of 30 characters. Equation: This column specified the equation been used by the channel. Please refer to Logger Configuration Dialog for the detailed explanation. Cali. Low / Cali. High: These columns specify the calibration parameters the channel contains. Please refer to Logger Configuration Dialog for the detailed explanation. Alarm & Excitation This sub tab page displays the properties regarding the alarm and excitation. By clicking the “Alarm & Excitation” tab page caption, the following page will appear: Please refer to Logger Configuration Dialog for the detailed explanation for each field. SiteView User’s Manual – Microedge Instruments Inc. 141/211 Alarm/Excitation Selection This field specifies how A1 and A2/E terminals are being controlled by alarm state and/or excitation settings. Alarm Sent Out Selection This field specifies how the alarm notification is been sent out when in alarm state. Alarm-On Delay This filed specifies a time delay before sending out alarm notification if there is an alarm. This applies to both terminal strips and the dial-out command which is sent out via communications port. Alarm-Off Delay This filed specifies a time delay from the alarm is off the threshold to the alarm is cleared. Dial-out Number This field specifies the telephone number to dial out if the “Alarm Send Out Selection” was set for MODEM. Excitation Warm-up Delay This field specify the warm-up delay from the time the excitation control is turned on to the time the logger starts to sample the current reading. Channel Alarm Settings This table specifies how each channel controls alarm state by: Alarm Enabled: Low & High Alarm: Unit: Specify if the channel is connected with the alarm state. Specify the alarm thresholds, if the reading is beyond these thresholds, the alarm is triggered. Specify the unit of the alarm thresholds. SiteView User’s Manual – Microedge Instruments Inc. 142/211 Download Dialog The Download dialog can be displayed by clicking on Download tool bar button in the logger status page. Filename & Browse These fields specify the full file path the downloaded data will be saved into. Clicking on “Browse” button will display “File Save” dialog where you can edit or choose a file name. SiteView User’s Manual – Microedge Instruments Inc. 143/211 Start Time & End Time These fields specify the desired start and end time for the data to download. You can use both scroll bar or the calendar control to change both start time and end time. Logger Configuration Dialog To display Logger Configuration Dialog: 1. Double click the Connection icon in Communication bar. 2. Click “Configure” button on the logger status page. General Settings Description: Description specifies the information about the logging session with a maximum of 30 characters. It will be the default Title section of the plot in the plot view. SiteView User’s Manual – Microedge Instruments Inc. 144/211 Sampling Interval: This field specifies the time span the logger will wait between two measurements sampling. Valid settings are: Sampling Interval for Fast Sampling Mode 20, 30, …90 milliseconds * 100, 200… 900 milliseconds * 1,2,3,4 seconds * Sampling Interval for Normal Sampling Mode 5 seconds to 9 seconds in 1-second increment 10 seconds to 50 seconds in 10-second increment 1 minute to 59 minutes with 1-minute increment 1 hour to 12 hour with 1-hour increment For LRHT-1/2 logger, the minimum sampling interval is one second. If the sampling interval you set is 4 seconds or faster, the logger must be powered by an external power supply during the logging period of time. Making changes to the Sampling Interval will affect Total Time Span fields. On-Board LED Check this field to enable the on-board status LED. If the LED is enabled it will flash each time when it samples data to indicate: 1. The logging is active if the LED is in green. 2. The logger is in alarm state if the LED is in red. 3. The battery will die soon if the LED is in amber. If you do not need LED indication, please uncheck this field to increase the battery life. When Memory Full If you want the logger to stop logging when the memory is full select Stop logging. If you want the logger to continue logging and overwrite the oldest data with new data (FIFO), you choose Continue logging. Time to Start & Time to End These two fields specify the desired time the logger will start logging data and the time to stop logging data. Making changes to the Time to End will affect Total Time Span fields mentioned later. If you have selected the “Continue logging” field, when the memory is full, both start time and end time will move forward accordingly. Total Time Span These fields are an alternate way to specify the total logging time from the start time you specified above. Changing on these fields will affect the Time to End field. SiteView User’s Manual – Microedge Instruments Inc. 145/211 Memory Usage: Specify the memory usage for the new setting. If you change Time to Start and Time to End, Total Time Span will change accordingly. Channel Settings Enabled Check this field to enable this channel for logging. Channel Range This field specifies the channel type and range the channel will use. The available settings for each channel depend on the logger type. Description This field specifies the information for the channel using a maximum of 30 characters. Equation This field specifies the equation used for the channel. For the detailed instructions on how to create a custom equation please refer to the Work with Equation and Equation References chapters. Cali. Low & Cali. High These two fields specify the custom calibration values that are used for measurement adjustment. Custom Channels: A custom channel is a virtual channel that SiteView can add to a data logger. Because there is no physical measurement source for this kind of channel, the logger can not save the channel’s data in the logger’s memory. Instead, the channel’s data is parsed in SiteView after the data is downloaded to the computer. You can add maximum of eight custom channels to a logger. The following tool bar buttons are used to manage the custom channels of the logger. Click to add a custom channel. Click to remove a selected custom channel. Click to move up a selected custom channel. Click to move down a selected custom channel. SiteView User’s Manual – Microedge Instruments Inc. 146/211 Alarm and Excitation Settings Alarm/Excitation Selection This field specifies how A1 and A2/E terminals are being controlled by alarm state and/or excitation settings. Available settings are: Notify Alarm via Modem This field specifies if the alarm notification is been sent out via Mode when in alarm state. Alarm-On Delay This filed specifies a time delay before sending out alarm notification if there is an alarm. This applies to both terminal strips and the dial-out command which is sent out via communications port. SiteView User’s Manual – Microedge Instruments Inc. 147/211 Alarm-Off Delay This filed specifies a time delay after the alarm is off the threshold before the alarm is cleared. Dial-out Number This field specifies the telephone number to dial out if Notify Alarm via Modem is checked. Excitation Warm-up Delay Specify the warm-up delay between the time the excitation control is turned on and the time the logger starts to sample the current reading. Available selections: 10 to 240 seconds in 10 seconds interval. Channel Alarm Settings This table specifies how each channel controls alarm state by: Alarm Enabled: Low & High Alarm: Unit: Checking the checkbox adjacent to the selected channel determines if the channel is connected with the alarm state. Entering values defines the alarm thresholds, if the reading is beyond these thresholds, the alarm is triggered. The unit for alarm thresholds. SiteView User’s Manual – Microedge Instruments Inc. 148/211 Real-Time Dialog Real-Time dialog can be displayed by clicking on Real-Time tool bar button in the logger status page. SiteView User’s Manual – Microedge Instruments Inc. 149/211 Tool Bar Buttons: List View Visible Click to show/hide the list view panel. Chart View Visible Click to show/hide the chart view panel. Vertical View Click to display the chart and list views vertically. Horizontal View Click to display the chart and list views horizontally. Time Span This field allows changing the time span for the chart view. Available settings are: SiteView User’s Manual – Microedge Instruments Inc. 150/211 Interval: This field allows changing the sampling interval to communicate with the data logger and retrieve the readings. Available settings are from five seconds to one minute. Dataset Click to display the tabular view of the recorded measurements illustrated below: Other Settings Click Settings button to display more properties illustrated below: SiteView User’s Manual – Microedge Instruments Inc. 151/211 Line Properties: Channel#: The column specifies the channel index. Visible: This column specifies if show the line in the plot. Width: This column specifies the width of the line in the plot. Color: This column specifies the color of the line in the plot. Axis Properties: Name: This column specifies the name of the axis. Visible: This column specifies if the axis will be displayed. Auto Scale: SiteView User’s Manual – Microedge Instruments Inc. 152/211 This field specifies if the scale of the axis will be automatic or be scaled by the range specified in Min and Max columns. Min: This field specified the minimum value of the scale if the axis is manual scaled. Max: This field specified the maximum value of the scale if the axis is manual scaled. List Properties: Channel Index Visible: This field specifies if the channel’s index number will be displayed in the list view. Channel Description Visible: This field specified if the channel’s description will be displayed in the list view. Apply Channel Color To List: This field specified if the channel’s line color specified in Line Properties will be used for the text color of the list. Equation Dialog Equation dialog can be displayed by clicking on Equation main tool bar button: SiteView User’s Manual – Microedge Instruments Inc. 153/211 Tool bar Buttons Create: Click to display New Equation dialog for creating a new custom equation. Delete: Click to delete a selected equation. Import: Click to display Import Equation dialog for importing equations. Export: Click to display Export Equation dialog for exporting equations. Polynomial: Click to display Polynomial Equation dialog for generating a polynomial equation statement. SiteView User’s Manual – Microedge Instruments Inc. 154/211 Compile: Click to compile the equation script and report the result. Other Fields Equations: Display the list of the available equations. Click on one item to display the contents of the equation on the right-hand side controls. Name: Display the name of the selected equation. Description: Display the description of the selected equation. Unit: Display the measurement unit category of the selected equation. Equation Code: Display the equation script of the selected equation. Available Objects: Display a list of the objects that can be invoked /accessed by the current equation. Compile Result: Display the result of the compilation. OK button: Click to save the changes and close the dialog. Cancel button: Click to close the dialog without saving the changes. Apply button: Click to apply the changes. Help button: Click to display the help. New Equation Dialog New Equation dialog is displayed by clicking on Create button. SiteView User’s Manual – Microedge Instruments Inc. 155/211 Equation Name: Specify the name of the new equation. Equation Description: Specify the description of the new equation. Minimum Input Value: Specify the minimum channel input value. For 0 – 10 VDC channel, 0 is the minimum input value. Maximum Input Value: SiteView User’s Manual – Microedge Instruments Inc. 156/211 Specify the maximum channel input value: For 0 – 10 VDC channel, 10 is the maximum input value. Minimum Output Value: Specify the minimum equation output value when the minimum input value is applied. Maximum Output Value: Specify the maximum equation output value when the maximum input value is applied. Unit: Specify the measurement unit category the new equation will use. OK button: Close the dialog and add the default equation function in Equation Code text box. Cancel button: Close the dialog and cancel the action. Help: Display Help. Import Equation Dialog Import Equation dialog is displayed by clicking on Import button. SiteView User’s Manual – Microedge Instruments Inc. 157/211 Equations: Specify the available equations for importing. Check any item to include it in the importing equation list. Name: Specify the name of the selected equation. Description: Specify the description of the selected equation. Type: Specify the equation type. File Version: Specify the version of the equation file. Unit: Specify the unit category and all measurement units of the selected equation. Contents: Specify the equation script of the selected equation. Close button: Click to close the dialog without importing equations. Import button: Click to import the selected equations to the system. Help button: Click to display help. Export Equations Dialog This dialog is display by clicking on Export button. SiteView User’s Manual – Microedge Instruments Inc. 158/211 Equations to Export: List all equations. Check any item to include it in the exporting equation list. Export button: Click to export all selected equations to an equation pack file. You need to specify a filename in Save As dialog displayed after the click. SiteView User’s Manual – Microedge Instruments Inc. 159/211 Close button: Click to close the dialog without exporting equations. Help button: Click to display the help. Polynomial Equation Dialog This dialog is displayed by clicking on Polynomial button. SiteView User’s Manual – Microedge Instruments Inc. 160/211 Degree: Specify the degree the polynomial equation. Decimal Place: Specify the decimal place will be used to generate the equation. Make Equation button: Click to create the polynomial equation based on the input and output table. Clear button: Click to clear the table. Close button: Click to close the dialog. Copy the Code to Clipboard and Return button: Click to copy the generated code to the clipboard and close the dialog. Help button: SiteView User’s Manual – Microedge Instruments Inc. 161/211 Click to display the help. Input & Output: This table specifies a list of input and output values used to generate the polynomial equation. Custom Line Equation Dialog Custom Line Equation dialog can be display by clicking on Custom Line Equation main tool bar button. SiteView User’s Manual – Microedge Instruments Inc. 162/211 Custom Line Equation dialog is similar with Equation dialog. Please refer to Equation dialog for the explanation of each field. Unit Category Dialog Unit Category dialog can be displayed by clicking on Unit Category main tool bar button. Tool bar buttons Add Unit Category: Click to display Add New Unit Category dialog for adding a new unit category. Delete Unit Category: Click to delete a unit category and all its units. Export Units: Click to display Export Units dialog for exporting units. SiteView User’s Manual – Microedge Instruments Inc. 163/211 Import Units: Click to display Import Units dialog for importing units. Add Unit: Click to display Add Unit dialog for adding a unit to the selected unit category. Delete Unit: Click to delete a selected unit. Other Fields Unit Category List: A list of all available unit categories. Click on one item to display its contents at the right-hand side. Unit List: A list of all available units for the selected unit category. Unit Category: Specify what unit category the unit belongs to. Unit: Specify the name of the unit. Symbol: Specify the symbol for the selected unit. Slope: Specify the slope for the selected unit. Intercept: Specify the intercept for the selected unit. Decimal Place: Specify the decimal place for the selected unit. Default: Specify if the unit will be the default unit for the selected category. Auto Scale Specify if the Y axis for this unit in the plot will scale automatically or manually to the span of the following Min and Max parameters. Min: Specify the minimum value of the Y-axis if this unit is used by a plot and when the scale property is set to manual. SiteView User’s Manual – Microedge Instruments Inc. 164/211 Max: Specify the maximum value of the Y-Axis if this unit is used by a plot and when the scale property is set to manual. Cancel button: Click to close the dialog without saving the changes. OK button: Click to close the dialog and save the changes. Apply button: Click to save the changes. Help button: Click to display the help. Add New Unit Category Dialog Add New Unit Category dialog is display by clicking on Add Unit Category tool bar button. Unit Category: Specify the name of the new unit category. Units: SiteView User’s Manual – Microedge Instruments Inc. 165/211 Specify the list of the new units under the new unit category. Reserved Unit Category Names: Specify the list of the existing category names. A new unit category name must be unique. Cancel button: Click to close the dialog without adding the new unit category. OK button: Click to close the dialog and add the new units. Help button: Click to display the help. Export Units Dialog Export Units dialog is displayed by clicking on Export Units tool bar button. Units to Export: A list of all unit categories. Check any item to include it in the exporting list. Close button: Click to close the dialog. Export button: SiteView User’s Manual – Microedge Instruments Inc. 166/211 Click to export the selected units to a unit pack file. Help button: Click to display the help. Import Units Dialog Import Units dialog is displayed by clicking on Import Units tool bar button. Unit Categories: A list of the unit categories contained in the unit pack file. Check any one to include it in the importing list. Units: A list of units under the selected unit category. Close button: Click to close the dialog. Import button: Click to import the selected unit categories to the system. Help button: Click to display the help. Plot Preference Dialog Plot Preference dialog can be displayed by clicking on Plot Preferences main tool bar button. SiteView User’s Manual – Microedge Instruments Inc. 167/211 Buttons Add: Click to add a new plot preference. Set as Default: Click to set the selected item as the default preference. Delete: Click to delete the selected item. Cancel: SiteView User’s Manual – Microedge Instruments Inc. 168/211 Click to close the dialog without saving the changes. OK: Click to close the dialog and save the changes. Help: Click to display the help. Other fields Plot Preferences: List of the available plot preferences. Click on any item to display its contents at the right-hand side. Plot Panel Back Colour: Specify the colours of plot panel and plot area colours and their colour gradient. Plot Title: Specify the properties of the plot title: contents, colour, visibility, and font. Axis and Grid: Specify the grid colour and visibility. Axis font and if Y-Axis does auto scale. Legend: Specify the location, font and visibility of the legend. Plot Comment: Specify the colour and font of the plot comment. Channel Colour Order: Specify the colour will be used for each channel number from 1 to 60. Preview: Display the plot reflects the current preferences. New Plot Prefernce This dialog is displayed by clicking on Add button. SiteView User’s Manual – Microedge Instruments Inc. 169/211 Description: Specify the description of the plot preference. Derive From: Specify which existing plot preference to derive the new one from. Cancel button: Click to close the dialog without add the plot preference. OK button: Click to close the dialog and add the new plot preference. Help button: Click to display the help. Diagnostic Log Panel Diagnostic Log View can be displayed by checking View -> Diagnostic Log Panel main menu item: SiteView User’s Manual – Microedge Instruments Inc. 170/211 Time: Specify the date and time the log item is added. Reporter: Specify who reports the log. Log: Specify the contents of the log item. SiteView User’s Manual – Microedge Instruments Inc. 171/211 Global Setting Dialog General Load Plot In Separate Window: This field specifies that when SiteView files are being opened, the plot will be loaded inside the main frame of SiteView or in a separate window. Log Panel Visible: This field specifies if the information log panel is displayed inside the main frame. Check this field to make it visible. Comm Bar Visible: This field specifies if the Communication bar is displayed inside the main frame. Check this field to make it visible. Tool bar Button Display Style: This field specifies how the tool bar buttons are displayed. Available selections are: “Image”, “Image + Text” and “Text”. SiteView User’s Manual – Microedge Instruments Inc. 172/211 Tool bar and Menu bar Render Mode: This field specifies how the tool bar and menu bar is displayed. Available selections are: “System” and “Professional”. Download Default Download Folder: This field specifies the default folder for the downloaded files. “Browse” /”…” button is used to change to a new folder. Download File Prefix: This field specifies the prefix of the formatted file name. Download Filename Format: This field specifies how the default file name will be formed when you download a logger. Available selections are: SiteView User’s Manual – Microedge Instruments Inc. 173/211 Prefix + Serial Number + Date + Time Serial Number + Date + Time Serial Number Date + Time Prefix + Serial Number Prefix + Date + Time Display Plot After Download: This field specifies if the plot will be displayed after the data is downloaded and saved to the SiteView file. Check this field to show the plot automatically after the download. Diagnostic Log Save Diagnostic Log to: These fields specify if the diagnostic log will be saved to a file and the folder for the log. Browse or “…” button is used to browse for a new folder. SiteView User’s Manual – Microedge Instruments Inc. 174/211 Real-Time Log Save Real-time Log to File: This field specifies if the real-time log will be saved to the file. The real-time log is a stream of real-time readings when you have “Real-Time” display opened. Split Real-time File by: This field specifies when the real-time log will be saved to a file, how the file been split. Available selections are “Daily” or “Monthly”. Save Real-time File in: This field specifies the folder to save the real-time log files. Browse or “…” button is used to change to a different folder. SiteView User’s Manual – Microedge Instruments Inc. 175/211 Alarm Run Executable/Play Music: This field specifies, when an alarm notification is received, if run an executable file or play the music file specified in the give text box. “…” button is used to choose a different file. Test: Click this button to test if the file is valid to run or play. Send Email To: The check box specifies, when an alarm notification is received, if an email will be sent out. The text box specifies the email address to send to. Send out a Test Email: Click this button to send out a test email to the email address specified. SiteView User’s Manual – Microedge Instruments Inc. 176/211 Configure SMTP Email Account: Click this button to display the SMTP configuration dialog illustrated as follows: In order to send out an email you need a SMTP email account. This dialog allows you to configure the account: SMTP Server: This text box specifies the SMTP server name. User Name: This text box specifies the user name to log on the SMTP server. Password: This text box specifies the password for the user name. Confirm Password: This text box specifies the confirmed password. Alarm Center Event Row Colors: These fields specify the text and background colors of the alarm row in the alarm center dialog. SiteView User’s Manual – Microedge Instruments Inc. 177/211 Modem Remote MODEM: A MODEM connected to the logger is called the remote MODEM. In order to establish the MODEM connection the remote MODEM must be properly configured locally before it is used remotely. Initialization String: This text box is used to specifies a series AT commands used to initialize the MODEM. Restore Default: Click this button to restore to the factory default initialization string. COM Port: This combo-list specifies which COM Port the MODEM is connected for configuration. SiteView User’s Manual – Microedge Instruments Inc. 178/211 Initialize MODEM: Click this button to transfer the initialization string to the MODEM. USB Device Server Network Port: This text box specifies the network port that the SiteView on this computer will listen on. Client SiteView must match this port in order to establish the connection with this computer. Password/Confirm Password: This text box specifies the password that the client must match in order to establish the connection with this computer. SiteView User’s Manual – Microedge Instruments Inc. 179/211 Plot Window Tool Bar Buttons Save As…: Click to save the current plot as a different file. Copy: Click to copy the plot to the clipboard. Print: Click to print the plot. Box Zoom/Scale Zoom: Toggle them to set the current zoom be box zoom or scale zoom. If box zoom is selected, the zoom will be made on the mouse-enclosed area: If scale zoom is selected, the time zoom will be based the mouse-enclosed area and the Y-Axis scales will be based on the current axis’s scale selections. SiteView User’s Manual – Microedge Instruments Inc. 180/211 Time Zoom: Click to display Select Time Span dialog for zooming on the specified time span. Un-zoom All: Click to restore the zoom back to the first level. Zoom Out: Click to restore the zoom back to the previous level. Show Point Value: Click to display the data point value when the mouse is hovering on it. SiteView User’s Manual – Microedge Instruments Inc. 181/211 Menu Items File: Add: Click to browse for one or more SiteView files to add to the current plot. Save: Click to save the current plot. Save As…: Click to save the current plot as a new file. Save As Image File: Click to save the current plot to an image file. Save As Text File: Click to save the current plot to a text file. Page Setup: SiteView User’s Manual – Microedge Instruments Inc. 182/211 Click to display Page Setup for editing page settings. Print Preview: Click to display Print Preview dialog for previewing the print. Print: Click to print the plot. The first dialog allows selecting which sections to print: The second dialog allows selecting printer and the printer properties: SiteView User’s Manual – Microedge Instruments Inc. 183/211 Exit: Click to close the plot. View: Show Point Value: Toggle to show/hide the data point value when the mouse is hovering on the data point. Fast Draw Mode: Toggle to enable/disable Fast Draw Mode. SiteView User’s Manual – Microedge Instruments Inc. 184/211 Horizontal View/Vertical View: Click on them to switch between the horizontal and vertical view of the plot. Copy: Click to copy the plot onto the clipboard. Zoom: Box Zoom/Scale Zoom: Toggle to choose either box zoom or scale zoom for zooming. Time Zoom: Click to zoom the plot on the specified time span. Un-zoom All: Click to restore the zoom to the first level. Zoom Out: Click to restore to the previous zoom. Tools: Add Custom Channel: Click to add a custom channel to the plot. Add Custom Line: Click to add a custom line to the plot. SiteView User’s Manual – Microedge Instruments Inc. 185/211 Select Time Span Dialog This dialog is displayed by clicking on Time Zoom button. Start Time: Specify the start time for the zooming. End Time: Specify the end time for the zooming. OK button: Click to zoom the specified time span. Cancel button: Click to cancel the time zoom task. Dataset View Tabular data is displayed as the first tab page of the Dataset /Plot Settings tab: Dataset: Specify the date and time of the measurement. SiteView User’s Manual – Microedge Instruments Inc. 186/211 Column 2 – X: Specify each channel’s measurement and the unit. The column head specifies the description and the unit of the channel. Statistics Statistics is displayed as the second tab page: The first row specifies the serial number, the description and the filename of the plot. The second and the third rows specify the logger type, sampling interval, start and end time and the logging duration, total data points per channel. The fourth and the fifth rows specify the start and end time, duration and data points for the zoomed section: Then the remaining rows specify the channel properties such as channel index, channel type, calibration information, minimum, maximum, mean and span values for the zoomed section, unit and description of the channel: Axis Axis View is displayed as the third tab page: SiteView User’s Manual – Microedge Instruments Inc. 187/211 Description: Specifies the description of the axis. Visible: Specifies if this axis will be displayed or hidden. Scale: Specifies if the scale of the axis will be automatic or manual. Min Value/Max Value: Specifies the scale range of the axis if the Scale was set to manual. Unit: Specifies what unit will be applied to the axis. Decimal Place: Specifies how many decimal places will be used by the axis. Alarm Zone Display Options: Specifies how to display the alarm zoon and safe zone. Available options are: Hide Both Alarm Zones Show Both Alarm Zones Show Low Alarm Zone Show High Alarm Zone Show Safe Zone If Low Alarm = 25, High Alarm = 28, the following figure shows the safe zone between the low alarm and the high alarm: SiteView User’s Manual – Microedge Instruments Inc. 188/211 Low Alarm: Specifies the low alarm value. Color: Specifies the color for the low alarm zone. High Alarm: Specifies the high alarm value. Color: Specifies the color for the high alarm zone. Safe Zoon Color: Specifies the color for the safe zone. Line Line View is displayed as the fourth tab page: Index: Specifies the index of the plot line. SiteView User’s Manual – Microedge Instruments Inc. 189/211 Visible: Specifies if the line will be visible or hidden. Description: Specifies the description (shows in the legend) of the line. Equation: Specifies what equation the line will use for data conversion. Cali. Low/Cali. High: Specifies the calibration values will be used for data adjustment. Width: Specifies the width of the line. Color: Specifies the color of the line. Style: Specifies the style of the line. Point Symbol: Specifies what symbol will be used by the data point. An example of plus symbol looks like this: Symbol Size: Specifies the size of the point symbol. Fill Below-Line: Specifies if the section underneath the line will be filled with color: SiteView User’s Manual – Microedge Instruments Inc. 190/211 Fill Color: Specifies the color to fill the Below-Line section. Action: If you have added a custom line or custom channel, this field will have a delete button allows removing the custom line or channel. Plot Title Plot Title is displayed as the fifth tab page. Text: Specifies the text of the title. Font: SiteView User’s Manual – Microedge Instruments Inc. 191/211 Specifies the font of the title. Color: Specifies the color of the title. Visible: Specifies if the title will be displayed or hidden. Legend Legend is displayed as the sixth tab page. Font: Specifies the font of the legend. Location: Specifies the location the legend will be sit. Available options are: Top, Left, Right, Bottom, Inside Top-Left, Inside Top-Right, Inside Bottom-Left, Inside Bottom-Right, Float, Top Center, Bottom Center, Top Flush Left, Bottom Flush Left. Visible: Specifies if the legend will be displayed or hidden. SiteView User’s Manual – Microedge Instruments Inc. 192/211 Others Others is displayed as the last tab page: Plot Pane: Out Area Back Color: Specifies the color of the plot pane. Gradient: (Out Area) Specifies if the color gradient will be applied to the out area color. Plot Area Back Color: Specifies the color of t he plot area. Gradient: (Plot Area) Specifies if the color gradient will be applied to the plot area color. Axis and Grid: Grid Color: Specifies the color of the grid. Grid Visible: Specifies if the grid will be displayed or hidden. Axis Font: Specifies the font for all axes. SiteView User’s Manual – Microedge Instruments Inc. 193/211 Alarm Center Connections Specify which connections Alarm Center is monitoring on. You may check any entry to enable the connection or uncheck the entry to not receive alarm notification from that connection. Alarm Events Specify the received alarm events from monitored loggers. Date/Time: Specify the date and time when the alarm was reported. Event: Specify what event the logger reported: "Report Alarm" or "Alarm Cleared". Channel: Specify which channel has alarm. Logger: Specify the identification of the alarmed logger. Sequence Number: Specify the sequence number of the alarmed logger. When alarm state is changed the sequence number is increased. SiteView User’s Manual – Microedge Instruments Inc. 194/211 Alarm State: Specify the detailed information of the event for each channel. Action: Specify the action Alarm Center has taken upon the received event. Log Display the information Alarm Center interacts with other entities. Buttons Settings: Click to display Settings dialog for editing the settings. Close: Click to close Alarm Center dialog. Stop Music: Click to stop the music if the music is playing. Help: Click to display related Help. SiteView User’s Manual – Microedge Instruments Inc. 195/211 CHAPTER 17 - EQUATION REFERENCES C# Language Source Code References Basic data types Name Description int uint short Signed Integral type Unsigned integral type Signed short integral type (-32768 to + 32767) Unsigned short integral type (0 to 65535) Signed long integral type Unsigned long integral type 64-bit floating point type 32-bit floating point type A sequence of zero or more Unicode characters. 0 – 255 integral value Unicode character Boolean type (true or false) Enumeration type Any type ushort long ulong double float String/string Byte/byte Char/char Boolean/bool enum Object/object Size (byte) 4 4 2 2 8 8 8 4 1 2 Basic Operators Name . () [] Description The dot operator (.) is used for member access. The dot operator specifies a member of a type or namespace Parentheses specify the order of operations in an expression. Parentheses are used to specify casts, or type conversions Square brackets ([]) are used for arrays, indexers, and attributes. They can also be used with pointers. Example Class1.y = 1; Y = (1 + 2 )/ 3; double value1 = 1.5; int value2 = (int) value1; Int [] array = new int[5]; ++ The increment operator (++) increments its operand by 1. The increment operator can appear before or after its operand: Int i = 0; I++; -- The decrement operator (--) decrements its Int I = 0; SiteView User’s Manual – Microedge Instruments Inc. 196/211 new + operand by 1. i--; Used to create objects and invoke constructors Class1 c = new Class1(); Int a; a = 5 + 5; The + operator can function as either a unary or a binary operator. Unary + operators are predefined for all numeric types. The result of a unary + operation on a numeric type is just the value of the operand. Binary + operators are predefined for numeric and string types. For numeric types, + computes the sum of its two operands. When one or both operands are of type string, + concatenates the string representations of the operands. - The - operator can function as either a unary or a binary operator. ! The logical negation operator (!) is a unary operator that negates its operand. It is defined for bool and returns true if and only if its operand is false. Int a; a = 5 – 5; bool val = true; if(!val) { ~ The ~ operator performs a bitwise complement operation on its operand, which has the effect of reversing each bit } byte a = 0x10; a = ~a; & The & operator can function as either a unary or a binary operator. The unary & operator returns the address of its operand. byte a = 0x10; a = a & 0x01; Binary & operators are predefined for the integral types and bool. For integral types, & computes the logical bitwise AND of its operands. For bool operands, & computes the logical AND of its operands; that is, the result is true if and only if both its operands are true. * The multiplication operator (*), which computes the product of its operands. Also, the dereference operator, which allows reading and writing to a pointer. int a = 1; a = 5 * 10; / The division operator (/) divides its first operand by its second. All numeric types have predefined division operators. int a; a = 10 /5; % The modulus operator (%) computes the remainder after dividing its first operand by its second. All numeric types have predefined modulus operators. int a ; a = 10 % 5; << The left-shift operator (<<) shifts its first operand left by the number of bits specified by its second operand. int a = 10; a <<= 8; >> The right-shift operator (>>) shifts its first operand int a = 10; SiteView User’s Manual – Microedge Instruments Inc. 197/211 right by the number of bits specified by its second operand. a >>= 1; < All numeric and enumeration types define a "less than" relational operator (<) that returns true if the first operand is less than the second, false otherwise. int a = 1; if(a < 2) { > All numeric and enumeration types define a "greater than" relational operator (>) that returns true if the first operand is greater than the second, false otherwise. } int a = 1; if(a > 2) { <= All numeric and enumeration types define a "less than or equal" relational operator (<=) that returns true if the first operand is less than or equal to the second, false otherwise. } int a = 1; if(a <= 2) { >= All numeric and enumeration types define a "greater than or equal" relational operator, >= that returns true if the first operand is greater than or equal to the second, false otherwise. } int a = 1; if(a >= 2) { == For predefined value types, the equality operator (==) returns true if the values of its operands are equal, false otherwise. For reference types other than string, == returns true if its two operands refer to the same object. For the string type, == compares the values of the strings. != & } The inequality operator (!=) returns false if its operands are equal, true otherwise. Inequality operators are predefined for all types, including string and object. User-defined types can overload the != operator. int a = 1; if(a != 2) { The & operator can function as either a unary or a binary operator. } int a = 1; a = a & 0x03; Binary & operators are predefined for the integral types and bool. For integral types, & computes the logical bitwise AND of its operands. For bool operands, & computes the logical AND of its operands; that is, the result is true if and only if both its operands are true. ^ } int a = 1; if(a == 2) { Binary ^ operators are predefined for the integral types and bool. For integral types, ^ computes the bitwise exclusive-OR of its operands. For bool operands, ^ computes the logical exclusive-or of its operands; that is, the result is true if and only if exactly one of its operands is true. SiteView User’s Manual – Microedge Instruments Inc. byte a = 0xf8; a = a ^ 0x3f; (a = 0xc7 ) 198/211 | Binary | operators are predefined for the integral types and bool. For integral types, | computes the bitwise OR of its operands. For bool operands, | computes the logical OR of its operands; that is, the result is false if and only if both its operands are false. byte a = 1; a = a | 2; (a = 3) && The conditional-AND operator (&&) performs a logical-AND of its bool operands, but only evaluates its second operand if necessary. byte a = 1, b = 0; if(a == 1 && b == 0) { } || The conditional-OR operator (||) performs a logical-OR of its bool operands, but only evaluates its second operand if necessary. byte a = 1, b = 0; if(a == 1 || b == 0) { } = The assignment operator (=) stores the value of its right-hand operand in the storage location, property, or indexer denoted by its left-hand operand and returns the value as its result. The operands must be of the same type (or the righthand operand must be implicitly convertible to the type of the left-hand operand). byte a = 1, b; b = a; += The addition assignment operator. -= The subtraction assignment operator. *= The binary multiplication assignment operator. /= The division assignment operator. %= The modulus assignment operator. &= The AND assignment operator. |= The OR assignment operator. int a = 1; a += 2; (a = 3) int a = 1; a -= 1; (a = 0) int a = 2; a *= 5; (a = 10) int a = 20; a /= 5; (a = 4) int a = 20; a %=2; (a = 0) byte a = 0x0f; a &= 0xf0; (a = 0) byte a = 0x0f; a |= 0xf0; (a = 0xff) SiteView User’s Manual – Microedge Instruments Inc. 199/211 ^= The exclusive-OR assignment operator. <<= The left-shift assignment operator. >>= The right-shift assignment operator. byte a = 0x0f; a ^= 0xf0; (a = 0xff) byte a = 0x0f; a <<= 4; (a = 0xf0) byte a = 0x0f; a >>= 1; (a = 0x07) Basic Math Methods Name Abs Acos Asin Atan Cos Exp Floor Log Log10 Max Min Pow Round Sign Sin Sinh Sqrt Description Returns the absolute value of a specified number Returns the angle whose cosine is the specified number. Return the angle whose sine in the specified number. Returns the angle whose tangent is the specified number. Returns the cosine of the specified angle. Return e raised to the specified power. Returns the largest integer less than or equal to the specified number. Returns the logarithm of a specified number. Returns the base 10 logarithm of a specified number. Returns the larger of two specified numbers. Returns the smaller of two numbers. Returns a specified number raised to the specified power. Rounds a value to the nearest integer or specified number of decimal places. Returns a value indicating the sign of a number. Returns the sine of the specified angle. Returns the hyperbolic sine of the specified number. Returns the square root of a specified SiteView User’s Manual – Microedge Instruments Inc. Example int a = -10; a = Math.Abs(a); double a ; a = Math.Exp(1); double a; a = Math.Floor(2); double a; a = Math.Log(2); double a; a = Math.Log10(2); int a = Math.Max(1,2); int a = Math.Min(1, 2); double a = Math.Pow(10,2); 200/211 Tan Tanh Truncate number. Returns the tangent of the specified angle. Returns the hyperbolic tangent of the specified angle. Calculates the integral part of a number. Accessible Objects When you write a custom equation, the following objects can be accessed: For Custom Equation: Name this Channels Channels[x] this.Channels this.CurrentChannel this.Description this.StartTime this.EndTime this.NumberOfSamples this.SampleInterval this.SerialNumber this.Channel[x].CaliLow this.Channels[x].CaliHigh this.Channels[x].ChannelHighScale this.Channels[x].ChannelLowScale this.Channels[x].ChannelType this.Channels[x].Description his.Channels[x].DigitValue this.Channels[x].Enabled tthis.Channels[x].Index this.Channels[x].Measurement For Custom-Line Equation: Name this Lines Lines[x] this.Description this.StartTime this.EndTime this.NumberOfSamples Description Current logger object. The collection of all channels. The channel object specified by the index x. Same as Channels. The current channel object. The description of the current logger object. The data start time in DateTime data type. The data end time in DateTime data type. The total number of samples the logger contain. The sampling interval in second the logger has. The serial number of the logger in string data type. The low calibration value of the specified channel. The high calibration value of the specified channel. The high scale value of the specified channel. The low scale value of the specified channel. The channel type of the specified channel. The description of the specified channel. The digital value of the specified channel. If the specified channel is enabled or disabled. The index of the specified channel. The physical measurement of the specified channel. Description Current logger object. The collection of all lines. The line object specified by the index x. The description of the current logger object. The data start time in DateTime data type. The data end time in DateTime data type. The total number of samples the logger contain. SiteView User’s Manual – Microedge Instruments Inc. 201/211 this.SampleInterval this.Linesl[x].Value The sampling interval in second the logger has. The physical measurement of the specified line. Equation Examples Dew Point Temperature The dew point temperature is the temperature at which the air can now longer hold all of its water vapour, and some of the water vapour must condense into liquid water. Because dew point temperature can be derived from the relative humidity and the temperature readings, the following equation can be used for the dew point temperature measurement. This equation is for Site-Log LRHT-1/2 data logger. In the Logger Configuration dialog, add a new custom channel to the logger and apply this equation to the channel. // A custom equation for dew point temperature. // Condition: // channel#0 of the logger must be for temperature. // channel#1 of the logger must be for relative humidity. // both channels must be enabled. public double DewPointEquation(double Input) { double logEx, dew_point, rh, temperature; temperature = Channels[0].Measurement; rh = Channels[1].Measurement; logEx = 0.66077 + 7.5 * temperature / (237.3 + temperature) + (Math.Log10(rh) - 2); dew_point = (logEx - 0.66077) * 237.3 / (0.66077 + 7.5 - logEx); return dew_point; } Carbon Dioxide Transmitter (0 – 5000 PPM) This equation is for a CO2 transmitter with the following specifications: Measurement Range: Output 0– 5000 PPM of CO2 0 – 10 VDC This equation can be used on 0 – 10 VDC or 0 – 20 VDC channel. //A custom equation for CO2 transmitter // Transmitter specifications // Measurement Range: 0 – 5000 PPM // Output: 0 – 10 VDC public double CO2Equation(double Input) { double output; output = 5000 * Input / 10; return output; } SiteView User’s Manual – Microedge Instruments Inc. 202/211 External Thermistor This equation can be used for any of the external channel of LRTH-1 data logger. The logger has seven external thermistor channels that can accommodate any kind of thermistors. The key parameters in this equation are a, b and c coefficients that can be obtained from the thermistor manufacturer. You may change them based on the thermistor type you are using. //A custom equation for thermistor temperature public double ExtThermistor2(double Input) { //digit value must be 65534 double dig_range = 65535; //load resistor must be 10000 ohm double load_resistor = 10000; double a, b, c, lgr, Output = 0; //different thermistor will have different a, b, c values a = 0.001028444; ; b = 0.000239244; c = 0.000000156; Output = CurrentChannel.DigitValue; if (Input >= dig_range) Output = dig_range - 1; if (Input < 1) Output = 1; double Rt = load_resistor * Output / (dig_range - Output); lgr = Math.Log(Rt); Output = 1f / (a + b * lgr + c * lgr * lgr * lgr) - 273.15f; return Output; } Previous Hour Average This equation can be used to calculate the averaged value for the previous hours. It can be easily modified for a day or other time frame averages. DateTime CurrentTime; bool FirstIn = true; int HourIndex = 0; double AverageValue = 0; double SumValue = 0; int PreviousHour = 0; //Equation to calculate the average value of the previous hour public double HourAverage(double Input) { //first time get in this function, initialize some variables. SiteView User’s Manual – Microedge Instruments Inc. 203/211 if (FirstIn) { FirstIn = false; SumValue = Input; AverageValue = Input; PreviousHour = this.StartTime.Hour; CurrentTime = this.StartTime; } else { CurrentTime = CurrentTime.AddSeconds(this.SampleInterval); if (CurrentTime.Hour != PreviousHour) { PreviousHour = CurrentTime.Hour; AverageValue = SumValue / HourIndex; SumValue = 0; HourIndex = 0; } SumValue += Input; } HourIndex++; //Average value of the previous hour. //Note: the first hours value is always the first reading return AverageValue; } The following figure illustrates the result after the above equation is applied: Note the red curve is the hour average of the black curve. SiteView User’s Manual – Microedge Instruments Inc. 204/211 APPENDIX Modem AT Command Set The following table summarizes the basic AT command set for Hayes compatible dial-up modems. Defaults are shown in boldface. Command Function AT Attention - this precedes all commands except A/ and +++ A/ Execute previous command - does not require a <CR> A Causes the modem to go off hook. If a call is coming in, the modem will try to answer it. The precedure for answering a call is a short silence and then an answer tone. Sending a character to the modem during this procedure will abort the answer sequence. The amount of time the modem will wait for a carrier is programmable by modifying the S7 register. B0 Select CCITT V.22 (1200 bps) B1 Select Bell 212A (1200 bps) B2 Select CCITT V23 - Originate mode will transmit data at 75 bps and receive data at 1200 bps. Answer mode will transmit data at 1200 bps and receive data at 75 bps. The command N0 (disable auto mode) must be selected. D D alone will take the modem off-hook and wait for a dial tone. (see X command for exceptions). The length of time to wait for a dial tone before dialing is programmable in register S6. Dmn ATDmn will dial a phone number where m is the modifier: L, W, ,, ;, @, or S. It will dial the telephone number n. L Dial last number W Wait for dial tone. If you have selected X0 or X1 (disable dial tone detection), then you can use this modifier to override that setting. , Pause during dial. Thie amount of time to pause is determined in register S8. ; Return to command mode after dialing. It does not wait for carrier or hang up. @ Wait for 5 seconds of silence. This is used to access systems that do not provide a dial tone. ! Hook flash. Causes the modem to go on-hook for 0.5 seconds. This is used in PBX systems and for voice features like call waiting. S=(0-9) Dials a stored number. Up to ten numbers can be stored, and the addresses are from 0 to 9. To store a number into one of these addresses, use the &Z command. E0 Commands issued to the modem are not echoed to the local terminal. This only matters in the command mode. It does not affect the modem's ability to send response codes. SiteView User’s Manual – Microedge Instruments Inc. 205/211 E1 H0 Commands are echoed to the local terminal. Force modem on-hook (hang-up) H1 Force modem off-hook (to answer or dial). I0 Return numeric product code I1 Return hardware variation code I2 Report internal code I3 Report software revision number I4 Report product feature listing L0 Speaker volume zero L1 Speaker volume low L2 Speaker volume low L3 Speaker volume low (Hardware currently limits volume adjustment to on/off) M0 Speaker always off M1 Speaker on until carrier detected M2 Speaker always on M3 Speaker on during answering only N0 Disable auto-mode. This forces the modem to connect at the speed specified in register S37 N1 Enable auto-mode. The modem will answer at the highest available line speed and ignore any ATBn command. O0 Return to data mode. If you have entered the command mode using the time independent escape sequence, this will put you back in data mode without going on-hook. O1 Retrain the modem. If the line condition has changed since the original connection, retraining the modem will cause it to reconnect at the most efficient speed for the current line condition. P Pulse dialing allows the modem to work on telephone networks where one is not supported. Pulse and tone dialing cannot be mixed on the same command line. Q0 Enable response to DTE. Q1 Disable response to DTE. The modem does not respond to the terminal. Issuing a command will not produce a response (unless the command is something like ATZ, which will restore this setting to default). Sn Set default S-register. Any subsequent = or ? commands will modify the default S register. Sn=m Set register n to value m Sn? Return the value of register n T Tone dialing - Pulse and tone dialing can not be mixed on the same command line. V0 Result codes will be sent in numeric form. (See the result code table) SiteView User’s Manual – Microedge Instruments Inc. 206/211 V1 Result codes will be sent in work form. (See the result code table.) W0 Report DTE speed only. After connection, there will be no message about what Error Correction or Data Compression protocol is in use. W1 Report DCE speed, Error Correction/Data Compression protocol, and DTE speed W2 Report DCE speed only X0 Send OK, CONNECT, RING, NO CARRIER, ERROR and NO ANSWER. Busy and dial tone detection are disabled. X1 Send X0 messages and CONNECT speed X2 Send X1 messages and NO DIAL TONE. X3 Send X2 messages and BUSY and RING BACK. Dial tone detection is disabled. X4 Send all responses. Y0 Disable long space disconnect. Y1 Enable long space disconnect; with error correction, hang up after sending 1.6 second long space; without error correction, hang up after 4 second long space. Z0 Reset modem to profile 0 Z1 Reset modem to profile 1 +++ This is the default escape sequence. Transfers the modem from data mode to command mode. Must be preceded by at least 1 second of no characters and followed by one second of no characters. O0 (ATO0 or ATO) returns the modem to data mode. =n Sets the value of the default S register. & Ampersand commands &C0 &C1 Force data carrier detect (DCD) on DCD follows remote carrier &D0 &D1 DTR is assumed on DTR drop causes modem to go back to command mode without disconnecting &D2 DTR drop causes modem to hang up &D3 DTR drop causes modem to initialize; &Y determines which profile is loaded. &F Load factory profile &K0 Disable flow control &K3 &K4 Enable RTS/CTS flow control Enable XON/XOFF flow control &K5 Enable transparent software flow control &K6 Enable both RTS/CTS and XON/XOFF flow control &P0 Selects 33%-67% make/break ratio at 10 pulses per second. &P1 Selects 33%-67% make/break ration at 20 pulses per second &P2 Selects 33%-61% make/break ration at 10 pulses per second SiteView User’s Manual – Microedge Instruments Inc. 207/211 &P3 Selects 33%-61% make/break ration at 20 pulses per second &S0 Force DSR on &S1 DSR on at the start of handshaking and off after carrier loss &T0 Terminate test &V0 Display active profile &V1 Display stored profiles &V2 Display stored telephone numbers &W0 Save active profile to profile 0 &W1 Save active profile to profile 1 &Y0 Use profile 0 on powerup &Y1 Use profile 1 on powerup &Zn=m Save telephone number (up to 36 digits) into memory location n (0-9) % Percent commands %A Default is set to each country encoding law. For example, for USA %A is 0, for Germany %A is 1. %A0 Mu-law encoding %A1 A-law encoding %C0 Disable data compression %C1 Enable MNP5 compression %C2 Enable V.42bis compression %C3 Enable both V.42bis and MNP5 %E0 Disable auto-retrain %E1 Enable auto-retrain %E2 Enable auto-retrain and fallback %E3 Enable auto-retrain and fast hang up %L Report received signal level in -dBm %N0 Dynamic CPU loading disabled %N1 Dynamic CPU loading not to exceed 10% %N2 Dyanmic CPU loading not to exceed 20% %N3 Dyanmic CPU loading not to exceed 30% %N4 Dyanmic CPU loading not to exceed 40% %N5 Dyanmic CPU loading not to exceed 50% %N6 Dyanmic CPU loading not to exceed 60% %N7 %N8 Dyanmic CPU loading not to exceed 70% Dyanmic CPU loading not to exceed 80% SiteView User’s Manual – Microedge Instruments Inc. 208/211 %N9 Dyanmic CPU loading not to exceed 90% %Q Report line signal quality \ Backslash commands \A0 64-character max MNP block size \A1 \A2 128-character max. MNP block size 192-character max. MNP block size \A3 256-character max. MNP block size \Bn In non-error correction mode, transmit break in 100 ms units (1-9 with default 3) \G0 \G1 Disable XON/XOFF flow control (modem to modem) Enable XON/XOFF flow control (modem to modem) \Kn Define break type \L0 Use stream mode for MNP \L1 Use interactive block mode for MNP \N0 Normal mode; speed control without error correction \N1 Plain mode; no speed control and no error correction \N2 Reliable mode \N3 \N4 Auto-reliable mode LAPM error correction only \N5 MNP error correction only * Asterisk commands *Q0 Send the "CONNECT xxxx" result codes to the DTE when an invalid TIES escape sequence is detected after the "OK" response has already been sent *Q1 Does NOT send the "CONNECT xxxx" result codes to the DTE when an invalid TIES escape sequence is detected after the "OK" response has already been sent S Registers Reg. 0 Rings to auto-answer. Sets the number of rings required before the modem answers. 0 setting disable auto-answer. Range is 0-255 rings. Default is 0 for auto-answer disabled. Reg. 1 Ring counter. Counts the number of rings before the modem answers. Range is 0-255 rings. Default is 0. Reg. 2 Escape character. Defines the character used for the three-charracter escape code sequence. 0 setting disables the escape code character. Range is 0-127. Default is 43 (+) Reg. 3 Carriage return character. Defines the character for carriage return. Range is 0-127. Default is 13 (carriage return). Reg. 4 Line feed character. Defines the character for the line feed. Range is 0-127. Default is 10 (line feed). Reg. 5 Backspace character. Defines the character for the backspace. Range is 0-127. Default is SiteView User’s Manual – Microedge Instruments Inc. 209/211 8 (backspace) Reg. 6 Wait before dialing. Sets the length of time to pause after off-hook before dial. Range is 2-255 seconds. Default is 2 seconds. Reg. 7 Wait for carrier after dialing. Sets the length of time that the modem waits for a carrier from the remote modem before hanging up. Range is 1-255 seconds. Default is 50 seconds. Reg. 8 Pause time for dial delay. Sets the length of time to pause for the pause dial modifier ",". Range is 0-255 seconds. Default is 2 seconds. Reg. 9 Carrier detect response time. Defines the length of time a signal is detected and qualified as a carrier. Range is 1-255 tenths of a second. Default is 6 (0.6 seconds) Reg. 10 Lost carrier hang up delay. Sets the length of time the modem waits before hanging up for a carrier loss. Range is 1-255 tenths of a seconds. Default is 14 (6 seconds ????) Reg. 11 DTMF speed control. Sets the length of tone and the time between tones for the tone dialing. Range is 50-255 milliseconds. Default is 95 milliseconds. Reg. 12 Escape Prompt Delay (EPD) timer. Sets the time from detection of the last character of the three character escape sequence until the "K" is returned to the DTE. Range is 0-255 fiftieths of a second. Default is 50 (1 second) Reg. 13 Reserved Reg. 14 Reserved Reg. 15 Reserved Reg. 16 Reserved Reg. 17 Reserved Reg. 18 Test timer. Sets the length of loopback test. Range is 0-255 seconds. Default is 0 (disable timer) Reg. 19 Reserved Reg. 20 Reserved Reg. 21 Reserved Reg. 22 Reserved Reg. 23 Reserved Reg. 24 Reserved Reg. 25 Delay to DTR. Sets the length of time the modem ignores DTR before hanging up. Range is 0-255 hundredths of a seconds. Dafault is 5 (0.05 seconds) Reg. 26 Reserved Reg. 27 Reserved Reg. 28 Reserved Reg. 30 Disconnect inactivity timer. Sets the length of time allowed for inactivity before the connection is hung up. Range is 0-255 in minutes. Default is 0 (disabled) Reg. 32 XON character. Sets the value of XON character. Range is 0-255. Default is 17 SiteView User’s Manual – Microedge Instruments Inc. 210/211 Reg. 33 XOFF character. Sets the value of XOFF character. Range is 0-255. Default is 19. Reg. 34 56k data rate (bit-rate). Sets the maximum bit rate for 56K. Range is 0-32. Bit rate = 32000bps + S34*2000bps. V.34 data rate (bit-rate). Sets the maximum bit rate for V.34. Range is 0-8 (2400 baud), 1-10 (3000 baud), 1-11 (3200 baud), 1-13 (3429 baud) Bit rate = ((S34)+1)*2400bps. Default is 13 (33600 bps) Reg. 36 Reserved Reg. 37 Line connection speed. 0-Attempt to connect at the highest speed. 3-Attempt to connect at 300 bps. 4-Attempt to connect at 1200 bps. 6-Attempt to connect at 2400 bps. 7Attempt to connect at 4800 bps. 8-Attempt to connect at 7200 bps. 9-Attempt to connect at 9600 bps. 10-Attempt to connect at 12000 bps. 11-Attempt to connect at 14400 bps. 12-Attempt to connect at V.34. 13-Attempt to connect at 56K, Default is 0. Reg. 38 Delay before forced hang-up. Sets the delay to hang up after the disconnecting command is received. Range is 0-255 seconds. Default is 20 seconds. SiteView User’s Manual – Microedge Instruments Inc. 211/211