1
262
Chapter 11 – A Detailed Example
Table 11.1
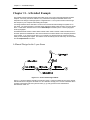
Catchment data for the network of Figure 11.1
Catchment number
1
3
4
Percent impervious
65
20
30
Area (ha)
5.0
3.5
2.5
Overland flow length (m)
85
125
90
Surface gradient (%)
2.0
1.5
2.5
Manning ‘n’
0.20
0.25
0.25
SCS Curve Number CN
84
76
76
Initial abstraction (mm)
5.0
7.5
7.5
The impervious fractions in the three contributing sub- catchments are assumed to have roughness and
imperviousness values as indicated in Table 11.2. The runoff from these catchment areas is to be
computed using the SCS infiltration method and the triangular unit hydrograph method for overland flow.
Table 11.2
Characteristics of impervious areas
Catchment number
1
3
4
Manning ‘n’
0.015
0.020
0.020
SCS CN or Runoff coeff. C
0.95
98
98
Initial abstraction Ia – (mm)
1.5
2.0
2.0
Design Storms
The drainage system is to be designed for a 5-year design storm of the Chicago hyetograph type and
tested under a more severe historic storm. The 5-year synthetic storm is to be based on the intensityduration-frequency relation shown in equation [11.1], with a value or r = 0.35 and a storm duration of 2
hours.
[11.1]
i=
a
(t d + b )c
=
1140
(td + 6 )0.84
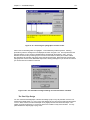
The historic storm is defined by the table of rainfall intensities in mm/hour at 5 minute intervals as shown
in Table 11.3. The total duration is 3 hours.