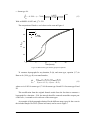
1
VFSMOD VEGETATIVE FILTER STRIPS MODELING SYSTEM MODEL DOCUMENTATION & USERS MANUAL Rafael Muñoz Carpena Agricultural & Biological Engineering University of Florida 287 Frazier Rogers Hall P.O. Box 110570 Gainesville, FL 32611-0570 John E. Parsons (deceased, October 2005) Biological & Agricultural Engineering North Carolina State University Raleigh, NC 27695 VFSMOD-W Vegetative Filter Strips Modelling System MODEL DOCUMENTATION & USER’S MANUAL version 6.x Rafael Muñoz-Carpena Agricultural & Biological Engineering University of Florida 287 Frazier Rogers Hall P.O. Box 110570 Gainesville, FL 32611-0570 [email protected] John E. Parsons (deceased) Biological and Agricultural Engineering North Carolina State University Raleigh, NC 27695 Last Updated: June 24, 2014 Disclaimer VFSMOD-W 5.x Vegetative Filter Strip Modelling System VFSMOD was initially developed in the Department of Biological and Agricultural Engineering by Dr. Rafael Muñoz-Carpena under the direction of Dr. John E. Parsons. The model and associated documentation is supplied as-is with no warranty - explicit or implied. The model is provided to as an educational and research tool. This version is the fifth moving the model from a research tool to one available for general users. As with any model, the results are totally dependent on the user's ability to wisely select input parameters that represent the "field" and to interpret the results. We will make every effort to provide assistance and encouragement as our other commitments allow. We do ask that you reference our work if you find it helpful in your pursuits. Ag. & Bio. Eng./IFAS, U. of Florida by R.Muñoz-Carpena ([email protected]) Table of Contents .............................................................................................................................................1 Part I: VFSMOD-W: Model Documentation.......................................................................1 1. Introduction..............................................................................................................1 2. VFSMOD: Model Components, Processes and Solution Techniques .....................3 2.1 2.2 2.3 2.4 2.5 2.6 3. UH utility - preparation of model inputs for design purposes ...............................15 3.1 3.2 3.3 3.4 3.5 3.6 4. Hydrology ............................................................................................................................4 Sediment Transport ..............................................................................................................6 Chemical tranport/trapping ..................................................................................................8 2.3.1 Pesticides ...............................................................................................................8 2.3.2 Solute Transport ..................................................................................................11 2.3.3 Multi-reactive transport .......................................................................................11 Linkage between submodels ..............................................................................................11 Solution procedure .............................................................................................................12 Model inputs ......................................................................................................................14 Generation of Synthetic Rainfall Hyetographs ..................................................................15 3.1.1 Equations for storm types II & III .......................................................................15 3.1.2 Equations for storm types I & IA ........................................................................15 Generation of Runoff Hydrographs ...................................................................................17 3.2.1 Computation of Total Runoff using NRCS Curver Number method (SI units) ..17 3.2.2 Peak flow calculation using NRCS method (SI units) ........................................18 3.2.3 Time correction for hydrograph to match hyetograph.........................................22 Incoming sediment load calculation ..................................................................................24 3.3.1 Universal Soil Loss Equation (USLE) ................................................................24 3.3.2 Modifications to USLE to handle storm events ..................................................26 Computational Structure of UH .........................................................................................28 Sensitivity Analysis of VFSMOD. ....................................................................................29 Previous Testing and Applications.....................................................................................30 Sensitivity and Uncertainty Analysis Procedures for UH and VFSMOD Built In VFSMOD-W..........................................................................................................31 4.1 4.2 Local (OAT) Sensitivity Analysis......................................................................................31 Global Sensitivity and Uncertainty Analysis.....................................................................33 4.2.1 The Morris Method..............................................................................................33 4.2.2 Extended FAST ...................................................................................................34 5. Inverse Calibration.................................................................................................37 6. Design Procedure ...................................................................................................40 7. Potential Users and Applications of the Modelling System ..................................42 8. Known Limitations and Applicability of the Models ............................................43 8.1 8.2 9. Known Limitations of the Model.......................................................................................43 Future Research/Model Releases.......................................................................................43 -Distribution and Training .....................................................................................44 10. Acknowledgements................................................................................................45 11. References..............................................................................................................46 Part II: VFSMOD and UH: User’s Manual .......................................................................53 1. VFSMOD user’s manual........................................................................................53 1.1 1.2 1.3 1.4 1.5 1.6 2. Obtaining VFSMOD..........................................................................................................53 Installing and running VFSMOD ......................................................................................53 1.2.1 Installing for a DOS/command prompt window (under Windows 9x/NT/2000/ XP): .....................................................................................................................53 1.2.2 Installing together with the Windows Graphical Interface (Windows 9x/NT/2000/ XP).......................................................................................................................54 1.2.3 Installing on a UNIX system ...............................................................................54 Using the project file for input and output.........................................................................55 VFSMOD input files..........................................................................................................57 1.4.1 filename.ikw (parameters for the overland flow solution) ..................................57 1.4.2 filename.irn (storm hyetograph)..........................................................................58 1.4.3 filename.iro (runoff from the adjacent field into the VFS) .................................59 1.4.4 filename.iso (soil properties for the infiltration model) ......................................60 1.4.5 filename.igr (buffer properties for sediment filtration model) ............................62 1.4.6 filename.isd (sediment properties for sediment filtration model) .......................62 1.4.7 filename.iwq (water quality/transport model) .....................................................63 Model file outputs ..............................................................................................................64 Sample application.............................................................................................................65 1.6.1 Inputs ...................................................................................................................65 1.6.2 Outputs ................................................................................................................66 UH for Input Preparation: User’s Manual .............................................................70 2.1 2.2 2.3 2.4 2.5 Installing and running UH .................................................................................................70 Using the project file for input and output.........................................................................71 UH input files.....................................................................................................................72 2.3.1 filename.inp (parameters for generating inputs for VFSMOD) ..........................72 Sample application.............................................................................................................73 Tips for running the model ................................................................................................78 Part III: VFSMOD-W: WindowsTM User’s Manual .........................................................86 1. VFSMOD Model Description................................................................................86 2. Installation Information .........................................................................................86 3. Using VFSMOD ....................................................................................................89 4. Main Window ........................................................................................................90 4.1 5. UH Project Window...............................................................................................93 5.1 6. vfsmod-w Options File ......................................................................................................91 UH Input File Editing ........................................................................................................94 VFS Project Window .............................................................................................96 6.1 6.2 6.3 Overland Flow Inputs (ikw)...............................................................................................98 VFS Infiltration Soil Properties (iso)...............................................................................101 VFS Buffer Vegetation Characteristics (igr)....................................................................106 6.4 6.5 6.6 6.7 6.8 Incoming Sediment Characteristics (isd) .........................................................................107 Storm Hyetograph (irn)....................................................................................................108 VFS Source Area Storm Runoff (iro) ..............................................................................109 VFS Water Quality Input File (iwq) ................................................................................ 111 VFS Description of the Output Files ...............................................................................113 7. Processing and Analysis of VFSMOD Results....................................................115 8. Using the Plot Windows ......................................................................................117 9. Calibration Mode .................................................................................................120 10. Sensitivity Analysis Screens ................................................................................133 11. Uncertainty Analysis Screens ..............................................................................139 12. Design Menu........................................................................................................143 13. Troubleshooting vfsmod-w ..................................................................................145 14. VFSMOD-W Change History .............................................................................146 Part IV: VFSMOD: Appendices ......................................................................................150 1. APPENDIX 1: Description of the model subroutines .........................................150 1.1 1.2 1.3 1.4 1.5 1.6 1.7 1.8 1.9 1.10 1.11 1.12 1.13 1.14 1.15 1.16 1.17 1.18 1.19 1.20 1.21 1.22 1.23 1.24 1.25 1.26 Program VFSMOD ..........................................................................................................150 FINPUT(LISFIL).............................................................................................................151 INI(A,B,X,XM,X0,Q0,QM,SSE,NODEX) .....................................................................151 GRASSIN(ICOARSE,COARSE,LISFIL)......................................................................151 INPUTS(N,NBAND,NRAIN,RAIN,NBCROFF,BCROFF,TE,QMAX,VL, FWIDTH,PGPAR,VKS,NCHK,LISFIL).........................................................................151 QUAD ..............................................................................................................................152 FORMA(A,NBAND,PGPAR) .........................................................................................152 ELEM(EK,PGPAR) .........................................................................................................152 SHAPE(XIS,PSI,DPSI,WF,PGPAR) ...............................................................................152 ASSM(A,EK,NBAND,NEL)...........................................................................................152 BCA(A,NBAND) ............................................................................................................153 FACTOR (A,N,NBAND) ................................................................................................153 GASUB(TIME,DT,L,R,RAIN,NEND,TRAI) .................................................................153 FORMB(B0,X0,Q0,N,BCRO,PGPAR) ...........................................................................153 MODIFY(QM,B,BCRO,PGPAR) ...................................................................................154 SOLVE(A,B,X,N,NBAND).............................................................................................154 CONVER(N,X,XM,MFLAG) .........................................................................................154 UPDATE(N,X,X0)...........................................................................................................154 FLOW(N,XT,QT) ............................................................................................................154 GRASSED(TIME,N,QIN,NODEX,ICOARSE, COARSE) ............................................155 OCF(NPLACE) ...............................................................................................................155 EINSTEIN(GS2,NTRCAP,COARSE).............................................................................155 STEP3(GS2,TIME,NTRCAP,COARSE) ........................................................................156 POINTS(N,XPOINTS,NODEX,VBT) ............................................................................156 KWWRITE(N,L,M,QTEMP,X,BCRO,FWIDTH) ..........................................................157 OUTMASS(VL,FWIDTH,TRAI,LISFIL) ......................................................................157 2. APPENDIX 2: Model parameters and variables .................................................158 2.1 2.2 2.3 3. Overland flow ..................................................................................................................158 Infiltration ........................................................................................................................159 Sediment transport ...........................................................................................................160 APPENDIX 3: Soils and Vegetation data ............................................................161 3.1 3.2 3.3 3.4 3.5 3.6 3.7 Soils data (Green-Ampt parameters) ...............................................................................161 Manning’s roughness coeficient, n ..................................................................................162 Vegetation types for VFS’s ..............................................................................................163 NRCS (SCS) Curve Numbers..........................................................................................164 MUSLE Crop factor C .....................................................................................................170 Contour factor (P) values for MUSLE equation in UH ...................................................176 References for Soils and Vegetation data ........................................................................176 Part I: VFSMOD-W: Model Documentation 1. Introduction Runoff carrying sediment from nonpoint sources has long been recognized as a major pollutant of surface water. Sediment-bound pollutants, such as phosphorous and some pesticides, are also a major pollution concern. Several management practices have been suggested to control runoff quantity and quality from disturbed areas. One such management practice is vegetative filter strips (VFS), which can be defined as (Dillaha et al., 1989) areas of vegetation designed to remove sediment and other pollutants from surface water runoff by filtration, deposition, infiltration, adsorption, absorption, decomposition, and volatilization. These bands of planted or indigenous vegetation separate a water body from a land area that could act as a nonpoint pollution source. Vegetation at the downstream edge of disturbed areas may effectively reduce runoff volume and peak velocity primarily because of the filter’s hydraulic roughness, and subsequent augmentation of infiltration. Decreasing flow volume and velocity translates into sediment deposition in the filter due to a decrease in transport capacity (Wilson, 1967). Barfield et al. (1979) and Dillaha et al. (1986) reported that grass filter strips have high sediment trapping efficiencies as long as the flow is shallow and uniform and the filter is not submerged. Researchers (Dillaha et al., 1989; Parsons et al., 1991) have found that the filter length (Lt) controls sediment trapping up to an effective maximum length value, thereafter, additional length does not improve filter performance. This maximum effective length depends on the source area, topography, and the hydraulic characteristics of the strip. Several modeling efforts have been undertaken to simulate VFS efficiency in removing pollutants from surface waters. Researchers at the University of Kentucky (Barfield et al. 1978, 1979; Hayes 1979; Hayes et al., 1982, 1984; Tollner et al., 1976, 1977) developed and tested a model (GRASSF) for filtration of suspended solids by artificial grass media. The model is based on the hydraulics of flow, and transport and deposition profiles of sediment in laboratory conditions. This physically based model takes into account a number of important field parameters that affect sediment transport and deposition through the filter (sediment type and concentration, vegetation type, slope and length of the filter). Flow is described by the continuity equation and steady state infiltration, i.e. flow decreases linearly from upstream to downstream in the filter. Wilson et al. (1981) modified and incorporated GRASSF into SEDIMOT II, a hydrology and sedimentology watershed model. A simple algorithm to calculate the outflow hydrograph was incorporated into the model and up to three different slope changes throughout the filter could be considered. The model does not handle time Part I: VFSMOD-W: Model Documentation 1 dependent infiltration, an accurate description of flow through the filter, and changes in flow derived from sediment deposition during the storm event. This work presents a design-oriented computer modeling system (VFSMOD-W). The MS-Windows32 graphical user interface (GUI) integrates the numerical model VFSMOD, a utility to generate inputs for the model based on readily available NRCS site characteristics (UH), and uncertainty, analysis of sensitivity and design menu-driven components. VFSMOD, the core of the design system, is a model to study hydrology and sediment transport through vegetative filter strips. The model combines the strength of: a) a numerical submodel to describe overland flow and infiltration, b) the University of Kentucky’s algorithm developed specifically for the filtration of suspended solids by grass. This model formulation effectively handles complex sets of inputs similar to those found in natural events. The improvements of this combined model over the GRASSF or SEDIMOT II models are the inclusion of: a) state of the art description of flow through the filter; b) changes in flow derived from sediment deposition; c) physically based time dependent soil water infiltration; d) handling of complex storm pattern and intensity; and e) varying surface conditions (slope and vegetation) along the filter. VFSMOD, UH and additional components are described in this Part I from a theoretical and modelling structure perspective. The user manual for the command line versions of VFSMOD and UH is given in Part II along with annotated applications, detailed description of input and output files, and recommended input values. Part III describes the integrated package (VFSMOD-W) as a whole under the MS-Windows environment. Part IV contains appendixes with detailed description on model variables and a collection of tables with recommended inputs for a variety of soil, climate and plant conditions. Each Part builds on the previous ones. Although the reader is encouraged to read through the sections in sequence to gain in depth knowledge of the system, section II contains the essentials to run the MS-Windows design-oriented application. Part I: VFSMOD-W: Model Documentation 2 2. VFSMOD: Model Components, Processes and Solution Techniques VFSMOD is a field scale, mechanistic, storm-based model designed to route the incoming hydrograph and sedimentograph from an adjacent field through a vegetative filter strip (VFS) and to calculate the outflow, infiltration and sediment trapping efficiency. The model handles time dependent hyetographs, space distributed filter parameters (vegetation roughness or density, slope, infiltration characteristics) and different particle size of the incoming sediment. Any combination of unsteady storm and incoming hydrograph types can be used. VFSMOD consists of a series of modules simulating the behavior of water, sediment and pollutants in the VFS. The current modules available are (Figure 1): FIELD/SOURCE AREA INFLOW VEGETATIVE FILTER STRIP RAINFALL Overland flow module Infiltration module PESTICIDES SOLUTES COMPLEX MULTIREACTIVE POLLUTANTS Water quality/ pollutant transport module Sediment filtration module OUTFLOW Figure 1. Schematic representation of VFSMOD modules i) Green-Ampt infiltration module: a module for calculating the water balance in the soil surface; ii) kinematic wave overland flow module: a 1-D module for calculating flow depth and rates on the infiltrating soil surface; iii) sediment filtration module: a module for simulating transport and deposition of the incoming sediment along the VFS. VFSMOD is essentially a 1-D model for the description of water transport and sediment deposition and pollutant trapping along the VFS. The model can also be used to describe transport at the field scale (or field edge) if flow and transport is mainly in the form of sheet flow (Hortonian) and the 1-D path represents average (effective) 2-D conditions (field effective values) across the VFS. Part I: VFSMOD-W: Model Documentation 3 The VFSMOD model uses a variable time step, chosen to limit mass balance errors induced by solving the overland water flow equation. The time step for the simulation is selected by the kinematic wave model to satisfy convergence and computational criteria of the finite element method based on model inputs (Muñoz-Carpena et al., 1993a,b). The model inputs are specified on a storm basis. State variables are integrated after each event to yield storm outputs. 2.1 Hydrology This program solves the kinetic wave approximation of the Saint- Vennant's (1881) equations for overland flow (KW) for the 1-D case as presented by Lighthill and Whitham (1955) such as: -----h -----q + = i e t (Continuity equation) t x So = Sf (1) (Momentum equation) Then a uniform flow equation equation can be used as a link between the q and h, such as Manning's: 5 S o --3q = q h = --------- h n (2) Where h is depth of overland flow [L], q is the flow per unit width of the plane [L2T-1], So is the slope of the plane, Sf is the hydraulic or friction slope, and n is Manning's roughness coefficient [LT-1/3]. The initial and boundary conditions can be summarized as: h = 0; 0 x L ; t = 0 h = ho ; x = 0 ; t 0 (3) where ho can be 0, a constant or a time dependent function, such as the incoming hydrograph from the adjacent field. This also represents a linkage with measured data or to other water quality models describing the incoming runoff and polutant from the field/ source area. The kinematic wave represents an acceptable approximation to overland flow when the Froude number and kinematic wave number are within certain limits (Woolhiser and Ligget, 1967), LS o g v - 10 Fr = ---------- 1.5 and k = ----------2 gh v Part I: VFSMOD-W: Model Documentation (4) 4 The rainfall excess ie is calculated from the hyetograph and a modification to the Green-Ampt infiltration method at every time step (Muñoz-Carpena et al., 1993). The overland flow model was coupled, for each time step, with an infiltration submodel based on a modification of the Green-Ampt equation for unsteady rainfall (Chu, 1978; Mein and Larson 1971, 1973; Skaggs and Khaheel, 1982; Muñoz-Carpena et al., 1993b): K s MS av f p = K s + ------------------Fp (5) F K s t – t p + t o = F – MS av ln 1 + ------------- MS av (6) where fp is the instantaneous infiltration rate, or infiltration capacity, for ponded conditions [m/s], Ks is the saturated vertical hydraulic conductivity [m/s], M = s – i is the initial soil-water deficit [m3/m3], Sav is the average suction across the wetting front [m], Fp is the cumulative infiltration after ponding [m], F is the cumulative infiltration for the event [m], t is the actual time [s], tp the time to ponding, and to is the shift of the time scale to correct for not having ponded conditions at the start of the event. rainfall = r(t) q q out in o o t t VFS Field inflow ff qin Soil surfa c Runo k-node e Sediment deposition Outflow qout Flow q x k-1 nk-1 y v k So nk k infiltration = f(t) 0 x Figure 2. Domain discretization for the finite element overland flow submodel. Rainfall excess, ie in equation 1, is calculated for a given rainfall distribution for each node and time step by the infiltration model. The hydrograph representing runoff from the adjacent field is input as a time dependent boundary condition at the first node of the finite element grid. The program allows for spatial variation of the parameters n and So over the nodes of the system (Figure 2). This feature of the program ensures a good representation of the field conditions for different rainfall events. The model can be operated to provide Part I: VFSMOD-W: Model Documentation 5 information on the effect of soil type (infiltration), slope, surface roughness, filter length, storm pattern and field inflow on VFS performance (i.e. reduction of the runoff peak, volume and velocity) (Muñoz-Carpena et al., 1993b). It also describes the flow rate (q), velocity (V), and depth (h) components throughout the filter for each time step. The numerical solution is subject to kinematic shocks, or oscillations in the solution that develop when a sudden change in conditions (slope, roughness or inflow) occurs. When linking the kinematic wave and the sediment transport models, the soil surface conditions are also changed for each time step, further increasing the potential for the kinematic shock problem. VFSMOD implements a Petrov-Galerkin formulation (nonstandard) finite element to solve equations 1 and 2. This solution procedure reduces the amplitude and frequency of oscillations with respect to the standard Bubnov-Galerkin method (Muñoz-Carpena et al., 1993a), thus improving the model stability and the sediment transport predictions which depend on overland flow values. 2.2 Sediment Transport The hydrology model is linked to a model for filtration of suspended solids by artificial grass media, developed and later tested for field conditions (Barfield et al. 1978, 1979; Hayes et al., 1979, 1984; Tollner et al., 1976, 1977, Wilson et al, 1981). It is based on the hydraulics of flow, transport and deposition profiles of sediment in laboratory conditions. The model presents the advantage of being developed specifically for the filtration of suspended solids by grass.. ENTRY q ,g in Field Wedge Zone g ,q si in sI g si Sc O(t) X (t) 1 q 1 in wedge Y(t) = H Suspended Load Zone 2 g ,q ,d 3 s1 1 f1 g A(t) s2 2 f2 g ,q ,d Se X (t) 2 EXIT q ,d s3 3 f3 B(t) g so C(t) D(t) Flow needed at points 1 2 3 (see text) grass L t L(t) Sc q out Figure 3. Filter description for the sediment transport algorithm. The University of Kentucky algorithm considers that during a rainfall/runoff event, field runoff reaches the upstream edge of the filter with time dependent flow rate qin[cm2/ s], and sediment load gsi [g/cm-s]. The vegetation produces a sudden increase in hydraulic resistance that slows the flow, lowers its transport capacity gsd [g/cm-s], and produces deposition of the coarse material (particle diameter dp >0.0037 cm) carried mostly as bed Part I: VFSMOD-W: Model Documentation 6 load transport. The sediment trapped in this first part of the filter forms a geometrical shape that varies depending on the thickness of the deposited sediment layer at the entry of the filter, Y(t) [m], and the effective top of vegetation, H [cm]. A triangular shape at the adjacent field area and the beginning of the filter is formed when Y(t) < H. After Y(t)=H, a trapezoidal wedge is formed (Figure 3) with three well defined zones: the upslope face of the wedge (with zero slope), O(t) [cm]; the upper face of the wedge (parallel to the soil surface), A(t); and the downslope face, B(t), with an equilibrium deposition slope Se for each time step (Figure 3). Together these first filter zones are termed "wedge zone", and its length changes with time as sediment is deposited. Zone O(t), external to the filter, is important in explaining field observations where a portion of the sediment is deposited in the field area adjacent to the filter. After the wedge has formed, no sediment is deposited in zone A(t) and the initial load, gsi, moves through to the next zone, B(t). In this zone, deposition occurs uniformly with distance to the deposition edge, with transport mostly as bed load. The model assumes that the sediment inflow load, gsi, is greater than the downstream sediment transport capacity gsd at point 2 (Figure 3). The algorithm calculates the gsd value for each time step and compares it with the sediment inflow load. If gsd>gsi, all sediment is transported through the first part of the filter (wedge), gs2=gsd, and the sediment is filtered at the suspended sediment zone (lower part of the filter). If gsd<gsi deposition at the wedge occurs and the fraction not deposited is filtered at the lower part of the filter, gs2=gsi-gsd. The calculation procedure utilizes a modified Manning’s open channel flow equation, continuity equation, and Einstein’s sediment bed load transport function. Flow values at the filter entry and points 1 and 2 in Figure 3 (qin, q1, q2 respectively) are needed for these calculations. After the downside of the wedge, two zones C(t) and D(t) form the "suspended load zone" or “effective filter length”, L(t) (Figure 3). On zone C(t), sediment has covered the indentations of the surface so that bed load transport and deposition occurs but the soil slope, Sc, is not significantly changed. All bed load transported sediment is captured before reaching zone D(t), so only suspended sediment is transported and deposited in this zone until the flow reaches the end of the filter with sediment load gso. The sediment trapping algorithm for the suspended load zone follows Tollner et al. (1976) equation based on a probabilistic approach to turbulent diffusion for non-submerged flow. Flow values at point 3 and filter exit, q3 and qout respectively (Figure 3), are needed for these calculations. Details of the implementation of the submodel are given in Muñoz-Carpena (1993). Under extreme sediment inflow events the filter can be filled up with sediment to the top of the standing vegetation. VFSMOD accounts for this in a realistic way by allowing normal filtration up to the time step when the sediment wedge reaches the end of the filter Part I: VFSMOD-W: Model Documentation 7 ( X 2 L t ), and bypassing filtration from then on (gso=gsi). The original University of Kentucky sediment model uses a simple approach to calculate flow conditions at specific points of the filter and does not consider the complex effects of rainfall, infiltration, and flow delay caused by the buffer. VFSMOD provides a more accurate description of the flow conditions from the hydrology submodel whereas changes in surface conditions (topography, roughness) due to sediment deposition during the event are obtained from the sediment filtration submodel. 2.3 Chemical tranport/trapping 2.3.1 Pesticides For aquatic organisms, such as plants, fish, aquatic-phase amphibians, and invertebrates, the U.S. EPA Environmental Exposure and Effect Division (EFED) uses computer simulation models to calculate estimated pesticide environmental exposure concentrations (EECs) in surface water. The EECs are compared to critical toxicological values to determine the level of potential risks to aquatic species. A tiered system of modeling is considered, with the Tier I GENEEC model representing a highly conservative screening tool (USEPA, 2001). For compounds with uses resulting in unacceptable TIER I EECs, EFED implements a Tier II modeling system that reflects labeled uses for the compounds (Lin et al., 2007). The Tier II assessment procedure is based on simulation modeling with PRZM/EXAMS using the linking program PE5 (additional details of the process provided in the supporting information, see Supplemental Material S1). PRZM simulates pesticide fate and transport from an agricultural field to an adjacent water body (Carsel et al., 1985 and Fox et al., 2006) while EXAMS models pesticide fate in the water body (Burns, 1990 and Jackson et al., 2005). The U.S. EPA has created various benchmark scenarios by crop (Lin, 2009). These scenarios are static in terms of the field and pond geometry but include variations in soil, weather, and management practices. PRZM/EXAMS simulations are typically conducted for a 30-year period (1961-1990) using daily weather data and assuming the maximum use rates and patterns as specified on the pesticide label. Risks are determined based on the upper 90th-percentile annual peak, 4-d, 21-d, 60-d, or 90-d mean concentrations depending on the target critical toxicological endpoint. For acute risk assessments, peak and 4-d EECs are used, while the chronic risk assessments are based on longer mean averages. For pesticides with uses that do not pass the Tier II risk assessments, vegetation filter strips (VFS) are required on the label as a mitigation practice. For example, a typical label might read the following: construct and maintain a minimum 3.0-m wide vegetative filter strip of grass or other permanent vegetation between field edge and down gradient aquatic habitat. The VFS can reduce pesticide movement to streams by reducing runoff volumes Part I: VFSMOD-W: Model Documentation 8 through infiltration in the filter strip’s soil profile, through contact between dissolved phase pesticide with soil and vegetation in the filter strip, and/or by reducing flow velocities to the point where eroded sediment particles, with sorbed pesticide, can settle out of the water (NRCS, 1999; Muñoz-Carpena et al., 1999; Abu-Zreig et al., 2001; Hickey and Doran, 2004; Reichenberger et al., 2007; and Stutter et al., 2009). Therefore, VFS can provide both retention and detention mechanisms through infiltration and hydraulic resistance. Other potential mechanisms of pesticide removal include sorption of pesticides to vegetation and enhanced or phytomediated degradation of pesticides within the VFS. However, specification of the required VFS characteristics is largely subjective due to the lack of a predictive tool that can explain the wide range of field-reported efficacies. Two VFS with equivalent lengths, slopes, and vegetation characteristics may yield drastically different pesticide reductions dependent on the hydrologic and sedimentological conditions experienced by the VFS at the time of the study. For example, some studies report little reductions in low to moderately sorbed pesticides by VFS (Yonts et al., 1996); other researchers report significant reductions in similarly sorbed pesticides by VFS (Tingle et al., 1998). Review papers have concluded that a significant effect of VFS length on pesticide trapping was not uniformly observed in all of the studies, primarily due to the fact that the removal depended largely on the pesticide properties, nature of the runoff event, and antecedent moisture content (Reichenberger et al., 2007). The most common approaches for attempting to predict VFS effectiveness are statistical analyses that attempt to relate physiographic characteristics of the VFS (i.e., slope, vegetation, area ratio, and VFS length) to sediment and/or contaminant removal (Neitsch et al., 2005; Liu et al., 2008; Fox and Sabbagh, 2009). These statistical approaches showed poor predictive power with little confidence in being able to accurately predict VFS reduction given the wide range of conditions likely to be experienced by the VFS. Recent research has proven that simple physiographic characteristics of the VFS are not explicitly driving contaminant reductions. Rather it is the hydrologic impacts of the physiographic characteristics on the VFS system that drive sediment and contaminant removal (Fox and Sabbagh, 2009; Sabbagh et al., 2009; and Poletika et al., 2009). Consider, for example, that the presence of sheet versus concentrated flow will significantly impact the resulting sediment and/or contaminant removal efficiencies. Numerical process-based models have been available for some time for predicting runoff and sediment reduction by VFS, such as the Vegetative Filter Strip Modeling System, VFSMOD-W (Muñoz-Carpena et al., 1999 and Muñoz-Carpena and Parsons; 2004). The VFSMOD-W is a finite-element, field-scale, storm-based model developed to route the incoming surface flow hydrograph and sedigraph from an adjacent source area (field, road, urban area, etc.) through a VFS and to calculate the resulting outflow, infiltration (based on the extended Green-Ampt equation for unsteady rainfall), and sediment trapping (based on GRASSF) (Muñoz-Carpena et al., 1999 and Muñoz-Carpena and Parsons; Part I: VFSMOD-W: Model Documentation 9 2004). Researchers have demonstrated the model’s ability to predict reductions in runoff volume and sediment concentration moving through VFS. Such numerical models can account for site-specific conditions not able to be captured by the empirical models. VFSMOD-W has been used by state regulators and city engineers for the design and evaluation of VFS to control surface runoff pollution. Recent research has developed and evaluated an empirical model for pesticide trapping by VFS with a foundation of hydrological, sedimentological, and chemical specific parameters (Muñoz-Carpena et al., 1999 and Poletika et al., 2009): P = a + b Q + c E + d ln F ph + 1 + e C (7) where P is the pesticide removal efficiency (%), Q is the infiltration (%) defined as the difference between total water input to the VFS (i.e., rainfall plus inflow runon) minus the runoff from the VFS, E is the sediment reduction (%), %C is the clay content of the sediment entering the VFS, Fph is a phase distribution factor (i.e., ratio between the mass of pesticide in the dissolved phase relative to the mass of the pesticide sorbed to sediment), and a, b, c, d, and e are regression parameters (i.e., 24.8, 0.54, 0.53, -2.42, and 0.89, respectively). Mathematically, Fph was written as the following: Qi F ph = ----------Kd Ei (8) where Q i and E i are the volume of water (L) and mass of sediment (kg) entering the VFS, and K d is the distribution coefficient defined as the product of the organic carbon sorption coefficient ( K oc ), and the percent organic carbon in the soil, divided by 100 (Sabbagh et al., 2009). Additional details of the derivation of this equation are provided in the supporting information (see Supplemental Material, Section S2). Parameters within this equation were used to represent some of the processes within the filter strip, including infiltration ( Q), sedimentation ( E), and sorption ( F ph ). Degradation processes were not simulated in the VFS due to the assumption of a small residence time during typical rainfall-runoff events. The focus was on immobilization of the pesticide by the VFS due to the assumption that the most significant loading threat was due to surface runoff in the immediate runoff event. The previous research also proposed a procedure linking a VFSMOD-W with the proposed empirical trapping efficiency equation (Sabbagh et al., 2009 and Poletika et al., 2009). For data sets with sufficient information, the linked numerical and empirical models significantly improved predictions of pesticide trapping over conventional equations based solely on physiographic characteristics of the vegetated filter strip (R2=0.74 with a slope not significantly different than 1.0 and intercept not significantly different than 0.0). Others (Poletika et al., 2009; Muñoz-Carpena et al., 2010; and Fox et al., 2010) further evaluated VFSMOD-W, which included the empirical pesticide trapping Part I: VFSMOD-W: Model Documentation 10 efficiency equation. The integrated numerical model was capable of predicting runoff volume, sediment, and chemical reductions by the VFS under both uniform and concentrated flow in good agreement with the measured reductions (Poletika et al., 2009). A new component to calculate in-filter pesticide distribution and degradation between events is now available for continuous simulations in long-term environmental assessments conducted by regulatory agencies (US-EPA, EU-FOCUS). Details are provided in Muñoz-Carpena, R. (2012). 2.3.2 Solute Transport (In preparation - next release) 2.3.3 Multi-reactive transport (In preparation - next release) 2.4 Linkage between submodels Flow conditions at the entry, exit and three inner points (1, 2, and 3) of the filter are needed for the sediment transport calculations (qin, q1, q2, q3 and qout in Figure 3). The GRASSF and SEDIMOT II models use a simple approach to calculating those values and do not consider the complex effects of rainfall, infiltration, and flow delay caused by the filter. A more accurate description of the flow conditions are obtained from the hydrology submodel presented above. In turn, the sediment transport model supplies information on changes in surface conditions (topography, roughness) due to sediment deposition during the event that affect overland flow. This interaction between submodels is depicted in the Part I: VFSMOD-W: Model Documentation 11 flowchart in Figure 4. Rainfall Infiltration model ie = rainfall - infiltration qk Field water inflow Finite element kinematic wave Overland flow model dt Sediment Transport Model Field sediment inflow Sok , nk Sediment and water outflow Figure 4. Flowchart showing linking between hydrology and sediment submodels. During the simulation, feedback between the hydrology and sediment models is produced. The hydrology model supplies the flow conditions at the five locations (entry, 1, 2, 3, and exit) set in the last time step (Figure 3). The other parameters that interact through the linkage are the length, slope, and roughness in each of the sections (entry, 1, 2, 3, and exit). After solving the sediment transport problem for a time step, new values of roughness and/or slope are selected as nodal values for the finite element grid in zones A(t) and B(t), whereas C(t) and D(t) remain unchanged (Figure 3). Changes in surface saturated hydraulic conductivity values (Ks) are considered negligible. The new surface parameters are fed back into the hydrology model for the next time step. Surface changes are accounted for in this way. The time step for the simulation is selected by the kinematic wave model to satisfy convergence and computational criteria of the FE method based on model inputs (MuñozCarpena et al., 1993a,b). At the end of the simulation, the model outputs include: information on the water balance (volume of rainfall, field inflow, filter outflow and infiltration), hydrograph, sediment balance (field inflow, filter outflow and deposition), sedimentograph, filter trapping efficiency, and sediment deposition pattern within the filter. 2.5 Solution procedure The VFSMOD main program calls the subroutines along the solution procedure. The Part I: VFSMOD-W: Model Documentation 12 backbone of the model is the numerical solution to the overland flow equation and the infiltration and sediment transport models are called upon to solve the equation for each time step at the time of assembling the matrix system. The numerical method is based on a N+2 upwinding Petrov-Galerkin finite element method approximation for the spacial derivatives and a time weighting finite difference approximation for the time derivatives. The non-linearity of the equation {q=q(h)} is taken care of by using the Picard iterative scheme inside every time step, lagging 2/3 of the power of h in q, [5/3 = 2/3(m)+1 (m+1)] for the iteration level m, such as: [A]m+1 {h}m = {b(h)} (9) In this program the core of the time step solution is taken care of following this steps: (1) Form the system matrix [A] of constant coefficients (2) Perform LUD decomposition over this matrix [A] (3) Form the system matrix [BM] of constant coefficients (4) Form r.h.s of equation (vector {b}=[BM]{xo} for each time step (5) Solve for [A], {b} to get a {x} for that time step (6) Repeat 4 & 5 until convergence of that time step (7) Repeat 3 & 6 until completion of desired number of time steps The transport model supplies information to build the {BM} and {b} for each time step, Part I: VFSMOD-W: Model Documentation 13 dt. The general procedure is structured into subroutines as illustrated in the next diagram. FINPUT INI GRASSIN INPUTS ELEM SHAPE ASSM BCA D FORMA QUAD O FACTOR GASUB M FORMB S UPDATE F MODIFY V SOLVE Picard Iteration CONVER TIME LOOP UPDATE GRASSED FLOW OCF EINSTEIN STEP3 POINTS Only a 100 times KWWRITE OUTMASS Figure 5. VFSMOD model structure After solving the sediment transport problem for a given time step, values of n and So Part I: VFSMOD-W: Model Documentation 14 are selected as nodal values for the finite element grid. The parameters are fed back into the hydrology model for the next time step, thus surface changes due to sediment deposition within the filter (sediment wedge area) are accounted for in the next time step of the hydrology simulation, as described in the previous section. 2.6 Model inputs The program reads inputs (model parameters and model input variables) from external ASCII-files, which can be prepared from given examples using a conventional text editor. A summary of the model inputs is given in the following Table. Class Inputs Green-Ampt infiltration Rainfall hyetograph, soil saturated hydraulic conductivity, soil saturated water content, soil initial water content, soil suction at the wetting front, and surface storage. Overland flow Field inflow hydrograph, filter length, filter width, nodal slopes and Manning’s roughness across the filter. Sediment filtration Modified grass Manning’s roughness, Manning’s roughness for bare soil, incoming sediment characteristics (median particle size, weight density, fall velocity), effective filter media spacing and height, porosity of deposited sediment, incoming sediment inflow concentration (sedimentograph), and proportion of fine sediment. Water quality/transport Transport parameters for pesticide, simple first order decay solutes and multireactive transport General Number of nodes for the domain, Courant number for numerical solution, total time for the simulation. Part II of this manual gives suggested literature values for some of these parameters when no field measurements are available. In the case of the soil hydraulic and sediment parameters, these can be chosen from soil texture using tables from the manual. The structure of these files is discussed in detail in Part II: Section 1.4 on page 57 Part I: VFSMOD-W: Model Documentation 15 3. UH utility - preparation of model inputs for design purposes As an aid to set up the model inputs, the distribution package includes an utility, UH, that creates synthetic model inputs for the upslope source area based on the NRCS (SCS) design storm for a given location and soil type. The utility implements the NRCS’ (SCS) curve number, unit hydrograph and Modified Universal Soil Loss Equation (MUSLE) concepts to produce ready-to-use input files for VFSMOD. These inputs are rainfall hyetograph, field inflow hydrograph and field sediment inflow and characteristics. UH and VFSMOD are intended to be run in sequence for a design case. After running UH, the remaining VFSMOD inputs needed pertain only to the vegetative filter strip characteristics (dimension, soil, vegetation, and numerical solution parameters). The structure of UH input and output files is discussed in Part II: Section 2.3 on page 73. The following sections herein present the theory behind the methods implemented in UH. 3.1 Generation of Synthetic Rainfall Hyetographs 3.1.1 Equations for storm types II & III For storm types II and III, the equations presented by Haan et al. (1994) are used to generate the hyetographs. The equation is: 0.75 pt T 24.04 --------- = 0.5 + ------ -------------------------- p 24 24 2 T + 0.04 (10) where: T=t-12 with t in hours; p24 = the 24 hour total rainfall in cm. For storm durations less than 24 hours, the ratio of p(t)/p24 is used to derive the amount of rainfall at time t from the total rainfall for the period. The computation procedure follows that given by Haan et. al. (1994). 3.1.2 Equations for storm types I & IA Based on tabulated data (Haan et al., 1994, pg. 48), the fitted equations using Mathematica (Wolfram, 1999) are: • Storm type I: – 0.1617 P -------- = 0.4511 + t – 9.995 –--------------------------------------------------------------3.0163 t – 9.995 + 0.013 P 24 0.5129 0.5853 ;– 3.0163 t – 9.995 + 0.013 0 (11) ;– 3.0163 t – 9.995 + 0.013 0 2 With an Root Mean Square Deviation (RMSD) =0.0088 and =3.363 Part I: VFSMOD-W: Model Documentation 16 • Storm type IA: P0.0843 ------= 0.3919 + t – 7.960 --------------------------------------------------------------P 24 120.39 t – 7.960 + 0.3567 0.4228 (12) 2 With an RMSD= 0.0033 and =1.539 The comparison of fitted vs. real values can be seen on Figure 6. 1 I IA I - fitted IA - fitted 0.8 P/P24 0.6 0.4 0.2 0 0 5 10 15 20 Time (hours) Figure 6. NRCS storm types fitted by proposed equations To construct hyetographs for any duration, D (h), and storm type, equation (3.7) in Haan et al. (1994, pg. 49) was transformed to, P t mid + t – D 2 – P t mid – D 2 P-----= -----------------------------------------------------------------------------------P t mid + D 2 – P t mid – D 2 PD (13) where tmid is 9.995 for storm type I, 7.960 for storm type IA and 12.0 for storm type II and III. This modification from the original formula results from the fact that to construct a hyetograph for a duration < 24 h, the interval should be centered around the steepest part of the curve, i.e around tmid for each one of the storm types. An example of the hyetographs obtained for the different storm types for the event in the included sample file UH.in (25mm in 6 hours) can be seen in Figure 7. Part I: VFSMOD-W: Model Documentation 17 I IA II & III i (mm) 6 4 2 0 0 1 2 3 4 5 6 Time (h) Figure 7. Rainfall hyetographs generated for different storm types. 3.2 Generation of Runoff Hydrographs 3.2.1 Computation of Total Runoff using NRCS Curve Number method (SI units) Runoff from the source area is computed using the NRCS (SCS) Curve number method (USDA-NRCS, 1984): 2 P – 0.2S Q = --------------------------P + 0.8S (14) where Q = total runoff in cm; P = total precipitation in cm and P > 0.2S; S = represents the antecedent moisture and is computed by: 25400 S = --------------- – 254 CN (15) where CN = curve number for the source area. The initial abstraction is assumed to be Ia=0.2 S. Tables for selecting the curve number (CN) are given in Appendix 3 of this manual (see also NRCS, 1984). In the case of multiple land uses, a composite CN can be derived using a weighted average of the respective CN based on the land use areas. As in the original derivation of the method, Q is set to 0 if the precipitation is less than 0.2 of S. This Part I: VFSMOD-W: Model Documentation 18 assumes that the precipitation does not replenish the available storage (ie, 0.2*S). 3.2.2 Peak flow calculation using NRCS method (SI units) Based on the triangular hydrograph assumption the time to peak can be stimated as: D D t p = ---- + t L = ---- + 0.6t c 2 2 (16) Where the concentration time can be estimated by the following equations: SL i t c = t t1 + t t2 + + t tn = -------vi (17) where tti is the transit time for each of the segments of the path between furthest point to the watershed outlet (from a hydraulics point of view), Li and vi are lengths and flow velocities for each segment. The velocity can be estimated from Haan et al (1994) (Table 3.20, pg. 76) When there is little information on flow paths, an alternative equation is used in UH: 0.7 1000 L 0.8 ------------ – 9 CN t c = -----------------------------------------4407 Y (18) where tc is in hours, CN is the NRCS curve number, L in m is the maximum linear distance to the watershed outlet, Y (m/m) is the average slope (altitude difference between furthest point and outlet divided by L). As a third option there are several simplified equations available such us Kirpich’s (1940), t c = 0.0195L 0.77 – 0.385 Y (19) where tc is in minutes. The design peak flow (TR55 method) (m3/s) is calculated in UH as: q p = q u AQF p (20) where qu is the unit peak flow (m3s-1ha-1mm-1), A is the watershed area (ha), Q is the runoff volume (mm) and Fp is the ponding factor that accounts for the percentage of the watershed with ponding or wetland conditions that will delay the overland flow. Part I: VFSMOD-W: Model Documentation 19 . % ponding area Fp 0 1.00 0.2 0.97 1.0 0.87 3.0 0.75 5.0 0.72 qu is calculated from tc values using the following equation (SI units): q u = 4.3046 10 2 C 0 + C 1 log t c + C 2 log t c – 6 (21) where log is the logarithm to the base 10, tc is in hours, C0, C1 and C2 are constants obtained from the following Table based on the ratio Ia/P and the 24-hour design storm type for the area (Types I, IA, II, III) (remember, Ia=0.2 S based on NRCS curve number method). Storm Ia/P C0 C1 C2 I 0.10 0.20 0.25 0.30 0.35 0.40 0.45 0.50 0.10 0.20 0.25 0.30 0.50 0.10 0.30 0.35 0.40 0.45 0.50 0.10 0.30 0.35 0.4. 0.45 0.50 2.30550 2.23537 2.18219 2.10624 2.00303 1.87733 1.76312 1.67889 2.03250 1.91978 1.83842 1.72657 1.63417 2.55323 2.46532 2.41896 2.36409 2.29238 2.20282 2.47317 2.39628 2.35477 2.30726 2.24876 2.17772 -0.51429 -0.50387 -0.48488 -0.45695 -0.40769 -0.32274 -0.15644 -0.06930 -0.31583 -0.28215 -0.25543 -0.19826 -0.09100 -0.61512 -0.62257 -0.61594 -0.59857 -0.57005 -0.51599 -0.51848 -0.51202 -0.49735 -0.46541 -0.41314 -0.36803 -0.11750 -0.08929 -0.06589 -0.02835 0.01983 0.05754 0.00453 0.0 -0.13748 -0.07020 -0.02597 0.02633 0.0 -0.16403 -0.11657 -0.08820 -0.05621 -0.02281 -0.01259 -0.17083 -0.13245 -0.11985 -0.11094 -0.11508 -0.09525 IA II III To obtain the coefficients, rather than interpolating in the previos Table, a set of fourth order polynomials were obtained (see next Table). Part I: VFSMOD-W: Model Documentation 20 Storm I IA II III Coef.a A B C D E C0 68.0317 -74.693 24.9255 3.9797 2.5222 C1 -82.907 105.222 -42.167 6.7479 -0.8657 C2 11.1619 -26.314 16.1126 2.9776 0.0456 C0 144.547 -136.68 41.8526 6.2829 2.3645 C1 -130.64 134.907 -45.773 6.585 -0.6384 C2 -55.230 47.9565 -13.503 2.1954 -0.2644 C0 -11.312 12.1681 -6.5688 1.0577 2.5021 C1 16.6125 -16.337 6.4981 -1.1784 -0.5476 C2 -43.015 50.4334 -19.740 3.2996 -0.3427 C0 -11.505 14.2182 -7.8919 1.3836 2.4007 C1 -64.177 85.7116 -38.206 6.7419 -0.8899 C2 65.9007 -85.806 39.0036 6.8946 0.2078 a. Ci=A(Ia/P)4+B(Ia/P)3+C(Ia/P)2+D(Ia/P)+E; i=0, 1, 2 Part I: VFSMOD-W: Model Documentation 21 Storm type II 2 Coefficient (C0,C1,C2) Coefficient value (C0,C1,C2) 2 Storm type I C0 C1 C2 1 C0 C1 C2 1 0 0 0.1 0.2 0.3 0.4 0.5 0.1 0.2 Ia/P 0.3 0.4 0.5 0.4 0.5 Ia/P Storm type IA 1.5 Storm type III 2 C0 C1 C2 Coefficients (C0,C1,C2) Coefficient values (C0,C1,C2) 2 1 0.5 C0 C1 C2 1 0 0 0.1 0.2 0.3 Ia/P 0.4 0.5 0.1 0.2 0.3 Ia/P Figure 8. Coefficients predicted by proposed polynomials used in NRCS peak flow calculation Part I: VFSMOD-W: Model Documentation 22 3.2.3 Time correction for hydrograph to match hyetograph 3.2.3.1 Option 1: based on NRCS abstraction method Following the NRCS definition for abstraction and curve number we have: Figure 9. Precipitation partition in NRCS method. Since we can calculate the initial abstraction as: Ia=0.2 S, and S=25400/CN-254 (22) as shown in *.out file, we could find the time when this initial abstraction ends (ti) by interpolating in the constructed NRCS 10-min hyetograph (*.hyt file). Since the starting time for runoff coincides the time rainfall excess begins, a time shifting is needed in the hydrograph to match the rainfall as, toff=ti (23) and all the hydrograph times will be corrected as, t=t+toff (24) 3.2.3.2 Option 2: based on NRCS abstraction and Unit Hydrograph Based on the unit hydrograph, by definition, the time to peak in the unit hydrograph is defined as (see Figure 10), tp = tL + De/2 = 0.6 tc +De/2 Part I: VFSMOD-W: Model Documentation (25) 23 O Time, t Rainfall excess De, duration of rainfall excess tL Q Runoff volume qp Peak runoff O tp Time, t tb Figure 10. Hydrograph quantities used in calculation of time shifting. We can now calculate the duration of the rainfall excess, De, as: De= D - ti (26) In this option 2, the corrected time to peak of the hydrograph can be obtained from the ordinate of the unit hydrograph as, tp’=0.127481*Q*A/qp (27) A time shifting is needed in the hydrograph to match the rainfall as, toff=tp - tp’ (28) and all the hydrograph times will be corrected as, t=t+toff (29) An example showing the calculations for both options 1 and 2 is shown below. Versions of UH after 0.7 implement Option 1 since it produces runoff after the peak of the hyetograph as in observed natural events (see Figure 11). Part I: VFSMOD-W: Model Documentation 24 0 Option 1--> toff=ti UH based Option 2--> toff=tp-tp’ Rainfall q (m3/s) 0.008 5∗10-6 0.006 0.004 1∗10-5 Rainfall (m/s) 0.01 0.002 0 0 5000 1∗104 1.5∗104 2∗104 1.5∗10-5 Time (s) Figure 11. Time shifting of hydrographs to match the storm. 3.3 Incoming sediment load calculation 3.3.1 Universal Soil Loss Equation (USLE) The Universal Soil Loss Equation (USLE) was developed in the 1950’s by Wischmeier and Smith (1978) as an empirical equation to address erosion from areas characterized by overland flow. The equation was derived from thousands of site-years of observed erosion rates around the world. The equation is given by: A = RKLSCP (30) A = soil loss average over the slope length; R = combined erosivity of rainfall and runoff (see section 3.3.2); K = soil erodibility factor, determined as the soil loss from a unit plot with dimensions 22 m (73 feet) on a 9% slope tilled up and down slope with tillage periodically to prevent surface crusting and weeds; LS = topographic factor based on the lenght and slope and is computed as: n L = ------ 22 where = slope length in m and n = slope length exponent, which is 0.5 for slopes > 4%, 0.4 for slopes between 3% and 4%, and 0.3 for slopes < 3%. Part I: VFSMOD-W: Model Documentation 25 S = Slope factor calculated as: 2 S = 65.4s + 4.56s + 0.065 where s=sin( ); =slope angle C = cover management factor - ratio of soil loss from the particular cover management to that of the unit plot (dimensionless) P = conservation practice factor - ratio of soil loss from the practice to that of the unit plot (dimensionless) The unit plots were defined as 22 m (73 feet) in length, 9% slope, tilled up and down the slope periodically to prevent surface crusting and weeds. The values L, S, C, and P are referenced to this standard plot. For example, a C=0.5 indicates that one would expect about one-half the erosion with this cover-management than from the standard plot. Since the USLE is applicable to areas dominated by overland flow with little or no concentrated flow pathways, it lumps rill and interrill erosion. The R factor combines rainfall and runoff erosivity. In the annual version of the equation, the units are usually expressed as EI units per unit time. The original units used by Wischmeier are (100 ft-tons/acre)(in/h) which are often referred to as the Wishmeier English EI units. R ranges from 50-550 for eastern US. In North Carolina, R ranges 330 in the Southeastern portion of the state to 175 in the Appalachians. In the Piedmont area, the annual R is approximately 250. Foster (1982) indicates that no single metric unit has been accepted although for modeling convenience he suggests Newtons/h. So to convert the Wischmeier English units to N/h, multiply R by 1.702. The soil erodibility factor, K, is generally selected based on the top soil. The english units for K are tons/(acre EI), with typical values ranging from 0.05 - 0.60. The SI metric units for K are usually expressed as (kg/N)*(h/m2). The factor to convert english units to SI metric is to multiply by 0.1317. So, for soil losses (A=RK, the two quantities in the USLE with dimensions) expressed as kg/m2, then the SI units for R is N/h. K can be approximated based on data from Wischmeier et al. (1971). He developed a regression equation based on data collected from 55 midwestern soils using percentages of organic matter, primary particles (sand, silt, clay) and permeability. In GLEAMS this relationship was further simplified to: K = TF 12.0 – OM + SF + PF (31) where: K = soil erodibility factor in tons/(acre EI); TF = texture factor; OM = percentage organic matter; SF = structure factor; PF = permeability factor. TF, SF, and PF are given in the following Table for the primary soil types. K is converted to SI units, (kg/N)*(h/m2), by multiplying by 0.1317. So K in SI units (kg/ Part I: VFSMOD-W: Model Documentation 26 N)*(h/m2) is given by: K = 0.1317 TF 12.0 – OM + SF + PF (32) . TABLE 1. Factors for computing K by soil type (from GLEAMS based on data from Wischmeier et al. (1971)). Soil Type Sand Silt % % Texture Factor Structure Factor Permeability Factor D50 Clay 20. 30. 0.01287 0.0650 0.075 23.0 Silty clay 10. 45. 0.01870 0.0650 0.075 24.0 Sandy Clay 50. 10. 0.01714 0.0650 0.075 66.0 Silty clay loam 15. 50. 0.02606 0.0650 0.050 25.0 Clay loam 35. 30. 0.02360 0.0650 0.050 18.0 Sandy clay loam 55. 20. 0.02778 0.0650 0.050 91.0 Silt 5. 85. 0.05845 0.0650 0.025 19.0 Silt loam 20. 60. 0.04259 0.0650 0.025 27.0 Loam 45. 35. 0.03618 0.0325 0.025 35.0 Very fine sandy loam 60. 25. 0.03877 -0.0350 0.000 35.0 Fine sandy loam 60. 25. 0.03205 0.0000 0.000 80.0 Sandy loam 60. 25. 0.02549 0.0325 0.000 98.0 Coarse sandy loam 60. 25. 0.01914 0.0325 0.000 160.0 Loamy very fine sand 84. 8. 0.03726 -0.0325 -0.025 90.0 Loamy fine sand 84. 8. 0.02301 0.0000 -0.025 120.0 Loamy sand 84. 8. 0.01624 0.0325 -0.025 135.0 Loamy coarse sand 84. 8. 0.00982 0.0325 -0.025 180.0 Very fine sand 90. 5. 0.04401 -0.0325 -0.050 140.0 Fine sand 90. 5. 0.02173 0.0000 -0.050 160.0 Sand 90. 5. 0.01481 0.0325 -0.050 170.0 Coarse sand 90. 5. 0.00827 0.0325 -0.050 200.0 3.3.2 Modifications to USLE to handle storm events USLE was developed for extended periods, for example yearly. To attempt to use USLE for storm events, others have modified EI to represent a storm event and used this in place of R in the original equation (Williams 1975). The erosion index, EI, is a measure of total raindrop energy of a storm. One approach for computing EI is to examine 30 min rainfall intensities and compute erosion indices for these periods referred to as EI30. In this approach, one sums EI over each rainfall period to obtain a rainfall-erosivity factor for the Part I: VFSMOD-W: Model Documentation 27 storm. In the CREAMS model, Cooley (1980) used e = 916 + 331 log i (33) where e is the energy in ft-ton/acre-in (1 ft-ton/acre-in = 26.38 J/m3 or 26.38 N/m2), i is the hourly intensity in in/h (in/h = 0.007 mm/s) and log is base 10. The E= e.r over the storm where r was the increment of rainfall during the rainfall period. In this situation, the product of E and the maximum 30-min rainfall intensity (I30) divided by 100 is used as the erosivity factor, R, in the USLE for the particular storm. Multiplication of this by 1.702 yields consistent SI metric units of N/h. In GLEAMS and the daily rainfall version of CREAMS, the EI30 for a 24 hour rainfall, VR in inches, is computed as: EI 30 ---------- = 7.87V 1.51 R 100 (34) The units for the daily EI30 are ft-ton/acre-in. For daily rainfall amounts, another approximation for EI for a storm is: 1.51 EI = 8.0V R (35) where VR=volume of rainfall in inches. The default units for EI are (ft-tons)(in/h) and if we multiply by 1.702, then we obtain N/h. Foster et al. (1977) suggested an improved erosivity factor for a single storm over that of substituting storm EI for R. This approach combines the effect due to runoff and rainfall into the erosivity factor. So for a single storm, Foster et al. (1977) defines Rm in N/h R m = 0.5R St + 1 --3 0.35V u pu (36) RSt = E I30 where E=storm’s total energy and I30=maximum 30 min rainfall intensity in N/h; Vu = volume of runoff (mm); pu = peak rate of runoff (mm/h). Williams (1975) suggested a further modification to R to handle areas larger than field-scale. This modification makes an attempt to account for deposition within the area which would reduce the sediment losses from the area. Foster et al. (1982) reported the modification of R as, R w = 9.05 VQ p Part I: VFSMOD-W: Model Documentation 0.56 (37) 28 where Rw = storm modified R (see below for explanation of units); V = volume of runoff (m3); Qp = peak discharge rate (m3/s). Using Rw in place of R in the USLE is referred to as the modified USLE (or MUSLE). The units of soil loss for this version are Mg for the total watershed area and not per unit area as in the original USLE. This assumes that the soil erodibility K units are Mg.h/ha N. 3.4 Computational Structure of UH The program UH generates the necessary inputs from the upslope source area for vfsmod. The inputs for UH are discussed in the User’s Manual along with a sample input and data set. Figure 12 shows the computation structure of UH. First, the input data describing the source area is read. Next, UH computes the total runoff from the source area using the SCS Curve Number method. The time of concentration, peak runoff rate and time of peak is computed by the SCS TR55 method. Next, SCS unit hydrograph theory is used to estimate the runoff hydrograph. An idealized rainfall hyetograph is generated from the SCS storm type. MUSLE is then used to estimate the sediment loss from the source area for the storm. The sediment loss is partitioned into silt and clay based on the soil particle distribution in the top soil. The average concentration in runoff then estimated based on the total runoff and distribution of soil particles in the sediment loss. Finally, the results are used to create input files for vfsmod. These files include data for the hyetograph, the runoff hydrograph, and sediment loss. Part I: VFSMOD-W: Model Documentation 29 Read Input Data for Source Area Calculate Runoff by SCS Method Calculate time of concentration, Peak Flow, Time to Peak by SCS TR55 Create Runoff Hydrograph from SCS unit hydrograph Develop Rainfall hyetograph from SCS storm type Calculate Storm erosion using MUSLE & average Sediment Concentration in Runoff Write Input Files for VFSMOD Figure 12. Computations in UH. 3.5 Sensitivity Analysis of VFSMOD. A sensitivity analysis was performed to gain some insight in the dependence of model outputs on certain model parameters and to assist in the model calibration (MuñozCarpena et al. 1999). The study showed that the main parameters controlling the hydrology outputs were soil hydraulic conductivity and initial water content whereas the model was fairly insensitive to changes in saturated water content and suction at the wetting front values. Previous research (Muñoz-Carpena et al., 1993a) showed that Manning's surface roughness controls mainly the time to peak of the outgoing hydrograph. Testing on the sediment component of the model showed that the main parameters controlling sediment outflow are media spacing, and particle diameter. Variations in the Part I: VFSMOD-W: Model Documentation 30 modified Manning’s roughness had relatively little effect on the output and the effect of media height was only visible for large events when the filter began to be inundated with sediment. 3.6 Previous Testing and Applications VFSMOD was tested with natural events data at a North Carolina Piedmont (MuñozCarpena et al, 1999) and a Coastal Plain (Muñoz-Carpena, 1993) experimental sites. Both sites had grass filter strips (mixture of fescue, bluegrass and bermuda grass) with ratios of field to filter lengths from 4.5:1 to 9:1. The field area had varying slope from 5-10% and the filter strip somewhat less. The soil types were Cecil sandy clay loam at the Piedmont site and Rains loamy-sand at the Coastal Plain site (Parsons et al., 1991). In general, good agreement was obtained between observed and predicted hydrology and sediment outflow values. Some sources of variability were discussed to explain some anomalous events. Researchers at the University of Guelph (Canada) tested the model against field experimental data (Abu-Zreig et al., 1999, 2001). They reported good agreement (R2=0.9) between model predictions (infiltration volume and sediment trapping efficiency) and measured values if actual filter flow widths (discounting concentrated flow segments) are used rather than total filter length. Factors affecting sediment trapping in VFS were also studied using VFSMOD in a follow-up study (Abu-Zreig, 2001). Recently the program has been used to model the effect of VFS in a small watershed (72 Ha) (Kizil and Lowell, 2002), as well as a component to simulate fecal pathogen filtering from runoff (Zang et al., 2001) For an updated list of the latest applications, please visit the model web page at http:// abe.ufl.edu/carpena/vfsmod . Part I: VFSMOD-W: Model Documentation 31 4. Sensitivity and Uncertainty Analysis Procedures for UH and VFSMOD Built In VFSMOD-W The sensitivity of a model output to a given input factor has been traditionally expressed mathematically as derivatives of the model output with respect to the input variation, sometimes normalized by either the central values where the derivative is calculated or by the standard deviations of the input and output values (Haan et al., 1995). These sensitivity measurements are "local" because they are fixed to a point (base value) or narrow range where the derivative is taken. These local sensitivity indexes are classified as "one-parameter-at-a-time" (OAT) methods, i.e. they quantify the effect of a single parameter by assuming all others are fixed (Saltelli et al., 2005). Local OAT sensitivity indexes are only efficient if all factors in a model produce linear output responses, or if some type of average can be used over the parametric space. Often the model output responses to changes in the input factors are non-linear and an alternative "global" sensitivity approach, where the entire parametric space of the model is explored simultaneously for all input factors, is needed. The advantage of the global over a local OAT method is that it results in the ranking of parameter importance and provides information not only about the direct (first order) effect of the individual factors over the output, but also about their interaction (higher order) effects. Different types of global sensitivity methods can be selected based of the objective of the analysis, the number of uncertain input factors, the degree of regularity of the model and the computing time for single model simulation (Cukier et al. 1973, 1978; Koda et al. 1979; Morris 1991, Saltelli et al., 2000a, 2004, 2005; Sobol 1990; Wallach et al., 2006). These two methods of uncertainty and sensitivty analyis are presentated in the following sections 4.1 Local (OAT) Sensitivity Analysis Haan et al. (1995) outlined the statistical procedure for evaluating hydrology and water quality models. Their procedure included: conducting sensitivity analysis, generating probability distributions for model inputs, generating probability distributions for the model outputs, and using the probability distributions of the model outputs to assess uncertainty. Using an example model, they conducted a sensitivity analysis to identify the input parameters that have the most impact on the outputs. The absolute sensitivity, Si, of a given output, O, relative to input parameter, Pi, is defined as Si = O Pi (38) The relative sensitivity, Sri, of the output parameter with respect to changes in the input parameter is computed as: Part I: VFSMOD-W: Model Documentation 32 S ri = O P i ---- Pi O (39) Once the most sensitive inputs are identified, the model users can concentrate on determining the “best” or most appropriate values for a given desing scenario. In addition, these parameters can also be used to evaluate the uncertainty in the model outputs based on these most sensitive inputs. This approach involves selecting probability distributions for each sensitive input based on based on previous literature and field research. After the probability distributions are identified for each of the inputs, then these distributions are sampled for typical inputs and the simulated outputs are used to determine a probability distribution for each output parameter. Two possible methods were presented for generating the general probability distributions of the output variables of interest (Haan et al. 1995 and Haan et al. 1998). The first method was First Order Approximation (FOA) (Morgan and Henrion, 1990). In this method, the mean or expected value of the output is estimated as E O = Model P b (40) and the variance is estimated as n Var O = i=1 n n O 2 Var P i + 2 Pi i = 1j = i + 1 O O Cov P P i j P i P j (41) where O is the output parameter of interest, Pb, is the base input parameter values for the selected input variable, Pi is the input parameter i, n is the number of input parameters, Var is the variance and Cov is the covariance. If the input parameters are independent and uncorrelated (an assumption that is often made), then the second term is 0 (ie, Cov(Pi, Pj) = 0). The slope of the sensitivity relationship between O and Pi is Si. With these assumptions the variance equation becomes: n Var O = Si 2 Var P i (42) i=1 This type of analysis produces good estimates of the mean and variance of the output parameter, O, when the coefficient of variation (Mean/Standard Deviation) of the input parameter is small and the relationship between O and Pi, over the range of potential inputs, is linear. An alternative more general approach is the technique of Monte Carlo Simulations (MCS). An outline of this procedure is: Part I: VFSMOD-W: Model Documentation 33 1) select the most sensitive input parameters, 2) develop probability distribution functions for each input parameter, 3) randomly generate input parameter datasets based on the probability distributions, 4) perform the model simulation with the randomly generated input dataset, 5) repeat steps 3 and 4 for a large number of trials, 6) generate probability distribution functions for the model outputs of interest, and 7) use the output probability distribution functions to evaluate uncertainty in the model by placing confidence levels on the outputs Additional details on the application of this procedure can be found in Parsons and Muñoz-Carpena (2001) 4.2 Global Sensitivity and Uncertainty Analysis 4.2.1 The Morris Method The screening method proposed by Morris (1991) (herein "Morris method" or "Morris") and later modified by Campolongo et al. (2005), was used in this study because it is relatively easy to apply, requires very few simulations, and its results are easily interpreted (Saltelli et al. 2005). Morris (1991) proposed conducting individually randomized experiments that evaluate the elementary effects (relative output differences) of changing one parameter at a time. Each input may assume a discrete number of values called levels that are selected within an allocated range of variation for the parameter. For each parameter, two sensitivity measures are proposed: (1) the mean of the elementary effects, µ, which estimates the overall effect of the parameter on a given output; and (2) the standard deviation of the effects, , which estimates the higher-order characteristics of the parameter (such as curvatures and interactions). Since sometimes the model output is non-monotonic, Campolongo et al. (2005) suggested considering the distribution of absolute values of the elementary effects, µ*, to avoid the canceling of effects of opposing signs. The number of simulations (N) to perform in the Morris analysis results as: N = r k + 1 (43) where r - sampling size for search trajectory (r = 10 produces satisfactory results), k number of factors. Although elementary effects are local measures, the method is considered global because the final measure µ * is obtained by averaging the elementary effects and this eliminates the need to consider the specific points at which they are computed (Saltelli et al., 2005). Morris (1991) recommended applying µ (or µ* thereof) to Part I: VFSMOD-W: Model Documentation 34 σ- Interactions rank parameters in order of importance and Saltelli et al. (2004) suggested applying the original Morris measure when examining the effects due to interactions. To interpret the results in a manner that simultaneously informs about the parameter ranking and potential presence of interactions, Morris (1991) suggested plotting the points on a µ*- Cartesian plane (Figure 13). Because the Morris method is qualitative in nature, it should only be used to assess the relative parameter ranking. μ* - Importance Figure 13. Morris sensitivity graph. 4.2.2 Extended FAST A variance-based method like the Fourier Amplitude Sensitivity Test (FAST) can be used to obtain a quantitative measure of sensitivity (Cukier et al. 1973, 1978; Koda et al. 1979). FAST decomposes the total variance V = 2 y of the model output in terms of the individual factors X i ,Y = f X 1 X 2 X k using spectral analysis so that: V = 2 Y2 = V 1 + V 2 + V 3 + + V k + R (44) where Vi is the part of the variance that can be attributed to the input factor Xi alone, k is the number of uncertain factors, and R is a residual corresponding to higher – order terms. The first order sensitivity index Si, defined as a fraction of the total output variance attributed to a single factor, can then be taken as a measure of global sensitivity of Y with respect to Xi, i.e. Vi S i = ----V (45) To calculate Si, FAST technique randomly samples the k-dimensional space of the input parameters using a series of sinusoidal trayectory of changing phase. The number of evaluations required in the analysis can be expressed as, Part I: VFSMOD-W: Model Documentation 35 N = Mk + 2 (46) where M is a number between 500 and 1000. For a perfectly additive model Si = 1, i.e. no interactions are present and total output variance is explained as a summation of the individual variances introduced by varying each parameter alone. In general, models are not perfectly additive and Si < 1. FAST was extended by Saltelli et al. (1999) to incorporate the calculation of the total order effects through the total sensitivity index STi, calculated as the sum of the first and all higher order indices for a given parameter Xi. For example, for parameter number 1: S T1 = S 1 + S 1i + S 1jk + + S 1n (47) S T1 – S 1 = S 1i + S 1jk + + S 1n (48) and then For a given parameter Xi, interactions can be isolated by calculating STi - Si , which makes the extended FAST a powerful method for quantifying the individual effect of each parameter alone (Si) or through interaction with others (STi - Si). An additional benefit of the Extended FAST analysis is that since the results are derived from a randomized sampling procedure, they can be used as the basis for the uncertainty evaluation by constructing cumulative probability functions (CDFs) for each of the selected outputs. This leads to a very efficient Monte-Carlo type of uncertainty analysis since only the sensitive parameters are considered as the source of uncertainty. In general, global sensitivity and uncertainty analysis follows six main steps (Figure14): (1) PDFs are constructed for uncertain input factors; (2) input sets are generated by sampling the multivariate input distribution, according to the selected global method (i.e. Morris method for the initial screening and extended FAST for the quantitative refining phase); (3) model simulations are executed for each input set; (4) global sensitivity analysis is performed according to the selected method; (5) if the Morris screening method is selected, it results in a subset of important parameters, and steps 2-4 are repeated only for those important parameters, using the extended FAST method; (6) uncertainty is assessed based on the outputs from the extended FAST results by constructing PDF/CDF and statistics of error calculated. A batch processor is available within VFSMOD-W to perform the global sensitivity and uncertianty procedure outlined in Fig. 14. SimLab v2.2 (Saltelli et al., 2004) statistical pre-processor module executes step 1 (Figure 14), based on the PDF types and statistics provided (described in the next section) and the analysis method selected (Morris or extended FAST in this case). With this information the pre-processor produces a matrix of sample inputs to run the model (step 2, Figure14). An interface program was written in C# (C-sharp language) and added to the VFSMOD-W v 3.x (and above) GUI to run the model Part I: VFSMOD-W: Model Documentation 36 for each new set of sample inputs. The program automatically substitutes the new parameter set into the input files, runs the model, and performs the necessary postprocessing tasks to obtain the selected model outputs for the analysis that are stored in a matrix (step 3, Figure 14). The output file created by VFSMOD-W is compatible with Simlab so that the analysis can be completed using the Statistical Post-Processor module of SimLab. For this, the input (Simlab sample file) and output matrices (from VFSMODW) are called into the program to calculate the sensitivity indexes of the Morris and the Extended FAST methods (step 4, Figure 14). The Data Analysis Toolpack of the Excel spreadsheet software (Microsoft Corp. Redmond, Washington, USA), can also be used to construct the output probability distributions and to quantify the uncertainty based on the set of Extended FAST results (step 6, Figure 14). Figure 14. General schematic diagram of the global sensitivity and uncertainty analysis. Numbers in circles represent the steps in the global evaluation procedure explained in the text. Part I: VFSMOD-W: Model Documentation 37 5. Inverse Calibration Modeling water, solute, and/or sediment transport is nowadays widely used for assessing the impact of human activities on water resources and for designing best management practices to reduce these impacts. Particularly, the vegetative filter strip model system (VFSMOD-W) allows for predicting water and contaminant transport through vegetated filters. VFSMOD-W, developed by Muñoz-Carpena and Parsons (1999; 2005), simulates water and sediment transport in vegetated filters based on overland flow hydraulics and infiltration into the soil matrix. The success in modeling such processes heavily depends on the quality of the model parameters, i.e. they are representative of the hydraulic properties of the soil and the vegetated filter. A popular method for parameter estimation is manual calibration by a “trial and error” procedure comparing simulated values of runoff/sediment outflow from the vegetative filter with those experimentally measured. However, this method is time consuming; subjective, since the modeler does not know when to stop the calibration process; it is difficult to judge in which direction the parameters should be modified; and quantification of the uncertainty on the obtained parameters cannot be performed in a rigorous way. Therefore, the manual calibration method cannot ensure that the best parameter set is found. A more elaborated, complex and increasingly attractive form of parameter estimation is inverse modeling. This procedure provides effective parameters in the range of the particular model applications and overcomes the drawbacks of manual calibration (Ritter et al., 2003). Basically the process searches for the best set of parameters in an iterative way, by varying the parameters and comparing the numerical solution given by the model with the observations of a certain state variable (Lambot et al., 2002; Ritter et al., 2003; 2004). By coupling the computer model with an optimization algorithm, the parameter search consists of finding the global minimum of an objective function defined by the error between measured and simulated values. Different techniques have been developed in the past to numerically solve inverse problems. Among others, we may consider methods such as the Steepest Descendent, Newton’s, Gauss, Levenberg-Marquardt, Simplex, and Global Optimization Techniques (Hopmans and Simunek, 1999). Each of these have their own advantages and drawbacks, and the success of finding the global minimum depends generally on the presence of multiple local minima in the objective function. In addition to these algorithms, the GMCS-NMS (Global Multilevel Coordinate Search combined with a Nelder Mead Simplex) is a powerful available alternative (Lambot et al., 2002; Ritter et al., 2003). This consists in the sequential combination, as described by Lambot et al., (2002), of the global optimization algorithm developed by Huyer and Neumaier (1999) and the classical Nelder-Mead Simplex (Nelder and Mead, 1965). In this work, we have integrated the GMCS-NMS within the VFSMOD-W and its graphical user interface to allow the model users to perform automatic inverse optimization of the hydraulic and sediment transport parameters of VFSMOD-W when Part I: VFSMOD-W: Model Documentation 38 experimental data are available. The inverse simulation of the flow or sediment transport parameters is carried out by minimizing an objective function, OF( ), that represents the error between measured and simulated values, such that it can be defined as a nonlinear least squares problem by: N OF b = w i Y o t i – Y s t i b 2 (49) i=1 where the right-hand side represents the deviations between observed ( Y o ) and predicted ( Y s ) time series (hydrographs or sedimentographs) using the parameter vector ; t is the time; N is the number of measurements available; and wi is the weight of a particular measurement, which denotes the measurement error and is set equal to s-2, where s is the standard deviation of the measured data (Lambot et al., 2002). To perform the inverse calibration of the parameter vector , VFSMOD is coupled with the Global Multilevel Coordinate Search, GMCS, algorithm (Huyer and Neumaier, 1999). This algorithm combines global and local search capabilities with a multilevel approach. The GMCS is a good alternative to other existing optimization algorithms, because it can deal with objective functions with complex topography, it does not require powerful computing resources, and initial values of the parameters to be optimized are not needed. To refine the minimization of the objective function, the GMCS is combined sequentially with the Nelder-Mead Simplex (NMS) algorithm (Nelder and Mead, 1965) (Figure 15). Further details about application of GMCS-NMS to inverse modeling of soil hydraulic properties are given in Lambot et al. (2002) and Ritter et al. (2003). Furthermore, model adequacy, uncertainty and correlation associated with the estimated parameters is determined according to Hollenbeck et al. (2000) and Ritter et al. (2004) Part I: VFSMOD-W: Model Documentation 39 1st Process b GMCS VFSMOD b ) OF( bopt 2nd Process VFSMOD parameters input files b VFSMOD parameters input files NMS VFSMOD b ) OF( bopt Figure 15. Scheme for the inverse modeling procedure to calibrate the VSFMOD parameters When calibrating parameters, some criteria must be defined to evaluate the goodnessof-fit of the model simulation using the optimized parameters. Several authors point out that to assess the performance of the model calibration, the use of a single statistic might be misleading and more should be used along with graphical representations (Berthouex and Brown, 2002; James and Burgues, 1982; Tufte, 1983; Legates and McCabe, 1999). The goodness of fit of the simulations with the optimized parameters was evaluated in terms of the coefficient of efficiency (Nash and Sutcliffe, 1970) and the root mean square error. The coefficient of efficiency (Ceff) has been widely used to evaluate the performance of hydrologic models. It compares the variance about the 1:1 line (perfect agreement) to the variance of the observed data and it ranges from -8 to 1. Thereby Ceff = 1 implies that the plot of predicted vs. observed values matches the 1:1 line (Legates and McCabe, 1999). The root mean square error (also called residual variation or standard error of estimate), RMSE, is a useful single measure of the prediction capability of a model since it indicates the precision with which the model estimates the value of the dependent variable (Berthouex and Brown, 2002). Part I: VFSMOD-W: Model Documentation 40 6. Design Procedure The design objective is to find optimal constructive characteristics (length, slope, vegetation) of a VFS to reduce the outflow of sediment from a given disturbed area (soil, crop, area, management practices) to achieve a certain reduction in % sediment (i.e. that for TMDLs). Proposed target outputs for analysis will be the sediment delivery ratio (SDR) and runoff delivery ratio (RDR) computed as: SDR = (Mass of Sediment Exiting the Filter)/(Mass of Sediment Entering the Filter) RDR = (Runoff Exiting the Filter)/(Runoff Entering the Filter) From a design perspective, we require the VFS to accommodate storms with return periods of at least 1 and 2 years and probably 5 and 10 years. The first step in the analysis is to generate inputs into the VFS from the soils and crops present in the source study area, for each of the design storms and soils selected for the analysis. To do this, the precipitation depths of selected return periods for the area, along with the area’s NRCS runoff and MUSLE erosion inputs are processed through the input preparation utility (UH) to create formatted inputs for VFSMOD: hyetograph (sample.irn), incoming sedimentograph (sample.isd) and hydrograph (sample.iro). With these inputs, the VFSMOD model routes the incoming runoff and sediment, and calculates water and sediment retained at the filter, outflow, and filter performance. For this, we must describe the actual vegetative filter strip characteristics to analyze for each design runoff event. Usually the most relevant VFS characteristics to consider from a design prespective are: soil type (sample.iso), filter length, uniformity and slope (sample.ikw), and vegetation characteristics (sample.igr). The VFSMOD sample project (sample.prj) provided with the package installation for all platforms that can be used as a pattern and changed for each design run. Information for standard USDA soil types Green-Ampt infiltration inputs, and vegetation covers (spacing, height) to be used in the analysis can be found in this document. For each combination of inputs a new project must be created and the model executed. If the problem is to be prepared manually (UNIX and DOS versions) it is usually more efficient to create a naming convention for each project that reflects the simulation run characteristics. The proposed sequence is to prepare the UH (*.inp) input files (combination of source area soils types and design storms) first and then process them with UH to produce the corresponding VFSMOD inputs (*.iso, *.irn, *.isd). Afterwards, the user creates the project files (*.prj), one per simulation, as combination of the UH outputs and modification of the remaining input files (*.igr, *.ikw, *.iso) as needed. Each file must be then processed with VFSMOD and the SDR and RDR results obtained from the *.osm files. From these outputs, SDR (or RDR) versus filter length, the user can obtain the optimal filter characteristics for each return period and soil type when overlaying the Part I: VFSMOD-W: Model Documentation 41 pre-defined sediment TMDL expressed in terms of a desired filter effectiveness (% SDR or RDR). In the MS-Windows VFSMOD-W modelling system, versions 2.x and up, this task is automated. The projects for each combination of design inputs are automatically created within the program GUI after the user selects a range on the desired parameters. This new version also automatically produces combined analysis output tables (see Part III Section 12. on page 143). Additionally, the program provides two powerful tools. Once the optimal design parameters are selected an uncertainty analysis can be conducted using the graphical tools provided. The objective of this analysis is to identify the level of confidence that the adopted design has against the uncertainties present when selecting the model inputs (Parsons and Muñoz-Carpena, 2001, 2002). Finally a sensitivity analysis procedure is included in the GUI to identify the parameters to which the model is more sensitive for a given scenario, thus allowing the user to economize effort by focusing on better identifying just the sensitive parameters (Parsons and Muñoz-Carpena, 2001). An example of design results (see Muñoz-Carpena and Parsons, 2002) is included below. The graph depics the optimal filter lengths to achieve a 75% sediment reduction (SDR=0.25) in a North Carolina Piedmont site (clay soil, 0.5 Ha. source area, 2% slope, 6 hr. storm duration) with a grass mixture vegetation on the filter. Filter lengths from 14-57 m are needed to accomodate storm events associated to 1-10 year return periods. The design assumes homogeneous sheet flow across the filter in all cases.Scheme for the inverse Figure 16. Example of filter design results obtained with VFSMOD-W Part I: VFSMOD-W: Model Documentation 42 7. Potential Users and Applications of the Modelling System VFSMOD is a research model, as such potential users are modelers and scientists involved in studies of sediment and other pollution from various sources and its control, with the aim to gain a better understanding of the processes involved for a given scenario. Results from this model can be used, after calibration and field testing in extrapolation or prediction studies for decision making and design (Suwandono et al., 1999, MuñozCarpena and Parsons, 2002; Parsons and Muñoz-Carpena, 2002). An evaluation of the model from the user’s perspective following modern criteria can be found in MuñozCarpena and Parsons (1999). The GUI and integrated design procedures introduced with v2.x and above, are intended to help extend the model user base to include others like engineers and environmental and natural resources experts, involved in the design, implementation, and evaluation of VFS without requiring in depth computer knowledge. Part I: VFSMOD-W: Model Documentation 43 8. Known Limitations and Applicability of the Models 8.1 Known Limitations of the Model - The handling of overland flow as sheet flow could pose problems when a filter is not properly maintained and concentrated flow occurs within the filter. However, concentrated flow can be effectivelly simuated in VFSMOD by setting diferent dimensions between the field or source area edge (SWIDTH) and the filter entry side (FWIDTH). See Muñoz-Carpena and Parsons, (2004) and Fox et al. (2010). - Notice that there are also critical filter lengths beyond which the sheet, kinematic flow assumption is violated. In addition to the kinematic wave number criteria (eq. 4), McCuen and Spiess (1995) presented a maximum length criteria as nL/(So)1/ 2< 100. A nomograph of this relationship can be seen in Figure 17. Figure 17. Nomograph of critical filter length (McCuen and Spiess, 1995) - Since parameters to describe hydrology and sediment transport in VFS are highly variable, field variability is an inherent source of error. A range of variation in the saturated conductivity parameters is usually needed to fit the model to observed data. Although this variation can be explained by changes in surface conditions due to seasonal and biological factors, these changes are difficult to quantify in field situations. 8.2 Changes in Model Releases Current release v6.x: - Option to simulate flow and infiltration affected by shallow water table conditions - Infiltration option to consider heterogeneous soil profile (i.e. soil horizons) Part I: VFSMOD-W: Model Documentation 44 Next releases: - Option to simulate numerical transport of solutes and multireactive transport (beta). Part I: VFSMOD-W: Model Documentation 45 9. -Distribution and Training The modelling system is provided free of charge to qualified users as an educational and research tool. The model and documentation can be downloaded from the internet at http://abe.ufl.edu/carpena/vfsmod or obtained from the authors. Limited support is available from the authors. Through the web site, the user can send feedback and questions to the authors. No formal training is available but can be arranged with the authors. Part I: VFSMOD-W: Model Documentation 46 10. Acknowledgements This work has been supported by the following programs and institutions: a) 1990-1993 Fellowship from INIA (Agricultural and Food Research Institute of Spain - Ministry of Agriculture) in cooperation with USDA-OICD and the NC State University. b) 1997: Study Leave for Researchers Program of INIA (Agricultural and Food Research Institute of Spain - Ministry of Agriculture) in cooperation with USDA-OICD and the NC State University. c) 1997: ICIA (Agricultural Research Institute of the Canary Islands) d) North Carolina Agricultural Research Service e) USDA-CSREES and Southern Region Research Project S-249 and S-273. f) Univ. of North Carolina, Water Resources Research Institute g) USDA-CSREES and Southern Region Research Project S-1004. h) Florida Agricultural Experiment Station (FAES) Part I: VFSMOD-W: Model Documentation 47 11. References Abu-Zreig, M. 2001. Factors affecting sediment trapping in vegetated filter strips: simulation study using VFSMOD. Hydrological Processes 15(8): 1477-1488 Abu-Zreig M, Rudra R. P., and H. Whitley. 2001. Validation of a vegetated filter strip model (VFSMOD). Hydrological Processes 15(5): 729-742 Abu-Zreig, M. R. P Rudra and H. Whitley. 1999. Sediment trapping in vegetative filter strips. Presented at the 1999 ASAE/CSAE Ann. Intl. Meeting, 19-20 July, Paper 992078, ASAE, St. Joseph, MI. Arcement, G. J. and V. R. Schneider. 1989. Guide for selecting Manning’s roughness coefficients for natural channels and flood plains. U. S. Geological Survey. Water Supply Paper No. 2339. Barfield B. J., E. W. Tollner and J. C. Hayes. 1978. The use of grass filters for sediment control in strip mining drainage. Vol. I: Theoretical studies on artificial media. Pub. no. 35-RRR2-78. Institute for Mining and Minerals Research, University of Kentucky, Lexington. Barfield B. J., E. W. Tollner and J. C. Hayes. 1979. Filtration of sediment by simulated vegetation I. Steady-state flow with homogeneous sediment. Transactions of ASAE. 22(5):540-545. Barfield, B. J., L. G. Wells, and C. T. Haan. 1981. Applied Hydrology and Sedimentology for Disturbed Areas. Oklahoma Technical Press. Stillwater. Berthouex, P.M., and L.C. Brown. 2002. Statistics for Environmental Engineers. Boca Raton: Lewis Pub. Burns, L.A. Exposure analysis modeling system. User’s guide for EXAMS II version 2.94; EPA 600/3-89/084, U.S. EPA, Athens, GA, 1990. Campolongo, F., J. Cariboni, A. Saltelli, W. Schoutens. 2005. Enhancing the Morris Method. In: Hanson, K.M., Hemez, F.M. (eds.): Sensitivity Analysis of Model Output. Proceedings of the 4th International Conference on Sensitivity Analysis of Model Output (SAMO 2004). Los Alamos National Laboratory, Los Alamos. 369-379 Carsel, R.F.; Mulkey, L.A.; Lorber, M.N.; Baskin, L.B. The pesticide root zone model (PRZM): A procedure for evaluating pesticide leaching threats to groundwater. Ecological Model. 1985, 30 (1-2), 49-70. Chu, S. T. 1978. Infiltration during unsteady rain. Water Resour. Res. 14(3):461-466. Cooley, K. R. 1980. Erosivity “R” for individual design storms. In: CREAMS - A Field Scale Model for Chemicals, Runoff and Erosion from Agricultural Management Systems, Vol. III, Chapter 2, USDA-SEA Conservation Report No. 26, pp. 386-397. Cukier, R. I., C. M. Fortuin, K. E. Schuler, A. G. Petschek, and J. H. Schaibly. 1973. Study of the sensitivity of coupled reaction systems to uncertainties in rate coefficients. I Theory, J. Comput. Phys. 59: 3873-3878. Dillaha, T. A., J. H. Sherrard and D. Lee. 1986. Long-Term Effectiveness and Maintenance of Vegetative Filter Strips. VPI-VWRRC-Bull. 153, Virginia Polytechnic Institute and State University, Blacksburg. Dillaha, T. A., R. B. Reneau, S. Mostaghimi and D. Lee. 1989. Vegetative filter strips for agricultural nonpoint source pollution control. Transactions of ASAE 32(2):491-496. Engman, E. T. 1986. Roughness coefficients for routing surface runoff. J. Irrigation and Drainage Eng. ASCE 112(1):39-53. Part I: VFSMOD-W: Model Documentation 48 Foster, G. R. and L. F. Huggins. 1977. Deposition of sediment by overland flow on concave slopes. In: Soil Erosion Prediction and Control. Special Publication No. 21. Soil Conservation Society of America, Ankeny, IA, pp. 167-182. Foster, G. R. 1982. Chapter 8. Modeling the erosion process. In: Hydrologic Modeling of Small Watersheds, Editors: C. T. Haan, H. P. Johnson, and D. L. Brakensiek. ASAE Monograph No. 5, American Society of Agricultural Engineers, St. Joseph, MI, pp. 297-380. Foster, G..R., R.A. Young, and W.H. Neibling. 1985, Sediment composition for nonpoint source pollution analyses. Trans of ASABE 28(1):133-146 Fox, G.A.; Muñoz-Capena, R.; Sabbagh, G.J. Influence of flow concentration on input factor importance and uncertainty in predicting pesticide surface runoff reduction by vegetative filter strips. J. Hydrol. 2010, doi: 10.1016/j.jhydrol.2010.01.020. Fox, G.A.; Sabbagh, G.J. Comment on “Major Factors Influencing the Efficacy of Vegetated Buffers on Sediment Trapping: A Review and Analysis”. J. Environ. Qual. 2009, 38 (1), 1-3. Fox, G.A.; Sabbagh, G.J.; Chen, W.; Russell, M. Comparison of uncalibrated Tier II ground water screening models based on conservative tracer and pesticide leaching. Pest Manage. Sci. 2006, 62 (6), 537-550. Haan, C. T., B. J. Barfield and J. C. Hayes. 1994. Design Hydrology and Sedimentology for Small Catchments. San Diego: Academic Press Haan, C. T., B. Allred, D. E. Storm, G. J. Sabbagh, and S. Prabhu. 1995. Statistical Procedure for Evaluating Hydrologic/Water Quality Models. TRANS ASAE 38(3):725-733. Haan, C. T., D. E. Storm, T. Al-Issa, S. Prabhu, G. J. Sabbagh, and D. R. Edwards. 1998. Effect of Parameter Distributions on Uncertainty Analysis of Hydrologic Models. TRANS ASAE 41(1):65-70. Hayes, J. C. 1979. Evaluation of design procedures for vegetal filtration of sediment from flowing water. unpublished Ph.D. dissertation, Univ. of Kentucky, Lexington, KY USA. Hayes, J. C., B. J. Barfield and R. I. Barnhisel. 1979. Filtration of sediment by simulated vegetation II. Unsteady flow with non-homogeneous sediment. Transactions of ASAE. 22(5):1063-1967. Hayes, J. C., B. J. Barfield and R. I. Barnhisel. 1982. The use of grass filters for sediment control in strip mine drainage. III. Empirical verification of procedures using real vegetation. Report No. IMMR82/070. Int. for Mining and Mineral Res. Univ. of Kentucky, Lexington, KY. Hayes, J. C., B. J. Barfield and R. I. Barnhisel. 1984. Performance of grass filters under Jackson, S.; Hendley, P.; Jones, R.; Poletika, N.; Russell, M. Comparison of regulatory method estimated drinking water exposure concentrations with monitoring results from surface drinking water supplies. J. Agr. Food Chem. 2005, 53 (22), 8840–8847. Laboratory and field conditions. Transactions of ASAE. 27(5):1321-1331. Hickey, A.U.; Doran, B. A review of the efficiency of buffer strips for the maintenance and enhancement of riparian ecosystems. Water Qual. Res. J. Canada 2004, 39, 311– 317. Hollenbeck, K.J., J. Simunek, and M.Th. van Genuchten. 2000. RETMCL: Incorporating maximum-likelihood estimation principles in the RETC soil hydraulic parameter estimation code. Computers & Geosciences 26: 319-327. Part I: VFSMOD-W: Model Documentation 49 Hopmans, J.W., and J. Simunek. 1999. Review of inverse estimation of soil hydraulic properties. In M. Th. van Genuchten, F.J. Leij and L. Wu (eds.). Proc. Int. Workshop, Characterization and Measurement of the Hydraulic Properties of Unsaturated Porous Media, 643-659. University of California, Riverside, C.A. Huyer, W., and A. Neumaier. 1999. Global optimization by multilevel coordinate search. J. Global Optimization 14, 331-355. James, L.D., and S.J. Burgues. 1982. Selection, calibration and testing of hydrologic models, Ch. 11. In: C.T. Haan, H.P. Johnson and D.L. Brakensiek (eds.). Hydrologic Modeling of Small Watersheds, 437–472. ASAE Monograph no. 5, St. Joseph: ASAE. Kizil, U. and L. A. Disrud. 2002. Vegetative Filter Strips Modeling of a Small Watershed. 2002 ASAE Annual International Meeting / CIGR Annual International Meeting, Chicago, Illinois. Paper 02-2133, ASAE, St. Joseph, MI Knisel, Walter G., F. M. Davis, R. A. Leonard. 1992. GLEAMS Version 210: Users Manual. Pre-Publication Copy. US Department of Agriculture, Agricultural Research Service, Available from University of Georgia, Coastal Plain Experiment Station, Bio. and Ag. Engineering, Tifton, GA. UGA-CPES-BAED Publication No. 5. 259 pp. Koda, M., G. J. McRae, J. H. Seinfeld. 1979. Automatic Sensitivity Analysis of Kinetic Mechanisms. Int. J. Chem. Kin. 11: 427-444. Lighthill, M. J. and C. B. Whitham. 1955. On kinematic waves: flood movement in long rivers. Proc. R. Soc. London Ser. A. 22:281-316. Lambot, S., M. Javaux, F. Hupet, and M. Vanclooster. 2002. A global multilevel coordinate search procedure for estimating the unsaturated soil hydraulic properties. Water Resour. Res. 38(11): 1224. Legates, D. R., and G. J. McCabe. 1999. Evaluating the use of "goodness-of-fit" measures in hydrologic and hydroclimatic model validation. Water Resour. Res. 35: 233-241. Lin, J. A progress report for aquatic exposure assessment in the U.S. EPA Office of Pesticide Programs U.S. EPA Office of Pesticide Programs, Washington, D.C., 2009; http:/ /www.epa.gov/oppefed1/ecorisk/presentations/setac_eu.htm#Some. Lin, J.; Young, D.; Kennedy, I. The Tier II Modeling approach for aquatic exposure assessment in the U.S. EPA Office of Pesticide Programs; U.S. EPA Office of Pesticide Programs, Washington, D.C., 2007; www.epa.gov/oppefed1/ecorisk/ presentations/setac_slc.htm. Liu, X.; Zhang, X.; Zhang, M. Major factors influencing the efficacy of vegetated buffers on sediment trapping: A review and analysis. J. Environ. Qual. 2008, 37, 1667-1674. McKay, M. D., W. J. Conover R. J. Beckman. 1979. A Comparison of Three Methods for Selecting Values of Input Variables in the Analysis of Output from a Computer Code, Technometrics 21: 239-245. McKay, M. D. 1995. Evaluating prediction uncertainty, NUREG/CR-6311, U.S. Nuclear Regulatory Commission and Los Alamos National Laboratory. McCuen, R. H., W. J. Rawls and D. L. Brakensiek. 1981. Statistical Analysis of the Brooks and Corey and the Green-Ampt parameters across soil textures. Water Resour. Res. 17(4):1005-1013. Mein, R. G. and C. L. Larson. 1971. Modelling the infiltration component of the rainfallrunoff process, Bulletin 43, University of Minnesota, MN, Water Resources Research Center. Part I: VFSMOD-W: Model Documentation 50 Mein, R. G. and C. L. Larson. 1973. Modeling infiltration during a steady rain. Water Resourc. Res. 9(2):384-394. Morgan, M. G. and M. Henrion. 1990. Uncertainty. Cambridge University Press. Cambridge, MA. Morris, M. D. 1991. Factorial sampling plans for preliminary computational experiments. Technometric 33: 161-174. Muñoz-Carpena, R. 1993. Modeling hydrology and sediment transport on vegetative filter strips. Ph.D. dissertation, North Carolina State Univ., Raleigh. Muñoz-Carpena, R., C. T. Miller and J. E. Parsons. 1993a. A quadratic Petrov-Galerkin solution for kinematic wave overland flow. Water Resour. Res. 29(8):2615-2627. Muñoz-Carpena, R.; Fox, G.A.; Sabbagh, G.J. Input factor importance and uncertainty in predicting pesticide surface runoff reduction with vegetative filter strips. J. Environ. Qual. 2010, doi: 10.2134/jeq2009.0300. Muñoz-Carpena, R., J. E. Parsons and J. W. Gilliam. 1993b. Numerical approach to the overland flow process in vegetative filter strips. Transactions of ASAE. 36(3):761770. Muñoz-Carpena, R., J. E. Parsons and J. W. Gilliam. 1999. Modeling hydrology and sediment transport in vegetative filter strips and riparian areas. J. of Hydrology 214(14):111-129. Muñoz-Carpena, R. and J.E. Parsons. 1999. Evaluation of VFSmod: a vegetative filter strips hydrology and sediment. Paper of ASAE no. 992152. ASAE: St. Joseph Muñoz-Carpena, R. and J.E. Parsons. 2002. A normalized design procedure to meet sediment TMDL with vegetable filter strips. In: Watershed Management to Meet Emerging TMDL Environmental Regulations. Proc. (11-13 March, Fort Worth, Texas, USA), eds. A. Saleh, B. Wilson, pp. 256-261. St. Joseph, Michigan: ASAE. Muñoz-Carpena, R.; Parsons, J.E. 2004. A design procedure for vegetative filter strips using VFSMOD-W. T. ASAE 2004, 47 (6), 1933-1941. Muñoz-Carpena, R. 2012. Continuous-simulation components for pesticide environmental assessment with VFSMOD: 1. VFS pesticide residue between runoff events. Technical Report. University of Florida, Agricultural Engineering Department. URL (Accessed June 15, 2014): http://abe.ufl.edu/carpena/vfsmod/FOCUS/ VFSMOD_Continuous_Sim_Report_PesticideResidue_MunozCarpena.pdf Nash, J.E., and J.V. Sutcliffe. 1970. River flow forecasting through conceptual models. Part 1-A discussion of Principles. J. Hydrol. 10, 282-290. Nelder, J.A., and R. Mead. 1965. A Simplex Method for Function Minimization. Computer Journal 7, 308 – 313. Neitsch, S.L.; Arnold, J.G.; Kiniry, J.R.; Williams, J.R. Soil and Water Assessment Tool: Theoretical Documentation, Version 2005; USDA Agricultural Research Service, Temple, TX, 2005; www.brc.tamus.edu/swat/downloads/doc/swat2005/ SWAT%202005%20theory%20final.pdf. NRCS. The National Conservation Buffer Initiative; National Resource Conservation Service USDA: Washington DC, 1999; p 53. Parsons, J. E., R. B. Daniels, J. W. Gilliam and T. A. Dillaha. 1991. The effect of vegetation filter strips on sediment and nutrient removal from agricultural runoff. In Proc. of the Environmentally Sound Agriculture Conference, ed. A.B. Bottcher, K.L. Campbell and W.D. Graham, 324-332. Orlando, FL, April 16-18, 1991. Part I: VFSMOD-W: Model Documentation 51 Parsons, J. E. and R. Munoz-Carpena. 2001. Impact of Uncertainty on the Design of Vegetative Filter Strips. Statistical Methods in Hydrology for the 2001 ASAE Annual International Meeting, Sacramento, California, ASAE. Paper of ASAE no. 01-. ASAE: St. Joseph Parsons, J.E. and R. Muñoz-Carpena. 2002. VFSMOD-W, a graphical Windows system for the evaluation and design of vegetative filter strips for sediment trapping. In: Watershed Management to Meet Emerging TMDL Environmental Regulations. Proc. (11-13 March, Fort Worth, Texas, USA), eds. A. Saleh, B. Wilson, pp. 532-535. St. Joseph, Michigan: ASAE. Poletika, N.N.; Coody, P.N.; Fox, G.A.; Sabbagh, G.J.; Dolder, S.C.; White, J. Chlorpyrifos and atrazine removal from runoff by vegetated filter strips: Experiments and predictive modeling. J. Environ. Qual. 2009, 38 (3), 1042-1052. Rawls, W.J. and D.L. Brakensiek. 1983. A procedure to predict Green-Apmt infiltration parameters. Adv. in Infiltration, pp. 102-112. ASAE Pub. no. 11-83. Reichenberger, S.; Bach, M.; Skitschak, A.; Frede, H.-G. Mitigation strategies to reduce pesticide inputs into ground- and surface water and their effectiveness: a review. Sci. Total Environ. 2007, 384, 1-35. Ritter, A., F. Hupet, R. Muñoz-Carpena, M. Vanclooster, and S. Lambot. 2003. Using inverse methods for estimating soil hydraulic properties from field data as an alternative to direct methods. Agric. Water Manage. 59(2): 77-96. Ritter, A., R. Muñoz-Carpena, C.M. Regalado, M. Vanclooster, and S. Lambot. 2004. Analysis of alternative measurement strategies for the inverse optimization of the hydraulic properties of a volcanic soil. J. Hydrol. 295: 124-139. Sabbagh, G.J.; Fox, G.A.; Kamanzi, A.; Roepke, B.; Tang, J.Z. Effectiveness of vegetative filter strips in reducing pesticide loading: Quantifying pesticide trapping efficiency. J. Environ. Qual. 2009, 38 (2), 762-771. Saltelli, A. 1999. Sensitivity analysis: Could better methods be used? J. Geophys.Res.. 104: 24013-24013. Saltelli, A., M. Ratto, S. Tarantola, and F. Campolongo. 2005, Sensitivity analysis for chemical models. Chem. Rev.. 105: 2811-2827. Saltelli, A., S. Tarantola, and F. Campolongo. 2000a, Sensitivity analysis as an ingredient of modeling. Stat.Sci. 15: 377- 395. Saltelli, A., K. Chan, and E. M. Scott. 2000b. Sensitivity Analysis. Wiley Series in Probability and Statistics. Saltelli, A., S. Tarantola, F. Campolongo, and M. Ratto. 2004. Sensitivity Analysis in Practice: A Guide to assessing Scientific Models. John Wiley & Sons, Chichester. Skaggs, R. W. and R. Khaheel. 1982. Chapter 4: Infiltration. In Hydrologic modeling of small watersheds. Ed. by C. T. Haan, H. P. Johnson and D. L. Brakensiek, ASAE Monograph No. 5, American Society of Agricultural Engineers, St. Joseph, MI, pp. 121-168. Sobol, I. M. 1990. Sensitivity estimates for nonlinear mathematical models, Matematicheskoe Modelirovanie, 2: 112–118 (translated as I. M. Sobol. 1993. Sensitivity analysis for non-linear mathematical models. Math. Modeling Comput. Stutter, M.I.; Langan, S.J.; Lumsdon, D.G. Vegetated buffer strips can lead to increased release of phosphorus to waters: A biogeochemical assessment of the mechanisms. Env. Sci. Tech. 2009, 43, 1858-1863. Part I: VFSMOD-W: Model Documentation 52 Suwandono, L., J. E. Parsons and R. Muñoz-Carpena. 1999. A design guide for vegetative filter strips using VFSMOD. Presented at the 1999 ASAE/CSAE Ann. Intl. Meeting,19-20 July, Paper 99-2147, ASAE, St. Joseph, MI. Tingle, C.H.; Shaw, D.R.; Boyette, M.; Murphy, G.P. Metolachlor and metribuzin losses in runoff as affected by width of vegetative filter strips. Weed Sci. 1998, 46 (4), 475-479. Tollner, E. W., B. J. Barfield, C. T. Haan and T. Y. Kao. 1976. Suspended sediment filtration capacity of simulated vegetation. Transactions of ASAE 19(4):678-682. Tollner, E.W., B.J. Barfield, C. Vachirakornwatana and C.T. Haan. 1977. Sediment deposition patterns in simulated grass filters. Transactions of ASAE. 20(5):940-944. USDA-NRCS; 210-VI-TR-55, 2nd Edition, June 1986. U.S. Environmental Protection Agency. GENEEC User's Manual: (Gen)eric (E)stimated (E)nvironmental (C)oncentration Model; U.S. EPA Office of Pesticide Programs, Washington, D.C., 2001; www.epa.gov/oppefed1/models/water/ geneec2_users_manual.htm. U.S. NRCS (Formerly Soil Conservation Service), National Engineering Handbook, Hydrology, Section 4 (1972) and USDA ARS 41-172 (1970). Vieux, B.E., V.F. Bralts, L.J. Segerlind and R.B. Wallace. 1990. Finite element watershed modeling: one-dimensional element s. J. Water Resour., Planning and Mgmt. Div. ASCE., 116(6):803-819. Wallach D., D. Makowski, and J.W. Jones. 2006. Working with Dynamic Crop Models; Evaluation, Analysis, Parameterization and Application. Elsevier. Williams, J. R. 1975. Sediment-yield prediction with the Universal equation using runoff energy factor. In: Present and prospective technology for predicting sediment yields and sources. ARS-S-40. USDA-Agricultural Research Service, ppp. 244-252. Wilson, B.N., B.J. Barfield and I.D. Moore. 1981. A Hydrology and Sedimentology Watershed Model, Part I: Modeling Techniques. Technical Report. Department of Agricultural Engineering. University of Kentucky. Lexington. Wilson, L. G. 1967. Sediment removal from flood water by grass filtration. Transactions of ASAE 10(1):35-37. Wischmeirer, W. H., C. B. Johnson and B. V. Cross. 1971. A soil erodibility nomograph for farmland and construction sites. Journal of Soil and Water Conservation 26(5):189193. Wischmeirer, W. H. and D. D. Smith. 1978. Predicting rainfall erosion losses - a guide to conservation planning. Agriculture Handbook No. 537, USDA, Washington, DC, 58 pp. Wolfram, S. 1999. The Mathematica Book. 4th edition. Cambridge Univ. Press. Woolhiser, D. A. 1975. Simulation of unsteady overland flow. In Unsteady Flow in Open Channels. Vol. II Ed. K. Mahmood and V. Yevjevich. 485-508. Fort Collins: Water Resources. Woolhiser, D. A., R.E. Smith and D.C. Goodrich. 1990. KINEROS, A Kinematic Runoff and Erosion Model: Documentation and User Manual. USDA-ARS. ARS-Pub. no. 77 Yonts, C.D.; Wilson, R.G.; Hein, G.L. Control of pesticides and nitrates in surface irrigation runoff water. Paper No. 96-1041. American Society of Agricultural Engineers, St. Joseph, MI, 1996. Part I: VFSMOD-W: Model Documentation 53 Zhang, Q., C. G. Okoren, and K.R. Mankin. 2001. Modeling Fecal Pathogen Transport in Vegetative Filter Strips. American Society of Agriculture Engineers, Sacramento, California. Paper of ASAE no. 01-2194. ASAE: St. Joseph Part I: VFSMOD-W: Model Documentation 54 Part II: VFSMOD and UH: User’s Manual 1. VFSMOD user’s manual 1.1 Obtaining VFSMOD VFSMOD documentation, source code and binaries for a number of platforms can be obtained in digital format through internet at the following URL site: USA: http://abe.ufl.edu/carpena/vfsmod The files are in ZIP/tar.gz compressed format. All necessary files to compile and run a sample application are included. Please select Windows 9x/NT/2000/XP (vfsmodpc.zip for the command line version or vfsmod-w-install.zip for the graphical user interface) or UNIX (vfsmodux.tar.gz) versions as needed. If you do not have an internet connection you can contact the authors for assistance. 1.2 Installing and running VFSMOD VFSMOD (and UH) source code is distributed both in Windows 95/98/NT/2000/XP and UNIX versions along with make files and sample input and output files. The source code is written in standard FORTRAN77 so that compilation should be straight forward following the included makefile and using the proper set of files for each platform (Windows 9x/NT/2000/XP or UNIX). Binaries for a few computer platforms can also be found at the internet site. 1.2.1 Installing for a DOS/command prompt window (under Windows 9x/NT/2000/ XP): a) From the Start Menu, Start a Command Prompt/DOS window. b) Change to the drive and directory where you want to install. c) Create a directory named VFSMOD d) Expand the contents of the file vfsmodpc.zip. This should create the following directory structure vfsmod docs inputs output src_uh src_vfsm e) The executable files VFSM.EXE (and UH.EXE) can be found in the parent directory VFSMOD. Part II: VFSMOD and UH: User’s Manual 53 f) Run the sample case named SAMPLE, by typing “VFSM SAMPLE” at the DOS prompt. Please note that the second part of the command issued (SAMPLE) refers to a set of files located in the subdirectory INPUTS. You could run a different problem by selecting a different set of input files with the condition that they are located in the subdirectory INPUTS. In this example, if you issue the DIR command within the INPUTS directory you should see the following files: SAMPLE.IGR SAMPLE.IKW SAMPLE.IRN SAMPLE.IRO SAMPLE.ISD SAMPLE.ISO After you execute the command you should see a screen as follows: @ @ @ @@@@ @@@ @ @ @@@@ @@@ @ @ @ @@ @@ @ @ @ @ @ @ @@@ @@@ @ @ @ @ @ @ @ @ @ @ @ @ @ @ @ @ @ @ @ @@@ @ @ @@@@ @@@ 6/2011-v4.1.1 -----------------------------------------------------------------------R.Munoz-Carpena J.E. Parsons U.of Florida- USA NCSU - USA [email protected] [email protected] -----------------------------------------------------------------------PROGRAM TO CALCULATE OVERLAND FLOW AND SEDIMENT FILTRATION THROUGH A VEGETATIVE FILTER STRIP, OF AN INFLOW HYDROGRAPH FROM AN ADJACENT FIELD, DURING A STORM EVENT. VFSMOD HANDLES THE CASE OF VARYING SURFACE COVER AND SLOPES AT THE NODES AND TIME DEPENDENT INFILTRATION FOR THE DOMAIN. -----------------------------------------------------------------------... Reading inputs from inputs/sample.igr ... Reading inputs from inputs/sample.isd ... Reading inputs from inputs/sample.ikw ... Reading inputs from inputs/sample.irn ... Reading inputs from inputs/sample.iso ... Reading inputs from inputs/sample.iro Storm on: Unit9, g8, u183-91 ... ... ... ... ... ... ...RUNNING... ...FINISHED...VFSMOD v4.1.1 06/2011 During the run a set of new files is created in the OUTPUT directory: SAMPLE.OG1 SAMPLE.OG2 SAMPLE.OHY SAMPLE.OSM SAMPLE.OSP The content of both input/output files is explained in detail in the following section 1.2.2 Installing together with the Windows Graphical Interface (Windows 9x/NT/ 2000/XP) See Part III of this document describing the MS-Windows version of the system. 1.2.3 Installing on a UNIX system a) Create a directory named VFSMOD mkdir VFSMOD mv vfsmodux.tar.gz VFSMOD cd VFSMOD b) Expand the contents of the file vfsmodux.tar.gz on the new directory. Part II: VFSMOD and UH: User’s Manual 54 gzcat vfsmodux.tar.gz | tar xvf - This should create the following directory structure vfsmod docs inputs output src_uh src_vfsm c) An installation script (setup) is included in the VFSMOD directory. To compile and install the program simply type setup. The script will compile the source code and copy the executable files (vfsm and UH) to the VFSMOD directory. If your FORTRAN compiler name is not f77 you will need to edit the makefile found in the src directory. You can also clean the executable and object files by typing setup clean. d) Run the sample case named sample, by typing vfsm sample at the UNIX prompt. Please note that the second part of the command issued (sample) refers to a set of files located in the subdirectory inputs. You could run a different problem by selecting a different set of input files with the condition that they are located in the subdirectory inputs. Note that you must have all the six input files in order to run the program. In our example, if you issue the ls command within the inputs directory you should see the following files: sample.igr sample.ikw sample.irn sample.iro sample.isd sample.iso After you execute the command you should see a screen similar to the one given above. During the run a new set of files is created in the output directory: sample.og1 sample.og2 sample.ohy sample.osm sample.osp The content of both input/output files is explained in detail in the following section 1.3 Using the project file for input and output Versions 1.04 and later now allow the user to create project files. These files contain the list of input and output files for the model. This enables the user to mix and match inputs from multiple simulation scenarios. Each line of the project file contains a keyword denoting the type of input and output file and the filename. A project file (sample.prj) for the sample inputs in UNIX and Windows 9x/NT/2000/XP contains the following line Part II: VFSMOD and UH: User’s Manual 55 : UNIX Windows 9x/NT/2000/XP ikw=inputs/sample.ikw igr=inputs/sample.igr irn=inputs/sample.irn iro=inputs/sample.iro isd=inputs/sample.isd iso=inputs/sample.iso iwq=inputs/sample.iwq og1=output/sample.og1 og2=output/sample.og2 ohy=output/sample.ohy osm=output/sample.osm osp=output/sample.osp owq=output/sample.owq ikw=inputs\sample.ikw igr=inputs\sample.igr irn=inputs\sample.irn iro=inputs\sample.iro isd=inputs\sample.isd iso=inputs\sample.iso iwq=inputs\sample.iwq og1=output\sample.og1 og2=output\sample.og2 ohy=output\sample.ohy osm=output\sample.osm osp=output\sample.osp owq=output\sample.owq The project file in this example, sample.prj, would be saved in the VFSMOD directory (where the executable vfsm or VFSM.EXE is). To execute the model with the project file, the following would be entered: vfsm sample.prj In this example, the input files would be read from the inputs subdirectory and the output files would be created in the output subdirectory. In general, the project file contains all of the keywords which are: Inputs Outputs igr= buffer properties for the sediment filtration submodel og1= detailed time series describing the sediment transport and deposition within the buffer ikw= parameters for the overland flow solution og2= detailed information on the singular points defined in the theory section of the manual irn= storm hyetograph ohy= detailed outputs on the inflow and outflow hydrographs iro= storm hydrograph from the source area osm= detailed summaries of the water and sediment balance, final geometry of the filter isd= sediment properties for the sediment filtration submodel osp= overall summary of filter performance with comparisons between the source area and filter Part II: VFSMOD and UH: User’s Manual 56 iso= soil properties for the infiltration submodel iwq= water quality/transport submodel owq= water quality/transport balance and output details 1.4 VFSMOD input files All files are in FORTRAN77 free format. The inputs are distributed among 6 files: filename.ikw (parameters for the overland flow solution), filename.irn (storm hyetograph), filename.iro (runoff from the adjacent field into the VFS), filename.iso (soil properties for the infiltration model), filename.igr (buffer properties for sediment filtration model), filename.isd (sediment properties for sediment filtration model). Note that filename could (and should) be replaced by any other name you would like to identify the case study with (max. 25 characters), with the only condition that all six files must be in the inputs subdirectory. The name of the input file set to process is selected at the command line, and the output file set is created automatically using the name given as input. In this way, different problems can be run from the same directory without overwriting previous results. 1.4.1 filename.ikw (parameters for the overland flow solution) 1.4.1.1 Structure of the file LABEL FWIDTH VL N THETAW CR MAXITER NPOL IELOUT KPG NPROP (SX(IPROP),RNA(IPROP),SOA(IPROP), IPROP=1,NPROP) IWQ 1.4.1.2 Definition LABEL a label (max. 50 characters) to identify the program run FWIDTH width of the strip (m) VL length of the filter strip (m) N number of nodes in the domain (integer) (must be an odd number for a quadratic finite element solution, but the program checks and corrects if needed). THETAW time-weight factor for the Crank-Nicholson solution (0.5 recommended) CR Courant number for the calculation of time step from 0.5 - 0.8 (recommended). See Section 6 for more details. MAXITER (integer) maximum number of iterations alowed in the Picard loop. NPOL (integer) number of nodal points over each element (polynomial degree +1) Part II: VFSMOD and UH: User’s Manual 57 IELOUT (integer) flag to output elemental information (1) or not (0) KPG (integer) flag to choose the Petrov-Galerkin solution (1) or regular finite element (0) NPROP (integer) number of segments with different surface properties (slope or roughness) SX(I) (real) X distance from the beginning on the filter,in which the segment of uniform surface properties ends (m). RNA(I) Manning’s roughness for each segment (s.m-1/3) SOA(I) slope at each segment (unit fraction, i.e. no units) IWQ water quality/transport problem selection flag (0 or not present do not run problem; 1 run problem- *.iwq file required) 1.4.1.3 File example Unit9, g8, u183-91 3.87 8.655 57 0.5 0.8 350 14 0.6182 0.4 0.052778 1.2364 0.4 0.032639 1.8546 0.4 0.071528 2.4729 0.4 0.075000 3.0911 0.4 0.031944 3.7093 0.4 0.019444 4.3275 0.4 0.029885 4.9457 0.4 0.028947 5.5639 0.4 0.041667 6.1821 0.4 0.134028 6.8004 0.4 0.079167 7.4186 0.4 0.074306 8.0368 0.4 0.040972 8.6550 0.4 0.062346 0 3 1 1 Y (m) Which corresponds to a filter on dense uniform bermuda grass with slope as follows: 0 -0.2 -0.4 L=8.655 m 0 2 4 6 8 X (m) 1.4.2 filename.irn (storm hyetograph) 1.4.2.1 Structure of the file Part II: VFSMOD and UH: User’s Manual 58 NRAIN, RPEAK (RAIN(I,J),I=1, NRAIN; J=1,2) 1.4.2.2 Definition NRAIN (integer) number of rainfall periods including period to end simulation RPEAK maximum rainfall intensity for the storm (m/s) RAIN(I,J) time (s) and rainfall rate/intensity (m/s) over the VFS for each period. The last time step corresponds with the desired simulation time chosen by the user (typically coupled with a rainfall intensity of 0). Note also that each time corresponds to the beginning of the rainfall period, i.e. storm such as: Period Time interval (s) Rainfal (m/s) 1 0.0 to 299.9 .1693E-05 2 299.9 to 599.8 .6773E-05 3 599.8 to 900.0 .1101E-04 Would be input as .0000E+00 .2999E+03 .5998E+03 .9000E+03 .1693E-05 .6773E-05 .1101E-04 .1947E-04 1.4.2.3 File example 12 .1947E-04 .0000E+00 .1693E-05 .2999E+03 .6773E-05 .5998E+03 .1101E-04 .9000E+03 .1947E-04 .1200E+04 .1947E-04 .1500E+04 .1524E-04 .1800E+04 .5080E-05 .2100E+04 .1693E-05 .2400E+04 .2540E-05 .2700E+04 .8467E-06 .3001E+04 .0000E+00 .3603E+04 .0000E+00 Note: the last pair of numbers is used to set the time when the simulation ends. 1.4.3 filename.iro (runoff from the adjacent field into the VFS) Part II: VFSMOD and UH: User’s Manual 59 1.4.3.1 Structure of the file SWIDTH SLENGTH NBCROFF BCROPEAK (BCROFF(I,J),I=1, NBCROFF; J=1,2) 1.4.3.2 Definition SWIDTH Source area width (m) SLENGTH Source area flow path length (m) NBCROFF (integer) number of time steps of the incoming field hydrograph BCROPEAK peak flow of the incoming field hydrograph (m3/s) BCROFF(I,J) incoming field hydrograph: flow rate, time (s) vs. qin(m3/s). 1.4.3.3 File example 4.0 34.0 68 .2192E-02 .8417E+03 .0000E+00 .8716E+03 .5724E-07 .9018E+03 .5724E-07 .9317E+03 .5724E-07 ... ... 1.4.4 filename.iso (soil properties for the infiltration model) Case 1: No water table present 1.4.4.1 Structure of the file VKS SAV OS OI SM SCHK 1.4.4.2 Definition VKS saturated hydraulic conductivity, Ks (m/s) SAV Green-Ampt’s average suction at wet front(m) OS saturated soil-water content, i (m3/m3) OI initial soil-water content, s (m3/m3) SM maximum surface storage (m) SCHK relative distance from de upper filter edge where the check for ponding conditions is made (i.e. 1= end filter, 0.5= mid point, 0= beginning) Part II: VFSMOD and UH: User’s Manual 60 1.4.4.3 File example 1.33e-5 0.37904 0.311 0.125 0.0 1.00 Case 2: With shallow water table present 1.4.4.4 Structure of the file VKS SAV OS OI SM SCHK WTD ITHETATYPE PAR(I) IKUNSTYPE PARK(J) 1.4.4.5 Definition VKS, SAV, OS, OI, SM, SCHK See Case 1 above for definition. WTD water table depth (m) ITHETATYPE an integer to select the soil water characteristic curve type with values: 1= van Genuchten, 2= Brooks and Corey IKUNSTYPE an integer to select the unsaturated hydraulic conductivity curve type with values: 1= van Genuchten, 2= Brooks and Corey and 3=Gardner’s PAR(I) parameters of the soil water retention curve PARK(J) parameters of the unsaturated hydraulic conductivity 1.4.4.6 File example 3.89E-05 1.72 0.39 0.25 2 0.15 78.286 0.4 2 6.7471 78.286 0 1 0.7 In this example, a shallow water table is present 0.7 m below the surface, Brooks and Corey is selected for the soil moisture characteristic curve (r BC = 0.4). The unsaturated hydraulic conductivity based on Brooks and Corey is selected ( = 6.7471, Cand he = - 1/C). 1.4.5 filename.igr (buffer properties for sediment filtration model) 1.4.5.1 Structure of the file Part II: VFSMOD and UH: User’s Manual 61 SS VN H VN2 ICO 1.4.5.2 Definition SS spacing of the filter media elements (cm) VN filter media (grass) Manning's nm (0.012 for cylindrical media) (s.cm-1/3) H filter media height (cm) VN2 bare surface Manning's n for sediment inundated area and overland flow (s.m-1/3) ICO (integer) flag to feedback the change in slope and surface roughness at the sediment wedge for each time step (0= no feedback; 1= feedback). (See also additional info on this parameter on the “Tips to Run the Model” section.) 1.4.5.3 File example 2.2 0.012 15.0 .04 1 1.4.6 filename.isd (sediment properties for sediment filtration model) 1.4.6.1 Structure of the file NPART COARSE CI DP SG POR 1.4.6.2 Definition NPART (integer) incoming sediment particle class according to the USDA (1975) and Foster et al., 1985 particle classes: NPART Particle class Diam. range (cm) dp (cm) Vf (cm/s) s (cm3/s) 1 Clay <0.0002 0.0002 0.0004 2.60 2 Silt (1) 0.0002 - 0.005 0.0010 0.0094 2.65 3 Small aggregate ---- 0.0030 0.0408 1.80 4 Large aggregate ---- 0.0300 3.0625 1.60 5 Sand 0.0050 - 0.2 0.0200 3.7431 2.65 6 Silt (2) 0.0002 - 0.005 0.0029 0.0076 2.65 7 User selected ---- DP model SG Part II: VFSMOD and UH: User’s Manual 62 COARSE % of particles from incoming sediment with diameter > 0.0037 cm (coarse fraction that will be routed through wedge) (unit fraction, i.e. 100% = 1.0). CI incoming flow sediment concentration (g/cm3) POR porosity of deposited sediment (unit fraction, i.e. 43.4% = 0.434) DP sediment particle size, diameter, d50 (cm), read only if NPART=7 SG sediment particle density, s(g/cm3), read only if NPART=7 Note: COARSE and DP are related so that their values need to follow the these rules: COARSE DP >0.5 >0.0037 0.5 0.0037 <0.5 <0.0037 1.4.6.3 File example 4 1.0 0.034 .434 .0013 2.65 1.4.7 filename.iwq (water quality/transport model) 1.4.7.1 Structure of the file IQPRO IKD VKOC/VKD CCP IDG NDGDAY DGHALF DGT(I) DGTHETA(I) OCP FC DGPIN DGML 1.4.7.2 Definition IWQPRO Flag for type of water quality problem [=1 runs pesticides based on Sabbagh et al. (2009).; =2 runs simple solute transport (under construction); =3 runs the multi reactive transport (under construction)] IKD Flag for reading VKOC, VKD and OCP. If IKD=0, then reads Kd; if IKD=1 then Koc and OCP are read. VKOC Adsorption coefficient (L/Kg) VKD Linear sorption coefficient (L/Kg) OCP % of organic carbon CCP % clay content in incoming sediment Part II: VFSMOD and UH: User’s Manual 63 The following factors are used only if pesticide mass balance/residue calculation is requested (IDG=1-4). IDG Flag to calculate degradation (1-4, 1: EU: FOCUS, k(kref,T, θ); 2: US-EPA, k=kref; 3: k=(kref,T); 4: k=(kref, θ)), for other values ignore and no more lines needed. NDGDAY Number of days between runoff events (from PRZM if used) DGGHALF Pesticide half-life (days) (at reference values of temperature and water content (i.e. 20°C and field capacity) (i.e. from PRZM). Note: DGHALF=Ln(2)/DGKREF FC θFC, VFS topsoil field capacity (m3/m3).. DGPIN Total pesticide mass (liquid and solid phase) entering the filter per unit area of the source field (mg/m2) (e.g. from PRZM if used or other field simulation or data+ plus residual in filter measured or calculated by VFSMOD from last event in series, i.e. OWQ file). Note: this is converted to total mass entering at the filter as mi=DPIN*SLENGTH*SWIDTH (from IRO file) DGML dml, surface mixing layer thickness (cm). DGML=2 cm recommended (i.e. from PRZM) DGT(I) Daily air temperatures (°C) for period between events, I=1, NDGDAY (from PRZM MET file if used) DGTHETA(I) Top soil water content θ (m3/m3) for period between events, I=1,NDGDAY (from measurements, THETAFAO calculations, or PRZM runs for grassed area) 1.4.7.3 File Example Example with no degradation requested 1 1 30 147 30 Example with degradation requested 1 1 = read/create iwq & owq files 0 0.396 Kd proc.: 0= Kd(L/Kg); 1=Koc (Koc L/Kg) , %OC) 25 % Clay content in sediment 1 IDG 3 27.995 0.26 6.097 2 ndgday dgHalf(d) FC(m3/m3) dgPin(mg/m2) dgML(cm) 9.5 8.6 6.3 (dgT(i),i=1,ndgday) (Celsius) 0.265 0.264 0.265 (dgTheta(i),i=1,ndgday (-) 1.5 Model file outputs The program writes output into ASCII-files. Each aspect of the model is written to different files. The model outputs include: information on the water balance (volume of rainfall, field inflow, filter outflow and infiltration), hydrograph, sediment balance (field inflow, filter outflow and deposition), sedimentograph, filter trapping efficiency, and Part II: VFSMOD and UH: User’s Manual 64 sediment deposition pattern within the filter. The output files contain summaries of the main state variables in the program. Note that these files are created in the output directory at run time every time the model is run and that the actual file names are given by substituting filename by the name of the set selected at the command line. If you wish to keep the results from different simulations, it is advised that you create a new set of input files (with a different name) for each case study. The inputs and outputs included in these files are labeled in a verbose form to be self-explanatory (a) filename.ohy This file contains information related to the hydrology side of the problem (overland flow and infiltration). The content of this the file is controlled by the input parameter IELOUT. The first part of the file summarizes information read from the *.ikw, *.iso and *.irn input files along with some of the calculated parameters needed for the simulation. The second part of the file contains the inflow hydrograph (from *.iro), rainfall excess ie calculated with the Green-Ampt model and the output hydrograph from the filter. Only 100 time-steps are printed to this file, each one is the average of the precedent NWRITE steps, where NWRITE=NDT/100. (b) filename.og1 The file contains information related with the sediment filtration model. The first part of the file summarizes information read from the *.igr and *.isd input files along with some of the calculated parameters needed for the simulation. The second part of the file contains sediment transport and deposition time series for the simulation period. As before, only a 100 time-steps are printed to this file. In this case the sediment filtration step is calculated with the average flow conditions calculated as described above. (c) filename.og2 This file contains the flow characteristics at the singular points (1-3, in and out), as defined in Part I of this manual, of the filter for the simulation period for the same 100 steps described above. (d) filename.osm This file contains a summary of the most relevant input parameters and output results, including a sediment and water balance, the sediment trapping efficiency of the filter for the simulation case, and the final geometry of the filter. (e) filename.osp Summary of the filter performance parameters and comparisons between source and filter areas. (f) filename.owq This file is only created during run time when CWQ=1 in the input file .IKW. In this case the file will be created in the “output” directory of the application. The water quality component is specified in the first line of this input file. The parameters listed and results in the rest of the file depend on the type of water quality component selected. Part II: VFSMOD and UH: User’s Manual 65 1.6 Sample application A sample application case is shown by using input data collected at a NC State University experimental site (Raleigh, NC - USA). The input and output files can be found in the sample case included in the distribution package obtained from the internet sites. 1.6.1 Inputs 1.6.1.1 Hydrological inputs (files sample.ikw and sample.iso), Description, symbol INPUT Value Units Source area flow path length, Ls SLENGTH 34.0 m Source area width, ws SWIDTH 4.0 m Filter length, L VL 8.655 m Filter width, w FWIDTH 3.87 m Filter mean Manning’s coefficient (calculated), n1 VN1 0.40 s.m-1/3 Duration of the simulation DR 3603 s Number of nodes N 57 -- Number of different filter segments NPROP 14 -- Courant number, Cr CR 0.8 -- Order of shape functions NPOL 3 (quadratic) -- Petrov Galerkin flag KPG 1 -- Number of different filter segments NPROP 14 --5 Saturated hydraulic conductivity, Ks VKS 1.33 x10 Average suction at the wet front, Sav SAV 0.379 m Water content at saturation, s OS 0.311 -- Initial water content, i OI 0.125 -- Surface storage, Sm SM 0.0 m m/s The flow inputs (rainfall and incoming runoff from the field) are shown later in the output. The surface characteristics of the filter were shown as an example in section 7.1.3. 1.6.1.2 Sediment transport (files sample.igr and sample.isd) Description, symbol INPUT Value Units Sediment inflow concentration, Ci CI .03400 g/cm3 Particle size diameter (NPART=4, dp) DP 0.0300 cm Particle fall velocity (NPART=4), Vf (calculated) VF 3.0625 cm/s Particle weight density (NPART=4), s SG 1.6000 g/cm3 % of coarse particles (dp>0.0037 cm) COARSE 100.0 % Porosity of deposited sediment POR 43.4 % Filter main slope (calculated), Sc SC 0.0564 -- Part II: VFSMOD and UH: User’s Manual 66 Description, symbol INPUT Value Units Filter media spacing, Ss SS 2.20 cm Filter media height, H H 15.0 cm Grass modified Manning coefficient, nm VN 0.0120 s.cm-1/3 Manning coefficient for bare soil, n2 VN2 0.04 s.m-1/3 Surface changes feedback ICO 1=YES --- 1.6.2 Outputs 1.6.2.1 Calculated simulation parameters (file sample.ohy) Parameter Symbol Value Units Petrov-Galerkin parameters PGPAR 0.0433, -0.0031, -0.3165, 0.1451 --- Space step DX 0.155 s Time step DT 1.40 --- Number of elements in system NELEM 28 --- Number of time steps NDT 2568 --- Estimated maximum flow rate QMAX 0.000735 m2/s Estimated maximum flow depth HMAX 0.000735 m Celerity of the wave C 0.08816, 0.01389 m/s Courant time step DTC 1.753 s Froude number FR 0.143 --- Kinematic wave number FK 1892 --- 1.6.2.2 Hydrological outputs (files sample.ohy and sample.osm) The hydrographs included in the next figure show the volume reduction (infiltration) and peak delay (increase of roughness by vegetated surface) produced by the filter over the incoming field hydrograph (input) Part II: VFSMOD and UH: User’s Manual 67 . 0.003 0 5∗10-6 10∗10-6 0.002 2∗10-5 Rainfall Inflow Outflow 2.5∗10-5 0.001 Rainfall (m/s) Flow rate (m3/s) 1.5∗10-5 0 0 1000 2000 3000 Time (s) The water balance for the simulation was as follows: Volume from rainfall 0.8423 m3 Volume from up-field hydrograph 1.3240 m3 Volume from outflow hydrograph 0.7674 m3 Volume infiltrated 1.3990 m3 1.6.2.3 Sediment transport (files sample.ig1, sample.ig2, and sample.osm) The sedimentograph and mass balance at the filter is included in the next two figures. Both graphs show a significant load reduction due to deposition at the wedge (difference in loads between gsi and gs2), for those parts of the event when flow was low (beginning Part II: VFSMOD and UH: User’s Manual 68 and tail) whereas most of the sediment in the suspended sediment zone was retained at high flow rates (when the sediment by-passes the wedge). 0.001 Sediment load (g cm-1s-1) 0.2 gsi gs2 gso 0.15 5∗10-4 0 0 1000 2000 3000 0.1 Wedge deposition 0.05 0 0 500 1000 1500 2000 2500 3000 3500 Sediment distribution (g cm-1) Time (s) 100 incoming wedge lower area 80 60 40 20 0 1000 1500 2000 2500 Time (s) The sediment balance for the simulation was: Total sediment inflow 116.40 g/cm 45,030 g Total sediment outflow 0.4195 g/cm 162.3 g Trapping efficiency (Tr) 99.6 % VFSMOD finally predicts the final sediment wedge geometry and deposition over the filter as: Sediment wedge depth Y(t) 0.85 cm Sediment tail at field X1(t) 15.05 cm Sediment wedge length X2(t) 4.55 cm Effective filter length L(t) 860.95 cm Part II: VFSMOD and UH: User’s Manual 69 Sediment depth in low section DEP 0.145 cm Rough mass balance (wedge+depth) error --- <1 % 1.6.2.4 Filter performance indicators (file sample.osp) Parameter Value Units Source Area (input) 136.00 m2 Source Flow Length (input) 34.00 m Source Area Width (input) 4.00 m Filter Strip Length (input) 8.65 m Filter Strip Width (input) 3.87 m Mean Filter Mannings Roughness (input) 0.400 Ratio of Filter Length to Source Flow Length 25.46 % Total Rainfall 25.15 mm Total Rainfall on Filter 0.842 m3 Total Runoff from Source (mm depth over Source Area) 9.74 mm Total Runoff from Source 1.324 m3 Total Runoff out from Filter (mm depth over Source+Filter) 4.53 mm Total Runoff out from Filter 0.767 m3 Total Infiltration in Filter 1.399 m3 Runoff Delivery Ratio (RDR)a 0.579 Mass Sediment Input to Filter 45.03 kg Concentration Sediment in Runoff from source Area 34.00 g/L Mass Sediment Output from Filter 0.16 kg Concentration Sediment in Runoff exiting the Filter 0.21 g/L Mass Sediment retained in Filter 44.87 kg a 0.004 Sediment Delivery Ratio (SDR) Effective Filter Length 8.65 m Wedge Distance 0.05 m a. Used for design, see Part I: Section on page 37 Part II: VFSMOD and UH: User’s Manual 70 2. UH for Input Preparation: User’s Manual 2.1 Installing and running UH UH is installed by default when installing VFSMOD. See Section 1.2 on page 53 for details. When running UH from the command line (DOS and UNIX versions) the name of the input file set to process is selected at the command line. In this way, different problems can be run from the same directory without overwriting previous results. As an example one could run (from the VFSMOD directory): uh sample2 In this example, the input file sample2.inp (included in the distribution package) would be read from the INPUTS subdirectory. After you execute the command you should see a screen as follows: -----------------------------------------------------------------------@ @ @ @ @ @ @ @ @ @ @@@@@@ @ @ @ @ @@@@ @ @ March 2005-v2.4.2 ----------------------------------------------------------------------R.Munoz-Carpena J.E. Parsons UFL - USA NCSU - USA [email protected] [email protected] -----------------------------------------------------------------------PROGRAM GENERATE RAINFALL AND RUNOFF INPUTS FOR VFSMOD. -----------------------------------------------------------------------*** *** *** *** *** *** Opening Opening Opening Opening Opening Opening inputs/sample2.inp output/sample2.out output/sample2.hyt inputs/sample2.iro inputs/sample2.irn inputs/sample2.isd During the run a set of the VFSMOD inputs is created in the INPUTS subdirectory: sample2.irn sample2.iro sample2.isd sample2.iso Two more output files are created in the OUTPUT subdirectory that summarize the calculations performed (sample2.out and sample2.hyt). The content of these files is produced in verbose mode and is self explanatory. Note that two more files are needed to run VFSMOD (filter characteristics files *.ikw and *.igr) and they are not created by UH but the user needs to set them up from field data. To continue the example given above one could copy the sample files included in the distribution package, sample.ikw and sample.igr, into sample2.ikw and sample2.igr in the INPUTS subdirectory. VFSMOD is now ready to be run by issuing the command, Part II: VFSMOD and UH: User’s Manual 71 vfsm sample2 2.2 Using the project file for input and output Another way to complete the example would be to create a project sample file that includes the newly created sample2 files and specifies sample.igr and sample.ikw as igr and ikw files (see Section 1.3 on page 55). An example of a project file (sample.lis) for UH is given in the following Table. Unix Windows 9x/NT/2000/XP inp=inputs/sample.inp inp=input\sample.inp iro=inputs/sample.iro iro=inputs\sample.iro irn=inputs/sample.irn irn=inputs\sample.irn isd=inputs/sample.isd isd=inputs\sample.isd out=output/sample.out out=output\sample.out hyt=output/sample.hyt hyt=output\sample.hyt The project file in this example, sample.lis, would be saved in the VFSMOD directory (where the executable UH or UH.EXE is located). To execute the model with the project file, the following would be entered: uh sample.lis In this example, the input files would be read from the inputs subdirectory and the output files would be created in the output subdirectory. In general, the project file contains all of the keywords which are: Inputs inp= inputs for the source area for UH Part II: VFSMOD and UH: User’s Manual Outputs irn= rainfall hyetograph (input for vfsmod) iro= runoff hydrograph from the source area (input for vfsmod) isd= sediment properties for the sediment filtration submodel out= summary of the inputs and outputs from UH hyt= detailed summary of of MUSLE calculations and the runoff hydrograph 72 All inputs for UH are in FORTRAN77 free format. The inputs are contained in filename.inp. Note that “filename” could (and should) be replaced by any other name you would like to identify the case study with (max. 8 characters), as in the example above. A description of this file follows. 2.3 UH input files 2.3.1 filename.inp (parameters for generating inputs for VFSMOD) 2.3.1.1 Structure of the file P, CN, A, storm type, D, L, Y soiltype K, CFACT, PFACT, dp IEROTY OM 2.3.1.2 Definition P amount of storm precipatation in mm CN NRCS (SCS) Curve Number for the source area (see Appendix 3) A Area of the upstream portion in ha storm type storm type (1=I, 2=II, 3=III, 4=Ia) D storm duration (h) L Length of the source area along the slope (m) Y Slope of the source area (% expressed as a fraction) soiltype See Table for Acceptable Soil Types K Soil Erodibility (If K<0, then K is computed based on texture and organic matter - See eq. 31) CFACT C factor (See Table in Appendix 3) PFACT P factor (See Table in Appendix 3) dp particle size (-1: selection basis of texture: otherwise user given) NOTE: Because dp is one of the most semsitive parameter for sediment transport (Muñoz-Carpena and Parsons, 1998), whenever possible the user should provide this from measurements. IEROTY Select the method to compute the storm R factor in MUSLE, not present or =1 selects Foster’s Method, =2 selects Williams method, and =3 selects the CREAMS/GLEAMS method OM organic matter Part II: VFSMOD and UH: User’s Manual 73 The acceptable values for “soiltype” are: Soil Types (Case Sensitive) Clay Silty clay Sandy clay Silty clay loam Clay loam Sandy clay loam Silt Silt loam Loam Very fine sandy loam Fine sandy loam Sandy loam Coarse sandy loam Loamy very fine sand Loamy fine sand Loamy sand Loamy coarse sand Very fine sand Fine sand Sand Coarse sand 2.3.1.3 File example file: sample2.inp 25 85 0.5 3 6 100 0.02 Clay 0.25 1.0 1.0 1 2.4 Sample application Table 1. Parameter values for the sample run. Parameter Value Parameter Description P 25 amount of storm precipatation in mm CN 85 NRCS (SCS) Curve Number for the source area A 0.5 Area of the upstream portion in ha storm type 3 storm type (1=I, 2=II, 3=III, 4=Ia) D 6 storm duration (h) L 100 Length of the source area along the slope (m) Y 0.02 Slope of the source area (% expressed as a fraction) soiltype Clay See Table for Acceptable Soil Types K 0.25 Soil Erodibility (If K<0, then K is computed based on texture and organic matter - See REF) CFACT 1.0 C factor (See Table in Appendix 3) PFACT 1.0 P factor (See Table in Appendix 3) Part II: VFSMOD and UH: User’s Manual 74 IEROTY 1 Select the method to compute the storm R factor in MUSLE, not present or =1 selects Foster’s Method, =2 selects Williams method, and =3 selects the CREAMS/GLEAMS method The program produces two output files that summarize the program execution. In this case, these are sample2.out and sample2.hyt. The sample2.out file contains a printout of the input data along with the runoff hydrograph and a summary. The sample2.hyt file contains the information about the rainfall hyetograph along with the outputs related to the erosion from the storm. From these results, the input files for VFSMOD (sample2.iro, sample2.irn, and sample2.isd) are also automatically created in the output directory. file: sample2.out File: output\sample2.out UH v1.06, 3/2002 HYDROGRAPH CALCULATION FOR WATERSHED-SCS METHOD Inputs -----Storm Rainfall= 80.00 mm SCS storm type= II Storm duration= 6.0 h SCS Curve number= 72.0 Watershed area= 5.00 ha Maximum flow path length= 100.00 m Average slope of flow path= 2.00 % MUSLE type= 2 where: 1=Foster, 2=Williams, 3=GLEAMS (See Manual) Outputs ------Runoff volume= 22.82 mm= 1141.16 m3 Initial Abstraction= 19.76 mm Concentration time= 0.19 h= 11.64 min Peak flow= 0.3753 m3/s= 27.0228 mm/h Time to peak= 0.65 h= 38.76 min Hydrograph based on SCS-unit hydrograph: time (h) q(m3/s) q(mm/h) 0.00 0.06 0.13 0.19 0.26 0.32 0.39 0.45 0.52 0.58 0.65 0.71 0.78 0.84 0.90 0.0000 0.0019 0.0178 0.0562 0.1139 0.1813 0.2472 0.3032 0.3440 0.3678 0.3753 0.3687 0.3511 0.3256 0.2953 Part II: VFSMOD and UH: User’s Manual 0.0000 0.1366 1.2783 4.0434 8.2038 13.0501 17.7981 21.8278 24.7677 26.4836 27.0228 26.5477 25.2776 23.4442 21.2627 75 0.97 1.03 1.10 1.16 1.23 1.29 1.36 1.42 1.49 1.55 1.62 1.68 1.74 1.81 1.87 1.94 2.00 2.07 2.13 2.20 2.26 2.33 2.39 2.46 2.52 2.58 2.65 2.71 2.78 2.84 2.91 2.97 3.04 3.10 3.17 3.23 3.30 0.2627 0.2298 0.1981 0.1686 0.1417 0.1180 0.0972 0.0795 0.0645 0.0519 0.0415 0.0330 0.0261 0.0205 0.0161 0.0125 0.0097 0.0075 0.0058 0.0044 0.0034 0.0026 0.0020 0.0015 0.0011 0.0009 0.0006 0.0005 0.0004 0.0003 0.0002 0.0002 0.0001 0.0001 0.0001 0.0000 0.0000 18.9159 16.5479 14.2642 12.1361 10.2059 8.4933 7.0018 5.7230 4.6414 3.7375 2.9899 2.3775 1.8800 1.4790 1.1579 0.9024 0.7004 0.5415 0.4171 0.3201 0.2449 0.1868 0.1421 0.1078 0.0815 0.0615 0.0463 0.0348 0.0261 0.0195 0.0146 0.0108 0.0081 0.0060 0.0044 0.0033 0.0024 Time to ponding= 2.743 h Duration of rainfall excess= 3.257 h Time correction to match hyetograph= 2.743 h file: sample2.hyt File: output\sample2.hyt UH v1.06, 3/2002 SCS 10-MIN HYETOGRAPH No. 1 2 3 4 5 6 7 8 Time (hr) 0.000 0.167 0.333 0.500 0.667 0.833 1.000 1.167 Rainfall(mm) Rain30 (mm) 0.000 0.000 1.199 0.000 1.241 2.440 1.287 3.728 1.338 3.867 1.396 4.021 1.460 4.194 1.533 4.388 Part II: VFSMOD and UH: User’s Manual 76 9 10 11 12 13 14 15 16 17 18 19 20 21 22 23 24 25 26 27 28 29 30 31 32 33 34 35 36 37 1.333 1.500 1.667 1.833 2.000 2.167 2.333 2.500 2.667 2.833 3.000 3.167 3.333 3.500 3.667 3.833 4.000 4.167 4.333 4.500 4.667 4.833 5.000 5.167 5.333 5.500 5.667 5.833 6.000 1.616 1.713 1.828 1.967 2.138 2.357 2.650 3.070 3.740 5.067 26.832 4.564 5.067 3.740 3.070 2.650 2.357 2.138 1.967 1.828 1.713 1.616 1.533 1.460 1.396 1.338 1.287 1.241 1.199 Computed Total Rain= Actual Total Rain= raimax30 = I30 = 4.608 4.862 5.158 5.509 5.934 6.463 7.146 8.078 9.460 11.877 35.639 36.463 36.463 13.371 11.877 9.460 8.078 7.146 6.463 5.934 5.509 5.158 4.862 4.608 4.388 4.194 4.021 3.867 3.728 102.600 102.600 36.463 72.927 mm mm mm mm/h RAINFALL ENERGY FACTOR R FOR EROSION CALCULATIONS a) Foster et al. (1977) E= 3738.632 ft-tonf/acre = 25.049 MJ/ha volro= 63.323 mm; qpeak= 46.011 mm/h Factors in Rm: Rst= 182.695; Rro= 226.905 Rm (Foster)= 170.764 N/h b) Williams (1975) Watershed area= 0.500 ha V= 316.613 m3; Qp= 0.064 m3/s Rw (Williams)= 97.514 N/h c) GLEAMS/ daily CREAMS Rain =102.60 mm R_GLM = 64.79 From Gleams - Wischmeirer R_GLM = 110.27 N/h, Converted to Metric ERODIBILITY K AND PARTICLE SIZE SELECTION Table for computing Ksoil (from GLEAMS and KINEROS) i Soil Type %Sand %Silt Tex.F. Str.F. Part II: VFSMOD and UH: User’s Manual Per.F. D50 77 1 2 3 4 5 6 7 8 9 10 11 12 13 14 15 16 17 18 19 20 21 Clay Silty clay Sandy clay Silty clay loam Clay loam Sandy clay loam Silt Silt loam Loam Very fine sandy loam Fine sandy loam Sandy loam Coarse sandy loam Loamy very fine sand Loamy fine sand Loamy sand Loamy coarse sand Very fine sand Fine sand Sand Coarse sand 20. 10. 50. 15. 35. 55. 5. 20. 45. 60. 60. 60. 60. 84. 84. 84. 84. 90. 90. 90. 90. 30. 45. 10. 50. 30. 20. 85. 60. 35. 25. 25. 25. 25. 8. 8. 8. 8. 5. 5. 5. 5. 0.01287 0.01870 0.01714 0.02606 0.02360 0.02778 0.05845 0.04259 0.03618 0.03877 0.03205 0.02549 0.01914 0.03726 0.02301 0.01624 0.00982 0.04401 0.02173 0.01481 0.00827 0.0650 0.0650 0.0650 0.0650 0.0650 0.0650 0.0650 0.0650 0.0325 -0.0350 0.0000 0.0325 0.0325 -0.0325 0.0000 0.0325 0.0325 -0.0325 0.0000 0.0325 0.0325 0.075 0.075 0.075 0.050 0.050 0.050 0.025 0.025 0.025 0.000 0.000 0.000 0.000 -0.025 -0.025 -0.025 -0.025 -0.050 -0.050 -0.050 -0.050 23.0 24.0 66.0 25.0 18.0 91.0 19.0 27.0 35.0 35.0 80.0 98.0 160.0 90.0 120.0 135.0 180.0 140.0 160.0 170.0 200.0 For the selected soil type: Sandy clay K= 0.041 kg-h/N-m^2 d50= 66.00 um MISCELLANEOUS CALCS: L= cfact= 1.447 1.00 S= pfact= 0.182 1.00 FINAL CALCS: A= A= A= Conc= Conc= Conc= 1.84779 1.05518 1.19323 29.18056 16.66349 18.84364 Part II: VFSMOD and UH: User’s Manual kg/m^2 Using Rm (Foster) kg/m^2 Using Rw (Williams) kg/m^2 based on Gleams g/L Using Rm (Foster) g/L Using Rw (Williams) g/L based on Gleams 78 These results are depicted in the next Figure. 8 0 6 2 4 4 2 6 0 Rainfall (mm/10 min) q (mm/hr) q rainfall 8 0 2 4 6 8 10 12 Time (hours) 2.5 Tips for running the model Here are some suggestions to running the model and answers to potential problems or questions a) The finite element model becomes unstable or blows up. This is due to a rapid change in boundary conditions (quick slope and/or roughness changes along the filter) or inputs (severe changes in rainfall intensity and/or inflow from the adjacent field) in your inputs. For this type of conditions the kinematic wave formulation leads to a behavior termed kinematic shock. The model’s Petrov-Galerkin (PG) finite element formulation was developed to improve the quality of the solution for these type of special (sharp front) problems and generally overcomes the instability problem (Muñoz-Carpena et al. 1993b). The time step is calculated based on a target Courant number (CR) for the simulation (*.ikw file) and an estimate of the less favorable conditions (maximum incoming hydrograph peak flow and rainfall intensity). In a few cases, due to the dynamic nature of the problem this is not a good estimate and the simulation will become unstable or even blow up. This can be avoided by lowering the CR at the expense of more simulation run-time. Instabilities can also be avoided by reducing/ increasing the number of nodes in the domain (N). b) With large sediment input into the filter strip, the program blows up. Set ICO=0. In this case the sediment deposition is so large that the change in the nodal slope in the downstream face of the wedge creates problems to the finite element flow solution. Petrov-Galerkin does well but it does not perform miracles on a drastically changed domain!. Setting ICO=0 ignores the changes in slope and allows the simulation to be completed. Previous comparison by the authors between runs with ICO=1 or 0 show that difference in results sre typically in the rage of 5-10%. Part II: VFSMOD and UH: User’s Manual 79 c) Assigning values to KPG, NPOL. The order of the shape function used in the numerical solution (finite elements) can be set to linear (NPOL=2), quadratic (NPOL=3) or cubic (NPOL=4). Please note that if the order of the function is changed to any other type than quadratic (recommended) the regular finite element formulation will be run instead of the improved Petrov-Galerkin method. One could also select a regular quadratic finite element by setting KPG=1. Tests made during program development show the increase in execution time induced by selecting the PG method are small as compared with the gains in stability and accuracy obtained. Thus the setting NPOL=3 and KPG=1 are recommended. d) Assigning values to N The number of nodes of the system must be an odd number for a finite element quadratic solution, an even number if the solution is cubic and any of them if linear. The program adjusts the number of nodes automatically if the requirement is not made. e) If no incoming sediment characteristics are known (dp, gs) In the absence of measured inflow sediment characteristics, an estimate of the particle size could be made by knowing the soil texture of the contributing field (Woolhiser et al. 1990) (dp in x10-4cm). Soil texture (USDA) Expected dp Soil texture Expected dp Clay 0 - 45 Clay-loam 5 - 30 Silty-clay 2 - 45 Sandy-loam 35-160 Silty-clay-loam 3 - 46 Loamy-sand 90 - 180 Silt-loam 3 - 50 Sandy - clay 2 - 130 Silt 8 - 30 Sandy-clay-loam 21 - 160 Loam 9 - 60 Sand 140-200+ f) Setting the total simulation time (DR) The last time interval of the rainfall series (file *.irn) is used to set the desired simulation (typically with the rainfall intensity set to 0). g) Reducing execution time by stopping surface changes during the simulation (ICO=0) Setting the flag ICO=0 in the *.igr file will stop the model from reshaping the entrance of the filter during sediment deposition. This in turn will result in a reduction of the total execution required, since the problem will become less non-linear and fewer iterations to convergence will be needed for each time step. Initial testing of the program showed that the sediment predictions do not change greatly, but the user is advised to assess this point for each particular application .h) Sometimes when assigning a high intensity (in irn file) from the beggininng of the simulation, this can result in kinematic shock and the numerical solution blows up. Part II: VFSMOD and UH: User’s Manual 80 This sometimes can be avoided by adding intermediate steps of rainfall (with the same intensity) at the beginning of the period. For example, the .irn file that produces shock contains one rainfall period of 64 mm/h starting at t=0 s and ending at 3h 36 min, i.e., 4 0.000017817 Nrain, rpeak (m/s) 0 .000017817 13000 .000017817 13001 0 13603 0 The shock in this case can be avoided by adding an intermediate step after the t=0 s value (and close to it), i.e. 5 0.000017817 Nrain, rpeak (m/s) 0 .000017817 300 .000017817 13000 .000017817 13001 0 13603 0 i) When optimizing particle size (or specific density) for predefined particle classes (NPART<7 in .isd file) with the inverse calibration component, the results don't seem to be right. By default the automatic calibrator overrides the NPART setting and forces it to NPART=7 so changes in DP are considered by the model. However, the user must be careful to consider the specific density value given for SG in the second line of the .isd file, since only DP will be perturbed during the calibration and some of the prescribed NPART have specific values associated (see the User's Manual[5.7MB]). As an alternative the user can select to optimize DP and SG currently. Also consider that when optimizing particle size the range has to fall within the value of COARSE required for fine (DP=0.0037 cm, COARSE=0.5) or coarse particles (DP>0.0037, COARSE=0.5). j) When optimizing particle size (or specific density) for predefined particle classes (NPART<7 in .isd file) with the inverse calibration component, the results don't seem to be right. By default the automatic calibrator overrides the NPART setting and forces it to NPART=7 so changes in DP are considered by the model. However, the user must be careful to consider the specific density value given for SG in the second line of the .isd file, since only DP will be perturbed during the calibration and some of the prescribed NPART have specific values associated (see manual). As an alternative the user can select to optimize DP and SG currently. Also consider that when optimizing particle size the range has to fall within the value of COARSE required for fine (DP=0.0037 cm, COARSE=0.5) or coarse particles (DP>0.0037, COARSE=0.5). k) After VFSMOD-W installation, when I try to open the program I receive an error message saying "Component 'comdlg32.ocx' or one if its dependencies not correctly registered: a file is missing or invalid." I found the file in the directory, so I don't know Part II: VFSMOD and UH: User’s Manual 81 what the problem is. I'll try re-downloading the program and see if that works. I am trying to operate in Vista, is there anything special I need to do? Yes, you need to be logged in as "administrator" or a user with "poweruser" role to be able to register the libraries during installation. Please contact your system administrator if you cannot login with those roles. l) We are running VFSMOD-W using runoff data with sediment concentration and are getting this warning message that the Froude number >2. We have tried changing a lot of things, but can not seem to get this to go away. Is this a serious warning or not, and what is likely to be causing this problem? The Froude number F represents the ratio of inertial to gravitational forces that act during the overland flow wave formation. When this number is <1.5 (or 2 following other texts), the kinematic waves dominate against the dynamic waves and thus the kinematic wave approximation to the full Saint-Venant equation is appropriate. Greater values just mean that the conditions of the problem start deviating from these assumptions. In this case, more error between the mathematical representation and the physical reality should be expected. Notice that based on equation 4 this might be caused by relatively high flow velocity with very shallow flow. Is your Manning's n too low? Your slope too steep? Keep also in mind that the Froude number that is calculated is also an estimate (best guess), since we don't know a priory the time series of velocity or water depth in the filter (these are results from the model). m) We are getting a warning about large Froude numbers during the simulation. What can cause this? I reviewed your input file. There was a mistake in the .ikw file with the slope units. These should be given in fractional numbers, not in %. For example 5.3% slope is input in that file as 0.053. The numbers in the spreadsheet you sent me indicated that the filed contained the percentage form. n) We are getting a warning about the filter inundated during the simulation during the simulation. What can cause this? The peak flow rate of the incoming hydrograph for the size of plot you are working with is very large. Notice that when this is converted to an estimated water depth, using Manning's, we are talking about close to 8" of water on the surface of the filter! This violates most overland, "sheetflow", conceptualizations. The model will run but is giving you a warning that the kinematic wave will produce approximate results only (errors in excess of the 10-15% that the original work by Woolhiser and Ligget suggested for this formulation). o) Are there any rules to set the beginning of the inflow and rainfall files (.iro and .irn)? You should pick the beginning of the storm in your .iro file as t=0 and then shift both time scales for the incoming hydrograph and hyetograph accordingly (files i.ro and .irn). p) How do I handle multiple storms? Part II: VFSMOD and UH: User’s Manual 82 VFSMOD-W is a single event simulation program. Each storm should be handled in independent project files. In your application case there are in fact two separate storms in your files (first starting at 900 s and second at 44800 s). Moreover, only the second one seems to produce any runoff at all. Although you can run them together (see norman1.prj results), you should separate them as individual storms, or likely just run the second event only. q) How do I select N, CR and MAXITER in the .ikw file? This is explained in the User's Manual[5.7MB]. Here are some tips: • 'N', the number of finite elements, does not have to be the same as the number of physical land segments you measured in the field (i.e., 15). Instead you can numerically subdivide these into a sufficiently large number of elements to give better numerical stability to the solution. Doing this will result into much faster runs. The way this is done is that elements within each land segment (characterized by a Manning's n and slope) has the same values as the segment. The program does this internally when you select N>NPROP. • Changing the CR to a smaller number will also slow down the simulation (we recommend 0.8). • The MAXITER should probably be left at 350. If the program is not allowed to converge at each time step errors can accumulate and the ensuing numerical instabilities lengthen the simulation time. r) What is the H value (vegetation height) represent in the .igr file? This is explained in the User's Manual. Remember H is not only the length (height) of the stem that does not topple, in other words remains erect under flow conditions, but also tells the model how high it can build the sediment wedge. In your particular application case (H=110 cm) this is not a realistic value for grass. Are you modeling grass or other species? s) Is there a way to vary the sediment concentration during the runoff event or are we forced to keep the concentration constant during a run? Notice that the fact that an average inflow sediment concentration is considered does not mean that the sediment inflow is not dynamic. Let me explain. The important thing to consider is the sediment load, gs [M/T]. When you multiply the average sediment concentration for the event (i.e., total inflow sediment / total inflow runoff volume) by the hydrograph, q(t), i.e.: gs [M/T] = Ci [M/L3] × q [L3/T], you obtain a dynamic sedimentograph into the filter. The basic assumption here is that these two sedimentographs (i.e., one calculated from several samples through the event vs. one using the average concentration for the event) are not too different. Furthermore, that the difference between the resulting sediment deposition and outflow might be also small. When developing the model we compared several of these for different field experiments and model runs and found the simplification to be acceptable. This simplification had the benefit that the user did not have to come up with samples through the event but just the average. Could you check if this assumption holds for your particular case? If enough users think that using a changing sediment concentration with time is critical for their application let us know and we will add this feature to the program. Part II: VFSMOD and UH: User’s Manual 83 t) You mention sediment transport capacity (gsd) at the end of the filter; how do you calculate sediment transport capacity? In fact gsd is also called sediment load in the manual. This is calculated depending of the region of the filter. The basic idea is to compare the calculated value of gsd with the incoming sediment concentration. If gsd> sediment concentration, the difference is allowed to deposit in whatever section of the filter is being calculated (coarse sediment at wedge, or fine sediment at the lower section of the filter). u) The equations have a dp or median particle size, but it seems that some particle size distribution must be implicit in the equations. I am a bit confused how dp or d50 can simulate the deposition realistically if it is a single particle size. Clearly different sized particles settle at different rates and a single particle size specification must be implying some distribution. This is a good question. Although this clearly assumes a certain type of distribution, or at least the d50 can represent realistically the population of sediment particles entering the filter, this is an accepted approach in sediment transport studies, most of which come from river dynamics. Please keep in mind that you are in fact not characterizing the incoming sediment based on the d50, but most importantly also based on the partitioning between fine and coarse sediment. The Hayes approach is just a further elaboration of this principle where the incoming sediment population is divided into several classes (ranges of particles), each with its representing particle characteristics, and then each class routed in turn to the filter. The results are then aggregated at the end of the simulation. This allows you to obtain more detail on the outgoing sediment distribution, tto. However, it does require a lot more information on the incoming characteristics of your sediment. We are now also incorporating this approach into VFSMOD, which we feel is granted only when moving sediment adsorbed pollutants through the filter. v) My problem here is that when I calculate a dp from the input sediment distribution that includes 5 classes like Foster does it (primary sand, silt and clay; small and large aggregates), I get pretty large dp values; like 100 um or more. The soil I am working with is a silty clay loam and the large aggregates contribute a lot to the dp (large aggregates assumed to be 500 um like Foster suggests). Can you tell me if some particle size distribution is assumed with the equations you use? The Hayes et al. 1984 paper discusses this, but I must confess to not fully understanding everything they did. The publications from Kentucky that deal with the theory are reports that I have not been able to find in our library. Can these still be obtained? We can recommend a book recently published: • Design Hydrology and Sedimentology for Small Catchments by C. T. Haan, B. J. Barfield, and J. C. Hayes. Chapter 9 (pp. 359-375) and Appendix 9C describes well most of this equations. Notice that the strength of VFSMOD-W is that it contains a hydrodynamic approach (runoff, rainfall, infiltration), rather than the average conditions for the event used in this reference. Part II: VFSMOD and UH: User’s Manual 84 w) Sediment trapping efficiencies simulated by VFSMOD-W seem to be much higher than we have measured (measured are 70-80%) in our farm-field buffers and I have to put in small dp values (seemingly too small for consistency with the Foster equations for aggregates) to get near to agreement with our measurements. Also I am surprised that trapping efficiencies can go to 99% when the incoming sediment is 10% primary clay particles, which I would not expect to settle out in a buffer of 15m length. You need to revise your sediment characteristics as well as soil infiltration capacity. High simulated efficiencies are possible, especially if you don't get much runoff at the end of the filter due to infiltration. Does clay in your sediment samples aggregate into larger particles? Remember also, that clay, even if in small amounts, could also deposit depending on the velocity and flow regime. x) If the soil characteristics are known - in other words the soil, silt, and clay balance of deposited sediments are known so that NPART=7, is it best to use a weighted average of the three to determine the values for sediment particle size, DP, and sediment particle density, SG, or do you have another suggestion? In essence there are 3 characteristics that define the sediment transported into the filter. These are: DP (median particle size or d50), SG (sediment particle density) and Vf (fall velocity of the particle in water). One other characteristic is important here, COARSE or the % of particles of diameter >0.0034 cm. One important thing to remember is that the soil as a whole is not transported by runoff from the source area into the filter, but usually only those particles that the energy (velocity) of the flow can carry at any given time. This means that there is usually a selection of the finer soil by runoff during transport. If you had actual sediment samples (from runoff samples collected at the ed of the source area or field) you could plot the cumulative frequency graph of particles less than a diameter, and then choose d50 and COARSE from there. If the measured sediment characteristics are not known (as is often the case) but the soil texture is, one can estimate the dp parameter from soil texture. Tables on how to do this are provided in the documentation of the User's Manual[5.7MB]. x) In the Infiltration-soil properties file there is the parameter "maximum surface storage" of which I don't really know how it is defined. Does this refer to ponding? How is it measured in the field? Surface storage represents the amount of excess rainfall that must be filled at the surface (an average over the area considered) before runoff can begin. Remember excess rainfall is the amount not infiltrated into the soil during the infiltration (storm) event. To set this value consider the regularity of your area 0-0.5 cm would correspond to a fairly well graded soil surface. To get more background on the role of this parameter, I recommend Chapter 4 by Skaggs and Khaleel, pg. 147-152 in Hydrologic Modeling of Small Watersheds, eds. C.T. Haan et al., 1982, ASAE, Mon. 5. ASAE:St. Joseph, USA. y) There is the parameter "fraction of the filter where ponding is checked" of which I also cannot find the definition. This is a fairly insensitive parameter except for very sandy soils. It represents where along the filter the user wants for ponding at the beginning of the event to be checked for. The idea is that two different mechanisms can produce ponding in the filter during an Part II: VFSMOD and UH: User’s Manual 85 event. One is rainfall excess derived from the infiltration capacity of the soil, but the other is a flood wave from the field moving into the filter. The model checks to see if such a wave is in the filter and the automatically switches infiltration to ponding, regardless of the infiltration capacity for that specific time. The question is where to check for (i.e., at the beginning of the filter or at the end) since you will stop your regular Green-Ampt infiltration calculation at that time. You can check for your particular application with 0, 0.5 and 1 values to see if you get any changes. z) In the incoming sediment characteristics file there is the parameter "Porosity of deposited sediments". How do you measure this parameter in the field? Or can it be estimated from other parameters? Yes, it could be measured at the field in an undisturbed column separating the upper layer of sedimentation from the actual soil, measuring the volume and getting the dry weight. You could possibly calculate it from the mean particle size of the sediment assuming some form of packing scheme (spheres, etc)... but we have never done so!. We normally use use a value of 0.437 since does not seem to be a very sensitive parameter. Let us know if you find otherwise. aa) For the roughness in the file buffer vegetation characteristics a difference is made between the Manning's coefficient of the bare surface and that of the vegetation, the grass. Does this mean then that the value for bare surface Manning's is just the value you would give if there where no vegetation? And the vegetation Manning's is then the value that your vegetation adds to the total Manning's coefficient? Or is it the total value. In the buffer segment properties per segment there is also a value required for the Manning's coefficient. Does this value refer to any of those two other Manning's coefficients (bare surface and grass) that are asked in the buffered vegetation characteristics? Or is it a total value of the Manning's coefficient for every segment. There are indeed 3 Manning's coefficients used. RNA (in filename.ikw) gives the value for each grass segment (typically depending on the grass density in that segment or sometimes an average value across the filter for all segments is used), VN and VN2 (in filename.igr) give the values for base soil and modified value for cylindrical media (grass stems at a mesoscopic scale), respectively. The first one of these last two represents the value into which the filter transitions when the edge closer to the field starts filling up with sediment (sediment wedge) and this reaches the maximum value H. Notice the value for each time step is average weighed between good grass and bare soil as the wedge thickens for those segments of the filter affected. The modified Manning's values depend on the filter type and typical values are given in the VFSMOD-W manual appendixes. Notice the units are different to the regular Manning's ones. While the first two values (RNA and VN) are used in overland flow calculations, VN2 is only used for sediment deposition calculations based on the original work at the University of Kentucky on sediment trapping. Part II: VFSMOD and UH: User’s Manual 86 Part III: VFSMOD-W: Windows User’s Manual TM 1. VFSMOD Model Description VFSMOD is a field scale, mechanistic, storm-based model designed to route the incoming hydrograph and sedimentograph from an adjacent field through a vegetative filter strip (VFS) and to calculate the outflow, infiltration and sediment trapping efficiency. The model handles time dependent hyetographs, space distributed filter parameters (vegetation roughness or density, slope, infiltration characteristics) and different particle size of the incoming sediment. Any combination of unsteady storm and incoming hydrograph types can be used. As an aid to set up the model inputs, the distribution package includes a utility, uh, that creates synthetic model inputs based on the NRCS (SCS) design storm for a given location and soil type. The utility implements the NRCS’ (SCS) curve number, unit hydrograph and Modified Universal Soil Loss Equation (MUSLE) concepts to produce ready-to-use input files for VFSMOD. These inputs are rainfall hyetograph, field inflow hydrograph and field sediment inflow and characteristics. The model has been field tested for different soil and climatic conditions in the uplands of the Piedmont and Coastal Plain areas of North Carolina (USA), and under controlled field conditions in Guelph (Canada). The model is targeted at studying VFS performance on an event by event basis. Though a research tool, the model can assist planners and regulators to determine the relative effectiveness of filter strips in a given situation. This version of the model uses inputs that are easily obtainable and a program to generate inputs for the model is provided. Extensive model documentation is provided on-line also in PDF format from the model’s web site: http://abe.ufl.edu/carpena/vfsmod 2. Installation Information This package consists of three programs to assist users in evaluating and developing design specifications for vegetative filter strips for trapping sediment and enhancing infiltration. The programs are the graphical user interface (GUI – vfsmod-w.exe version 4.1.xx), a program to estimate rainfall hyetographs, runoff hydrographs and storm-based erosion losses from typical source areas (UH – uh.exe, version 2.4 or later), and the vegetative filter strip model (VFSMOD – vfsm.exe, version 2.4 or later). The GUI was developed to assist users in executing the Vegetative Filter Strip Model, VFSMOD and UH. Development of the graphical user interface program (GUI) was started in March 2000. Since that time we have continued to improve the interface and add new features to the system. As such we expect there will be a number of bugs that may appear. The graphical front end, GUI for VFSMOD was developed using Visual Basic Professional Edition (version 6.0)[vb6]. The Visual Basic source code is available upon request. The Part III: VFSMOD-W: WindowsTM User’s Manual 86 programs UH and VFSMOD were developed in FORTRAN and the source code is supplied with the installation package. This program is supplied to be installed using the Visual Studio Installer. As such, a number of controls, dll's, and other files are included and usually installed. We have made no attempt to eliminate or reduce the package, although this is a future desire. If you attempt to bypass setup, we have no idea what must be installed. The install package includes the complete Win32 distribution for vfsmod. The default installation directory is: C:\vfsmod which can be changed to any location. For example, if the installation was done for D:\vfsmod, then this directory would contain: C:\vfsmod-w Vfsmod-w.exe Graphical user interface Vfsmod-w.hlp Windows Help file Uh.exe Utility program, uh Vfsm.exe Vegetative filter strip model, vfsmod Sample2.lis Sample project for uh Sample.prj Sample project for vfsmod globalSensitivity.exe Global Sensitivity model globalSensitivity.exe.xml Readme.txt This information Documentation Vfsm.pdf the Users Manual Inputs\ Directory containing the inputs Sample.igr Sample Overland flow inputs for VFSMOD Sample.ikw Sample Buffer vegetation inputs for VFSMOD Sample.irn Sample Rainfall hyetograph for VFSMOD Sample.iro Sample Runoff hydrograph for VFSMOD Sample.isd Sample Incoming sediment characteristics for VFSMOD Sample.iso Sample Infiltration soil properties for VFSMOD Sample2.igr Sample overland flow inputs created by uh Sample2.inp Sample inputs for uh Sample2.iso Sample infiltration soil properties created by uh Output\ Directory containing the outputs from uh and VFSMOD Sample2.out Sample output from uh – used as a placeholder SourceCode\ Uh FORTRAN source code for UH Vfsm FORTRAN source code for VFSMOD Inverse\ inverse.cfg meas_hyd.txt Sample Calibration Hydrograph meas_gso.txt Sample Calibration Sedigraph start_inv.exe Inverse calibration program star_inv.ctf \Inputs inverse.igr Part III: VFSMOD-W: WindowsTM User’s Manual 87 inverse.irn inverse.isd inverse.ikw inverse.iro inverse.iso \Outputs inverse.og1 inverse.og2 inverse.ohy inverse.osm inverse.osp Patterns\ pattern.igr pattern.ikw pattern.inp pattern.irn pattern.iro pattern.isd pattern.iso And after your first execution of vfsmod-w, then the Options file is written to this directory, vfsmod-w.cfg. The Directory for Saving Project Files should be: C:\vfsmod-w After this is done, vfsmod-w should be ready to analyze your vegetative filter strips Part III: VFSMOD-W: WindowsTM User’s Manual 88 3. Using VFSMOD How Can the Model be Used? This package can be used to comprehensively evaluate and develop designs for vegetative filter strips to trap sediment and other contaminants and enhance infiltration. A typical application of the package would follow the outline below. (1) (2) (3) (4) (5) (6) Develop input datasets for UH to generate storm data for a typical upslope source area. Run UH to develop input hydrograph and hyetograph data for VFSMOD Develop input datasets for VFSMOD for describing the filter strip Run VFSMOD to simulate the performance Modify any of the inputs for UH and/or VFSMOD to better reflect target source area – filter strip. Use the Design Option to examine a range of storm events – filter strip combinations to evaluate alternate possible designs. After Step 5 or 6, an alternate path could examine the uncertainty associated with the proposed design. Following this path, the user can use the Sensitivity and Uncertainty Options to investigate. The steps would be: (1) (2) (3) (4) Use the Sensitivity options to identify the most sensitive parameters for the design centered on the base input values for the target source area and filter strip. Select the most sensitive parameters and assign these probability distributions Use the Uncertainty section to perform Monte Carlo Simulations Using the Analysis portion of the Uncertainty Section, examine the probability distributions for the key outputs of interest and assign confidence intervals and other estimates on the final filter strip designs (note: the program supplies basic statistics and the actual simulated data to allow the users to use other outside analysis tools to complete this analysis – users are welcome to contact us for suggestions). Part III: VFSMOD-W: WindowsTM User’s Manual 89 4. Main Window Application of VFSMOD is done via project files. The project files consist of a list of filenames identified by keywords indicating the type of input or output file. To Open a project file, select the File Menu and Open a VFS Project File. From the main window you can also execute VFSMOD. This option is available from the VFSM menu. This menu contains submenus for Execution and Analysis. Under the Execution submenu, the current project, a project from disk or multiple projects from disk can be executed. The Analysis submenu can be used to view output files from VFSMOD in addition to graphing and comparing some of the outputs generated by VFSMOD. Part III: VFSMOD-W: WindowsTM User’s Manual 90 Other menu selections include Design, Sensitivity and Uncertainty. These are discussed in more details in other sections. The Options menu is used to identify the user and select a default directory for project files. Although we request registration to download the model, this menu also stores information about the user and their installation. For bug reports we may request that you e-mail us this file to assist in debugging. The file is located in the installation directory and is called vfsmod.cfg. 4.1 vfsmod-w Options File On the main window, the Options Menu allows the user to review the program’s options and user information. This information is entered the first time vfsmod-w is executed and can be checked and changed using the Options Menu. Part III: VFSMOD-W: WindowsTM User’s Manual 91 {bmc C:\Documents and Settings\ABE User\My Documents\desktop backup oct 2007\VFSMOD CODE\HELP with HELLLP\help5\vfsmod-w\vfs-options.bmp} Fill in the registration information. Be sure to select the directory where you installed vfsmod-w.exe for the Directory for Saving Project Files. On the Options screen, we have included an option to associate files with extensions prj and lis with vfsmod-w.exe. This is currently not implemented. Once available this option will allow the user to click on a file with prj or lis extensions from the Explorer window and automatically load the project. You can manually accomplish this by associating these extensions with vfsmod-w.exe using the file Properties menu from Explorer. Currently, we do not have an automatic registration for vfsmod package. The registration information is included on the Options screen. This information is stored in the file: vfsmod-w.cfg in the installation directory. We suggest that you e-mail this file to us as an attachment. Part III: VFSMOD-W: WindowsTM User’s Manual 92 5. UH Project Window As an aid to set up the model inputs, the distribution package includes a utility, uh, that creates synthetic model inputs based on the NRCS (SCS) design storm for a given location and soil type. The utility implements the NRCS’ (SCS) curve number, unit hydrograph and Modified Universal Soil Loss Equation (MUSLE) concepts to produce ready-to-use input files for VFSmod. These inputs are rainfall hyetograph, field inflow hydrograph and field sediment inflow and characteristics. The files used by uh are identified in the project window. There are also options to Save the project, Edit an input file and Browse Select a different input file. In addition, any of the input or output filenames can be changed from this window. Option buttons provide shortcuts to the UH menu entry, these include the buttons: -Run This Project executes the current project -Graph Hyetograph produces bar graphs of rainfall intensity versus time, the user selects the output rainfall hyetograph file (irn) -Graph a Runoff Hydrograph produces a runoff hydrograph, the user selects the runoff file (iro) -View Output Files opens a text window with a user selected output file Part III: VFSMOD-W: WindowsTM User’s Manual 93 For Tips on running/troubleshooting VFSMOD see section in Part II. T Inputs inp= inputs for the source area for UH Outputs irn= rainfall hyetograph (input for vfsmod) runoff hydrograph from the source iro= area (input for vfsmod) sediment properties for the sediment isd= filtration submodel summary of the inputs and outputs out= from UH detailed summary of of MUSLE calculations and the runoff hyt= hydrograph 5.1 UH Input File Editing The inputs for the UH program are entered in the text boxes. Rainfall -This is the total rainfall for the storm in mm. Curve Number - This is the NRCS curve number for the source area. The range is from 0 to 100. There are tables in the appendices to select See “NRCS (SCS) Curve Numbers” on page 164. for Agricultural and Urban source areas. The curve numbers Part III: VFSMOD-W: WindowsTM User’s Manual 94 given in these tables represent Antecedent Moisture Condition (AMC) II which is average moisture conditions. Length - This is the length of the source area in m or the distance from the edge of the area (bordering the filter strip) along the upslope line to the farthest upslope point contributing runoff to the filter strip. Area - This is the source area in hectares. Slope - This is the slope of the source area as a fraction or the % slope divided by 100. Storm Duration - The time of the storm in hours used to compute the hyetograph and hydrograph. Storm Type - This is the type of rainfall event. (I, IA, II, or III). Type I is typically associated with Hawaii, coastal side of Sierra Nevada in southern California, and the interior regions of Alaska. Type IA is used to represent storms for the coastal side of the Sierra Nevada and the Cascade Mountains of Oregon, Washington, and northern California, and the coastal regions of Alaska. Type II is used to represent most of the remaining areas of the US. Type III is used for storms along the Gulf coast, southern Florida and coastal areas of the eastern US. Soil Erodibility Factor, K - This is the USLE soil erodibility factor. (If K<0, then K is computed based on texture and organic matter) (See “Universal Soil Loss Equation (USLE)” on page 24.) C Factor - The USLE Crop factor (See “MUSLE Crop factor C” on page 170.) P Factor - The USLE P (Practice) factor (See “Contour factor (P) values for MUSLE equation in UH” on page 176.) Soil Type - ( for the surface soil layer (See “Definition” on page 73.) dp – Particle Class Diameter ranges from 15 to 200 um. Tables based on soil types are used when the user specifies -1. (See “Sample application” on page 66.) Rainfall Factor - The rainfall factor for the modified storm version of USLE. Select the method to compute the storm R factor in MUSLE, not present or =1 selects Foster’s Method, =2 selects Williams method, and =3 selects the CREAMS/GLEAMS method. The User can change the name of the input file in the Input Filename window. The inputs can be saved using the Save button. In this case the window remains open for further editing. This is helpful to create multiple inputs. The Close and Save will save the inputs and close this window. The Help button gives this help screen. Part III: VFSMOD-W: WindowsTM User’s Manual 95 6. VFS Project Window The files used by VFSMOD are identified in the project window. There are options to Save the project, Edit any of the input files and Browse to Select different input files. In addition, any of the input or output filenames can be changed from this window. Other options buttons provide shortcuts to the VFSMOD menu entry, these include the buttons: -Run This Project executes the current project -Graph a Sediment/Runoff Balance produces bar graphs comparing sediment and runoff in and out of the filter strips, the user selects the output summary file -View Output Files opens a text window with a user selected output file Changes had been made to the current Windows GUI to incorporate the new WQ feature when configuring and running a VFSM project, as well as running filter design for pesticide reduction. The figure below illustrates these changes. As a feature, if the user changes the project file name, then the output file names are changed to the same first level name. This feature can be overridden by changing the output file names. Part III: VFSMOD-W: WindowsTM User’s Manual 96 Inputs Outputs ikw= buffer properties for the sediment filtration og1= submodel og2= parameters for the overland flow solution irn= storm hyetograph ohy= iro= storm hydrograph from the source area osm= isd= iso= sediment properties for the sediment osp= filtration submodel soil properties for the infiltration submodel igr= detailed time series describing the sediment transport and deposition within the buffer detailed information on the singular points defined in the theory section of the manual detailed outputs on the inflow and outflow hydrographs detailed summaries of the water and sediment balance, final geometry of the filter overall summary of filter performance with comparisons between the source area and filter If the “Include Water Quality Option?” is selected, then two more files will be shown: Inputs iwq= Outputs Pollutant properties for the Water Quality/ Transport submodel (only needed if IWQ=1 owq= in *.ikw) details describing the water quality transport and removal efficiency This version of VFSMOD incorporates the algorithms derived by Sabbagh et. al., 2009 to predict pesticide trapping by vegetative filter strips by selecting the Option 1 when the “Include Water Quality?” option is selected. The program has been modified to achieve 3 main objectives: a) incorporate the new water quality WQ functionality b )ensure backward compatibility with previous versions of the program (command line and windows GUI) c)provide a framework for the addition of future other water quality components (options 2 and 3 when the “Include Water Quality?” option is selected) User selection of new pesticide component From a user perspective, the main difference with previous versions of the program is the addition of a new flag at the end of the .IKW input file that enables the new water quality component. Sample IKW file showing new water quality CWQ flag (WQ on: CWQ=1; WQ off: CWQ= any number, character or missing) {bmc C:\Documents and Settings\ABE User\My Documents\desktop backup oct 2007\VFSMOD CODE\HELP with HELLLP\help5\vfsmod-w\FlagIkw.bmp} When the new flag is missing or contains a vale different than “1”, the program executes like in previous versions (4.0 or lower) without the water quality component. With CWQ=1 the program requires a new input file in the “inputs” directory with extension .IWQ, described below. As before, the program can be executed from the command line in two ways. When the program is executed followed by the name (no extension) of a set of files (input files with same name). For example, typing “vfsm sample” will execute the program for a set of files: sample.ikw, sample.irn, sampe.iro, sample.iso, sample, isd. A second way of Part III: VFSMOD-W: WindowsTM User’s Manual 97 executing the program is specifying a project file with extension .PRJ. This is a text file that specifies the names of the input and output files of dissimilar names and allows for the user to quickly combine soil types and hydrological events (represented by different input files created by the user) for advanced analysis. When the CWQ=1 the same rule applies but the new input file IWQ needs to be present or specified in the project file (along with the new water quality output file .OWQ). In the previous example, executing “vfsm sample” with the CWQ=1 in the .IKW file will require the set of files sample.ikw, sample.irn, sampe.iro, sample.iso, sample, isd and sample.iwq in the inputs directory. An example of project file for this case is specified in File 2. Sample project file sampleP.prj showing the specification of the new water quality input and output files When executing the program either way the new input files are shown during the beginning of the run, 6.1 Overland Flow Inputs (ikw) Part III: VFSMOD-W: WindowsTM User’s Manual 98 LABEL FWIDTH VL N THETAW CR MAXITER NPOL IELOUT KPG NPROP SX(I) RNA(I) SOA(I) a label (max. 50 characters) to identify the program run width of the strip (m) length of the filter strip (m) number of nodes in the domain (integer) (must be an odd number for a quadratic finite element solution, but the program checks and corrects if needed). time-weight factor for the Crank-Nicholson solution (0.5 recommended) Courant number for the calculation of time step from 0.5 - 0.8 (recommended). (See “Sample application” on page 66.) (integer) maximum number of iterations alowed in the Picard loop. (integer) number of nodal points over each element (polynomial degree +1) [Recommended value=3] (See “Sample application” on page 66.) (integer) flag to output elemental information (1) or not (0) (integer) flag to choose the Petrov-Galerkin solution (1) or regular finite element (0) [Recommended value=1] (See “Sample application” on page 66.) (integer) number of segments with different surface properties (slope or roughness) (real) X distance from the beginning on the filter,in which the segment of uniform surface properties ends (m). Manning’s roughness for each segment (s.m-1/3) slope at each segment (unit fraction, i.e. no units) Part III: VFSMOD-W: WindowsTM User’s Manual 99 Selecting the View Segments button displays a graph of the elevation change across the filter strip. The elevation change is relative to the upslope edge of the filter strip. If the user changes VL, the length of the filter strip, then a check is made of the segment properties to ensure that the last point in SX is equal to the new buffer strip length. If it is not, then the View/Edit Segment Properties screen is opened and a warning message box is shown reminding the user to fix the segment properties data. Part III: VFSMOD-W: WindowsTM User’s Manual 100 6.2 VFS Infiltration Soil Properties (iso) After opening the .iso file, the user sees the regular soil input selection window. Notice that a new option has been added for shallow water table. Part III: VFSMOD-W: WindowsTM User’s Manual 101 Parameters in this window correspond to the regular soil input selection (vfsmod-w ver 5.8 or before). Explanation for those parameters is as follow: VKS SAV OS OI SM SCHK saturated hydraulic conductivity, Ks (m/s) (See “Soils data (GreenAmpt parameters)” on page 161. Green-Ampt’s average suction at wet front(m) (See “Soils data (Green-Ampt parameters)” on page 161.) saturated soil-water content, s (m3/m3) (See “Soils data (GreenAmpt parameters)” on page 161.) initial soil-water content,i (m3/m3) maximum surface storage (m) relative distance from the upper filter edge where the check for ponding conditions is made (i.e. 1= end filter, 0.5= mid point, 0= beginning) When the shallow water table option is selected, a new part of the soil input selection window is opened that includes selections that are only relevant for this case. Notice that SAV and OI inputs from the previous window will be ignored (they will be dimmed in the final version), since the program calculates those internally based on the shallow water table conditions When selecting the “Show parameters” button, the soil characteristic curves parameters are selected. Part III: VFSMOD-W: WindowsTM User’s Manual 102 After the new parameters are provided, the rest of VFSMOD-W remains unchanged and simulations can be performed as before. Modifications to original VFSMOD-W input files to accommodate shallow water table option The input file .iso has been modified to ensure backwards compatibility. For this, if a number appears in a new line below the standard file, the program considers that the shallow water table option has been selected and reads the value in that line as the water table depth (WTD, m, 0 < WTD < 10.0) and continues reading on the next lines for additional parameters. The following structure will then be followed: VKS SAV OS OI SM SCHK WTD ITHETATYPE PAR(I) IKUNSTYPE PARK(J) Vhe Note that SAV and OI are now calculated internally, but two dummy numbers must be included to ensure backwards compatibility of the file, even although these numbers are Part III: VFSMOD-W: WindowsTM User’s Manual 103 ignored. PAR(I) and PARK(J) are parameters of the soil water retention and unsaturated hydraulic conductivity curves, respectively. ITHETATYPE is an integer to select the soil water characteristic curve type with values: 1= van Genuchten, 2= Brooks and Corey. The parameters for these curves will be: Equation ITHETATYPE PAR1 PAR2 PAR3 PAR4 ITHETA van Genuchten 1 OR VGALPHA VGN VGM 1 OR 2 Brooks and Corey 2 OR BCALPHA BCLAMBDA 1 OR 2 If the effective saturation, Se, is defined as: – r S e = ---------------s – r where is the moisture content, r is the residual moisture content, and s is the saturated moisture content, the van Genuchten equation for the soil water characteristic curve is: s – r h = r + ----------------------------------- 1 + VG h n m h = s 1 S e = ----------------------------------- 1 + VG h n m h he Se = 1 h he where: VG = van Genuchten enpirical parameter n and m = van Genuchten shape parameters (m = 1-1/n) he = air entry pressure Note: There are 4 parameters the user needs to define: s, r,, VG,, and n The Brooks and Corey for the soil water characteristic curve is: h = r + s – r BC h – h = s S e = BC h – 1 h e – --------- BC Se = 1 1 h e – --------- BC where: BC = -1/he = inverse of air entry pressure = Brooks and Corey shape parameter Note: There are 4 parameters the user needs to define: s, r, BC,and Part III: VFSMOD-W: WindowsTM User’s Manual 104 By default, the program assumes that he is equal to -1/VG or -1/C. However, if the user wants to specify a fixed he, it can be done by addinga value (Vhe) at the end of the file. If the numberis not present, the program calculates he according to the rules above. IKUNSTYPE is an integer to select the unsaturated hydraulic conductivity curve type with values: 1= van Genuchten, 2= Brooks and Corey and 3=Gardner’s. The parameters for these curves will be: Equation IKUNSTYPE PAR1 can Genuchten 1 VGM Brooks and Corey 2 BCETA Gardner 3 GDALPHA PAR2 BCALPHA The van Genuchten equation for the hydraulic conductivity curve is: m 2 K = K s S e0.5 1 – 1 – S em K = Ks h he h he Note: There are 2 parameters the user needs to define: Ks and n The Brooks and Corey equation for hydraulic conductivity curve is: 1 h e – --------- K = K s S e BC 1 K = K h e – ---------s BC where: = Brooks and Corey shape parameter ( Note: There are 3 parameters the user needs to define BC, and The Gardner equation for hydraulic conductivity curve is: K h = K s e – GDN h where: GDN = Gardner shape parameter Note: There are 2 paramters the user needs to define: Ks and GDN Part III: VFSMOD-W: WindowsTM User’s Manual 105 Example of the new .iso file with shallow groundwater option: 3.89E-05 1.72 0.39 0.25 2 0.15 78.286 0.4 2 6.7471 78.286 0 1 0.7 In this example, a shallow water table is present 0.7 m below the surface, Brooks and Corey is selected for the soil moisture characteristic curve (r BC = 0.4). The unsaturated hydraulic conductivity based on Brooks and Corey is selected ( = 6.7471, Cand since there is no value in the fifth line of the file, he = - 1/C. An example of the same .iso file without shallow groundwater will be: 3.89E-05 1.72 0.39 0.25 0 1 6.3 VFS Buffer Vegetation Characteristics (igr) SS VN H VN2 spacing of the filter media elements (cm) (See “Vegetation types for VFS’s” on page 163.) filter media (grass) Manning's n (See “Vegetation types for VFS’s” on page 163.) (0.012 for cylindrical media) (s.cm-1/3) filter media height (cm) (See “Vegetation types for VFS’s” on page 163. bare surface Manning's n (See “Manning’s roughness coeficient, n” on page 162.) Part III: VFSMOD-W: WindowsTM User’s Manual 106 ICO (integer) flag to feedback the change in slope and surface roughness at the sediment wedge for each time step (0= no feedback; 1= feedback) (See “Sample application” on page 66.) 6.4 Incoming Sediment Characteristics (isd) NPART NPART 1 2 3 4 5 6 7 COARSE CI POR (integer) incoming sediment particle class according to the USDA (1975) particle classes: Particle class Diam. range (cm) dp (cm) Clay <0.0002 0.0002 Silt (1) 0.0002 - 0.005 0.0010 Small aggregate ---0.0030 Large aggregate ---0.0300 Sand 0.0050 - 0.2 0.0200 Silt (2) 0.0002 - 0.005 0.0029 User selected ---DP Vf (cm/s) 0.0004 0.0094 0.0408 3.0625 3.7431 0.0076 model s (cm3/s) 2.60 2.65 1.80 1.60 2.65 2.65 SG % of particles from incoming sediment with diameter > 0.0037 cm (coarse fraction that will be routed through wedge) (unit fraction, i.e. 100% = 1.0). incoming flow sediment concentration (g/cm3) porosity of deposited sediment (unit fraction, i.e. 43.4% = 0.434) Part III: VFSMOD-W: WindowsTM User’s Manual 107 DP SG sediment particle size, diameter, d50 (cm), read only if NPART=7 sediment particle density, s(g/cm3), read only if NPART=7 Note: COARSE and DP are related so that their values need to follow the this rules: COARSE DP >0.5 >0.0037 0.5 0.0037 <0.5 <0.0037 6.5 Storm Hyetograph (irn) The hyetograph input files can be manually entered or generated using the UH program. See the UH program documentation for further information. NRAIN RPEAK RAIN(I,J) (integer) number of rainfall periods including period to end simulation maximum rainfall intensity for the storm (m/s) time (s) and rainfall rate o intensity (m/s) over the VFS for each period. The last time step corresponds with the desired simulation time chosen by the user (typically coupled with a rainfall intensity of 0). Note also that each time corresponds to the beginning of the rainfall period. The hyetograph can be viewed by selecting the Plot Hyetograph button. Part III: VFSMOD-W: WindowsTM User’s Manual 108 6.6 VFS Source Area Storm Runoff (iro) The runoff hydrographs from the source area can be manually entered or generated using the UH program. See the UH program documentation for further information. Part III: VFSMOD-W: WindowsTM User’s Manual 109 SWIDTH SLENGTH NBCROFF BCROPEAK BCROFF(I,J) Source area width (m) Source area flow path length (m) (integer) number of time steps of the incoming field hydrograph Peak flow of the incoming field hydrograph (m3/s) incoming field hydrograph: flow rate, time (s) vs. qin(m3/s). The hydrograph can be viewed using the Plot Hydrograph button. Part III: VFSMOD-W: WindowsTM User’s Manual 110 6.7 VFS Water Quality Input File (iwq) This file is only required and read when CWQ=1 in the input file .IKW. In this case the file must be present in the “inputs” directory of the application. The water quality component is specified in the first line of this input file. The parameters required in the Part III: VFSMOD-W: WindowsTM User’s Manual 111 rest of the file depend on the type of water quality component selected. Currently only a pesticide component is available in this version (Option 1. Pesticides using the windows interface). Contents of the new IWQ file with description of parameters required (only the no degradation case is handled in the GUI, other cases can be handled through the IWQ text file, see Users Manual). Option Selection using the Windows Interface Option 1. Pesticides. Sabbagh et al. (2009) allowed the use in VFSMOD of the following empirical pesticide trapping efficiency equation P = a + b Q + c E + d ln F ph + 1 + e C Where P is the pesticide removal efficiency (5), Q is the infiltration (%) defined as the difference between flow entering to VFS (i.e., inflow runon plus precipitation) minus the runoff from the VFS, E is the sediment reduction (%), Fph is a phase distribution factor (i.e., ratio between the mass of pesticide in the dissolved phase relative to the mass of the pesticide sorbed to sediment), and %C is the clay content. For five model development studies. Sabbagh et al. (2009) reported regression parameter: a=24.8, b=0.5, c=0.5, d=-2.4, and e=-0.9. The foundation of the proposed empirical equation is a physically-based parameter for the potential for a pesticide to partition between the soil and water phase as quantified through the linear sorption coefficient, Kd Kd = Koc(%OC) / 100 where %OC is the percentage organic carbon in the soil. The phase distribution parameter, Fph, is determined using the following equation, where Qi and Ei are the volume of water (L) and mass of sediment (kg) entering the VFS: Fph = Qi / ( Q *Ei) Option 2 TaRSE and Option 3 Other. Part III: VFSMOD-W: WindowsTM User’s Manual 112 These options are not available now, but leave the space ready for adding the Generic Pollutant Transport Component and other algorithms for specific pollutants (now under development). Reference: G. J. Sabbagh, G. A. Fox, A. Kamanzi, B. Roepke, and J.-Z. Tang, 2009. Effectiveness of Vegetative Filter Strips in Reducing Pesticide Loading: Quantifying Pesticide Trapping Efficiency. J. Environ. Qual. 2009 38: 762-771. 6.8 VFS Description of the Output Files (a) filename.ohy This file contains information related to the hydrology side of the problem (overland flow and infiltration). The content of this the file is controlled by the input parameter IELOUT. The first part of the file summarizes information read from the *.ikw, *.iso and *.irn input files along with some of the calculated parameters needed for the simulation. The second part of the file contains the inflow hydrograph (from *.iro), rainfall excess ie calculated with the Green-Ampt model and the output hydrograph from the filter. Only 100 time-steps are printed to this file, each one is the average of the precedent NWRITE steps, where NWRITE=NDT/100. (b) filename.og1 The file contains information related with the sediment filtration model. The first part of the file summarizes information read from the *.igr and *.isd input files along with some of the calculated parameters needed for the simulation. The second part of the file contains sediment transport and deposition time series for the simulation period. As before, only a 100 time-steps are printed to this file. In this case the sediment filtration step is calculated with the average flow conditions calculated as described above. (c) filename.og2 This file contains the flow characteristics at the singular points (1-3, in and out), as defined in Part I of this manual, of the filter for the simulation period for the same 100 steps described above. (d) filename.osm This file contains a summary of the most relevant input parameters and output results, including a sediment and water balance, the sediment trapping efficiency of the filter for the simulation case, and the final geometry of the filter. (e) filename.osp Part III: VFSMOD-W: WindowsTM User’s Manual 113 Summary of the filter performance parameters and comparisons between source and filter areas. (f) filename.owq This file is only created during run time when CWQ=1 in the input file .IKW. In this case the file will be created in the “output” directory of the application. The water quality component is specified in the first line of this input file. The parameters listed and results in the rest of the file depend on the type of water quality component selected. Currently only a pesticide component is available in this version. An option for pesticide partitioning and degradation between events is also included (details are provided in Muñoz-Carpena, 2012). Contents of the OWQ file with no degradatibetween events on selected. Reference: Muñoz-Carpena, R. 2012. Continuous-simulation components for pesticide environmental assessment with VFSMOD: 1. VFS pesticide residue between runoff events. Technical Report. University of Florida, Agricultural Engineering Department. URL (Accessed June 15, 2014): http://abe.ufl.edu/carpena/vfsmod/FOCUS/ VFSMOD_Continuous_Sim_Report_PesticideResidue_MunozCarpena.pdf Part III: VFSMOD-W: WindowsTM User’s Manual 114 7. Processing and Analysis of VFSMOD Results In this version, limited analysis of the output files is available. These options are available from the VFSMOD menu’s Outputs option. Currently, the output files can be viewed by selecting the VFS Output Viewer menu and the user can create plots of the Hydrology and Sediment Balances for the simulation. The user selects a results file for each of these options. { Part III: VFSMOD-W: WindowsTM User’s Manual 115 All of the output files are in ASCII format and can be imported into other applications for further processing. When designing a filter using the Design option, a csv file is produced and the results can be read either in text format or in graphs for RDR, SDR and PDR. (see the “Design Screens” section for more details) We are planning to implement other analysis options in future versions. Part III: VFSMOD-W: WindowsTM User’s Manual 116 8. Using the Plot Windows The user can make graphs of various input and output parameters. Each of the Plot windows offer option buttons to Copy the Plot to the Clipboard, Edit the Plot, or Print the Plot. A plot of a runoff hydrograph is used as example to illustrate the various options. Selecting the Edit Plot button, the plot can be customized. The Axis titles can be changed along with setting the minimum and maximum values of the range along with how many labels. A Title for the Plot can also be added. The effect of these changes can be viewed by selecting the Preview Button. Part III: VFSMOD-W: WindowsTM User’s Manual 117 Once Plot editing is complete, the Plot can be Copied to the Clipboard. The Plot can then be inserted into another application such as a word processor. For example, the plot can be inserted in Word by Selecting Edit – Paste Special –Picture or Device Independent Bitmap. If you desire only the data used to create the plot, then use Paste. In Powerpoint, use Paste Special and Device Independent Bitmap. The plot is copied to the Clipboard as a Windows Metafile (wmf) for optimum resolution. The plot can also be printed by selecting the Print Plot button. The plot can be previewed along with selecting the printer, paper size and orientation. Part III: VFSMOD-W: WindowsTM User’s Manual 118 Part III: VFSMOD-W: WindowsTM User’s Manual 119 9. Calibration Mode Requirements Directory structure To run either the Hydrograph Calibration or the Sedigraph Calibration, a filter strip project and a set of measured field data (hydrograph or sedigraph) are required to run the calibration mode. The field data text files must be located in the ”inverse” folder within the application directory. This folder should not be deleted or modified by the user, except when new files with the series of measured data for hydrograph or sedigraph need to be added. The Matlab runtime component The inverse calibration procedure uses a Matlab runtime library to do the calculations. During the installation of VFSMOD-W, the Windows Installer Package automatically installs this library in the computer. For more information about this component, please visit the MathWorks website (www.mathworks.com). Administrative privileges might be required to install correctly the Matlab component in the PC. Please contact your computer administrator if you need help. Input files When the calibration option is performed, the user selects one o various model parameters in order to fit the simulated results using VFSMOD with a series of measured field data of water (hydrograph) or sediment (sedigraph). A range for each parameter selected must be specified to run the simulation. The description for both, the measured data file and the model calibration parameters to select are described in more detail below. Measured data The measured data text file contains three columns. The first column represents the time (in seconds), the second column contains the data of the outflow hydrograph (m3/s) or sedigraph (g/s) that the program will seek to match during the calibration procedure, and the third column gives a specific weight to each pair of data, depending on the importance of those specific data with respect to the rest (typically with a range of 0-1). It is important to make sure that these data are distributed in three columns, not in a single line. Part III: VFSMOD-W: WindowsTM User’s Manual 120 FIGURE 1. Fig. Input text file with data of time, hydrograph and the weight factor Calibration model parameters A total of ten parameters can be selected to calibrate the hydrograph. A range including the minimum and maximum values for each parameter search must be input. A description of those parameters is shown in the next table. Table. Parameters that can be used for the hydrograph calibration Parameter Vertical saturated conductivity Average suction wetting front Saturated water content Initial water content Maximum surface storage Filter fraction where ponding is checked Filter width Filter length Filter Manning’s roughness coefficient Average filter slope Units m/s m m3/m3 m3/m3 m m m s/m1/3 m/m Name VKS SAV OS OI SM SCHK FWIDTH VL RNA SOA On the other hand, nine parameter in total can be used to calibrate the sediments. Similarly to flow, the parameters for sediment calibration are shown below. Table. Parameters that can be used for the sedigraph calibration Part III: VFSMOD-W: WindowsTM User’s Manual 121 Parameter Spacing for grass steam Roughness – grass Manning’s coefficient Height of grass Roughness – bare surface Manning’s coefficient Coarse sediment fraction d>0.0037 cm Incoming Flow sediment concentration Porosity of deposited sediments Sediment particle class, diameter d50 Sediment particle density Unit cm s/cm1/3 cm s/cm1/3 g/ g g / cm3 % / 100 cm g / cm3 Name SS VN H VN2 COARSE CI POR DP SG Description of the calibration interface Once a project has been run, VFSMOD-W can search for the optimal model parameter(s) to match the simulated results and the field data measurements through the “calibration” menu option. The calibration menu includes “Hydrograph” and “Sedigraph”, however these options can not be run simultaneously. Before using this feature, make sure that that you have set correctly the information requested in the menu “Options”, as shown below (i.e. pointing to the root directory of the application, typically c:\vfsmod-w). FIGURE 2. Checking the root directory before running the calibration mode Part III: VFSMOD-W: WindowsTM User’s Manual 122 The recommended calibration procedure is to first calibrate the flow (hydrograph) component of the model , i.e. run menu item “Hydrograph” first, then modify the original project with the calibrated flow parameters, and then use the modified project to run the menu item “Sedigraph”. In this way, the balances for sediments will be related to the optimized water balances. FIGURE 3. Hydrograph and Sedigraph options within the calibration mode After the user has selected one option (i.e. “Hydrograph”), the program requests to select the name of the project to be run (it is located in the root directory of VFSMOD-W; i.e. c:\vfsmod-w\) and also the measured data file (hydrograph in this case). FIGURE 4. Opening a project file to run the calibration mode Part III: VFSMOD-W: WindowsTM User’s Manual 123 FIGURE 5. Selction of a project file to run the calibration mde FIGURE 6. Opening a field data file to run the calibration mode Part III: VFSMOD-W: WindowsTM User’s Manual 124 FIGURE 7. Selecting a field data file within the inverse forlder to run the hydrograph calibration Two additional buttons are provided associated to these files in each of these interfaces: Browse/Edit and Advanced settings. The Browse buttons are used to change the selected files. The Edit option is used to modify the field data (see section 11.2.a). FIGURE 8. Editing measured data (hydrograph) for calibration Part III: VFSMOD-W: WindowsTM User’s Manual 125 Once both files, project and measured data, are selected, the program displays an interface where the user selects the parameter(s) to calibrate. FIGURE 9. Interface for Hydrograph calibration At least one parameter needs to be selected to run the calibration. The interface lets the user to select three options for each (see last page) •No •Change •Calibrate By default, all the options are set to No. The Change option lets the user to select a different value of the parameter than that one used in the current project. The option Calibrate activates two dialog boxes: Min and Max. Those are used to define the range (minimum and maximum) for the parameter to be calibrated. If the user changes his/her mind about a selection, the option No can be chosen in order to run the calibration mode with the current values set in the original project (without a modification). The same steps depicted above are used for the “Sedigraph” option. Part III: VFSMOD-W: WindowsTM User’s Manual 126 FIGURE 10. Interface for Sedigraph calibration The Advanced settings options let the user to select three options: •Number of iterations •Show graph •Exit file name The number of iterations defines the value for “np” in the formula: iter=100*np2 (0 is set for automatic), where: Iter: Number of iterations to be done np: base value The graph option let the user to watch the graph that is generated during the calibration process. This graph is a representation of the current field data (hydrograph/sedigraph) and the results of the simulation with the data that have been selected for the calibration. Finally, the exit file name defines the name of the output file where the program will write the results of the calibration (this will be written in the ”inverse” directory). Part III: VFSMOD-W: WindowsTM User’s Manual 127 Advanced setting options for calibration FIGURE 11. Example of use of the calibration option In order to run the calibration option, let us select the hydraulic conductivity parameter with min = 0.0000001 m/s and max = 0.0005 m/s. When the Run button is clicked, two windows are displayed. The first one shows the current iteration that the program is running, and the other window (if selected) shows the graph for that iteration. Part III: VFSMOD-W: WindowsTM User’s Manual 128 FIGURE 12. Execution of the calibration Once the calibration finishes the program requests to click any key to continue. At this point, the output file has been written and it can be viewed by clicking the Calibration Results button on the main calibration window. FIGURE 13. Text and graphical results after the calibration is completed Part III: VFSMOD-W: WindowsTM User’s Manual 129 Description of the global calibration algorithm used The inverse simulation of the flow or sediment parameters is carried out by minimizing an objective function, OF b , that represents the error between measured and simulated values, such that it can be defined as a nonlinear least squares problem by: N OF b = wi Yo ti – Ys tt b 2 i=1 where the right-hand side represents the deviations between observed (Yo) and predicted (Ys) hydrographs (or sedigraphs) using parameter vector ; t is the time; N is the number of measurements available; and wi is the weight of a particular measurement, which denotes the measurement error and is set equal to s-2, where s is the standard deviation of the measured data (Lambot et al., 2002). To perform the inverse calibration of parameter vector , VFSMOD is coupled with the Global Multilevel Coordinate Search, GMCS, algorithm (Huyer and Neumaier, 1999). This algorithm combines global and local search capabilities with a multilevel approach. To refine the minimization of the objective function, the GMCS is combined sequentially with the Nelder-Mead Simplex (NMS) algorithm (Nelder and Mead, 1965) (Fig. 1). Further details about application of GMCS-NMS to inverse modeling of soil hydraulic properties are given in Lambot et al. (2002) and Ritter et al. (2003). The coefficient of efficiency Ceff (Nash and Sutcliffe, 1970) compares the variance about the 1:1 line (perfect agreement) to the variance of the observed data and it ranges from -8 to 1. Thereby Ceff = 1 implies that the plot of predicted vs. observed values matches the 1:1 line (Legates and McCabe, 1999). Only those data related to the parameters to be calibrated are shown in the final report. If more than one parameter is selected, the results will be shown as they are listed in the interface. For instance, if the vertical hydraulic conductivity and the filter width are selected for calibration, the first number displayed in “Estimated parameters [Global Search MCS]” and “Estimated parameters [Local Search NMS]” represents the calibrated value for the hydraulic conductivity, and the second one would represent the value for the filter width. The final report includes the parameter set with confidence limits estimated by the GMCS and the NMS, Information related to the optimization: covariance and correlation matrices, model adequacy, RMSE, Ceff, number of iterations of model execution, and total duration of the whole process is also displayed. Part III: VFSMOD-W: WindowsTM User’s Manual 130 FIGURE 14. Details of the calibration results as shown when the “Calibration Results” button is clicked Tips to run the calibration component For the Sedigraph option, based on the particle size distribution cumulative frequency graph (see next figure), the values of COARSE and DP (d=50) must meet the following requirements: •For COARSE = 0.5 then d50 > 0.0037 cm. See part (a) in next figure. •For COARSE = 0.5 then d50 < 0.0037 cm. See part (b) in next figure. Part III: VFSMOD-W: WindowsTM User’s Manual 131 FIGURE 15. Particle Size Distribution Cumulative Frequency Graph Please be sure to maintain these two parameters in the sediment module within these limits. For best results it is important that the vfsmod simulation length extends for at least the last time step given in the measured data file. If needed, the simulation length can be increased in the input rain file (.irn). Part III: VFSMOD-W: WindowsTM User’s Manual 132 10. Sensitivity Analysis Screens Sensitivity analysis can be done on a number of the input parameters for both the UH model and VFSMOD. Set the ones you would like to analyze and leave the others unchecked. For the UH model, sensitivity analysis can be done for Curve Number (CN), Soil Erodibility Factor (K), Crop Factor (C), and the Practice Factor (P). The user selects the parameters to consider using the Check boxes and enters the minimum, maximum and an increment for the parameter. The base value shown is the value in the base project files. These values are used in some of the analysis screens. In addition to setting the values, the user can load a different base project and once the inputs are set, do the simulations. If the user would like to also do the analysis for the VFSMOD parameters, they can switch to the VFSMOD screen. Part III: VFSMOD-W: WindowsTM User’s Manual 133 Similar to the UH screen, only selected parameters are available for sensitivity analysis. Currently, the parameters are the saturated vertical conductivity and initial water content for the Green Ampt infiltration submodel for the filter strip and the Dp (Particle Class diameter) and SS (Media Element Spacing) parameters. Selection of each parameter is done with the Check boxes and setting minimum and maximum values along with an increment for the sensitivity analysis. Once the simulations are complete, the user can do some analysis using the VFSMOD. Selected storm outputs are saved in files for each parameter selected. For example, if Curve Numbers are selected, then the suggested name for the output of the sensitivity parameters is: UHCNsens.sen. The format of this file is space separated that is easily imported into another analysis package such as spreadsheet. To import in a spreadsheet one selects space-separated data Part III: VFSMOD-W: WindowsTM User’s Manual 134 (treat multiple spaces as one). The first five lines denote general information on the parameter and the base project file. This information includes the parameter range, total rainfall for the event and the filter strip length along with the base project filenames. The tabular information presents the event level outputs and starts on the 7th line. Each line contains the results for one of the simulations. The columns are: retv – the return value for that simulation (0 indicates that simulation had no errors), CN – the curve number input, UHk – soil erodibility K input, UHc – crop factor input, UHp – practice factor input, isoks – the Green-Ampt saturated K input, aRoa - , isothetai – Green Ampt initial soil water content, and igrss – stem spacing input. Next the summary outputs for the storm are given. These include FldROmm and FldROm3 – the runoff from the source area (field) in mm and m3, VFSROmm and VFSROm3 – the runoff from the vegetative filter strip area in mm and m3, VFSinfm3 – the amount of infiltration in the vegetative filter strip in m3, FldSEDkg and FldSEDconc – the sediment from the source area (field) in kg and kg/L, VFSSEDkg and VFSSEDconc – the sediment lost from the vegetative filter strip in kg and kg/L, and SDR – the sediment delivery ratio (Mass Sediment from VFS/Mass Sediment from Field) and RDR – the runoff delivery ratio (Runoff from VFS/Runoff from Field). A separate file is written for each parameter. The user selects the Analysis option from the Sensitivity menu and selects the file to analyze. From this screen, selected storm outputs are available for analyses. Various plots of the outputs versus the inputs along with some statistics are available. For example, the Curve Number was varied from 76 to 95 and produced Source Runoff from 85 mm to 138 mm. Selecting Plot Selected Output produces: Part III: VFSMOD-W: WindowsTM User’s Manual 135 Other plotting and summary options include: Plot Selected Output (Absolute Sensitivity) This produces a plot of slope of the output versus the input (example Slope of Source Runoff versus CN) Plot Selected Output (Relative Base Sensitivity) This produces a plot of (Output – BaseOutput)/(Input – BaseInput) * (BaseInput/BaseOutput) versus the Input Plot Selected Output (Relative Sensitivity) This produces a plot of slope of the output versus the input times Input/Output versus the Input Output Sensitivity Results This produces an output file with all of the statistics. Here are examples for each of these. FIGURE 16. Plot Selected Output (Absolute Sensitivity) Part III: VFSMOD-W: WindowsTM User’s Manual 136 FIGURE 17. Plot Selected Output (Absolute Sensitivity) FIGURE 18. Plot Selected Output (Relative Base Sensitivity) FIGURE 19. Plot selected Output (Relative Sensitivity) Part III: VFSMOD-W: WindowsTM User’s Manual 137 Output Sensitivity Results This output file contains all of the analyses for each of the above graphs and the statistics. This is useful for further analyses using other application packages such as spreadsheets. Part III: VFSMOD-W: WindowsTM User’s Manual 138 11. Uncertainty Analysis Screens Uncertainty analysis can be done on a number of the input parameters for both the UH model and VFSMOD. These are done using base values from a specific UH and VFSMOD project. Select the input parameters you would like to analyze and leave the others unchecked. For each of the selected input parameters, select a probability distribution and specify the parameters to define the distribution. For the UH uncertainty analysis, Curve Number (CN), Soil Erodibility Factor (K), Crop Factor (C), and the Practice Factor (P) can be selected. The user selects the parameters to consider using the Check boxes and selects the probability distribution. Currently, the normal, log-normal, triangular, and uniform are available. After selecting the distribution, the Set Parameters button opens the window to enter the parameters defining the distribution. For the normal and log-normal distribution, the mean and standard deviation are entered. The peak and maximum and minimum values specify the triangular distribution. The minimum and maximum values determine the range for sampling the uniform distribution. If the user would like to also do the uncertainty analysis for the VFSMOD parameters, they can switch to the VFSMOD screen. , Similar to the UH uncertainty selection screen, only selected parameters are available for uncertainty analysis for VFSMOD. Currently, the parameters are the saturated vertical conductivity and initial water content for the Green Ampt infiltration submodel for the filter strip and the Dp (Particle Class diameter) and SS (Media Element Spacing) parameters. Selection of each parameter is done with the Check boxes and setting the distribution. Currently, the normal, log-normal, triangular, and uniform are available. After selecting the distribution, the Set Parameters button opens the window to enter the parameters defining the distribution. For the normal and log-normal distribution, the mean Part III: VFSMOD-W: WindowsTM User’s Manual 139 and standard deviation are entered. The peak and maximum and minimum values specify the triangular distribution. The minimum and maximum values determine the range for sampling the uniform distribution. On either of the screens, the number of simulations is also specified. These will typically range in the thousands, although the user can specify any number. On a Pentium III, 1 GHZ processor based desktop, each simulation takes from 10-15 seconds up to as much as 1 minute. Once the simulations are complete, the user can do some analysis using VFSMOD. Selected storm outputs are saved in the output file. The format of this file is spaceseparated and is easily imported into another analysis package such as spreadsheet. The first thirteen lines contain header and general information on the parameter and the base project file. This information includes the parameters and their probability distributions and the base rainfall and filter strip length along with the base project filenames. Lines 3 – 10 include the information on each input parameter, 0-7 indicating the parameter, selection of the probability distribution for sampling the inputs – the options are-1 = no uncertainty, 0 = normal, 1 = lognormal, 2 = triangular, or 3 = uniform, and the parameters to define the probability distribution as shown below. Distribution Distribution Parameters Number -1 0 1 Not Sampled Normal Lognormal Mean, Standard Deviation Log of Mean, and Log of the 2 3 Triangular Uniform Standard Deviation Peak, Minimum and Maximum Minimum and Maximum Part III: VFSMOD-W: WindowsTM User’s Manual 140 The tabular information presents the event level outputs and starts on the 14th line. Each line contains the results for one of the simulations. The columns are: retv – the return value for that simulation (0 indicates that simulation had no errors), CN – the curve number input, UHk – soil erodibility K input, UHc – crop factor input, UHp – practice factor input, isoks – the Green-Ampt saturated K input, aRoa - , isothetai – Green Ampt initial soil water content, and igrss – stem spacing input. Next the summary outputs for the storm are given. These include FldROmm and FldROm3 – the runoff from the source area (field) in mm and m3, VFSROmm and VFSROm3 – the runoff from the vegetative filter strip area in mm and m3, VFSinfm3 – the amount of infiltration in the vegetative filter strip in m3, FldSEDkg and FldSEDconc – the sediment from the source area (field) in kg and kg/L, VFSSEDkg and VFSSEDconc – the sediment lost from the vegetative filter strip in kg and kg/L, and SDR – the sediment delivery ratio (Mass Sediment from VFS/ Mass Sediment from Field) and RDR – the runoff delivery ratio (Runoff from VFS/Runoff from Field). In addition, the Analysis option for the Uncertainty section includes some analysis options for the data. These options include plots of the frequency distribution, and cumulative probability distributions. These can be done for each sampled input parameter and for any of the output parameters. Examples of the frequency and cumulative probability distributions for sampling the curve number are shown below. Part III: VFSMOD-W: WindowsTM User’s Manual 141 Examples of the graphs for the outputs are given for the sediment delivery ratio (SDR). Part III: VFSMOD-W: WindowsTM User’s Manual 142 12. Design Menu The design section of VFSMOD can be used to examine a range of storms and filter strip design parameters to assist in finding the optimum length for a given situation. A base UH and VFSMOD project is selected. The user can specify a range of storms for generating varying input runoff hydrographs and sediment loads. A range of filter strip lengths along with varying grass media spacing can be specified. Results can be seen in text format by pushing the View Results button. There is also an available option to show graphical results of RDR, SDR and PDR by selecting the View Graphical Results button. Part III: VFSMOD-W: WindowsTM User’s Manual 143 Each graph can be copied to the Clipboard and pasted as a table with the data or as an image in other applications such as spreadsheets, text processors, etc (See Using the Plot Window section). The output file from the design analysis simulations can easily be imported into a spreadsheet for more detailed analysis. The file format is comma-separated-variable (csv). Part III: VFSMOD-W: WindowsTM User’s Manual 144 13. Troubleshooting vfsmod-w As you encounter problems, you can e-mail us for help/assistance. In most cases, you should send us copies of the files giving problems along with a detailed description so we can recreate the problem. You can e-mail problems and any suggestions or questions via the web site:http:// abe.ufl.edu/carpena/vfsmod. You can also e-mail your problems directly to [email protected]. Current Issues/Hints/Problems and Workarounds (1) (2) (3) (4) (5) (6) (7) Download the zip file containing the VFSMOD package, vfsmod-w-install.zip to your temp directory and unzip into a subdirectory. After setup is complete, you can delete the subdirectory. You can delete the zip file, but you may want to keep this in case you need to re-install the program. During setup, you may receive a message that setup needs to update your system. If you receive this message, then allow setup to update your system. After setup updates your system, reboot and execute setup again. In Windows 98, the MSDOS command window that vfsm.exe and UH.exe executes within is not automatically closed. You should close this manually. On some systems, if you choose to install the package in drv:\Program Files, then the execution menu may not work correctly for UH and VFSMOD. We have seen this on Windows NT 4.0 systems. The default install directory is c:\vfsmod. To avoid this problem, we recommend you use this directory. If you have a previous version of vfsmod on your computer, you should uninstall prior to installing this version. With this version, on Windows NT, 2000, and XP, you will need Administrator privileges to install. A few system files are copied into the Windows System directories. Since the vfsm and uh executables are written in Fortran and run at the Command window level, all filenames should not contain any spaces. Spaces in the filenames will cause unpredictable results. For example, my Project.prj will cause problems. Use something like my_Project.prj, this should work fine. Part III: VFSMOD-W: WindowsTM User’s Manual 145 14. VFSMOD-W Change History 11/18/2000: 1.Added buttons in VFSMod Output Viewer for the remaining Output files: *.ohy, *.og1, *.og2 2.Made Nprop global and now the number of segments in the segment properties window updates when the user deletes and adds segments 2/5/2001: 1.The first level of the output filenames default to the same as the project name. The user can override this by changing the output filenames. 2.In the igr files, a check is made when the user changes the VL, buffer length. The new buffer length is checked against the segment properties. If these are unequal, a warning message box is displayed and the View/Edit Segment properties window is opened. 3/5/2003, vfsmod-w.exe – version 2.00; uh.exe – version 1.06; vfsm.exe – version 1.06 1.Major revisions for the entire system. Adding a number of buttons on pages to duplicate menu selections 2.Added Sensitivity Analysis 3.Added Uncertainty Analysis 4.Added Design Analysis 5/20/2003, Interim release: vfsmod-w.exe – version 2.20.xx; uh.exe – version 2.06; vfsm.exe – version 2.06 1.Enabled running uncertainty and sensitivity analyses on vfsm alone along with uh and vfsm 2.Changed a number of the menu headings to more verbose – self explanatory titles 3.Fixed a number of bugs when low runoff and/or sediment yields occur – many of these fixes are in vfsm and uh – see their change logs for details 7/31/2005, vfsmod-w.exe – version 3.00.xx, uh.exe – version 2.4.xx, vfsm.exe – version 2.4.xx 1. Numerous bug fixes and improvements have been made. 1/28/2007 – vfsmod-w.exe – version 4.1.xx. New release. 1.Release of version 4.1.0 of vfsmod-w •automatic inverse calibration engine •global sensitivity and uncertainty analysis modules for analysis with SIMLAB v2.2 Part III: VFSMOD-W: WindowsTM User’s Manual 146 •updated versions of the vfsm/uh programs •redesign many GUI input forms for consistency and ease of use •updated program built-in help file (with new calibration component redesign forms. 2.Revision v2.4.6 of uh.exe and vfsm.exe with a number of minor fixes - see the changes files with the source code distribution 7/15/2008 1.Minor release, version 4.1.1 of vfsm •The input runoff time series in the .iro file was not written properly by the GUI (number of lines was not refreshed). Fixed. •Some cosmetic changes and typos fixed. 10/15/2008 - vfsmod-w.exe – version 5.0.xx. New release. Water quality capabilities added 1.Major release, version 5.0.0 of vfsmod-w. A component for water quality is added. •New water quality module. •Only the option for calculating pesticides based on Sabbagh’s algorithms is included. •A generic pollutant simulation engine based on the Transport and Reaction Simulation Engine (TaRSE) is left prepared on the windows interfase to be included in future releases. 2.Some modifications to the Design option to include the new water quality capability. 06/2011- Changes in vfsm v4.x.x (WT) - Added new subroutine to solve the soil infiltration problem for unsteady rain in the presence of a shallow water table using a modified Green-Ampt infiltration model as proposed by Salvucci and Entekhabi (1995), Chu (1996) and work by the authors of this program. The method was extended to include mass balance on the surface as proposed by Skaggs (1982) and Khaleel (1982) in Hydrologic modeling of small watersheds, ASAE mon. no. 5, and Chu (1978, Water Resour. Res.). An extended soil input file (.iso) is required in this case. If an additional numeric parameter (WTD, water table depth, m) is found in the second line of the standard .iso file, then soil characteristic curve inputs are read (below the second line in .iso) and the new subroutine (gasubwt.f) is called. Notice that SAV and OI values are ignored. Details of the structure of the extended .iso input file are provided in the user manual, and sample files are also the distribution package (see sampleWT.prj). - New surface ponding forcing scheme (NPFORCE=1), when overland flow reached the check node NCHK (and zw>0, t<tw for the WT case) the infiltration is at capacity regardless of ponding or not from point excess calculation. Part III: VFSMOD-W: WindowsTM User’s Manual 147 05/2012- Changes in vfsm v4.2.0 (Pdegr) - New in-filter mass pesticide mass balance calculated at the end of the event. Prepared for integration in EU SWAN registration tool. - Degradation subroutine to calculate degradation of sediment bonded and mixing layer residue at the end of the event towards the beginning of the next event. It uses FOCUS equations that need daily surface soil temperature and moisture for every day betwwen two consecutive runoff events. - Daily eair temperature (i.e. PRZM files or other source) can be used as mixing and surface soil moisture. Moisture content can be estimated based on running mass balance. - For additional details see EU AIM and SWAN reports (http://abe.ufl.edu/carpena/ vfsmod/FOCUSreports.shtml). 08/2012 - Changes in vfsm v4.2.1 - Fixed minor bug for case when only lateral inflow is provided (no rain), like in some model testing laboratory scenarios (UCL, Belgium). Outflow hydrograph now ends in zero if sufficient time is provided). 08/2013- Changes in vfsm v4.2.3 - Fixed bug in duration of the simulation handling (IRN file). If the user did not add a double end line in the IRN (i.e. end of simulation) to the IRN file, the program now sets the end of the simulation to the longest of the field inflow (IRO file) or rain series (IRN file). 04/2014- Changes in vfsm v4.2.4 - Added error handling for no. of days in pest. degradation calculations (max 366, file IWQ), and steps in hydrograph (file IRO) and rainfall (file IRN) (max=200). - Added error handling when no incoming flow or sediment is provided in IRO or IRN files so that it does not produce NaN in output files. (02/2014) - Added additional cases for the water table scenarios (gasubwt.f) - Fixed calculation of pesticide degradation rate, Kref= Ln(2)/t_halflife (inputs.f) - Fixed unit conversion for gas constant in pesticide degradation equation (outmass.f) - Added a check for high sorption pesticides when all pesticide in filter is sedimentbonded (outmass.f) - Various static improvements in IWQ output file (outmass.f) Part III: VFSMOD-W: WindowsTM User’s Manual 148 Part III: VFSMOD-W: WindowsTM User’s Manual 149 Part IV: VFSMOD: Appendices 1. APPENDIX 1: Description of the model subroutines The source code is distributed with the model. This section is intended to be used with the source code, which contains more detailed documentation. 1.1 Program VFSMOD The main program is the driver for the program subroutines as discussed in the previous section. This is done on the following steps: (a) print banner, get I/O file names and open the files (b) initialize matrices (c) read inputs for sediment problem (d) get inputs and parameters for hydrology problem (e) get the Gauss quadrature parameters (f) assemble the system matrix [A] (g) perform LU decomposition over [A] (h) Start the time loop to solve the problem for each time step h-1. select the rainfall intensity and BC (transform into depth (m)) at the first node of system (incoming hydrograph) for each time step. h-2. get effective rainfall and control execution of overland flow for an infiltrating surface by calling Green-Ampt model. The assumption is that when a certain node (NCHK) is flooded, i.e. X(NCHK)>0, all the surface will be flooded, and thus the maximum infiltration capacity for the rest of the event is selected as given by the Green-Ampt model. NCHK is selected by the user. h-3. form of r.h.s vector for that time step h-4. start Picard iteration h-4.1. update {b} = {bm} h-4.2. feed the vector to the solver h-4.3. check for convergence h-4.4. update Xm = X m+1 h-4.5. find flow component at iteration step h-4.6. Picard iteration converges, proceed with time step, otherwise repeat h-6. update h and q for next time level h-7. do the following only 100 times, each time using the average flow of the last NWRITE values in between h-7.1. call sediment transport subroutine if there is inflow (change units from Q(m2/s) to QSED(cm2/s)) h-7.1. write outputs to files h-8. repeat time loop for next time step until the end of the run (i) write a summary of results at the end of the run (j) close files and end program Part IV: VFSMOD: Appendices 150 1.2 FINPUT(LISFIL) This subroutine writes the program banner, reads the name of the file set to be processed from the command line string, creates I/O file names accordingly, and opens I/O files. 1.3 INI(A,B,X,XM,X0,Q0,QM,SSE,NODEX) The main program matrices are set to zero before the beginning of the simulation. 1.4 GRASSIN(ICOARSE,COARSE,LISFIL) This subroutine reads in the main parameters of the sediment sub-model, calculates some of the additional parameters needed and echo this information into the output files. This is done in the following steps: (a) read parameters from the *.igr and *.isd input files (b) choose particle diameter (cm), fall velocity (cm/s) and particle density (g/cm3) from the internal data base or if the particle class is not in the database, calculate values using Fair and Geyer method (1954) based on Stokes (note: all units in SI) (c) if particle is fine(dp<37 mm) don't run the wedge part (COARSE=0.D0) (d) output some input values here and leave the rest for the INPUTS subroutine (e) print heading for tables in output files 1.5 INPUTS(N,NBAND,NRAIN,RAIN,NBCROFF,BCROFF,TE,QMAX ,VL, FWIDTH,PGPAR,VKS,NCHK,LISFIL) This subroutine reads in the main parameters of the overland flow and infiltration submodels, calculates some of the additional simulation parameters needed and echo this information into the output files. This is done in the following steps: (a) read parameters from the *.ikw input file, assign nodes to the X values for each surface segment and calculate elemental Manning’s a’s (b) calculate filter main slope, Sc and roughness for sediment calculations (c) check if N is compatible with type of shape function selected and if not print message (d) read rainfall distribution from *.irn (e) read soil inputs from *.iso and calculate Green-Ampt parameters (f) get downslope node for flood checking (SCHK) (g) read runoff inflow at upper side of strip (BC) in (m3/s) from *.iro (h) find the bandwidth for the matrix, number of elements and number of nodes (i) calculate convergence and wave form parameters (CR, C, FR, FK) (j) calculate the PG Parameters from the Courant number values (k) set the order of the integration rule (l) output parameters Part IV: VFSMOD: Appendices 151 l-2. output hydrological and numerical parameters l-1. output nodal information if selected (ielout=1) l-2. output values for sediment transport (read previously in GRASSIN) (m) issue a warning if any of the criteria (CR, FR, FK) is not met (n) print heading for tables in output files 1.6 QUAD Get the Gaussian Quadrature points for orders 1 through 5. 1.7 FORMA(A,NBAND,PGPAR) This subroutine assembles the system matrix [A] as a banded matrix. This procedure involves the calculation of element matrices EK (subroutine ELEM) and their accumulation in the banded system matrix [A] (subroutine ASSM). Finally we end up by plugging in the BC for the problem (subroutine BCA). 1.8 ELEM(EK,PGPAR) Form the element arrays EK: (a) first initialize the element arrays (b) begin integration point loop for the Gauss quadrature rule b-1. obtain shape function values b-2. get the value for each element of the array 1.9 SHAPE(XIS,PSI,DPSI,WF,PGPAR) Calculate the values of the weighting and basis functions PSI, and their derivatives DPSI with respect to the master element coordinates at a specified value of XIS. A typical element [x1,xk+1] consisting of k+1 nodes x1,..., xk+1 is always normalized into the master element [-1,1] by the transformation over a typical element [x1,xk+1], and there exist k+1 element shape functions PSI (each is a polynomial of degree k). The type of shape function used (linear, quadratic, modified quadratic and cubic) is selected according to NPOL 1.10 ASSM(A,EK,NBAND,NEL) This subroutine adds the EK's to the global matrix [A] Part IV: VFSMOD: Appendices 152 1.11 BCA(A,NBAND) Plug in first kind of BC (Dirichlet) in the system matrix [A] 1.12 FACTOR (A,N,NBAND) Perform the lower and upper decomposition (LUD) over the system matrix [A] and store the lower and upper triangular matrices on the old [A] matrix 1.13 GASUB(TIME,DT,L,R,RAIN,NEND,TRAI) This subroutine solves the infiltration problem for unsteady rainfall case using the GreenAmpt infiltration model. After ponding at the surface is detected the infiltration is allowed to reach its maximum potential for the rest of the run. The assumption here is that the incoming field runoff moving at the surface will supply enough water to sustain the maximum infiltration for that time step. This means that the effective rainfall fed into the kinematic wave equation (ie) will be in most cases a negative value. The procedure is as follows: (a) check if the end of runoff has been reached (b) check for surface ponding at beginning (yes, NPOND=1; no, NPOND=0) b-1. without surface ponding at the beginning of the period (NPOND=0) b-1.1. with ponding at the end of the period (Cu >0) b-1.2. no ponding at the end of the period (Cu <0) b-1.3. Find values at the limit of this rainfall period regardless of time step b-2. with surface ponding at the beginning of the period (NPOND=1) (c) return ie value to be used in that time step. 1.14 FORMB(B0,X0,Q0,N,BCRO,PGPAR) In this subroutine the right hand side part of the matrix equation (vector b) is assembled in the following steps: (a) find dx1 for integration rule (b) initialize vector {b} (c) begin vector formation element by element c-1. Initialize temporary vectors c-2. do integration point loop c-3. plug the element vector into the {b0} vector (d) Plug in the boundary condition b(1)=BCRO Part IV: VFSMOD: Appendices 153 1.15 MODIFY(QM,B,BCRO,PGPAR) In this subroutine the right hand side part of the equation (vector {b}) is assembled following the procedure discussed by Vieux et al (1990): (a) find dx1 for integration rule (b) begin vector formation element by element b-1. do integration point loop b-2. plug the element vector into the {b} vector (c) plug in the boundary condition b(1)=0 1.16 SOLVE(A,B,X,N,NBAND) Solve the LUD transformed matrix [A] using a backward and forward substitution with: [A] {X} = {b} since, [A]= [L].[U] then [L][U]{X} = [L]([U]{X})= [L]{Y}= {b} solving, [L]{Y}=b (forward substitution) [U]{X}=y (backward substitution) 1.17 CONVER(N,X,XM,MFLAG) This subroutine checks for convergence as: max X m + 1 – X m ------------------------------------------- 10 –8 max X m + 1 If there is convergence return MFLAG=1, otherwise MFLAG=0 1.18 UPDATE(N,X,X0) Refresh values of the X vector, this is: Xl = Xl+1 1.19 FLOW(N,XT,QT) Calculate the flow vector at each iteration or time step by using Manning’s equation. Part IV: VFSMOD: Appendices 154 1.20 GRASSED(TIME,N,QIN,NODEX,ICOARSE, COARSE) This subroutine is the driver for the sediment transport problem on grass filter strips. Notice that all units are CGS system (cm,g,s), including Manning's n, to follow the original method as described by the authors (Tollner et al., 1977; Barfield et. al, 1979; Hayes et. al, 1979, 1984; Wilson et al, 1981). For computational purposes the filter is divided into the following sections (notice the change in properties as sediment is deposited): A(t): top flat face of sediment wedge; B(t): downface of sediment wedge; C(t) & D(t): effective filter. The calculation procedure is as follows: (a) select flow and sediment load at filter entry. If strip was filled up in a previous step (NFUP=1), bypass sediment deposition calculations, add incoming and outgoing mass to totals and RETURN to main program. (b) calculate the hydraulic properties at points (1), (2), (3) the filter to be used later on (subroutine OCF) (c) solve Einstein's bed load transport equation to find the transport capacity (gs2) at the end of B(t) (subroutine EINSTEIN) (d) calculate shape of sediment wedge, sediment outflow, and trapping efficiency for the filter (subroutine STEP3) (e) position points (1), (2), (3) at system nodes so that flow rates can be read at those points at next time step (subroutine POINTS) (f) write outputs of sediment transport calculations. 1.21 OCF(NPLACE) This subroutine solves the hydraulic properties for each of the filter's singular points by using Manning's equation and open channel flow theory. It utilizes the method proposed by Barfield et. al (1979) where the known values are Ss (spacing of the filter media elements, cm), Sc (filter main slope), n (Manning's for cylindrical media, s/cm1/3), qk (unit overland flow rate at the given point k, cm2/s) and the unknowns are df (depth of flow at D(t), cm), Vm (depth averaged velocity at D(t), cm/s), Rs (hydraulic radius of the filter, cm). Notice that all units are in CGS system (cm,g,s), including Manning's n. The following steps are followed: (a) flow depth and velocity set to zero for no flow at any given point (b) otherwise, calculate Rs, Vm and df for the given point (c) the resulting equation is solved by the Newton-Raphson iterative method 1.22 EINSTEIN(GS2,NTRCAP,COARSE) This program solves Einstein's bed load transport equation to find the sediment transport capacity (gsd) at the end of C(t) by following the method proposed by Barfield et. al (1979), where known values are dp (particle size diameter, cm), Sc (filter main slope), Rs (hydraulic radius of the filter at D(t), cm), g, gs (water and sediment weight density, g/ cm3), g (acceleration due to gravity, 980 cm/s2), COARSE (% of particles from incoming sediment with diameter > 0.0037 cm, i.e. coarse fraction that will be routed through Part IV: VFSMOD: Appendices 155 wedge); and the unknown is gs2 (gsd) (sediment transport capacity or sediment load entering downstream section, g/s/cm). Notice that all units in CGS system (cm,g,s). The following steps are implemented: (a) check if the transport capacity is lower than concentration a-1. if lower deposition at the wedge occurs (first part of subroutine STEP3) a-2. if higher, there is enough energy to transport sediment through the wedge and no deposition occurs, all sediment is transported to the suspended sediment zone (zones C(t) and D(t)) (2nd part of subroutine STEP3) 1.23 STEP3(GS2,TIME,NTRCAP,COARSE) This program solves STEP3 of the sediment transport problem after Barfield et al. (1979) and Hayes et al. (1984). The outputs from this part of the problem are: f (sediment fraction trapped in the deposition wedge); X1(t), Y(t), X2(t) (sediment wedge geometry); DEP (depth of deposited sediment at lower section of the filter); Tr (sediment trapping efficiency). The procedure is as follows: (a) if sediment transport capacity (gs2) is greater than the fine sediment load fraction, gsim (diameter>0.0037cm) all sediment goes through the wedge to the lower part of the filter (ntrcap=1). (b) if transport capacity is lower than the fine sediment load fraction, then the FINE fraction goes through the wedge and the COARSE fraction is filtered at the wedge (c) apply open channel flow theory and Einstein’s bed load transport equation in B(t), find df, Rss, Se (Newton-Raphson method) (d) find advancement of sediment front and outflow concentration d-1. if top of vegetation has not been reached, calculate the triangular wedge geometry. d-2. trapezoidal wedge geometry (e) check if strip has been filled up. If so set flag NFUP=1, change sediment wedge geometry to a rectangle of hight H and length VL and bypass GRASSED in the future. Also, in this case avoid suspended sediment zone calculations. (f) on the assumption that the trapped sediment is uniformly distributed on the bed of the filter’s lower section area, calculate DEP, depth of sediment deposited for that Dt, and CDEP as a multiplier to reduce the actual sediment outflow, gso(Wilson et al. 1981). (g) write outputs (h) update values for next time step 1.24 POINTS(N,XPOINTS,NODEX,VBT) This program finds ak (in uniform flow equation), X1 (mid-point of downface of sediment wedge, cm), X2 (bottom point of downface of sediment wedge, cm), X3 (mid-point of effective filter length L(t), cm) and their associated NODEX(i) (nodes for the Xi points) to feed back to the overland flow submodel. The procedure is as follows: (a) find points for each of the areas in filter Part IV: VFSMOD: Appendices 156 (b) if required reshape the surface topography and roughness of the filter. Notice that for entry a 0 slope value is not possible, thus a minimum SCENTRY=0.005 is chosen. The new values assigned are: - Section A: slope=Sc, n=VN2 (bare) - Section B(t): slope=Set, n=VN2 , length VBT - Sections C(t) & D(t): slope= unchanged, n= unchanged, length VLT 1.25 KWWRITE(N,L,M,QTEMP,X,BCRO,FWIDTH) Write hydrology outputs to the *.ohy file as a hydrograph, i.e. flow rate at the downstream end of the plane. 1.26 OUTMASS(VL,FWIDTH,TRAI,LISFIL) This subroutine processes the output hydrograph and calculates the components of the water and sediment balance. The results are written to the summary file *.osm and *.osp. Part IV: VFSMOD: Appendices 157 2. APPENDIX 2: Model parameters and variables 2.1 Overland flow A(I,J) B(I) BCRO BCROFF(200,2) BCROFFQ C DPSI(I) DR DT DTC DX DR DX1 EK(I,J) EPS FK FR FWIDTH HMAX KNOISE MAXITER MFLAG N NBAND NDT NELEM NL NMAX NPOL PGPAR(I) PSI(I) QK(MAXEQN) QM(N) Q0(N) QMAX QOUT R RNA(I) SOA(I) SR SWIDTH Part IV: VFSMOD: Appendices system matrix, square of dimensions nxn, ie. [A] right hand side vector of dimensions 1xn , ie {b} time-interpolated water depth at the first node of the system (m) boundary condition at the upstream node: time (s) vs. depth (m). inflow hydrograph (m3/s) read from input file ROFFKW.IN celerity of the wave (m/s) derivative of the i-th shape (basis) function at XI duration of the simulation (s) increment of time (s) Courant time step for the numerical solution space step (m) duration of the rain (s) distance between nodes in element entry in element stiffness matrix convergence criteria (set to 10-8 in the program) kinematic flow number Froude number width of the strip (m) maximum flow depth at steady-state condition filter for numerical oscillation in FLOW subroutine maximum number of iterations alowed convergence flag (0, no convergence; 1, convergence) actual number of nodes in the domain bandwidth for the [A] matrix, number of time steps actual number of elements in the domain order of the integration rule over each element maximum number of equations and variables that can be solved number of nodal points over each element (polynomial degree +1) Petrov-Galerkin parameters (i=1,4) i-th shape function at XI nodal a in Manning's uniform flow equation flow vector at iteration m (cm2/s) flow vector at previous time step (m2/s). maximum flow rate at steady-state condition (cm2/s) input coming and out going flow (runoff) from filter (cm2/s) rainfall excess at the node (lateral inflow) (m/s) (RAIN(L,2)-FPI) Manning's roughness coefficient (s.m-1/3) slope of the element duration of the simulation (s) Source area width (m) 158 SLENGTH SX(I) TE THETAW VL VN1 W(5,5) WF(I) X(5,5) XI(5,5) XM(N) X0(N) Source area flow path length (m) Distance from origin to the start of the i-th surface segment (m) Henderson's time to equilibrium (s) time-weight factor Filter length (m) Mean filter Manning’s roughness coefficient (s.m-1/3) Gauss quadrature weights modified weighting functions solution vector, dimension 1xn, at time step l+1 Gauss quadrature point solution vector {xn}, at iteration m, time step l+1 solution vector{xn}, surface water depth h (m) at time step l 2.2 Infiltration AGA BGA CU DM F FPI L LO NCHK NEND NPOND NPFORCE OI OS PS PSOLD PST RAIN(200,2) RO SCHK RPEAK SAV SM STO TP, TPP TRAI VKS Part IV: VFSMOD: Appendices Green-Ampt's "A", saturated hydraulic conductivity, Ks (m/s) Green-Ampt's "B" = Ks*Sav*DM (m2/s) Chu's surface ponding indicator at end rain period (<0, ponded) initial soil-water deficit (DM=OS-OI) cumulative infiltration (m) cumulative infiltration when the end to ponding in reached (m) rainfall period index to show if time step is in the same rainfall period (LO=L) Node number for flood checking indicates that the end of field/source area runoff is reached (=1) surface ponding indicator at beginning rain period (1, ponded) overriding indicator to force maximum infiltration when overland flow is present (1, force infiltration capacity) initial soil-water content saturated soil-water content cumulative precipitation in m for time step. cumulative precipitation in m for last rainfall period. total cumulative precipitation in m. time (s) and rainfall rate (m/s) over the VFS for each period. cumulative excess rainfallat the node (without considering BCRO) relative distance from de upper filter edge where the check for ponding conditions is made (i.e. 1= end filter, 0.5= mid point, 0= beginning) Maximum rainfall intensity for the storm Green-Ampt’s average suction at wet front(m) maximum surface storage (m) cumulative surface storage (m) Chu's (1978) tp and tp' coefficients Total cumulative rainfal (m) Saturated hydraulic conductivity (m/s) 159 2.3 Sediment transport CDEP CI COARSE ICOARSE DF DEP DFS DP F FWID GAMMAW GAMMASB GSI GSSI GS2 GSO H NFUP NODEX(J) PART(1) PART(2) PART(3) POR QSED(J) RS RSS SE SS SC VLCM VM VMS VN VN2 XPOINTS(J) XT X1 YT Part IV: VFSMOD: Appendices Coefficient for reducing suspended sediment deposition in D(t) sediment inflow concentration (g/cm3) % of coarse particles (>37 microns) in incoming sediment. Flag, 0= all particles fine(<37 microns) don't run the wedge part. depth of flow at D(t) (cm) depth of sediment deposited in suspended sediment zone D(t) (cm) depth of flow at B(t) (cm) particle size, diameter (cm) fraction trapped in the deposition wedge width of the strip (cm)=FWIDTH/100 water weight density (g/cm3) sediment weight density (g/cm3) sediment load entering before field deposition, gsI: (g.s-1cm-1) sediment load entering the filter after field depos., gsi: (g.s-1cm-1) sediment load entering downstream section, gsd: (g.s-1cm-1) sediment load exiting the filter, gso: (g.s-1cm-1) filter media height (cm) Flag, 0=strip is not filled-up, 1=strip is filled-up node number for X1, X2, X3 points sediment class diameter (cm) sediment class fall velocity (cm/s) sediment class weight density (g/cm3) porosity of deposited sediment overland flow rate for X1, X2, X3 points (cm2/s) hydraulic radius of the filter (cm) hydraulic radius of the filter at B(t) (cm) equilibrium slope at B(t) spacing of the filter media elements (cm) filter main slope filter length in cm. depth averaged velocity at D(t)(cm/s) depth averaged velocity at B(t) (cm/s) filter media Manning's, n= 0.012 for cylindrical media (s.cm-1/3) Filter Manning's roughness coefficient for bare (sediment inundated) soil (s.cm-1/3) Position for the 3 locations where de flow is read from the hydrology model (q1, q2, q3) at the 3 last faces of the filter (cm) X2=XPOINTS(2) (cm), width of sediment wedge from field edge width of sediment wedge in the field (cm) height of sediment deposition wedge at the initial triangular stage 160 3. APPENDIX 3: Soils and Vegetation data 3.1 Soils data (Green-Ampt parameters) The model developers encorage the users to obtain the soil inputs for the model based on sail samples taken on site. If that is not possible or the model is applied to study the effect of soil type on the effectiveness of the VFS, the following table gives values for the Green-Ampt parameters as suggested by Rawls and Brakensiek (1983). Soil Texture (USDA) Clay Ks (m/s) x10-6 0.167a 0.306b Sandy-clay 0.333a 0.389b Clay-Loam 0.556a 1.194b Silty-Clay 0.278a 1.028b Silty-clay-loam 0.556a 1.583b Sandy-clay-loam 0.833a 3.139b Loam 3.67a 4.306b Silt-loam 1.89a 4.472b Sandy-loam 6.06a 13.93b Loamy-sand 16.6a 26.86b Sand a 65.4a 30.03b 3 3 Sav(m) Porosity s m m 0.0639-1.565a (0.3163)a 0.475(0.427-0.523)a 0.50b 0.0408-1.402a (0.2390)a 0.430(0.370-0.490)a 0.44b 0.0479-0.9110a (0.2088)a 0.464(0.409-0.519)a 0.48b 0.0613-1.394a (0.2922)a 0.479(0.425-0.533)a 0.52b 0.0567-1.315a (0.2730)a 0.471(0.418-0.524)a 0.51b 0.0442-1.080a (0.2185)a 0.398(0.332-0.464)a 0.43b 0.0133-0.5938a (0.0889)a 0.463(0.375-0.551)a 0.46b 0.0292-0.9539a (0.1668)a 0.501(0.420-0.582)a 0.48b 0.0267-0.4547a (0.1101)a 0.453(0.351-0.555)a 0.45b 0.0135-0.2794 (0.0613)a 0.437(0.363-0.506)a 0.46b 0.0097-0.2536a (0.0495)a 0.437(0.374-0.500)a 0.46b Rawls and Brakensiek (1983); b Saxton and Rawls (2006) assuming MO: 2.5% Note: Values in parenthesis are mean values. For an alternative source of Green-Ampt soil parameters see also McCuen et al. (1981). References for Table: McCuen, R. H., W. J. Rawls and D. L. Brakensiek. 1981. Statistical Analysis of the Brooks and Corey and the Green-Ampt parameters across soil textures. Water Resour. Res. 17(4):1005-1013. Part IV: VFSMOD: Appendices 161 Rawls, W.J. and D.L. Brakensiek. 1983. A procedure to predict Green-Apmt infiltration parameters. Adv. in Infiltration, pp. 102-112. ASAE Pub. no. 11-83. Sabbagh, G.J., G.A. Fox, A. Kamanzi, B. Roepke, and J.Z. Tang. Effectiveness of vegetative filter strips in reducing pesticide loading: Quantifying pesticide trapping efficiency. Journal of Environmental Quality 38(2): 38(2): 762-771 Saxton, K. E. and W. J. Rawls. 2006. Soil water characteristic estimates by texture and organic matter for hydrologic solutions. Soil Sci. Soc. Am. J. 70:1569–1578 3.2 Manning’s roughness coeficient, n There are several publications dedicated to the stimation of this important parameter for overland flow routing (see Arcement et al., 1989). A summary of the most common values used in overland flow routing can be taken from Engman (1986), as: Cover Manning’s n range (recommended) ms-1/3 Bare sand 0.01-0.013 (0.011) Bare clay-loam (eroded) 0.012-0.033 (0.02) Fallow - no residue) 0.006-0.16 (0.05) Range (natural) 0.01-0.32 (0.13) Range (clipped) 0.02-0.24 (0.10) Grass (bluegrass sod) 0.39-0.63 (0.45) Short grass prairie 0.10-0.20 (0.15) Dense grassa 0.17-0.30 (0.24) Bermuda grass 0.30-0.48 (0.41) aWeeping lovegrass, bluegrass, buffalo grass, blue gramm grass, native grass mix (OK), alfalfa, lespedeza Part IV: VFSMOD: Appendices 162 3.3 Vegetation types for VFS’s The following data on vegetation is taken from Haan et al. (1994). Vegetation (good stand)a Density (stems/m2) Grass spacing Ss (cm) Maximum height, H (cm) Modified n nm cm.s-1/3 VEGETATION TYPICALLY RECOMMENDED FOR VFS Yelow bluestem 2700 1.9 -- -- Tall fescue 3900 1.63 38 0.012 Blue gramma 3750 1.65 25 0.012 Ryegrass (perennial) 3900 1.63 18 0.012 Weeping lovegrass 3750 1.65 30 -- Bermudagrass 5400 1.35 25 0.016 -- -- 20 0.012 Centipedegrass 5400 1.35 15 0.016 Kentucky bluegrass 3750 1.65 20 0.012 Grass mixtureb 2150 2.15 18 0.012 Buffalograss 4300 1.5 13 0.012 Bahiagrass VEGETATION NOT RECOMMENDED FOR VFSc Alfalfa 1075 3.02 35 0.0084 Sericea lespedeza 650 3.92 40 0.0084 Common lespedeza 325 5.52 13 0.0084 Sudangrass 110 9.52 -- 0.0084 a. To convert densities for good stand to other stands, multiply the given densities by 1/3, 2/3, 1, 4/3 and 5/3 for poor, fair, good, very good and excellent covers b. Values vary depending on mixture. If a given grass type predominates, values for that species should be used. c. Values of Ss above 2.5 cm can cause scour and are not recommended. Part IV: VFSMOD: Appendices 163 3.4 NRCS (SCS) Curve Numbers Runoff curve numbers for urban areas1 (From USDA-NRCS; 210-VI-TR-55, 2nd Edition, June 1986, Table 2-2a) Cover Description Curve Numbers for hydrologic soil group Average percent impervious areaa A B C D Poor condition (grass cover < 50%) 68 79 86 89 Fair condition (grass cover 50% to 75%) 49 69 79 84 Good condition (grass cover > 75%) 39 61 74 80 98 98 98 98 Paved; curbs and storm sewers (excluding right-of-way) 98 98 98 98 Paved; open ditches (including right-of-way) 83 89 92 93 Gravel (including right-of-way) 76 85 89 91 Dirt (including right-of-way) 72 82 87 89 Natural desert landscaping (pervious areas only)c 63 77 85 88 Artificial desert landscaping (impervious weed barrier, desert shrub with l- to 2-inch sand or gravel mulch and basin borders) 96 96 96 96 Cover type and hydrologic condition Fully developed urban areas (vegetation established) Open space (lawns, parks, golf courses, cemeteries, etc.)b: Impervious areas: Paved parking lots, roofs, driveways, etc. (excluding right-of-way) Streets and roads: Western desert urban areas: Urban districts: Commercial and business 85 89 92 94 95 Industrial 72 81 88 91 93 1/8 acre or less (town houses) 65 77 85 90 92 1/4 acre 38 61 75 83 87 1/3 acre 30 57 72 81 86 1/2 acre 25 54 70 80 85 1 acre 20 51 68 79 84 Residential districts by average lot size: 1. Average runoff condition, Ia=0.2S. Part IV: VFSMOD: Appendices 164 Cover Description Cover type and hydrologic condition 2 acres Curve Numbers for hydrologic soil group Average percent impervious areaa A B C D 12 46 65 77 82 77 86 91 94 Developing urban areas Newly graded areas (pervious areas only, no vegetation)d. Idle lands (CN’s are determined using cover types similar to those in table 2-2c) a. areas are directly connected to the drainage system, impervious areas have a CN of 98, and pervious areas are considered b. c. d. Composite CN's to use for the design of temporary measures during grading and construction should be computed using figure 2-3 or 2-4 (TR55 document) based on the degree of development (impervious area percentage) and the CN's for the newly graded pervious areas. Description Final infiltration of Ks (mm/h) A minimum runoff potential (deep sands, loess) 8 to 12 B low runoff potential (shallow sands, loess) 4 to 8 C medium runoff potential (shallow sands or clayey soils) 1 to 4 D maximum runoff potential (vertisols, clyas, limiting layers) 0 to 1 Type Part IV: VFSMOD: Appendices 165 Runoff curve numbers for cultivated agricultural lands.1 (From USDA-NRCS; 210VI-TR-55, 2nd Edition, June 1986, Table 2-2b) Cover Description Treatmenta Cover Type Curve numbers for hydrologic soil group Hydrologic conditionb A B C D 77 86 91 94 Poor 76 85 90 93 Good 74 83 88 90 Poor 72 81 88 91 Good 67 78 85 89 Poor 71 80 87 90 Good 64 75 82 85 Poor 70 79 84 88 Good 65 75 82 86 Poor 69 78 83 87 Good 64 74 81 85 Poor 66 74 80 82 Good 62 71 78 81 Poor 65 713 79 81 Good 61 70 77 80 Poor 65 76 84 88 Good 63 75 83 87 Poor 64 75 83 86 Good 60 72 80 84 Poor 63 74 82 85 Good 61 73 81 84 Poor 62 73 81 84 Good 60 72 80 83 Poor 61 72 79 82 Good 59 70 78 81 Poor 60 71 78 81 Good 58 69 77 80 Poor 66 77 85 89 Good 58 72 81 85 Poor 64 75 83 85 Good 55 69 78 83 Poor 63 73 80 83 Good 51 67 76 80 Bare soil Fallow Crop residue cover (CR) Straight row (SR) SR + CR Contoured (C) Row crops C+CR Contoured & terraced (C&T) C&T+ CR SR SR + CR C Small grain C+CR C&T+ CR SR Close-seeded or broadcast legumes or rotation meadow C C&T 1. Average runoff condition, Ia=0.2S. Part IV: VFSMOD: Appendices 166 a. Crop residue cover applies only if residue is on at least 5% of the surface throughout the year. b. Hydraulic condition is based on combination factors that affect Infiltration and runoff, including (a) density and canopy of vegetative areas, (b) amount of year-round cover, (c) amount of grass or close-seeded legumes, (d) percent of residue cover on the land surface (good >= 20%), and (e) degree of surface roughness. Poor: Factors impair infiltration and tend to increase runoff. Good: Factors encourage average and better than average infiltration and tend to decrease runoff. Part IV: VFSMOD: Appendices 167 Runoff curve numbers for other agricultural lands.1 (Table 2-2c, From USDA-NRCS; 210-VI-TR-55, 2nd Edition, June 1986) Cover Description Cover Type Pasture, grassland, or range-continuous forage for grazinga Curve numbers for hydrologic soil group Hydrologic Condition A B C D Poor 68 79 86 89 Fair 49 69 79 84 Good 39 61 74 80 30 58 71 78 48 67 77 13 Fair 35 56 70 77 Good c30 48 65 73 Poor 57 73 82 86 Fair 43 65 76 82 Good 32 58 72 79 Poor 45 66 77 83 Fair 36 60 73 79 Good d30 55 70 77 59 74 82 86 Meadow-continuous grass, protected from grazing and generally mowed for hay. Brush-brush-weed-grass mixture with brush the major element.b Woods-grass combination (orchard or tree farm).d Woods.e Farmsteads-buildings, lanes, driveways, and surrounding lots. Poor a. Poor,- <50%) ground cover or heavily grazed with no mulch. Fair: 50 to 75% ground cover and not heavily grazed. Good: 75% ground cover and lightly or only occasionally grazed. b. Poor: <50% ground cover. Fair: 50 to 75% ground cover. Good: >75% ground cover. c. Actual curve number is less than 30; use CN = 30 for runoff computations. d. CN's shown were computed for areas with 50% woods and 50% grass (pasture) cover. Other combinations of conditions may be computed from the CN's for woods and pasture. e. Poor: Forest litter, small trees, and brush are destroyed by heavy grazing or regular burning. Fair: Woods are grazed but not burned, and some forest litter covers the soil. Good: Woods are protected from grazing, and litter and brush adequately cover the soil. 1. Average runoff condition, and Ia = 0.2S. Part IV: VFSMOD: Appendices 168 Runoff curve numbers for arid and semiarid rangelands1 (Table 2-2d, From USDA-NRCS; 210-VI-TR-55, 2nd Edition, June 1986) Cover Description Cover type Herbaceous-mixture of grass, weeds, and low-growing brush, with brush the minor element. aspen, mountain mahogany, bitter brush, maple, and other brush. Pinyon-juniper-pinyon, juniper, or both; grass understory. Sagebrush with grass understory. Desert shrub-major plants include saltbush, greasewood, creosotebush, blackbrush, bursage, palo verde, mesquite, and cactus. Curve numbers for hydrologic soil group Hydrologic Conditiona Ab B C D Poor 80 87 93 Fair 71 81 89 Good 62 74 85 Poor 66 74 79 Fair 48 57 63 Good 30 41 48 Poor 75 85 89 Fair 58 73 80 Good 41 61 71 Poor 67 80 85 Fair 51 63 70 Good 35 47 55 Poor 63 77 85 88 Fair 55 72 81 86 Good 49 68 79 84 a. Poor: <30% ground cover (litter, grass, and brush overstory); Fair: 30 to 70% ground cover; Good: >70% ground cover. b. Curve numbers for group A have been developed only for desert shrub. 1. Average runoff condition, and Ia=0.2S. For range in humid regions, use Table 2-2c Part IV: VFSMOD: Appendices 169 3.5 MUSLE Crop factor C Soil loss ratios (CFACT) to describe the effects of cropping management (From 1992 GLEAMS User Manual, Knisel et. al. 1992). No Cover, Crop Sequence, and manmagementa Spring Residueb Cover After Plantc LB % Soil loss ratiod for cropstage period and canopy covere F SB 1 2 3:80 90 96 4Lf % Corn after C, GS, G or COT In Meadowless Systems 1 Rdl, sprg TP 4500 - 31 55 48 38 - - 20 23 36 60 52 41 - 24 20 30 2 3400 3 2600 - 43 64 56 43 32 25 21 37 4 2000 - 51 68 60 45 33 26 22 47 HP - 44 65 53 38 - - 20 - 6 GP - 49 70 57 41 - 24 20 - 7 FP - 57 74 61 43 32 25 21 - 8 LP - 65 78 65 45 32 26 22 - HP - 66 74 65 47 - - 22 56g 10 GP - 67 75 66 47 - 27 23 62 11 FP - 68 76 67 48 35 27 - 69 12 LP - 69 77 68 49 35 - - 74 HP - 76 82 70 49 - - 22 - 14 GP - 77 83 71 50 - 27 23 - 15 FP - 78 85 72 51 35 27 - - 16 LP - 79 86 73 52 35 - - - 4500 - - 31 27 25 - - 18 26 18 3400 - - 36 32 30 - 22 18 30 19 2600 - - 43 36 32 29 24 19 37 20 2000 - - 51 43 36 31 24 20 47 4500 10 - 45 38 34 - - 20 23 22 3400 10 - 52 43 37 - 24 20 30 23 2600 5 - 57 48 40 32 25 21 37 24 2000 - - 61 51 42 33 26 22 47 6000 95 - 2 2 2 - - 2 14 6000 90 - 3 3 3 - - 3 14 27 4500 80 - 5 5 5 - - 5 15 28 3400 70 - 8 8 8 - 8 6 19 29 3400 60 - 12 12 12 12 9 8 23 30 3400 50 - 15 15 14 14 11 9 27 31 2600 40 - 21 20 18 17 13 11 30 32 2600 30 - 26 24 22 21 17 14 36 5 9 13 17 21 25 26 Rdl, fall TP RdR, sprg TP RdR, fall TP Wheeltrack pl, RdL, TPh Deep offset disk or plow No-till plant in crop residuei Part IV: VFSMOD: Appendices 170 No Cover, Crop Sequence, and manmagementa Spring Residueb Cover After Plantc LB % Soil loss ratiod for cropstage period and canopy covere F SB 1 2 3:80 90 96 4Lf % Chisel, shallow disk, or fld cult, as only tillage 33 70 - 8 8 7 - - 7 17 34 60 - 10 9 8 - - 8 17 35 50 - 13 11 10 - - 9 18 36 40 - 15 13 11 - - 10 19 37 30 - 18 15 13 - - 12 20 38 20 - 23 20 18 - - 16 21 70 - 9 8 7 - - 7 18 40 60 - 12 10 9 - - 8 18 41 50 - 14 13 11 - - 9 19 42 40 - 17 15 13 - - 10 20 43 30 - 21 18 15 - - 13 21 44 20 - 25 22 19 - - 16 22 60 - 13 11 10 - 10 8 20 46 50 - 16 13 12 - 12 9 24 47 40 - 19 17 16 - 14 11 25 48 30 - 23 21 19 - 17 14 26 49 20 - 29 25 23 - 21 16 27 50 10 - 36 32 29 - 24 20 30 50 - 17 16 15 15 13 10 29 52 40 - 21 20 19 19 15 12 30 53 30 - 25 23 22 22 18 14 32 54 20 - 32 29 28 27 22 17 34 55 10 - 41 36 34 32 25 21 37 40 - 23 21 20 20 15 12 37 57 30 - 27 25 24 23 19 15 39 58 20 - 35 32 30 28 22 18 42 59 10 - 46 42 38 33 26 22 47 - - 1.3 1.3 1.1 1.0 1.0 1.0 1.0 39 45 51 56 60 On moderate Slopes On moderate slopes Do. Do. Do. On slopes>12%, lines 3359 times factor of: 6000 4500 3400 2600 2000 - Disk or harrow after spring chisel or field cultivation: lines 33-59 times: 61 On moderate slopes - - - 1.1 1.1 1.1 1.0 1.0 1.0 1.1 62 On slopes> 12% - - - 1.4 1.4 1.2 1.0 1.0 1.0 1.0 - 0.7 0.7 0.7 0.7 0.7 0.7 0.7 Ridge Plantj: lines 33-59 times factor of: 63 Rows on contourk Part IV: VFSMOD: Appendices - - 171 No Cover, Crop Sequence, and manmagementa Spring Residueb Cover After Plantc LB % Soil loss ratiod for cropstage period and canopy covere F SB 1 2 3:80 90 96 4Lf % 64 Rows U/D Slope<12% - - - 0.7 0.7 1.0 1.0 1.0 1.0 1.0 65 Rows U/D Slope>12% - - - 0.9 0.9 1.0 1.0 1.0 1.0 1.0 Till Plant: limes 33-59 times factor of: 66 Rows on contour - - - 0.7 0.85 1.0 1.0 1.0 1.0 1.0 66 Rows U/D slope<7% - - - 1.0 1.0 1.0 1.0 1.0 1.0 1.0 4500 60l - 12 10 9 --- --- 8 23 69 3400 50 - 16 14 12 --- 11 19 27 70 2600 40 - 22 19 17 17 14 12 30 71 2000 30 - 27 23 21 20 16 13 36 4500 60 - 16 13 11 - - 9 23 73 3400 50 - 20 17 14 - 12 11 27 74 2600 40 - 26 22 19 17 14 12 30 75 2000 30 - 31 26 21 20 16 13 36 3400 40 - 13 12 11 - - 11 22 77 3400 30 - 16 15 14 14 13 12 26 78 2600 20 - 21 19 19 19 16 14 34 m Strip Till 0.25 of row spacing: 68 72 Rows on contour Rows U/D Slope Vari-Till: 76 Rows on Contour Corn after WC of ryegrass or wheat stubble. WC reaches stemming stage 79 No-till pl in killed WC 4000 - - 7 7 7 - 7 6 80 3000 - - 11 11 11 11 9 7 81 2000 - - 15 15 14 14 11 9 82 1500 - - 20 19 18 18 14 11 4000 - - 13 12 11 - 11 9 84 3000 - - 18 17 16 16 13 10 85 2000 - - 23 22 20 19 15 12 86 1500 - - 28 26 24 22 17 14 4000 - - 10 10 10 - 10 8 88 3000 - - 15 15 15 15 12 9 89 2000 - - 20 20 19 19 15 12 90 1500 - - 25 24 23 22 17 14 4000 - 36 60 52 41 - 24 20 92 3000 - 43 64 56 43 31 25 21 93 2000 - 51 68 50 45 33 26 22 94 1500 - 61 73 64 47 35 27 23 Strip till 0.25 space 83 87 91 Rows U/D slope Rows on contour Tp, conv. seedbed Part IV: VFSMOD: Appendices 172 No Cover, Crop Sequence, and manmagementa Spring Residueb Cover After Plantc LB % Soil loss ratiod for cropstage period and canopy covere F SB 1 2 3:80 90 96 4Lf % WC succulent blades 95 3000 - - 11 11 17 23 18 16 96 2000 - - 15 15 20 25 20 17 97 1500 - - 20 20 23 26 21 18 98 1000 - - 26 26 27 27 22 19 3000 - - 18 18 21 25 20 17 100 2000 - - 21 21 25 27 21 18 101 1500 - - 28 28 28 28 22 19 102 1000 - - 33 33 31 29 23 20 99 No-till pl in killed WC Strip till 0.25 row sp CORN in Sodbased systems No-till pl in killed sod: 103 3-5 tons hay yld - - - 1 1 1 - 1 1 1 104 1-2 tons hay yld - - - 2 2 2 2 2 2 2 Strip till, 3-5 ton hay 105 50% cover, till strips - - - 2 2 2 - 2 2 4 106 20% cover, till strips - - - 3 3 3 - 3 3 5 Strip till, 1-2 ton hay 107 40% cover, till strips - - - 4 4 4 4 4 4 4 108 20% cover, till strips - - - 5 5 5 5 5 5 5 Other tillage after sod: n CORN after Soybeans 109 HP - 40 72 60 48 - - 25 29 110 GP - 47 78 65 51 - 30 25 37 111 FP - 56 83 70 54 40 31 26 44 HP - 47 75 60 48 - - 25 - 113 GP - 53 81 65 51 - 30 25 - 114 FP - 62 86 70 54 40 31 26 - HP 30o - 40 35 29 - - 23 29 116 GP 25 - 45 39 33 - 27 23 37 117 GP 20 - 51 44 39 34 27 23 37 118 FP 15 - 58 51 44 36 28 23 44 119 LP 10 - 67 59 48 36 28 23 54 HP 40 - 25 20 19 - 14 11 26 121 GP 30 - 33 29 25 22 18 14 33 122 FP 20 - 44 38 32 27 23 18 40 112 115 120 Sprg TP, conv till Fall TP, conv till Fall & Sprg chisel or cult No-till pl in crop resid. Part IV: VFSMOD: Appendices 173 No Cover, Crop Sequence, and manmagementa Spring Residueb Cover After Plantc LB % Soil loss ratiod for cropstage period and canopy covere F SB 1 2 3:80 90 96 4Lf p % BEANS after Corn 123 HP - 33 60 52 38 - 20 17 124 GP - 39 64 53 41 - 21 18 125 FP - 45 68 60 43 29 22 - HP - 45 69 57 38 - 20 17 127 GP - 52 73 61 41 - 21 18 128 FP - 59 77 65 43 29 22 - 126 Sprng Tp, Rdl, conv till Fall Tp, Rdl, conv till Chisel or fld cult: q Beans after Beans r GRAIN after C, G, GS, COTs 129 In disked residues 4500 70 - 12 12 11 7 4 2 3400 60 - 16 14 12 7 4 2 131 50 - 22 18 14 8 5 3 132 40 - 27 21 16 9 5 3 133 30 - 32 35 18 9 6 3 134 20 - 38 30 21 10 6 3 40 - 29 24 19 9 6 3 136 20 - 43 34 21 11 7 4 137 10 - 52 39 27 12 7 4 30 - 38 30 21 11 7 4 139 20 - 46 36 26 12 7 4 140 10 - 56 43 30 13 8 5 130 135 138 Do. Do. 2600 2000 141 In disked stubble, Rdr - - - 79 62 42 17 11 6 142 Winter G after fall TP, RDL HP - 31 55 48 31 12 7 5 143 GP - 36 60 52 33 13 8 5 144 FP - 43 64 56 36 14 9 5 145 LP - 53 68 60 38 15 10 6 200 10 - 70 55 43 18 13 11 147 500 30 - 43 34 23 13 10 8 148 750 40 - 34 27 18 10 7 7 149 1000 50 - 26 21 15 8 7 6 150 1500 60 - 20 15 12 7 5 5 151 2000 70 - 14 11 9 7 5 5 t Grain after Summer Fallow 146 With grain residues Part IV: VFSMOD: Appendices u 174 Cover, Crop Sequence, and manmagementa No 152 With row crop residues Spring Residueb Cover After Plantc LB % Soil loss ratiod for cropstage period and canopy covere F SB 1 2 3:80 90 96 4Lf % 300 5 - 82 65 44 19 14 12 153 500 15 - 62 49 35 17 13 11 154 750 23 - 50 40 29 14 11 9 155 1000 30 - 40 31 24 13 10 8 156 1500 45 - 31 24 18 10 8 7 157 2000 55 - 23 19 14 8 7 5 158 2500 65 - 17 14 12 7 5 4 - - 43 64 56 36 26 19 16 64 28 18 13 10 8 POTATOES 159 Rows with slope Contoured rows, ridged when canopy cover is about 160 10% - - 43 a. Symbols: B, soybeans; C, corn; conv till, plow, disk and harrow for seedbed; cot, cotton; F, rough fallow; fld cult, field cultivator; G, small grain; GS, grain sorghum; M, grass and legume meadow, at least 1 full year; pl, plant; RdL, crop residues left on field; RdR, crop residues removed; SB, seedbed period; sprg, spring; TP, plowed with moldboard; WC, winter cover crop; ---, insignificant or an unlikely combination of variables. b. Dry weight per acre after winter loss and reductions by grazing or partial removal; 4500 lbs represents 100 to 125 bu corn; 3400 lbs, 75 to 99 bu; 2600 lbs, 60 to 74 bu; and 2000 lbs, 40 to 59 bu; with normal 30-percent winter loss. For RdR or fall-plow practices, these four productivity levels are indicated by HP, GP, FP, and LP, respectively (high, good, fair, and low productivity). In lines 79 to 102, this column indicates dry weigth of the winter-cover crop. c. Percentage of soil surface covered by plant residue mulch after crop seeding. The difference betweenn spring residue and that on the surface after crop seeding is reflected in the soil loss ratios as residues mixed with the topsoil. d. The soil loss ratios, given as percentages, assume that the indicated crop sequence and practices are followed consistently. One-year deviations from normal practices do not have the effect of a permanent change. Linear interpolation between lines is recommended when justified by field conditions. See also footnote 7. e. Cropstage periods are as defined on p. 18, Agriculture Handbook 537. The three columns for cropstage 3 are for 80, 90, and 96 to 100 percent canopy cover at maturity. f. Column 4L is for all residues left on field. Corn stalks partially standing as left by some mechn\anical pickers. If stalks are shredded and spread by picker, select ratio from Table ?. When residues are reduced by grazing, take ratio from lower spring-residue line. g. Period 4 values in lines 9-12 are for corn stubble (stover removed). h. Inversion plowed, no secondary tillage. For this practice, residues must be left and incorporated. i. Soil surface and chopped residues for matured preceding crop undisturbed except in narrow slots in which seeds are planted. j. Top of old row ridge sliced off, throwing residues and some soil into furrow areas. Reridging assumed to occur near end of cropstage 1. k. Where lower soil loss ratios are listed for rows on the contour, this reduction is in addition to the standard field contouring credit. The P value for contouring is used with these reduced loss ratios. l. Field-average percent cover; probably about three-fourths of percent cover on undisturbed strips. m. If again seeded to WC crop in corn stubble, evaluate winter period as a winter grain seeding (lines 132-148). Otherwise, see table E-9. n. Select the appropriate line for the crop, tillage, and productivity level and multiply the listed soil loss ratios by sod residual factors from table E-10. o. Spring residue may include carryover from prior corn crop. p. See table E-9. q. Use values from lines 33-62 with appropriate dates and lengths of cropstage periods for beans in the locality. r. Values in lines 109-122 are best available estimates, but planting dates and lengths of cropstages may differ. s. When meadow is seeded with the grain, its effect will be reflected through higher percentages of cover in cropstages 3 and 4. t. Ratio depends on percent cover. See table E-9. Part IV: VFSMOD: Appendices 175 u. See item 12, table E-8. 3.6 Contour factor (P) values for MUSLE equation in UH Contour factors (P Factor) (from Wischmeier and Smith, 1978). Land Slope (%) Contour Factor (FPACT) 1-2 Maximum Length (ft) (m) 0.6 400 122 3-5 0.5 300 91 6-8 0.5 200 61 9 - 12 0.6 120 36 13 - 16 0.7 80 24 17 - 20 0.8 60 18 21 - 25 0.9 50 15 3.7 References for Soils and Vegetation data References for the above Tables are: Knisel, Walter G., F. M. Davis, R. A. Leonard. 1992. GLEAMS Version 210: Users Manual. Pre-Publication Copy. US Department of Agriculture, Agricultural Research Service, Available from University of Georgia, Coastal Plain Experiment Station, Bio. and Ag. Engineering, Tifton, GA. UGA-CPES-BAED Publication No. 5. 259 pp. McCuen, R. H., W. J. Rawls and D. L. Brakensiek. 1981. Statistical Analysis of the Brooks and Corey and the Green-Ampt parameters across soil textures. Water Resour. Res. 17(4):1005-1013. Rawls, W.J. and D.L. Brakensiek. 1983. A procedure to predict Green-Apmt infiltration parameters. Adv. in Infiltration, pp. 102-112. ASAE Pub. no. 11-83. U.S. NRCS (Formerly Soil Conservation Service), National Engineering Handbook, Hydrology, Section 4 (1972) and USDA ARS 41-172 (1970). USDA-NRCS; 210-VI-TR-55, 2nd Edition, June 1986. Wischmeirer, W. H. and D. D. Smith. 1978. Predicting rainfall erosion losses - a guide to conservation planning. Agriculture Handbook No. 537, USDA, Washington, DC, 58 pp. Part IV: VFSMOD: Appendices 176