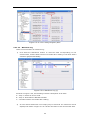
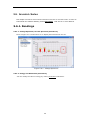
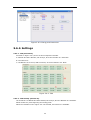
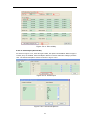
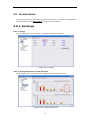
1
Acuview User’s Guide March 31, 2014 Accuenergy Corporation Contents 1. Welcome to Acuview ...........................................................................................2 2. Copyright ..........................................................................................................3 3. Getting Started ..................................................................................................4 4. 5. 3.1. New Connection ......................................................................................4 3.2. Connection Settings ................................................................................4 3.3. Add New Device ......................................................................................5 3.4. Connection .............................................................................................5 3.5. Getting Help ...........................................................................................6 User Interface ...................................................................................................7 4.1. Main Window ..........................................................................................7 4.2. Main Menu .............................................................................................7 4.3. Toolbar ..................................................................................................8 Functions ........................................................................................................ 10 5.1. Basic Monitoring ................................................................................... 10 5.2. Device Management .............................................................................. 10 5.3. Data Logging ........................................................................................ 11 5.4. Import/Export Device Profile .................................................................. 17 5.5. Acuvim-X Series ................................................................................... 19 5.6. 5.7. 5.8. 5.5.1. Readings ..................................................................................... 20 5.5.2. Settings ...................................................................................... 27 Acuvim-L Series .................................................................................... 29 5.6.1. Readings ..................................................................................... 29 5.6.2. Settings ...................................................................................... 30 Acuvim II Series ................................................................................... 32 5.7.1. Readings ..................................................................................... 32 5.7.2. Settings ...................................................................................... 36 Acuvim Series....................................................................................... 43 5.8.1. Readings ..................................................................................... 43 5.8.2. Settings ...................................................................................... 44 6. Troubleshooting ............................................................................................... 45 7. Installation ...................................................................................................... 46 7.1. Installing ............................................................................................. 46 7.2. Uninstalling .......................................................................................... 46 7.3. System Requirements ............................................................................ 46 1. Welcome to Acuview Developed by Accuenergy Corporation, Acuview software is designed for the Acuvim-X, Acuvim-L, Acuvim II, Acuvim and AcuDC 200 series power meters. Acuview software provides user-friendly real-time monitoring and data logging features for energy saving and power quality analysis. The purpose of this software is to provide a tool for users to monitor multiple parameters continuously and it allows users to monitor and maintain the meter on a real-time basis. For technical support or further information, please contact us at Accuenergy Corporation North American Toll Free: 1-877-721-8908 Fax: 416-497-4130 Web: www.accuenergy.com Email: [email protected] 2 2. Copyright All rights are reserved to Accuenergy Corp. Any change, translation, reverse engineering, de-compilation, disassembling or other equivalent methods in order to get the source code of this software without the written permission from Accuenergy Corp. are forbidden. Please read the license agreement in the software package carefully before you install or use it. Proceed should you agree with the terms of the license agreement. This software is protected by copyright laws in USA and other countries, and international treaty provisions. 3 3. Getting Started 3.1. New Connection A connection is required before communicating with the meter. To add a new connection, do one of the following: 1) Click Settings > Connection Manager. or 2) Click the icon . The Connection Manager is shown as Figure 3.1. Figure 3.1. Connection Manager New: Add a new connection. Delete: Delete the selected connection. Edit: Edit the selected connection settings. Close: Close the window. Status: 'Available' means Com Port or Ethernet is active, and 'Not Available' means Com Port or Ethernet is inactive. If the status is blank, it means that Com Port or Ethernet has not been established. 3.2. Connection Settings Set the connection parameters. The New Connection box is shown as Figure 3.2. 4 Figure 3.2. New Connection Name: Give connection a name. Type: Select Serial Port for RS485; Select Network for Modbus TCP gateway (for example, Acuvim II + AXM-NET). Com Port: Select the serial port that the RS485 connection is using. Baud Rate: Should match the baud rate in the meter settings. Scan Interval: Used to adjust the time interval between two messages (200ms or 500ms is recommended). 3.3. Add New Device After performing steps 1 and 2, you need to add a device to communicate with. To add a new device, do one of the following: 1) Click Operation > Add Device. or 2) Click the icon . The Add Device box is shown as Figure 3.3. Figure 3.3. Add Device Device Type: The model of the device you are going to communicate with. Connection: Select a connection for the communication. Device Address: Should match the address in the meter settings. Description: Device description such as where the device is used, for example, “Building 1”. 3.4. Connection You can read all the measurement data after you successfully complete Step 3. To connect, do one of the following: 1) Click Operation > Connect. or 2) Click the icon . or 3) Press F9 on keyboard. 5 Notice: If you cannot start communication normally, please make sure the physical connection of the device is correct and the communication setting parameters are properly configured. 3.5. Getting Help For more information, do one of the following: 1) Click Help > Help. or 2) Click the icon . 6 4. User Interface 4.1. Main Window Figure 4.1. Main Window The main window includes a menu bar, a toolbar, a workspace and a status bar. The workspace displays meter windows. The status bar displays messages. As shown in Figure 4.1, the following includes a description of all items: A -- Menu bar B -- Toolbar C -- Window title: Displays connection, device address, device description, connection status, etc D -- Explorer bar: Allows for quick browsing of the meter functions. E -- Data area: Displays data related to meter functions or available operations for user to perform. F -- Communication: Displays sent/received messages and indicates communication errors (which means the number of faulty devices) in the monitoring state. 4.2. Main Menu The Main menu includes Operation, Settings, Tools, Window and Help. 4.2.1. Operation 7 Connect: Connect to the device, read data and allow write command. Disconnect: Disconnect the device, stop data reading and disallow write command. Start Data Logging: Record data at the set logging interval. Stop Data Logging: Stop recording. Add Device: Add a new device that is going to be connected. Delete Current Device: Delete current active device. If multiple windows are tiled, it deletes the device of the top window. Exit: Quit the application. 4.2.2. Settings Connection Manager: Manage connections and edit connection parameters. Data Log Settings: Check and set data logging parameters of each device that is going to be monitored. Options: Check and set some of the advanced options. Device Manager: Show the detailed communication status. Device Properties: Modify device description while connected; modify device address while disconnected. Explorer Bar: Show or hide the explorer bar. Text Size: Set text size of the data area. 4.2.3. Tools Import Device Profile: Load the settings into the current active device window from an existing device profile. Export Device Profile: The device profile of the current active device window can be saved as a file. Import and Update Device: Load and send all settings in the current active device window to the meter. Find Device: Search on-line for meters in LAN. 4.2.4. Window Tile Horizontally: Rearrange all windows in the tile horizontally. Tile Vertically: Rearrange all windows in the tile vertically. Cascade: Rearrange all windows in a cascade. Minimize All: Minimize all windows. 4.2.5. Help Help: Display help document. About: Display the software version and copyright information. 4.3. Toolbar Connect: Connect device, read data and allow write command. 8 Disconnect: Disconnect device, stop data reading and disallow write command. Start Data Logging: Record data at the set logging interval. Stop Data Logging: Stop recording. Add Device: Add a new device that is going to be connected. Delete Current Device: Delete current active device. If multiple windows are tiled, it deletes the device of the top window. Connection Manager: Manage connections and edit connection parameters. Data log Settings: Check and set data logging parameters of each device that is going to be monitored. Options: Check and set some of the advanced options. Device Manager: Show the detailed communication status. Device Properties: Modify device description while connected; modify device address while disconnected. Text Size: Set text size of data area. Tile Horizontally: Rearrange all windows in the tile horizontally. Tile Vertically: Rearrange all windows in the tile vertically. Cascade: Rearrange all windows in a cascade. Minimize All: Minimize all windows. Explorer Bar: Show or hide the explorer bar. Help: Display help document. 9 5. Functions 5.1. Basic Monitoring 5.1.1. Add new connection. Refer to the New Connection section. 5.1.2. Set connection parameters. Refer to the Connection Settings section. 5.1.3. Add device window. Refer to the Add New Device section. 5.1.4. Connect. Refer to the Connection section. 5.1.5. Click the node in menu tree on the left side to view the measured values. The content displayed in the device window may be different according to different device types. 5.1.6. Click Disconnect menu or icon to stop. 5.2. Device Management 5.2.1. Add a new device. Refer to the Add New Device section. 5.2.2. If there is an unused device window, select it and click Device Properties menu or icon to make the device status ‘available’. 5.2.3. If a window is no longer needed, click Delete Current Device menu or icon. 5.2.4. Device Manager 1) Click Settings > Device Manager. or 2) Click the icon . The Device Manager box is shown as Figure 5.3. 10 Figure 5.3. Device Manager Device List: Displays all available devices. Every listed item displays its detailed communication status. Device Total: The total number of devices. Com Normal Total: The total number of devices which communicate normally. Com Failure Total: The total number of devices which fail the communication. Log Enabled Total: The total number of devices whose real-time data logging state is enabled. Log Failure Total: The total number of devices whose real-time data logging state fail last time. Reset Counters: Reset the communication counter for all devices. Properties: Modify the properties of selected device in device list. Double-click the selected item can also modify device properties. Select Window: Activate the corresponding window of selected item in device list. Close: Close the dialog. 5.3. Data Logging 5.3.1. Data Logging Settings 11 You must set data log before you use this function. To set it, do one of the following: 1) Click Settings > Data Log Settings. or 2) Click the icon . The Data Log Settings box is shown as Figure 5.4. Figure 5.4. Data Log Settings Device List: Displays all available devices which are working in data logging mode. It also can enable or disable data logging of any device. Every listed item displays the monitoring parameters of corresponding device. Logging Items of Selection: You can select one or more valid logging items. Logging Options: Select a listed item and then set monitoring parameters. This option includes 5 aspects about the data logging, which are introduced as the following: 12 1) Logging Data Interval: Setting the data logging interval indicates how often the software will store monitoring results. It contains two formats, which are minutes and seconds. 2) Log data until file full: The maximum row number of data logging per log file is 64800. When the maximum number of records is reached, a new log file will be created. 3) Specify log file duration:Set time for when to create a new log file. When the time is reached, a new log file will be created. 4) Log file format:Set the format of a log file. It can be .txt or .csv or .xls. (Text file format is recommended.) 5) Column Display Name:Set the name of column when monitoring the Pulse Input and the Analog Input items in the data log file. It can be name or name(unit). Log file name: For users to set name of a log file. If the name of Log file is blank, the default file name will be used. Click [Default] button to use the default file name. Log file folder location: For users to set the file storage Path. If the file folder location is blank, the default file folder location will be used. Click [Browse] button to set a file storage path. Special Attention: 1) Device List -> Enabled 2) Logging Items of Selection 3) Logging Options 4) Log file name 5) Log file folder location If there are multiple devices in the list, you must set all of the above monitoring parameters for each monitoring device in the device list. 5.3.2. Now connect and pause for 5 seconds. Then click menu Operation -> Start Data Logging or the icon to enable this function. 5.3.3. Click menu Operation -> Stop Data Logging menu or the icon to stop this function if necessary. 5.3.4. View and analyze data Find the data log files in the specified folder location. There is a folder named MonData in the Acuview installation directory where all the data log files are stored by default. By default, each file name consists of the device description, device type, port (Serial mode) or IP address (Ethernet mode), device address and data logging starting time whose format is YYYYMMDD (Year, Month, Day). 13 Make sure to follow the following rules before you open any Excel file: Special Attention: Never double click any EXCEL files (including data log files) on your computer when data logging is active, otherwise it may cause the software to become unstable and potentially produce inaccurate results (such as out-of-order and loss of data etc.). The correct options to open the excel files are: 1) Click Start > Program > Microsoft Office > Microsoft Office Excel to open the Excel application. When the main window of Excel is open, click File > Open and choose the desired files in the dialog box. or 2) 5.3.5. Copy the desired files to another computer and open them on that computer. Data Log file After you open a data log file of excel format, you can see the following items: Real-Time: Real-Time Metering Demand: Demand Energy: Real-Time Energy Energy(TOU): Current Month TOU PulseInput: Actual value of Pulse Input Counter: Digital Input Pulse Counter AnalogInput: Actual value of Analog Input THD: THD VHS: Voltage Spectrum 2nd to 31st order IHS: Current Spectrum 2nd to 31st order VHS32: Voltage Spectrum 32nd to 63rd order IHS32: Current Spectrum 32nd to 63rd order PhaseAngle: Phase Angles When the data is saved as .txt and .csv, the file content is the same as the excel file, but there is a difference. Each sheet of Excel will be saved as a separate text or CSV document. The parmeters of the PulseInput and the AnalogInput are uncertain, according to the settings page to display. All parameters in the table are shown as following: Real-Time FREQ Frequency PA Watt A U_UNBL Unbalance V UA Volts AN PB Watt B I_UNBL Unbalance I UB Volts BN PC Watt C UC Volts CN P Watt Total ULN Volts LN Average QA VAR A UAB Volts AB QB VAR B 14 UBC Volts BC QC VAR C UCA Volts CA Q VAR Total ULL Volts LL Average SA VA A IA IA SB VA B IB IB SC VA C IC IC S VA Total I I Average PFA Pwr Factor A IN IN PFB Pwr Factor B PFC Pwr Factor C PF Pwr Factor Total Demand PA_IMP Delivered Watt A P_IMP Delivered Watt Total PB_IMP Delivered Watt B P_EXP Received Watt Total PC_IMP Delivered Watt C Q_IMP Delivered VAR Total PA_EXP Received Watt A Q_EXP Received VAR Total PB_EXP Received Watt B S VA Total PC_EXP Received Watt C IA IA QA_IMP Delivered VAR A IB IB QB_IMP Delivered VAR B IC IC QC_IMP Delivered VAR C I I Average QA_EXP Received VAR A P_IMP_PRED Pred. Del. Watt Total QB_EXP Received VAR B P_EXP_PRED Pred. Rec. Watt Total QC_EXP Received VAR C Q_IMP_PRED Pred. Del. VAR Total Q_EXP_PRED Pred. Rec. VAR Total S_PRED Pred. VA Total Energy EP_IMP Ep_imp EP_IMP_A Ep_imp_a EQ_IMP_A EQ_imp_a EP_EXP Ep_exp EP_IMP_B Ep_imp_b EQ_IMP_B EQ_imp_b EQ_IMP Eq_imp EP_IMP_C Ep_imp_c EQ_IMP_C EQ_imp_c EQ_EXP Eq_exp EP_EXP_A Ep_exp_a EQ_EXP_A EQ_exp_a ES Es EP_EXP_B Ep_exp_b EQ_EXP_B EQ_exp_b EP_TOTAL Ep_total EP_EXP_C Ep_exp_c EQ_EXP_C EQ_exp_c EP_net Ep_net ES_A Es_a EQ_TOTAL Eq_total ES_B Es_b EQ_net Eq_net ES_C Es_c Energy(TOU) EP_IMP_SHARP Ep_imp Sharp EP_IMP_ PEAK Ep_imp Peak EP_EXP_SHARP Ep_exp Sharp EP_EXP_ PEAK Ep_exp Peak EQ_IMP_SHARP Eq_imp Sharp EQ_IMP_ PEAK Eq_imp Peak EQ_EXP_SHARP Eq_exp Sharp EQ_EXP_ PEAK Eq_exp Peak 15 ES_SHARP Es Sharp ES_ PEAK Es Peak EP_IMP_VALLEY Ep_imp Valley EP_IMP_ NORMAL Ep_imp Normal EP_EXP_VALLEY Ep_exp Valley EP_EXP_ NORMAL Ep_exp Normal EQ_IMP_VALLY Eq_imp Valley EQ_IMP_ NORMAL Eq_imp Normal EQ_EXP_VALLY Eq_exp Valley EQ_EXP_ NORMAL Eq_exp Normal ES_VALLEY Es Valley ES_ NORMAL Es Normal EP_IMP_TOTAL Ep_imp Total EP_EXP_ TOTAL Ep_exp Total EQ_IMP_ TOTAL Eq_imp Total EQ_EXP_ TOTAL Eq_exp Total ES_ TOTAL Es Total PulseInput Counter DI_111 AXM-IO11 DI1 DI_211 AXM-IO21 DI1 DI_311 AXM-IO31 DI1 DI_112 AXM-IO11 DI2 DI_212 AXM-IO21 DI2 DI_312 AXM-IO31 DI2 DI_113 AXM-IO11 DI3 DI_213 AXM-IO21 DI3 DI_313 AXM-IO31 DI3 DI_114 AXM-IO11 DI4 DI_214 AXM-IO21 DI4 DI_314 AXM-IO31 DI4 DI_115 AXM-IO11 DI5 DI_116 AXM-IO11 DI6 DI_121 AXM-IO12 DI1 DI_221 AXM-IO22 DI1 DI_321 AXM-IO32 DI1 DI_122 AXM-IO12 DI2 DI_222 AXM-IO22 DI2 DI_322 AXM-IO32 DI2 DI_123 AXM-IO12 DI3 DI_223 AXM-IO22 DI3 DI_323 AXM-IO32 DI3 DI_124 AXM-IO12 DI4 DI_224 AXM-IO22 DI4 DI_324 AXM-IO32 DI4 DI_125 AXM-IO12 DI5 DI_126 AXM-IO12DI6 AnalogInput THD UA_THD THD Volts AN/AB IA_THD THD I A UB_THD THD Volts BN/CA IB_THD THD I B UC_THD THD Volts CN/BC IC_THD THD I C U_THD THD Volts Average I_THD THD I Average 16 UA_OTHD Odd THD V A IA_OTHD Odd THD I A UA_ETHD Even THD V A IA_ETHD Even THD I A UA_CF Crest Factor V A IA_KF K Factor I A UA_THFF THFF V A IB_OTHD Odd THD I B UB_OTHD Odd THD V B IB_ETHD Even THD I B UB_ETHD Even THD V B IB_KF K Factor I B UB_CF Crest Factor V B IC_OTHD Odd THD I C UB_THFF THFF V B IC_ETHD Even THD I C UC_OTHD Odd THD V C IC_KF K Factor I C UC_ETHD Even THD V C UC_CF Crest Factor V C UC_THFF THFF V C VHS UA_H2 UB_H2 nd st UA_H3 2 ~31 UA_H4 Harmonic V A UC_H2 nd st UB_H3 2 ~31 UB_H4 Harmonic V B UC_H3 2nd~31st UC_H4 Harmonic V C ... ... ... UA_H31 UB_H31 UC_H31 HIS IA_H2 IB_H2 IC_H2 IA_H3 2nd~31st IB_H3 2nd~31st IC_H3 2nd~31st IA_H4 Harmonic I A IB_H4 Harmonic I B IC_H4 Harmonic I C ... ... ... IA_H31 IB_H31 IC_H31 PhageAngle UA Ph Angle VAN UB Ph Angle VBN UC Ph Angle VCN IA_UA Ph Angle IA(VAN) IB_UA Ph Angle IB(VAN) IC_UA Ph Angle IC(VAN) UAB Ph Angle VAB UBC Ph Angle VBC IA_UAB Ph Angle IA(VAB) IB_UAB Ph Angle IB(VAB) IC_UAB Ph Angle IC(VAB) Table 5.3. Data Log Parameters 5.4. Import/Export Device Profile 5.4.1. A device profile can be imported into the current active device window. To check the content of the imported profile, be sure to disconnect first so that the meter's current settings will not be updated. To send the imported profile to device, follow these steps: 1) Connect first. 2) Click Tools > Import and Update Device, select the desired file. 17 5.4.2. Save the settings of the current window to a file via Export Device Profile. 18 5.5. Acuvim-X Series Acuvim-X series includes Acuvim-DX (TOU), Acuvim-EX (PQ), Acuvim-FX (Alarm), Acuvim-GX (All). A Comparison of Acuvim-X series is shown in Table 5.5. Functions DX EX FX GX Real-Time Metering \/ \/ \/ \/ Digital I/O \/ \/ \/ \/ Demand \/ \/ \/ \/ Total \/ \/ \/ Phases \/ \/ Voltage Spectrum \/ \/ Current Spectrum \/ \/ THD Harmonics Sequence Component \/ \/ \/ Phase Angles \/ \/ \/ \/ \/ \/ Energy Real-Time \/ Current Month TOU \/ \/ Prior Month TOU \/ \/ Cumulative TOU \/ \/ Real-Time \/ \/ Current Month TOU \/ \/ Cumulative TOU \/ \/ Frozen Max and Min Voltage Eligibility Ratio Current \/ \/ \/ Prior \/ \/ \/ Daily \/ \/ Monthly \/ \/ Yearly \/ \/ Cumulative \/ \/ Frozen \/ \/ SOE Log \/ \/ \/ \/ Waveform Log \/ \/ Trending Log \/ \/ \/ \/ \/ \/ Alarm Log \/ Alarm System Status \/ SOE, Waveform, Trending TOU Schedules Settings \/ Device Run-Time \/ \/ \/ \/ Device Information \/ \/ \/ \/ General Settings \/ \/ \/ \/ Digital I/O Settings \/ \/ \/ \/ 19 \/ Demand Settings \/ Energy Settings \/ \/ TOU Schedules Settings \/ \/ Alarm Settings Alarm Settings \/ Waveform Settings Voltage Eligibility Ratio Settings Other Settings \/ \/ \/ \/ \/ \/ \/ Max and Min Recording Mode \/ Trending Settings \/ \/ \/ \/ \/ \/ Table 5.5. Comparison of Acuvim-X series Acuvim-GX (All) is used as the example to introduce the software functions. In order to fully understand the abilities of the software, please thoroughly read the Acuvim-X User's Manual. 5.5.1. Readings 5.5.1.1. Digital I/O To control the relay, please click the related [Control] button. 5.5.1.2. Demand If you want to synchronize demand calculation of all the devices on the bus, please click Synchronize Demand button. 5.5.1.3. Voltage Spectrum, Current Spectrum Section A in Figure 5.5.1 means there's no display when harmonics are 0%. Figure 5.5.1. Voltage Spectrum 20 5.5.1.4. Sequence Component Φuaia is the angle between I A and V A. The broken-line circle on the outside indicates 100% of full range. Figure 5.5.2. Positive Sequence As shown in Figure 5.5.2, the following includes a description of all items: A -- Full range indicator B -- Vector expression C -- Angle between I A and V A 5.5.1.5. Real-Time Energy, Current Month TOU, Cumulative TOU You can modify the value of energy by clicking underlined figures. Figure 5.5.3. Real-Time Energy 21 Figure 5.5.4. Current Month TOU As shown in Figure 5.5.3 and Figure 5.5.4, the following includes a description of all items: A -- Modify energy value by clicking figures. B -- Check current month TOU of all phases by clicking characters. 5.5.1.6. Prior Month TOU As shown in Figure 5.5.5, Section A points out the billing time of prior month on the Prior Month TOU node in the menu tree. Figure 5.5.5. Prior Month TOU 5.5.1.7. Frozen Energy As shown in Figure 5.5.6, the time displayed on the Frozen Energy node in the menu tree is the time of freezing real-time energy, current month TOU and accumulative TOU. 22 Figure 5.5.6. Frozen Energy 5.5.1.8. Prior Max and Min As shown in Figure 5.5.7, the date and time displayed on the Prior node in the menu tree is the time of recorded Prior Max and Min. Figure 5.5.7. Prior Max and Min 5.5.1.9. Frozen Voltage Eligibility Ratio As shown in Figure 5.5.8, the time displayed on the Frozen node in the menu tree is the time of frozen voltage eligibility ratio. 23 Figure 5.5.8. Frozen Voltage Eligibility Ratio 5.5.1.10. Waveform Log There are two functions in waveform log: 1) Click Retrieve Waveform button to read the data corresponding to the selected item, and the Data column will remain after reading. It will then draw a waveform graph automatically. Figure 5.5.9. Waveform Log (1) As shown in Figure 5.5.9, the following includes a description of all items: A -- Step 1: Select an item to read. B -- Step 2: Click Retrieve Waveform button. C -- The Data column will remain after reading. 2) An item whose data field is not empty may be selected. Its waveform will be displayed as shown in Figure 5.5.10. Section A means to click an item with data. 24 Figure 5.5.10. Waveform Log (2) Click the Save to File button, then you can save the data of selected items as a txt/csv/xls file for future analysis. In typical waveform as is shown in Figure 5.5.11, the following includes a description of all items: A -- Capture time and reason B -- Capture time when capturing condition is satisfied C -- Values on current time stamp D -- Movable time label Figure 5.5.11. Waveform Graph 5.5.1.11. Trending Log 25 Read current trending data by clicking Retrieve Trending button. It will draw a trending graph automatically. Then click the Save to File button, and the data will be saved in a txt/csv/xls file for later analysis. Figure 5.5.12. Trending Graph In typical trending as shown in Figure 5.5.12, the following includes a description of all items: A -- Logging data interval B -- Movable time label C -- Values on current time stamp 5.5.1.12. System Status Figure 5.5.13. System Status 26 As shown in Figure 5.5.13, the following includes a description of all items: A -- Important parameters used in reading data automatically B -- Important feedback information used in TOU settings 5.5.2. Settings 5.5.2.1. Digital I/O Users need to select the type of RO or DO when it is used as alarm output. Figure 5.5.14. Digital I/O Settings 5.5.2.2. Energy Notice: When Reset Real-Time Energy, Start Resetting TOU, Start Freezing and Restore TOU Schedules to Defaults buttons are clicked, it will take effect at once without having to click the Update Device button. 5.5.2.3. Alarm Notice: When setting the Setpoint of alarm limit, there are no units for them. All units are displayed in Alarm Channel. 27 Figure 5.5.15. Alarm Settings As shown in Figure 5.5.15, the following includes a description of all items: A -- Unit of Alarm Channel B -- Value without unit 5.5.2.4. Voltage Eligibility Ratio Notice: When clicking Start Resetting TPVER and Start Freezing TPVER button, it will take effective at once without having to click the Update Device button. 28 5.6. Acuvim-L Series This chapter introduces some of the functions of Acuvim-CL and Acuvim-EL. In order to understand the software abilities, please thoroughly read Acuvim-L User’s Manual. 5.6.1. Readings 5.6.1.1. Voltage Spectrum, Current Spectrum (Acuvim-CL) The A in Figure 5.6.1 means there is no display when harmonics are 0%. Figure 5.6.1. Voltage Spectrum 5.6.1.2. Energy and Harmonics (Acuvim-CL) You can modify the value of energy by clicking underlined characters . 29 Figure 5.6.2. Energy and Harmonics 5.6.2. Settings 5.6.2.1. TOU (Acuvim-EL) As shown in Figure 5.6.3, there are three respective formats. A: MM-DD ID. MM is Months, DD is Days, ID is the Number of a Schedule. B: The same as A. C: HH-MM ID. HH is Hours, MM is minutes, ID is the Number of a Tariff. Figure 5.6.3. TOU 5.6.2.2. TOU Holiday (Acuvim-EL) The format of C is MM-DD ID. MM is Months, DD is Days, ID is the Number of a Schedule. Part B means ten years beginning and ending point. When the checkbox of A in Figure 5.6.4 is selected, the button D is available. 30 Figure 5.6.4. TOU Holiday 5.6.2.3. Pulse Input (Acuvim-EL) As shown in Figure 5.6.5, when DI Type is state, the options are disabled. When DI Type is counter, they are enabled. Advanced Option button is used to define the Category and the Unit. The Advanced Option window is shown in Figure 5.6.6. Figure 5.6.5. Pulse Input Figure 5.6.6. Advanced Options 31 5.7. Acuvim II Series This chapter introduces some of the functions of Acuvim II/IIR/IIE/IIW. In order to understand the software abilities, please thoroughly read Acuvim II User’s Manual. 5.7.1. Readings 5.7.1.1. Energy (Acuvim II) You can modify the value of energy by clicking underlined characters. Figure 5.7.1. Energy 5.7.1.2. Voltage Spectrum, Current Spectrum (Acuvim II) The A in Figure 5.7.2 means there is no display when harmonics are 0%. Figure 5.7.2. Voltage Spectrum 32 5.7.1.3. Sequence Component (Acuvim II) Φuaia is the angle between I A and V A. The broken-line circle on the outside indicates 100% of full range. Figure 5.7.3. Positive Sequence As shown in Figure 5.7.3, the following includes a description of all items: A -- Full range indicator B -- Vector expression C -- Angle between I A and V A 5.7.1.4. I/O Modules (Acuvim II) As shown in Figure 5.7.4, AO parameters are shown as real value, and AI parameters show as numerical value (range: 0~4095). 33 Figure 5.7.4. I/O Modules 5.7.1.5. Data Log (Acuvim IIR) There are three ways of retrieving the logs: "read newest 50 records", "read one window" and "read 1000 records". Figure 5.7.5. Data Log As shown in Figure 5.7.5, the following includes a description of all items: A -- Data Log 1 status B -- Data Log 2 status C -- Data Log 3 status D -- Select types before read logs E -- Data area 5.7.1.6. Waveform Log (Acuvim IIW) There are two functions in waveform log: 1) Click Retrieve Waveform button to read the data corresponding to the selected item, and the Data column will remain after reading. It will then draw a waveform graph automatically. 34 Figure 5.7.6. Waveform Log (1) As shown in Figure 5.7.6, the following includes a description of all items: A -- Step 1: Select an item to read. B -- Step 2: Click Retrieve Waveform button. C -- The Data column will remain after reading. 2) An item whose data field is not empty may be selected. Its waveform will be displayed as shown in Figure 5.7.7. Section A means to click an item with data. Figure 5.7.7. Waveform Log (2) Click the Save button, then you can save the data of selected items as a txt/csv/xls file for future analysis. In typical waveform as is shown in Figure 5.7.8, the following includes a description of all items: A -- Capture time and reason B -- Capture time when capturing condition is satisfied 35 C -- Values on current time stamp D -- Movable time label Figure 5.7.8. Waveform Graph 5.7.2. Settings 5.7.2.1. General (Acuvim II) 36 Figure 5.7.6. General Settings (serial connection) Figure 5.7.7. General Settings (network connection) Figure 5.7.8. Change Password A -- As shown in Figure 5.7.6, in the serial connection, Password is visible and displays with decimal number. B -- As shown in Figure 5.7.7, in the network connection, Password is not visible. Instead of decimal numbers, it is displayed as ‘*’. Click Change Password button and the Change Password window which is shown in Figure 5.7.8 will appear. Notice: In the network connection, it needs to input device password when data or parameters related to meter are changed, such as Update Device, Modify Energy and Clear Demand and so on. 5.7.2.2. I/O Modules (Acuvim II) Notice: When you set the Input/output Range of AO Transfer Curve, there is no unit for it. All units are displayed in the Raw Channel of AO area. 37 Figure 5.7.9. I/O Modules Settings As shown in Figure 5.7.9, the following is a description of all items: A -- Channel and Unit of AO Input B -- Range and Unit of AO Output C -- Value without unit 5.7.2.3. Alarm (Acuvim II) Notice: When you set the Set Point of the alarm limit, there is no unit for it. All units are displayed in the Alarm Channel. 38 Figure 5.7.10. Alarm Settings As shown in Figure 5.7.10, the following is a description of all items: A -- Unit of Alarm Channel B -- Value without unit 5.7.2.4. Data Log (Acuvim IIR) Notice: You can program up to 114 parameters per log. The total size is no more than 63 sectors that has 64k bytes. The Data Log 1 Setting is shown in Figure 5.7.11. 39 Figure 5.7.11. Data Log 1 Settings 5.7.2.5. TOU (Acuvim IIE) As shown in Figure 5.7.12, there are three respective formats. A: MM-DD ID. MM is Months, DD is Days, ID is the Number of a Schedule. B: The same as A. C: HH-MM ID. HH is Hours, MM is minutes, ID is the Number of a Tariff. Figure 5.7.12. TOU 5.7.2.6. TOU Holiday (Acuvim IIE) 40 The format of C is MM-DD ID. MM is Months, DD is Days, ID is the Number of a Schedule. Part B means ten years beginning and ending point. When the checkbox of A in Figure 5.7.13 is selected, the button D is available. Figure 5.7.13. TOU Holiday 5.7.2.6. Pulse Input (Acuvim IIE) As shown in Figure 5.7.14, When DI Type is state, the options are disabled. When DI Type is counter, they are enabled. Advanced Option button is used to define the Category and Option window is shown in Figure 5.7.15. Figure 5.7.14. Pulse Input 41 the Unit. The Advanced Figure 5.7.15. Advanced Options 5.7.2.7. Analog Input (Acuvim IIE) As shown in Figure 5.7.16, Advanced Option button is used to define the Category and the Unit. Figure 5.7.16. Analog Input 42 5.8. Acuvim Series This chapter introduces some of the functions of the Acuvim+. In order to understand the software abilities, please thoroughly read Acuvim User’s Manual. 5.8.1. Readings 5.8.1.1. Energy You can modify the value of energy by clicking underlined characters. Figure 5.8.1. Energy 5.8.1.2. Voltage Spectrum, Current Spectrum The A in Figure 5.8.2 means there is no display when harmonics are 0%. Figure 5.8.2. Voltage Spectrum 43 5.8.2. Settings 5.8.2.1. Alarm Notice: When you set the Set Point of the alarm limit, there are no units for them. All units are displayed in the Alarm Channel. Figure 5.8.3. Alarm Settings As shown in Figure 5.8.3, the following includes a description of all items: A -- Unit of Alarm Channel B -- Value without unit 44 6. Troubleshooting 1) Why is the drop-down list of the Com Port in Connection Settings dialog empty? Answer: the program has not detected any available serial port, please check if it is any idle. 2) Why is there no new waveform in the list after I clicked Capture Waveform button? Answer: the waveform buffer is full. Make sure that the current 5 waveforms are not being used and clear them in the System Status page by clicking Reset Waveform Log button. 3) Why are there inconsistencies between the displaying value and the real value of voltage and current? Answer: This may be caused by incorrect settings of the PT and/or CT ratios, please check the General Settings page. 4) How do I know whether the settings of TOU are right and taking effect? Answer: firstly, check whether the feedback information of TOU settings in the System Status page are correct. If correct, then check whether related TOU settings are enabled. Finally, check whether there is any change in the Current Month TOU page. 5) Does Start Freezing mean to freeze at once? Answer: Yes, but if you want to go back to Assign freeze mode after clicking the Start Freezing button, you have to set it again. 6) Under what conditions, can I use the SmartSum function? Answer: In the Data Log Settings, you must ensure that each Logging Options and Log file folder location in the device list are the same. 7) Can I choose some columns by myself and fix their names in the data log file of Excel? Answer: Yes, you can set the column names, and also can append some columns. But you must be careful to avoid confusion in the data log template file of Excel. 45 7. Installation 7.1. Installing Double click setup file, follow the guide step by step. Notice: Software can be installed to a different directory (up to 8). 7.2. Uninstalling To remove this program from your system: 1) Open the Windows Control Panel, double-click Add/Remove Programs. 2) Find the application name in the list and select it. 3) Follow the instructions in the Uninstall Wizard step by step. 7.3. System Requirements The minimum running requirements of Acuview software: 1) Operating System: Windows 2000/XP/Vista/Windows 7. 2) Memory: 128MB/256MB or more. 3) HDD: 100MB/500MB or more free space. 4) Display Resolution: 1024 * 768 or higher. 5) Software Needed: Microsoft Office Excel 2000/XP/2003/2007. Notice: If Excel Application is not installed in the system, files cannot be saved as Excel documents when using the data logging function. 46