1
GGIG Graphical Interface Generator
Programming Guide
Wolfgang Britz, August 2010
- Version Juli 2014 -
GGIG Graphical Interface Generator - Documentation
The following report is the outcome of a collaborative effort of University Bonn and the
author. Larger parts of the Java code underlying GGIG had been developed over the years in
the content of the CAPRI modelling system, which receive considerably funds from the EU
research framework programs. Following the general policy in CAPRI, the GGIG precompiled code can be used for other scientific projects as well.
The author would like to acknowledge the contribution of Alexander Gocht, vTI
Braunschweig, to the CAPRI GUI coding efforts. All errors remain with the author.
Wolfgang Britz, Version July 2014
2
GGIG Graphical Interface Generator - Documentation
Content
GGIG Graphical Interface Generator ......................................................................................... 1
Programming Guide ................................................................................................................... 1
Content ....................................................................................................................................... 3
Overview .................................................................................................................................... 7
Current applications of GGIG .................................................................................................. 11
An overview on the GUI .......................................................................................................... 12
The interface generator ............................................................................................................. 13
Tasks..................................................................................................................................... 13
Mapping controls setting to GAMS ..................................................................................... 13
Basic concept of the control definition file .......................................................................... 14
Tool name, logo and background color ................................................................................ 15
Worksteps ............................................................................................................................. 15
Tasks..................................................................................................................................... 16
Use of filters for exploitations .......................................................................................... 17
Controls ................................................................................................................................ 20
Possible fields for controls ............................................................................................... 20
Type of controls ............................................................................................................... 21
Tab .................................................................................................................................... 22
Separator........................................................................................................................... 23
Text................................................................................................................................... 24
Checkbox .......................................................................................................................... 25
Singelist ............................................................................................................................ 26
filesel ................................................................................................................................ 27
fileselDir ........................................................................................................................... 28
Multilist / MultiListNonZero ........................................................................................... 29
Wolfgang Britz, Version July 2014
3
GGIG Graphical Interface Generator - Documentation
Radiobuttons..................................................................................................................... 32
Slider ................................................................................................................................ 34
Spinner ............................................................................................................................. 35
Table / TableSimple ......................................................................................................... 36
Style options ......................................................................................................................... 39
Starting GAMS from GGIG ..................................................................................................... 39
General interface settings ......................................................................................................... 41
GAMS and R related settings ............................................................................................... 41
SVN related settings ............................................................................................................. 42
Settings linked to the exploitation tools ............................................................................... 43
Meta data handling ................................................................................................................... 44
Why meta data? .................................................................................................................... 44
Technical concept ................................................................................................................. 44
Exploitation .............................................................................................................................. 46
The software behind the mapping viewer and the CAPRI exploitation tools .......................... 46
CAPRI tasks as business model ........................................................................................... 48
Execution of tasks via a GamsStarter and GamsThread ...................................................... 48
Refactoring the mapping part ............................................................................................... 49
Views as the basic concept ................................................................................................... 50
Data model ........................................................................................................................... 51
Client based solution ............................................................................................................ 52
The geometry model ............................................................................................................. 52
Views as the basic concept for exploitation ......................................................................... 53
Why a XML definition files for views? ............................................................................... 55
The structure of the XML definition files for the views ...................................................... 56
General comments ............................................................................................................ 56
Wolfgang Britz, Version July 2014
4
GGIG Graphical Interface Generator - Documentation
Necessary tags for tables .................................................................................................. 56
Defining the items of the table ......................................................................................... 57
Additional tags: <subTheme> .......................................................................................... 58
Additional tags: <defpivot> ............................................................................................. 58
Additional tags: <defview> .............................................................................................. 59
Additional tags: <COO> .................................................................................................. 59
Alternative texts for the dimensions................................................................................. 60
Additional tags: <clone> .................................................................................................. 60
Further tags ....................................................................................................................... 61
Filters for the elements in the different dimensions ......................................................... 62
Attaching long texts and filters to elements ..................................................................... 63
The structure of the GAMS generated gdx files used by the exploitation tools .................. 63
Loading the data from gdx files ........................................................................................... 64
Menu bar .................................................................................................................................. 64
Design hints for structured programming in GAMS with GGIG ............................................. 65
Using information passed from GGIG ................................................................................. 65
Structure your program by tasks .......................................................................................... 66
One entry points for run specific settings............................................................................. 66
Scenario editor.......................................................................................................................... 67
Batch execution ........................................................................................................................ 67
Generate GAMS documentation .......................................................................................... 68
Background ...................................................................................................................... 68
Desired properties ............................................................................................................ 69
Technical implementation ................................................................................................ 69
Overview .......................................................................................................................... 70
Handling of GDX files ..................................................................................................... 71
Wolfgang Britz, Version July 2014
5
GGIG Graphical Interface Generator - Documentation
Index ......................................................................................................................................... 72
Wolfgang Britz, Version July 2014
6
GGIG Graphical Interface Generator - Documentation
Overview
The GAMS Graphical Interface Generator (GGIG) is a tool to generate a basic Graphical User
Interface (GUI) for a GAMS or R project1 with five main functionalities:
1. Generation of user operable graphical controls from XML based definitions. The
XML file defines the project specific layout of the GUI. The user can then interact
with the GUI to change the state of the controls. The state of each control component
such as a checkbox can then be mapped to GAMS code ($SETGLOBALS, Set
definitions, settings for parameters). It combines hence the basic functionality of a
GUI generator and a rudimentary GAMS code generator.
2. Generation of GAMS compatible meta data from the state of the control which can
be stored in GAMS GDX format and later accessed, so that scenario definitions are
automatically stored along with results.
3. Execution of a GAMS or R project while passing the state of the control to
GAMS respectively R as a include file.
4. Exploitation of results from GAMS runs by providing an interface to define the
necessary interfacing definitions in text file to load results from a GAMS into the
CAPRI exploitation tools.
5. Access to a set of GAMS related utilities. This include e.g. a viewer for GDX files, a
utility to build a HTML based documentation of the GAMS code or a batch execution
utility.
GGIG is steered with xml-based text file and does not require knowledge in a higher
programming language
GGIG was developed to overcome a typical problem when economic models are implemented
in GAMS. GAMS itself, not at least to ensure platform portability, does not allow for
graphical user input. Run specific settings for GAMS need therefore to be introduced either
by changes to the GAMS project code itself or by adding settings of environment variables to
the GAMS call. Experienced model users – typically the code developers themselves – know
how to change run specific settings in the GAMS code, and do so typically quite efficiently.
1
The code can also be used from inside Java, but that feature is not discussed in the documentation.
Wolfgang Britz, Version July 2014
7
GGIG Graphical Interface Generator - Documentation
As a consequence, they seldom feel the need to develop a GUI steering their GAMS project.
The need to invest in GUI development might have even decreased as the GAMS IDE now
offers some basic functionality often found in project specific GUIs. The IDE allows inter alia
starting GAMS, inspecting parameters found in the listing file or viewing the context of a
GDX file.
However, a GAMS code only solution for an economic model typically poses a serious entry
barrier to newcomers for two reasons. Firstly, possible users are often not familiar with
GAMS. But even with some elementary knowledge of the language, they might face problems
understanding project specific GAMS code making use of advanced GAMS features.
Secondly, they face the challenge to familiarize themselves with the specific code of the
project. They would need to learn enough to know exactly which specific code changes are
necessary to implement e.g. scenarios in a given project. In some cases, the large and/or
complex GAMS code of projects basically excludes their usage beyond some core developers.
Accordingly, institutions or tool developers often observe that promising tools are only used
by a few specialists, reducing returns to their investment in tool development and
maintenance. Possible other users often shy away from the high learning costs and/or fear to
generate, analyse and present results based on a black box where it is unclear how to enter
exactly a scenario and how to access their results.
It is therefore not astonishing that some tools based on GAMS (and also on other modelling
languages) have developed their specific GUIs. These GUIs let the user steer the tool with a
touch & feel comparable to other programs running on modern windowed operating systems.
However, writing a GUI for a larger project firstly requires considerable programming skills,
often not found with the economic modellers themselves. Secondly, developing a good
design, coding, debugging and maintaining a GUI can be a rather costly exercise. As a
consequence, typically only rather large and well funded tools have found and invested the
necessary resources to develop such GUIs. CAPRI and runGTAP provide some examples.
These project specific GUIs are typically very powerful, but tend also to be tool specific.
They can typically not be modified easily to fit to another (GAMS) project.
That renders it inviting to think about generic tools able to generate a GUI which can interface
to GAMS. The coding effort can then be shared across projects, and user might even reduce
learning costs if they use similar GUIs for different tools. A well-established example for such
a tool is the “GAMS Simulation Environment (GSE)” by Wietse Dol. GSE is quite general: it
incorporates features of an Integrated Development Interface (IDE) as well as exploitation
Wolfgang Britz, Version July 2014
8
GGIG Graphical Interface Generator - Documentation
features. It is based on specific “tags” introduced in the GAMS code. GGIG is certainly not a
competitor to GSE: GSE offers more functionality and is more IDE oriented. It might
however be easier to embed some simple steering settings with GGIG into an existing project
compared to the tag based concept of GSE. GSE was in the past a commercial product
distributed with a license but can now be downloaded for free.
An example of a completely different approach to a GUI for modelling tools offers
SEAMLESS-IF with its focus on component linkage. Based on OpenMI, it however requires
the development of an OpenMi compatible wrapper around the GAMS project itself.
Concepts such as the SEAMLESS-IF are therefore probably only suitable for larger projects
focusing on combining components based on different programming languages. Furthermore,
SEAMLESS-IF is based on a client/server implementation and requires specific software
licences for deployment.
GGIG might hence be seen as a quite simple and easy to use tool to generate GUIs for GAMS
projects. If all GGIG features are used, it can however host quite complex projects. The new
GUI for CAPRI built with GGIG offers an example for a rather complex implementation.
As mentioned above, a second important contribution of GGIG is to mechanize to the largest
extent the generation, storage and later inspection of meta data underlying a scenario and the
related result set, overcoming an often encountered weakness in (economic) models.
And thirdly, GGIG offers a bridge between the powerful CAPRI exploitation tools and other
GAMS based models. It draws on the experiences with BenImpact, MIVAD and the village
CGEs developed in Advanced-Eval, GAMS tools models resp. Java based GUIs where the
CAPRI exploitation tools had been used. These GAMS based projects used the CAPRI
exploitations, but did not add any GUI functionalities to also steer their models. The
experiences with these examples can hence be seen as the starting point for the development
of GGIG in order to expand beyond a pure, project adjusted implementation of the CAPRI
exploitation tools.
Some specific skills and eventually serious refactoring of the reporting part of an existing
model are necessary to benefit from the full functionality of the CAPRI exploitation tool. It
therefore pays typically off to start using GGIG for exploitation from the beginning. But at
least, no skills in coding in a higher programming language such as Java are necessary to
define the necessary interfaces between the GAMS project and the exploitation part. The
latter offers interlinked tables (with selections, sorting, outlier control, pivoting), different
type of graphs, maps and flow maps.
Wolfgang Britz, Version July 2014
9
GGIG Graphical Interface Generator - Documentation
Additionally, GGIG features a set of utilities originally developed for CAPRI such as HTML
based documentation of the GAMS code, a GDX viewer or a batch processing mode.
The development of GGIG would have been impossible without the continued funding for the
maintenance and development of CAPRI by the EU Commission, which also let to the
emergence of the CAPRI GUI and exploitation tools. That code base was the starting point for
GGIG. I would also like to mention the contribution of Alexander Gocht over the last years to
the code of the interface.
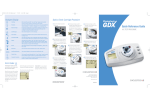
The main parts of GGIG are graphically depicted below. At its core stands the GGIG Control
generator, based on Java code. Based on a XML based definition file provided by the project,
it generates a project specific GUI which can be operated by the user. The state of these
controls such as numerical settings, on/off settings or n of m selection can be passed to
GAMS by an automatically generated include file which also contains automatically
generated meta data. The user can also execute GAMS from the GUI. The GUI can equally
load numerical results and meta data in a specific GDX viewer. The latter supports “view
definition”, i.e. pre-defined reports to exploit the results. The details of the different elements
are discussed below.
GGIG
Controls and Settings
definition file
GAMS
include file
GGIG
Control
Generator
User
input
Project specific
GUI
GAMS
executable
Exploitation
tools
GAMS
project code
Meta data
Numerical results
GDX
Diagram: Overview on information flow in GGIG
Wolfgang Britz, Version July 2014
10
GGIG Graphical Interface Generator - Documentation
Current applications of GGIG
Since the first prototype, GGIG has been successfully implemented in a number of projects,
examples are listed below:
DairyDyn: an fully dynamic single farm model focusing on the impact of Green House
Gas emission indicators on allocation and investment decision
A small, spatial multi-commodity model for world trade of cooked and uncooked
poultry meat with a focus on trade bans related to Avian Influenca
A EU wide layer of regional CGEs with a focus on Rural Development measures on
the second pillar of the CAP, which is now incorporated into CAPRI.
LANA-HEBAMO: A Hydro-Economic model for the lake Naivasha in Kenya.
The FADNTOOL project which combines a set of economic tools for simulating
policy impacts based on the FADN data.
An user interface augmented version of GTAP in GAMS.
An Agent Based model for structural change in agriculture, which is realized in
GAMS, but uses GGIG as its user interface.
Wolfgang Britz, Version July 2014
11
GGIG Graphical Interface Generator - Documentation
An overview on the GUI
As shown in the example above, the GUI consists a few elements:
1. A menu bar which allows to change some settings (see the section on general
interface settings)
2. A workstep and task selection panel on the left hand side where the user can select
between different tasks belonging to the project.
3. A right hand side panel which either shows:
i. The generated controls, a button panel to start GAMS and a windows
in which the message log from GAMS is shown
ii. A panel to select data to view and to start their exploitation
iii. The exploitation tools
4. A small window in the left lower corner which present a logo.
Whereas the elements 1. and 3.ii and 3iii. are not project specific, the worksteps and tasks
available in 2. and the controls shown to the user in 3.i. are generated in a project specific
initialisation file. The details of that file – which is core of GGIG – are discussed below.
Wolfgang Britz, Version July 2014
12
GGIG Graphical Interface Generator - Documentation
The interface generator
Tasks
Tasks are central elements in GGIG. Each control can belong to one or several task, and each
task might have its own GAMS or R process. That allows steering even rather complex tools
with one GUI which combine different GAMS or R projects. It supports a structured
development of the GAMS/R code as either separate GAMS/R files with a clear purpose are
generated or a GAMS/R file consists of blocks which belong to certain tasks.
When the user selects a task, only the controls belonging to that task are shown to the user,
easing the handling of the GUI.
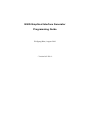
Mapping controls setting to GAMS
Controls are user operable, graphical elements. A few examples are shown below.
Diagram: Example of controls generated with GGIG
In the case of GGIG, these graphical controls are used by the user to define textual and
numerical settings which in turn define run specific settings for a GAMS/R project. GGIG
offers five functionalities related to these controls and their interactions with a GAMS project:
1. It generates the controls from a definition file on a windowed program interface.
2. It offers the necessary code to intercept user operations on the controls.
3. It maps the settings of the controls based on the user input to as sequence of GAMS or
R statements, which can be included into a GAMS/R project to generate a specific run.
4. It allows execution of GAMS or R.
5. It offers a GDX viewer which supports the definition of pre-defined reports.
The overview on the process is shown in the diagram above.
Wolfgang Britz, Version July 2014
13
GGIG Graphical Interface Generator - Documentation
In order to allow the run specific settings to enter a specific GAMS project, the generated
include file should define the sole entry point of run specific information. The state of the
controls – passed to the include file - should hence define all the necessary information for a
specific run. The GAMS code should accordingly not allow for or require additional changes
to generate a “scenario”, i.e. a specific run. It is however easily to use a text control to enter
the directly the name of a include file.
The generated include file is overwritten each time the user starts the GAMS project.
Basic concept of the control definition file
GGIG supports two formats for definitions file: XML based property files or standard Java
property files. The later are only supported for backward compatibility and should no longer
be used for new GGIG projects.
XML property file
The core of GGIG consists of the control definition file. The XML property file defines a
controls, tasks, etc. based on XML tags. As the XML file is parsed by a standard Java XML
parser, these tags can additional by stored in different lines, see example below:
The different tags (or keywords) are discussed in detail below.
Standard Java property files (deprecated)
It follows the basic implementation of a property file in Java. Each line thus consists of a key
– value pair, separated by an equal sign. The definition of the controls is stored in the same
file along with general settings such as the name of the GAMS project, directories, the user
name etc..
For each control, one line is used. That line comprises all the necessary information to
generate the control, as well as to store the current setting.
Wolfgang Britz, Version July 2014
14
GGIG Graphical Interface Generator - Documentation
The control definition file is text based and can hence be edited with any text editor. Most of
the settings – with the exemption of the definitions of the controls themselves – can also be
entered by the user via the controls on the GGIG interface. These project independent controls
are to a larger extent borrowed from the CAPRI user interface. On top, a first rudimentary
control editor is embedded in the tool.
Call of GGIG
In a normal installation, there are two files:
1. One default file with the control definitions and related default values. That file should
be typically under version control.
2. A second file which is installation specific, it will solely store the values entered by
the user on the interface and will be in ini format. Its content is updated each time the
interface is closed, the next run will re-load the control and other setting from that file.
A typical call will therefore look like:
Java Gig.jar project.ini project_default.xml
Where the project ini stores the current user settings and the second one the control and
further project specific settings. It is hence possible to host several GGIG based installations
in one directory where the jars etc., are stored.
Tool name, logo and background color
The following three XML tags allow to set the tool name, the logo shown on the interface and
the background color:
Equally, the icon shown in the task bar can be set
Worksteps
Worksteps allow to group tasks, and thus represent the top level of structuring actions in a
tool. The following attributes are possible
Name
Name of the workstep shown as selectable radio button (required)
Wolfgang Britz, Version July 2014
15
GGIG Graphical Interface Generator - Documentation
Tasks
List of tasks
The work step selection is based on a set of radio buttons in a panel in the upper left corner of
the generated GUI. It is not necessary to define work steps in a project.
Tasks
The control definition file must define a list of tasks (such as calibrating the model and
running the model) for the project.
A task can have its own GAMS or R file to start, its own result directories and its own set of
controls. Each control can be shared by several tasks.
The tasks are put in the order as they are defined in the control file on the left hand side of the
interface, below the work step panel (if work steps are defined):
Wolfgang Britz, Version July 2014
16
GGIG Graphical Interface Generator - Documentation
The following attributes are possible for a task
Name
defines the name of task, shown on interface (required)
gamsFile
defines the name of the GAMS project to start (optional)
resDir
result directory where the results are stored (optional)
filemask
regex string used filter the files shown in the scenario exploitation
boxes for the task (required)
incFile
defines the name of include file used by the task (optional)
gdxsymbol
defines the GAMS symbol (set, parameter) to load for exploitation
{logical}dim position of the logical dim in gdxsymbol, where logical=region,
activity, product, year, scen, dim5
filters
filters for scenario input, see below
If no gamsFile,incFile or resDir are given, the general ones defined in the ini-file are used.
Tasks without a GAMS or R clearly cannot be executed, but they can be used to exploit GDX
files. That allows to e.g. to explore different parts of data bases.
Use of filters for exploitations
Filters are used to
1. To let the user select from the GDX files which are potentially generated by the task
based on a specific content selection, .e.g. only files from a specific year
2. To introduce a filter on the GDX element loaded in the viewer, e.g. to only load
records for a specific country
A filter definition consists of 3 fields:
Wolfgang Britz, Version July 2014
17
GGIG Graphical Interface Generator - Documentation
1. The logical dimension to which it is applied: {region, activity, product, year, scen,
dim5}
2. The selection control which is used for the filter
3. The type of filter:
a. “Starts_with” or “ends_with” for GDX element filters, i.e. only such
records will be loaded where the item describing the logical dimension starts
with one of the selected keys.
b. Otherwise, a pair of integer values which describe on which position of the file
names the selected key should be found plus either “skip” for only using
selecting files or “merge” to merge records from the chosen GDXs.
The screenshot below shows an example generated from the following filters:
The first filter “starts_with” does not affect the file selection, but will affect which records
from the selected files are loaded in the viewer. In the example shown below, where the filter
controls fit to the definitions above, only records where the region key starts with “BL” will
be shown to the users.
The other two filters will skip files where the base and simulation years do not match the
selection. In our example, the base year is stored as a two digit key on position 7 and 8, and
only files with a “04” are in the drop down box for the scenarios. Similarly, only results for
the simulation year “20” are selected.
Wolfgang Britz, Version July 2014
18
GGIG Graphical Interface Generator - Documentation
Normally, the name of the file will be used to characterize the “scenario”. The “merge” is
made for the case where several GDX files should be combined and the file name does not
distinguish model runs. An example offers the downscaling component of CAPRI: it
produces in separate GAMS run for the same scenario one file for each country which
comprise rather huge data sets. The “merge” mode allows combining these result sets
together.
Wolfgang Britz, Version July 2014
19
GGIG Graphical Interface Generator - Documentation
Controls
Possible fields for controls
The necessary information for each control is stored in different tags for each control
definition file. The controls are put on the interface in the order they are given in the XML.
The following fields are available:
Type
defines the type of control (required). The different types are discussed below
in detail.
Title
defines the description of the control as seen by user (required)
GamsName defines the name of global settings resp. SET name (optional)
Value
pre-selected setting(s) (optional)
Options
list of available options (required where applicable)
Range
Min, max, increment, major ticks; or number of rows shown (required where
applicable)
Tasks
List of tasks to which the control belongs. If empty, it belongs to all tasks
Tooltip
A tooltip text hovering over the control
Pdflink
Link to a pdf file and chapter to open on mouse over
Selgroups
Selection list opened by pop-up menu (see Multilist control)
Style
Different style options (optional)
Disable
Control is blocked for input – useful to show settings on interface which are
should be sent to GAMS for a specific task.
Wolfgang Britz, Version July 2014
20
GGIG Graphical Interface Generator - Documentation
Type of controls
The following types of controls are available. The related JAVA swing JComponent is shown
in bracket.
Tab
Introduces a new tab on the tabbed plane hosting the controls
Separator
to structure a pane with control (JLabel in an JPanel with a border)
Panel
the next controls are shown together on a panel
Text
to enter a free text (JTextField)
Checkbox
for on-off type of settings (JCheckBox)
Singlelist
for 1 of n selections (JList in a JScrollPane)
RadioButtons
for 1 of n selections (Group in JButton, vertically aligned)
Filesel
for 1 of n selections of a list of files (JList in a JScrollPane)
FileselDir
for 1 of n selections of a list of files found potentially in sub-directories,
preceded by a sub-directory lists (two JList in a JScrollPane)
Multilist
for n of m selections (n=0..m), (non editable JComboBox)
MultilistNonZero
for n of m selections (n=1...m), (non editable JComboBox)
Slider
for integer value selection from a range of values (JSlider)
Spinner
for floating or integer value selection from a range of values (JSpinner)
Table
to enter floating point variables in a two or three-dimension parameter,
comprises pivot possibilities (JTable)
SimpleTable
to enter floating point variables in a two or three-dimension parameter,
no pivot possibilities (JTable)
Wolfgang Britz, Version July 2014
21
GGIG Graphical Interface Generator - Documentation
Tab
Purpose
Used to structure the interface by grouping controls on an input pane: introduces a
new tabbed plane to which controls following are then added
Applicable fields:
Title, Tasks
Control optic:
Remark:
The user can only see one of the tab pane at any time – care should hence be given to keep the
number of tabs and the assignment of controls to tabs such that a user can easily check all key
inputs.
Wolfgang Britz, Version July 2014
22
GGIG Graphical Interface Generator - Documentation
Separator
Purpose
Used to structure the interface, gives a title for the next block of controls
Applicable fields:
Title, Value, Tasks
Control optic:
Example definition:
Wolfgang Britz, Version July 2014
23
GGIG Graphical Interface Generator - Documentation
Text
Purpose
Allows the user to enter text. Used e.g. to name the output generated by a run.
Applicable fields:
Title, Value, Tasks, Style
Control optic:
Possible value:
Any text allowed
User action:
Edit with keyboard
Example definition:
Output to GAMS:
Note:
If the text entered refers to an existing file, it is recommended to use a filesel control
instead.
Wolfgang Britz, Version July 2014
24
GGIG Graphical Interface Generator - Documentation
Checkbox
Purpose
Used for on/off settings, i.e. in cases where one of two options must be chosen, e.g.
in cases of project modules which can be used or not (1 of 2). Cannot be used for 1
of n selections where n > 2 – use a List instead.
Applicable fields:
Title, GamsName, Value, Tasks, Style
Control optic:
Possible value:
true, false
User action:
tick / untick box with mouse
Example definition:
Output to GAMS:
Wolfgang Britz, Version July 2014
25
GGIG Graphical Interface Generator - Documentation
Singelist
Purpose
Used for 1 of n selections. Used in cases where more then 2 mutually exclusive
values for a setting are available.
Applicable fields:
Title, GamsName, Value, Options, Tasks, Style
Control optic:
Note: Drop down list will appear if the user clicks on arrow.
Possible value:
Defined by options field
User action:
tick / untick one of the selection possibilities with mouse
Example definition:
Output to GAMS:
Note: The user cannot deselect, i.e. one of the options is always active.
Wolfgang Britz, Version July 2014
26
GGIG Graphical Interface Generator - Documentation
filesel
Purpose
Used for 1 of n selections of a list of files. That is e.g. interesting when the user can
chose from a list of pre-existing scenario definitions in GAMS files.
Applicable fields:
Title, GamsName, Value, Options, Tasks, Style
Control optic:
Note: Drop down list will appear if the user clicks on arrow.
Possible value:
Defined by the file selection string in options field, .e.g
..\\gams\\pol_input\\cge_*.gms. The file extension fill be automatically removed from
the items.
User action:
tick / untick one of the selection possibilities with mouse
Example definition:
Output to GAMS:
Wolfgang Britz, Version July 2014
27
GGIG Graphical Interface Generator - Documentation
fileselDir
Purpose
Used for 1 of n selections of a list of files, potentially from sub-directories. That is e.g.
interesting when the user can chose from a list of pre-existing scenario definitions in
GAMS files.
Applicable fields:
Title, GamsName, Value, Options, Tasks, Style
Control optic:
Note: Drop down lists will appear if the user clicks on arrow.
Possible value:
Defined by the file selection string in options field, .e.g
..\\gams\\pol_input\\cge_*.gms. The file extension fill be automatically removed from
the items.
User action:
tick / untick one of the selection possibilities with mouse
Example definition:
Output to GAMS:
Wolfgang Britz, Version July 2014
28
GGIG Graphical Interface Generator - Documentation
Multilist / MultiListNonZero
Purpose
Used for m of n selections, i.e. in cases where features are not mutually exclusive.
Multilist allows m = 0, i.e. also empty selection. MultiListNonZero requires m > 0, i.e. at least
one element must be selected.
Applicable fields:
Title, GamsName, Value, Options, range, Tasks, Style
Control optic:
Notes:
left hand side: range=0
Drop down list will appear if the user clicks on arrow, and number of elements >
right hand side: range = 3
range and range<>0
Possible value:
Defined by options field
User action:
tick / untick box fields in the control with mouse
Example definition:
Wolfgang Britz, Version July 2014
29
GGIG Graphical Interface Generator - Documentation
Output to GAMS:
Selection groups
The multilist control features a pop-up menu which without selection groups only allows to
clear the selection or to select all items (see below).
The control definition files can define selection groups which allow for groups of items to be
selected, added or removed from the selection. Each selection group starts with a forward
slash “/” following by the name of the group. The items are and the next selection group are
then comma separated as shown below. Commas can be skipped if the next item is on a
different line.
Wolfgang Britz, Version July 2014
30
GGIG Graphical Interface Generator - Documentation
Wolfgang Britz, Version July 2014
31
GGIG Graphical Interface Generator - Documentation
Radiobuttons
Purpose
Used to select for several items a one of n-settings, outputted as two-dimensional set
Applicable fields:
Title, GamsName, Value, Options, Rows, Tasks, Style
Control optic:
Possible values:
Defined by range field
User action:
Select value by pressing up/down arrows or by editing the field with keyboard
Example definition:
Wolfgang Britz, Version July 2014
32
GGIG Graphical Interface Generator - Documentation
Output to GAMS:
Wolfgang Britz, Version July 2014
33
GGIG Graphical Interface Generator - Documentation
Slider
Purpose
Used to select one integer value from a given range of allowed ones. The increments
must also be defined.
Applicable fields:
Title, GamsName, Value, Options, range, Tasks, Style
Control optic:
Note: Selectable values will be restricted according to the increment definition.
Possible values:
Defined by range field
User action:
Select value by pressing up/down arrows or by editing the field with keyboard
Example definition:
Output to GAMS:
Wolfgang Britz, Version July 2014
34
GGIG Graphical Interface Generator - Documentation
Spinner
Purpose
Used to select a integer value from a range of allowed ones. The increment is always
unity. Could be internally used as a floating value, e.g. by using it for shares in
percentages terms.
If the range of the spinner is large, it might be hard for the user to pick a specific value. In that
case, a spinner is easier to control.
Applicable fields:
Title, GamsName, Value, Options, range, Tasks, Style
Control optic:
Possible value:
Defined by range field
User action:
Select value by moving slider
Example definition:
Output to GAMS:
Wolfgang Britz, Version July 2014
35
GGIG Graphical Interface Generator - Documentation
Table / TableSimple
Purpose
Define a table with floating point values passed to GAMS.
Applicable fields:
Title, GamsName, Value, Columns, Rows, Dim3s, Range, Tasks, Style
Control optic:
User action:
Edit single fields with numerical values. Cut/Paste via clipboard possible
Wolfgang Britz, Version July 2014
36
GGIG Graphical Interface Generator - Documentation
Example definition:
Notes:
The range field might comprise several tuples of “low-up-increment” which will then
be assigned to the columns of the tables. If there is only one tuple, it will be used for
all columns.
If a range is given, a spinner will be used as the cell editor and values outside the range
will be rejected.
Wolfgang Britz, Version July 2014
37
GGIG Graphical Interface Generator - Documentation
Output to GAMS:
Wolfgang Britz, Version July 2014
38
GGIG Graphical Interface Generator - Documentation
Style options
Most of the controls allow for a style tag. Currently, only the following two options are
supported:
1. Left alignment
2. Putting the control in the same line below the last one
Which leads to the following:
Starting GAMS from GGIG
GGIG allows starting the GAMS project directly from the interface, either in compile or run
mode. A break request can also be sent to GAMS (“stop GAMS”):
Once started, the GAMS project routes its output to the console back to lower right part of the
interface:
Wolfgang Britz, Version July 2014
39
GGIG Graphical Interface Generator - Documentation
The pane with the content can be scrolled by a right mouse click in the pane to open a popup
menu. If an editor is added under “opther options”, the GAMS and the listing file can be
opened as well:
The pane can hence be “frozen” so that e.g. the status of a model solve can be inspected while
the project continues to run. In order to successfully start a project, the ini file for GGIG must
comprise the information where the GAMS executable can be found, but also where the
GAMS code of the project to start is stored.
Wolfgang Britz, Version July 2014
40
GGIG Graphical Interface Generator - Documentation
General interface settings
The interface has a few standard settings which can also be accessed via the “edit settings
dialogue”. These are:
Certain file locations: the directory where GDX files for results are assumed to be
stored (resDir), and three directories which can be used to adjust the specific model
application: the root of the GAMS file (workDir in GAMS), called modelDir, a
directory for restart files and one for data files.
Note: The name of the system (here TRIMAG) is defined in the „GGIG.INI“ file
Default settings can be defined in the XML file:
GAMS and R related settings
Wolfgang Britz, Version July 2014
41
GGIG Graphical Interface Generator - Documentation
These settings can also be defined in the XML file:
SVN related settings
The SVN settings can be used to perform checkout and updates in cases where the model
code with related data, restart files or result files is under versioning control on a SVN server.
If the model is not under version control, the settings “svn=no” renders the tabbed plan
invisible.
Default settings can be defined in the XML file:
Including credentials:
The credentials are obfuscated. In order to edit them, use the dialogue and copy the settings
from the generated ini file to the XML.
Wolfgang Britz, Version July 2014
42
GGIG Graphical Interface Generator - Documentation
Settings linked to the exploitation tools
The standard table file can be defined in the XML:
Wolfgang Britz, Version July 2014
43
GGIG Graphical Interface Generator - Documentation
Meta data handling
Why meta data?
Meta data are data about data. In many GAMS projects, it is impossible or cumbersome to tell
exactly based on which shocks and settings results of a model run had been generated. That is
due to the fact that run specific settings are not stored at all or not stored together stored with
the results of the run. Later on, result users are often left guessing what exactly the settings
underlying the run might have been.
In order to overcome that problem, the GGIG, drawing on CAPRI GUI concepts, passes all
interface settings, plus the user name and the current time, forward to GAMS in one SET
called META.
A correctly defined interface with GGIG should allow to steer all run specific settings. If that
is the case, the meta data generated by GGIG will provide an exact and sufficient definition of
all run specific inputs, ensuring that all relevant meta data about a run are stored along with
quantitative results in the same GDX file. Accordingly, GDX files shipped to other desks or
committed e.g. to a SVN server still carry all necessary information to identify exactly the
run.
Technical concept
The meta handling is straight forward. The state of the different control is mapped into pairs
of set elements and related long text descriptions as shown below from an example
application:
and, might with one GAMS statement as shown below, stored in the GDX files along with the
results:
Wolfgang Britz, Version July 2014
44
GGIG Graphical Interface Generator - Documentation
The user might then select some scenario:
And then, by pressing “show meta”, view the settings used for these scenarios:
Wolfgang Britz, Version July 2014
45
GGIG Graphical Interface Generator - Documentation
Exploitation
The basic strategy of the GGIG exploitation tools roots in the CAPRI exploitation tools,
which require that all model results are stored on an up to 10 dimensional cube, which is then
stored in a GDX as a sparse matrix. Additional dimension can be added if several files are
loaded, e.g. to compare scenarios or years. A specific XML dialect defines views (filters,
pivots, view types) into the cube, and allows the user to load several result sets – typically
from different scenarios – in parallel.
If no table definition file is present, GIGG offers a GDX viewer which some interesting
possibilities not found in the standard GDX viewer (such as numerical sorting, statistics,
selections). For details, the CAPRI GUI user manual should be consulted.
The software behind the mapping viewer and the CAPRI
exploitation tools
Reading the following chapter is not necessary to work with the GUI, but rather intended for a
reader who is technically interested. The original software implementation of CAPRI was
based on software available at ILR at that time and comprised a DBMS realized in
Wolfgang Britz, Version July 2014
46
GGIG Graphical Interface Generator - Documentation
FORTRAN with C/C++ code for the GUI. The very first maps in CAPRI (in 1998) were
produced with an MS-EXCEL mapping plug-in which was at that time a cost-free add-on.
However, moving the data to EXCEL and then loading them in the viewer was not a real
option for the daily debugging work on the data base and the model. Therefore, shortly before
the first CAPRI project ended in 1999, a JAVA applet was programmed by W. Britz which
was able to draw simple maps from CSV-Files, automatically produced by the CAPMOD
GAMS code. That code with slight modification remained active for quite a while, and some
of the features are still to be found in the current mapping viewer. Then for a while, the
exploitation tools were based on XML/XSLT+SVG and a mapping viewer in SVG was
realized. However, the XML solution had the big disadvantage of requiring a large amount of
single ASCII input files, and was not really performant when complex pivoting was used.
Therefore, the next evolution step was a pure Java GUI with direct access to GDX files which
is the current state of the art in CAPRI. GDX files are an internal file format used by GAMS
which allows a rather efficient I/O for large sparse tables. An API library allows to access
GDX files from other applications. That design has the obvious advantage to be firstly based
onto the portable JAVA language. Secondly, as no external DBMS is used, it is possible to
use CAPRI by solely executing GAMS programs. CAPRI might hence run on any system
supported by GAMS, without the need to install additional software.
The GUI consists of three rather independent components. Firstly, a GUI to control the
different work steps of CAPRI. The code deals mostly with defining GUI controls (button,
scroll-down lists etc.) to manipulate properties of CAPRI tasks, and then to start them as
GAMS processes. That part has been thoroughly refactored with the revision of 2008. A
second important part is the CAPRI exploitation tool, which are basically generic enough to
be used for other modeling systems as well. The current refactoring left most of the code
untouched compared to the code developed since 2006, with the exemption of the graphics
which is now based on the JFreeChart library. However, as discussed below, in 2007, the
mapping viewer was refactored in larger part to host the 1x1 km grid solution developed in
the CAPRI-Dynaspat project. The exploitation tool is a rather unique solution to exploit result
sets from economic models based on the definitions of views which are defined in XML
tables. It combines features from DBMS reporting, data mining, spreadsheet functionalities
and GIS into one package. And thirdly, there are some specialized pieces as the HTML based
GAMS documentation generator which are linked into the GUI.
Wolfgang Britz, Version July 2014
47
GGIG Graphical Interface Generator - Documentation
CAPRI tasks as business model
A core concept in the new layout is a business object called AgpTask. Technically defined as
an interface, such an object represents a work task in the overall CAPRI system such a run of
CAPREG to build the regional data base. The interface requires getters and setters for
properties such as baseYear, simYear or MemberStates. The setters can be accessed either by
a GUI interface or by the batch execution facility, formally by a class implementing the
interface AgpTaskHandler.
Most tasks are GAMS executable tasks according to their isGams property. These tasks also
provide access to the name of the related GAMS program via getGamsProgramName. Each
of these tasks has also a method called generateIncludeFile which generates the specific socalled include file in GAMS format for that task.
The objects also know about the main GDX file they are generating via getGdxResultFiles.
Related to that, they allow setting the logical names of the data dimension in the result data
set via setDimNames and setXMLTablesDims.
Once the properties of a task had been defined, their logical consistency can be checked by
invoking the method checkSettings. Check settings returns a string with a description of the
first error encountered.
That layout eases dramatically the update process of CAPRI. Definition of new tasks or
changes to existing ones will generally not require changes in the GUI, but simply creates the
necessity of either implementing a new object with the required methods or updating an
existing one.
Execution of tasks via a GamsStarter and GamsThread
Execution of tasks with the property isGams is handled by a GamsStarter object. An instance
of GamsStarter lets the task write out the necessary include file(s) in GAMS format to
generate a specific instance of the specific task (a simulation run for a specific scenario,
simulation year, with the market model switched on or off …). A GamsStarter also knows
about the working directory or other specific GAMS settings as the scratch directory. It may
generate a pipe for the GAMS output to the console to show it in a GUI.
An AgpTask can be executed by a GamsStarter who will then create a GamsThread. A
GamsThread extends the SwingWorker interface of Java so that it may communicate with the
normal event queue of JVM. A GamsThread can be gracefully terminated by sending a
Wolfgang Britz, Version July 2014
48
GGIG Graphical Interface Generator - Documentation
SIGNT signal to the GAMS process. That will let the GAMS execution stop at a specific
point determined by the GAMS engine itself and start the finalisation handling of GAMS as
well as the removal of intermediate files and directories.
Refactoring the mapping part
When the 1x1 km grid layer was added to CAPRI during the CAPRI-Dynaspat project it
became obvious that the existing JAVA code to produce maps needed some revision,
especially regarding the way the geometry was stored. In this context, the question of using an
existing GIS independently from CAPRI or the use of existing GIS classes plugged-into the
CAPRI GUI was raised again and some tests with open-source products were undertaken. A
stand-alone GIS as the sole option was certainly the less appealing solution. Firstly, it would
have required producing rather large intermediate files and would have left the user with the
time-consuming and often error prone task of exporting and importing the data. Secondly, the
user would need to switch between two different programs and GUI standards. And thirdly,
all the usual problems with installing and maintaining additional software on a work station
would occur. However, as indicated later, the GUI naturally allows passing data over to
external applications and does hence not prevent the user from using a full-fledged GIS
solution.
The main points taken into account during the search of a map viewing solution for CAPRI
were: (1) possibility to import data from the CAPRI GUI efficiently, (2) user-friendliness,
(3) performance and (4), in the case of plug-in libraries, expected realization and maintenance
resource need, and naturally (5) license costs. It turned quickly that an ideal product was not
available. Some of the products were not able to allow for the necessary link between newly
imported tables with region codes and an existing geo-referenced geometry. Others had very
complex user interfaces or produced run-time errors, took ages to draw the HSMU maps or
were quite expensive. From the different options tested, the gvSIG
(http://www.gvsig.com/index.php?idioma=en) freeware GIS seemed to be the only option,
allowing the user to import data from a CSV – which must however be semi-colon delimited
– and join one of the columns to a shapefile. At least the version installed at that time was
however running not very stable.
In the end, it was decided to build on the existing code base and let Wolfgang Britz write the
additional code “on demand”. The main advantage of that approach is the fact that the
mapping view is transparently integrated in the CAPRI GUI, it is sufficient to switch from
Wolfgang Britz, Version July 2014
49
GGIG Graphical Interface Generator - Documentation
“Table” to “Map” in a drop-down list to produce a colored map, and that user demands
regarding additional functionality may be and had been added, taking into account the specific
needs of the CAPRI network.
Compared to ArcGIS, where the EU27 HSMU geometry plus codes and centroids requires
about 340 Mbytes, the CAPRI version requires about 27Mbytes solely. Reading in the CAPRI
GUI is somewhat slower compared to ArcGIS due to unzip on demand. The actual drawing
operation takes about the same time as in ArcGIS (about 11 second for the full data set).
Classification in Java is typically faster.
Views as the basic concept
The concept of the CAPRI exploitation tools is centred on the idea of a view. Content wise,
each view may be understood as showing one or several indicators relating to results of
CAPRI working steps, e.g. environmental effects of farming, prices or market balances. Each
view thus:
extracts a certain collection of numerical values
labels them so that they carry information to the user (long texts, units)
chooses a matching presentation – as a table, map or graphic
and arranges them in a suitable way on screen.
The views can be linked to each other, allowing a WEB like navigation through the data cube.
Views can be grouped to themes. The user may open several views in parallel, and he may
change the views interactively according to his needs, e.g. switch from a map to a tabular
presentation, or change the pivot of the table, sort the rows etc.
Internally, each view is stored in an XML schema. Technically, a view can be understood as a
combination of a pre-defined selection query, along with reporting information. The XML
schema allows to attach long texts, units and tooltips to the items of a table, and thus to show
meta-data information to the user. The XML schema hence replaces look up tables in a
DBMS. It may equally store information regarding the pivoting, the view type (table, map,
different graphic types), and for maps, classification, color ramp and number of classes. The
views can be grouped into logical entities, and are shown as a popup menu to the user.
Wolfgang Britz, Version July 2014
50
GGIG Graphical Interface Generator - Documentation
Tabular views may feature column and row groups. Empty columns and rows can be hidden;
tables can be sorted by column, with multiple sort columns supported. Numerical filter can be
applied to columns.
User
supplied
filters
View
definitions
GUI:
Selection/pivot…
GDX
…
Java
GDX
Data model
The underlying data model is very simple and straightforward. All data are kept in one large
multi-dimensional data cube, and all values must either be float values or strings. Currently,
only read-only is supported. Each data dimension is linked to a vector of string keys. Those
keys are the base for the filter definitions. Currently, data cubes with up to six dimensions are
used (regions – activities – items – trading partners – years – policy scenarios). The data
storage model is equally optimised to the specific needs. As only float values or strings are
supported, all data can be stored as one primitive array of either floats or strings. To allow fast
and efficient indexing, a linear index is constructed from the multi-dimensional data cube, and
the non-zero data and their indices are stored in a hash table. That renders data retrieval very
fast. All data are loaded in memory at initialisation time: For moderately long linear indices
about 10 Bytes are required to store a non-zero float and its index as an integer. If the
maximal linear index is very large, the index is stored as a long and the storage need goes up
Wolfgang Britz, Version July 2014
51
GGIG Graphical Interface Generator - Documentation
to about 16 Bytes. For moderately sized data cubes, 20 Million numbers can hence be hosted
in about 200 Mbytes.
The data are read from a generic file format generated by GAMS (General Algebraic
Modelling System, a commonly used software package in economic modelling) called GDX,
the software package on which CAPRI is based. Access to GDX is handled via an API
provided by GAMS.
Client based solution
Technically, the exploitation tool is completely client based. That reflects the specific user
profile of the CAPRI modelling system where the exploitation tool is integrated with an
economic model and tools building up its data base. The main aim of the tool is to support
forward looking policy analysis. For this purpose users will create their own scenarios and in
some cases even own variants of the export data, which will lead to processes requiring
considerable processing and storage resources. A client-server solution where the production
process and data storage would need to be hosted on a web server is therefore not a preferred
solution, also as users will often develop variants of the modelling system by code
modification in GAMS, and contribute to its development. The structure of the data driver
would however very easily support linkage to a network or WEB based data bases. It should
however be noted that the data base and GAMS code are managed via a Software versioning
system, which is a kind of client-server environment.
The geometry model
The mapping viewer of CAPRI is based on very simple and straightforward concepts. First of
all, it basically supports solely polygon geometries not comprising holes, line strings
(interpreted as rivers) and points for labelling. The storage model is optimised to host
rectangles, and is especially efficient if the polygons vertexes are all points in a raster. The
topology is not read from a shapefile, but stored in a generic rather simple format. However, a
shapefile interface to generate the generic format is available. The vertices are stored in x,y
coordinates, already projected in a rectangular coordinate system, and the viewer does not
deal with the geographic coordinate system, but simply scales the rectangular coordinates in
the viewport. The viewer in its current version solely supports one layer of quantities. Those
restrictions naturally allow reducing memory needs, and, thanks to the rather simple data
structures, also rather allow performing drawing operations. It should be noted that the JIT
compiler of JAVA is indeed rather fast.
Wolfgang Britz, Version July 2014
52
GGIG Graphical Interface Generator - Documentation
The biggest topology currently handled simultaneously covers an intersection of Corinne
Land Cover, slope classes and Soil Morphological Units and comprises around 2.7 Million
polygons for EU27. As the majority of the polygons are rectangles, not more then 6-7 Million
points needed to be stored. The topology handler and the drawing routines separate rectangles,
for which only the two outer points are stored, from polygons, for which the vertices and
centroids are stored.
The viewer is written in Java. There are two variants. One is a stand-alone version of the
viewer realised as an applet. It reads from an internal portable binary data format, and java
classes, data and geometry can be packed into one jar file, e.g. to ship it to a client. The
second version is transparently integrated in the GUI of the CAPRI modelling system.
Swing is used for the GUI in order to profit from the most simple implementation, the viewer
has been written completely new, and is not based on existing GIS libraries. Even certain
standard JAVA classes as e.g. for hash tables, have been replaced by own implementations, to
reduce implementation overhead. Some care was given to support flexibility in classification,
given that only quantities are supported, so that the tool covers natural breaks, quantiles, equal
spread, mean standard and nested means. Area weighting is supported as well.
In order to export data to other applications, the tools support first of all tab delimited
clipboard export, allowing import e.g. into EXCEL. Maps can be exported as JPEGs over the
clipboard. Alternatively, the user may export to external file, in CSV format, DBF, to MS
Access or to GAMS. DBF export will generate a second file comprising meta data.
The exploitation tools of CAPRI build on a rather simple structure. Each CAPRI work step
stores its results as a GAMS parameter, representing a multi-dimensional sparse cube which is
stored as a GDX file. The exploitation loads the non-zeros from one or several GDX files into
memory. However, given the length of the different dimensions and the use of short codes,
the user would be typically lost on his own in the large tables. The XML definition file is the
equivalent of a collection of “SQL queries” as it defines views which combine filters in the
dimensions of the cube with information on how to show the results (pivot, table, graph or
map).
Views as the basic concept for exploitation
The concept of the CAPRI exploitation tools is centred on the idea of a view. Content wise,
each view may be understood as showing one or several indicators relating to results of
Wolfgang Britz, Version July 2014
53
GGIG Graphical Interface Generator - Documentation
CAPRI working steps, e.g. environmental effects of farming, prices or market balances. Each
view thus
extracts a certain collection of numerical values
labels them so that they carry information to the user (long texts, units)
chooses a matching presentation – as a table, map or graphic
and arranges them in a suitable way on screen.
The views can be linked to each others, allowing a WEB like navigation through the data
cube. Views can be grouped to themes. The user may open several views in parallel, and he
may change the views interactively according to its needs, e.g. switch from a map to a tabular
presentation, or change the pivot of the table, sort the rows etc.
Internally, each view is stored in a XML schema. Technically, a view can be understood as a
combination of a pre-defined selection query, along with reporting information. The XML
schema allows to attach long texts, units and tooltips to the items of a table, and thus to show
meta-data information to the user. The XML schema does hence replace look up tables in a
DBMS. It may equally store information regarding the pivoting, the view type (table, map,
different graphic types), and for maps, classification, colour ramp and number of classes. The
views can be grouped into logical entities, and are shown as a popup menu to the user.
Tabular views may feature column and row groups. Empty columns and rows can be hidden;
tables can be sorted by column, with multiple sort columns supported. Numerical filter can be
applied to columns.
Wolfgang Britz, Version July 2014
54
GGIG Graphical Interface Generator - Documentation
User
supplied
filters
View
definitions
GUI:
Selection/pivot…
GDX
…
Java
GDX
Why a XML definition files for views?
The exploitation tools of CAPRI build on a rather simple structure. Each GIGG task can store
its results as GAMS parameter representing a multi-dimensional sparse cube and save it on
disk as a GDX file. The exploitation loads the non-zeros from one or several GDX files into
memory. However, given the length of the different dimensions and the use of short codes,
the user would be typically lost on his own in the large tables, which can comprise several
million non-zero data and basically an unlimited amount of zero cells. The XML definition
file defines the views explained above, and allows a structured and user-friendly way to
exploit the results of the different work steps. It also separates raw data from the views and
from the GUI code itself, which requires relatively little information about the underlying data
and their structure besides what is provided by the definition files. XML is an industry
standard to store structured information in non-binary text files, which explains why that
format was chosen.
Wolfgang Britz, Version July 2014
55
GGIG Graphical Interface Generator - Documentation
The structure of the XML definition files for the views
General comments
It is not intended to let the user edit this file, but in order to have a complete documentation,
some information about the structure is included in here. The XML parser used by the GUI’s
java code is not a general XML parser, as tests revealed that the java base general XML
parsers were rather slow. For the XML file used for the definition the views (the standard
name is “tables.xml”), using a simple parser has some consequences: only one tag is allowed
per line, and tags are not allowed to span several lines. Also, error handling is so far only
rudimentary as users are not supposed to edit that file.
The table viewer currently supports up to 6 dimensions, which are named as:
1. Region
2. Activity
3. Product
4. Scenario
5. Year
6. Dim5
in the XML-file. These “logical dimensions” can be mapped to any dimension of the original
data cube read in by the java code. Pivoting can then be used to map these “logical”
dimensions to viewport dimensions seen by the user such as the columns and rows of a table.
Necessary tags for tables
A table definition is found between the <table> … </table> tags. It must at least define:
The table theme, such as <theme>Welfare</theme>. The themes are shown as a dropdown menu in the exploitation tools.
The table name, such as <name>Welfare comparison between Member
States</name>. The names must be unique.
The items of the tables.
The order of the themes and table names will define their order in the drop-down menu.
Wolfgang Britz, Version July 2014
56
GGIG Graphical Interface Generator - Documentation
Defining the items of the table
The underlying idea of having a “hand defined” list of items for one of the definitions stems
from the observation that most tables have only a very limited number of columns, and that
these are normally formatted with care regarding their text comprised. Each table therefore
requires a definition of items, but the items must not necessarily be mapped in the column
viewport.
<item>
<itemName>Money metric</itemName>
<key>CSSP</key>
<unit>Mio Euro</unit>
<longtext>Consumer welfare measurement: expenditures necessary to reach utility in
current simulation under prices of reference scenario</longtext>
<link>Money metric</link>
</item>
An item definition is enclosed in the <item>…</item> tags. It must at least comprise a <key>
and an <itemName> tag. The case sensitive key must match the symbol identifier as found in
the GDX file, whereas the itemName can be freely chosen.
Facultative tags are:
<unit>: a physical unit shown in table
<longtext>: a text shown when the mouse hovers of the column
<link>: a link to another table for the table cells under the column.
<colormode>: the color mode used when a map is drawn for the item. The following modes
are supported:
GYR Green Yellow Red
RYG Red Yellow Green
GR
Green Red
RG
Red Green
BG
Blue Green
Wolfgang Britz, Version July 2014
57
GGIG Graphical Interface Generator - Documentation
GB
Green Blue
WB
White Black
BW
Black White
LD
Light Blue Dark Blue
DL
Dark Blue Light Blue
<eval>: the item is calculated from other items, e.g. <eval>VAL + VAL[*,BlueBox,*,*,*,*]
+ VAL[*,DeMinimis,*,*,*,*]</eval>
In order to define from which dimension they are taken, the user can set either:
<itemDim>region</itemDim>
Deprecated is the old style:
<isActivity>NO</isActivity>
Which means that the table loops over the products, and the items refer to the activity
dimension. A typically example is a table with market balance elements: items such as
“FEDM” are found in the columns of the CAPRI tables where also the activities are stored.
Consequently, the table will loop over the products, and not over the activities. Alternatively:
<isActivity>YES</isActivity>
allows only items from the product dimension, and lets the table loop over the activities. A
typical example provides a table showing activity levels, yield or economic indicators for the
production activities.
Additional tags: <subTheme>
Allows to introduce sub-themes in the table selection.
Additional tags: <defpivot>
Defines the default pivot used for the table. The pivot string consists of characters. The first
character position is for the table row blocks, the second for the table rows, the third for the
column blocks and the last for the columns. The logical dimensions are labelled with the
following characters:
A
Activity
D
Dim5
Wolfgang Britz, Version July 2014
58
GGIG Graphical Interface Generator - Documentation
I
Items
M
Activity and Product merged
P
products
Q
Year and dim5 merged
S
Scenario
R
regions
X
Region and dim5 merged
5...9
Dim5 ... Dim9
The definition <defpivot>0R0S</defpivot> thus means: regions are in the rows, scenarios in
the columns. The definition <defpivot>PISR</defpivot> puts the products in the row blocks,
the items in the rows, the scenarios in the column blocks and the regions in the columns.
Additional tags: <defview>
Defines the default view used for the tables, the list of default views is equal to what the user
can select in the drop-down box:
Additional tags: <COO>
This tag defines the geometry to use for maps. Currently, the following geometry files are
available:
NUTSII.zip
NUTS 2 geometry for countries covered by the supply module
MS.zip
NUTS 0 geometry for the countries covered by the supply module
Wolfgang Britz, Version July 2014
59
GGIG Graphical Interface Generator - Documentation
RMS.zip
Global geometry for the regions with behavioural functions in the market
model
RM.zip
HSMU.zip
Global geometry for the trade blocks in the market model
1x1 km pixel clusters for EU 27 without Malta and Cyprus
There are also 1x1 km pixel clusters for individual Member States, but these are internally
passed to the viewer when only one country is shown.
Alternative texts for the dimensions
Normally, the names for the dimensions are passed in the view by Java. However, their name
can be changed by:
<regionText>….</regionText>
<activityText>…<activityText>
<regionText>…<regionText>
<productText>…<productText>
<scenText>…<scenText>
<dim5Text>…<dim5Text> ... <dim9Text>…<dim9Text>
<yearText>…<yearText>
That text is shown:
As
In the pivot dialogue:
And in gaphics / map titles and the like.
description
above
the
outer
drop-down
selection
boxes:
Additional tags: <clone>
The tag uses the item and other definitions from another table, and can be used e.g. to show
the same selection in a different pivot or view types, e.g:
Wolfgang Britz, Version July 2014
60
GGIG Graphical Interface Generator - Documentation
The clone tag must immediately follow the name tag, as otherwise, preceding definitions are
lost.
Further tags
There is a longer list of further tags which refer e.g. to definitions of graphs. They are here
only listed with there default settings without a detailed explanation
The following list further tags, partially explained above:
Wolfgang Britz, Version July 2014
61
GGIG Graphical Interface Generator - Documentation
Filters for the elements in the different dimensions
Without filters, all elements found on a logical dimension will be shown to the user in any
table. The exemptions are the items either defined for the product or the activity dimension,
see above. In order to restrict the selection in the other logical dimensions, a selection list can
be defined in the table definition. Take as an example the following XML tag:
<regionSel>MS<regionSel>
It means that the table will only show elements with the tag <region> (see below) which
comprise MS in their <sel> field. The example would refer to the Member States. There is a
specific selection list:
<regionSel>FromDataCube<regionSel>
Which will neglect the elements under <region> as defined in the file, but rather takes any
one found in the data cube. The option was introduced to avoid the necessity to define all
180.000 HSMU codes in the file.
Alternatively, a regex string can be used, e.g.
<dim5Sel>red[0-9]+_regex</dim5Sel>
Wolfgang Britz, Version July 2014
62
GGIG Graphical Interface Generator - Documentation
Attaching long texts and filters to elements
Items for activities, products, regions and dim5 are typically defined in the file, see the
following example:
<region>
<key>SK020038</key>
<itemName>SK020 - FT41 / GT100 - Specialist dairying (FT 41)</itemName>
<sel>[all, RS, SK, FA, SKFA, FT41, GT100, FT41GT100]</sel>
</region>
The definitions for one item are enclosed in the tag (<region>…</region>,
<activity>…</activity>, <product>….</product>, <dim5>…</dim5>).
The order of the items in the tables is defined by these lists.
Each item has a key, which corresponds to the symbol identifier found in the GDX file. The
keys are case sensitive. The itemName is a long text which is typically shown to the user. The
elements found between the <sel> …</sel> tags can be used as filters in table definitions, or
interactively by the user.
A specific tag is <aggreg>yes</aggreg>. When found for an item in the rows, it will be shown
twice in the table: once in the top part, and then again.
The structure of the GAMS generated gdx files used by the
exploitation tools
The exploitation tools load directly the gdx-files generated by the GAMS processes linked to
the tasks described above. The gdx-files only store non-zero numerical values. The main
content of a gdx file are two types of records. The first type provides a list of all labels used to
identify the numerical data in the gdx file as GAMS does not support numerical indices, but
requires character labels. The list does not distinguish for which data dimensions the labels
are used. They are hence typically a mix of product, activity, region and further labels. The
second type of records belongs to GAMS parameters (scalars, vectors, or multi-dimensional
tables). Each non-zero numerical item in each parameter has its own record. Each of these
records provides the numerical data in double precision (depending on the parameter type
there may be different data stored in one record, as for variables its upper and lower bound,
Wolfgang Britz, Version July 2014
63
GGIG Graphical Interface Generator - Documentation
current level and marginal value etc.), and a vector of indices pointing in the list of codes
described above.
Loading the data from gdx files
The data matrices generated by the different tasks as described above and stored in gdx-files
are typically rather sparse, so that it seemed appropriate to load the data from the gdx-file into
hash tables for exploitation purposes. That is done in a two step procedure. In the first step, all
records from the gdx file are read and vectors of all found indices are stored. The length of
each data dimension is only known when all data records are read, and is equal to the number
of unique indices for each dimension. Once all records are read, the final length of these index
vectors then defines a linear index room for the multi-dimensional table. In a second step, the
records are read again, and the index vectors for each record now allow to define a linear
index in the total table. A hash code is derived from that linear index to store the numerical
values into a hash table. As the number of items to store in the hash table is known
beforehand, a rather simple hash table implementation can be used. If necessary, step one can
be run over several parameters which may be hosted in several gdx files, so that results from
different runs can be merged into one hash table.
As the gdx-files provide lists of all labels used in any parameters stored in that gdx-file, the
index vectors allows to build lists of labels linked for each index in a data dimension. There
exists an additional storage type in the gdx-files to retrieve long-texts to the labels as defined
in GAMS set definitions. However, one label may occur in different sets with different long
texts, and the gdx-file does not store a possibly user defined relation between a data
dimension of a parameter and a specific set, an option termed domain checking in GAMS. In
order to link hence long-texts to the labels used for a specific data dimension, two options are
possible. Firstly, at run time the user may interactively re-establish the link between data
dimensions and specific sets, and thus add long-texts to the labels used on that data dimension
based on his knowledge. Or the relation may be hard coded in the JAVA code.
Menu bar
GGIG allows to add two types of menu items to the menu bar: HTML links and e-mail sent:
Wolfgang Britz, Version July 2014
64
GGIG Graphical Interface Generator - Documentation
Design hints for structured programming in GAMS with
GGIG
Using information passed from GGIG
As seen above, GGIG passes information mostly via $SETGLOBAL settings. That has the
advantage that the GAMS coder is rather free how to use the information. Take the following
example (which could be generated from a slider):
There a several ways to use that information in GAMS code, below are a few examples:
1. Round the setting to an integer with $eval in GAMS and use it in a set definition:
2. Use it in an combined definition and declaration statement for a scalar
3. Use it in assignment
4. Use it for pre-compiler conditions:
5. Use for GAMS program controls
Wolfgang Britz, Version July 2014
65
GGIG Graphical Interface Generator - Documentation
Structure your program by tasks
The following example shows how the concepts of tasks can be used on conjunction with
includes to structure a top-level program
The basic idea is to have a common a part which is shared by many tasks and then blocks
which perform task specific operations. As the “$iftheni ... $endif are working at compile
time, not used code is excluded even from compilation which helps to save memory and
reduce the size of the listing.
One entry points for run specific settings
A typical problem with more complex economic simulation models defined in GAMS is the
steering of scenarios. GGIG pushes the GAMS developer to a code structure where all run
specific settings are entered via the single include file generated by GGIG. That does not
imply that all data for a specific scenario are comprised in the include file. It could e.g. mean
that the user has selected via the interface the include file(s) with specific settings and that the
names of these files are passed via the include file to GAMS.
Wolfgang Britz, Version July 2014
66
GGIG Graphical Interface Generator - Documentation
Scenario editor
The scenario editor is an optional tool to be embedded in a GGIG user interface which
supports the user in setting up run specific include files where the content is not stemming
from GUI controls. That parallel way to define run specific input is typically necessary for
more complex tools where e.g. policy scenarios are defined in GAMS code.
The scenario editor is a “predefined” task which must be named “Define scenario”, e.g.
A related setting stores the directory where the input files are found:
Batch execution
The batch execution facility is a tool which:
Allows executing many different tasks after each other without requiring user input.
Reports the settings used, any errors and GAMS result codes in a HTML page from
which they may queried at a later time.
Ensures that each new run generates its own listing file, which can be opened from the
HTML page.
Allows storing the output of the different runs in a separate directory, while reading
input from unchanged result directories.
The purpose of the batch execution facility is therefore at least twofold. On the one hand, it
allows setting up test suits for the GAMS code of a project such as checking for compilation
without errors for all tasks and different settings such as with and without market parts etc.
Secondly, production runs of e.g. different scenarios can be started automatically. Timer
facilities allow starting the batch execution at a pre-scheduled time. Along with functionalities
to compare in a more or less automated way differences in results between versions, the batch
facility is one important step towards quality control.
Wolfgang Britz, Version July 2014
67
GGIG Graphical Interface Generator - Documentation
Generate GAMS documentation
The GUI comprises a tool to generate for each GAMS file and each symbol used HTML
pages which are interlinked. For details on the code documentation facility see the technical
document “Javadoc like technical documentation for CAPRI” to be found on the Capri web
page under technical documents.
The controls on top allow the user:
To define in which directory the “EXP”, “REF” and “GDX” files are stored which
serve as input into the documentation generator.
To choose the directory where the HTML files will be generated.
To select the tasks covered by the documentation generator.
Background
System such as CAPRI have grown over years to a rather complex (bio-)economic modelling
system. Its code based includes hundredth of single GAMS files, and ten thousands of lines.
Not only newcomers face the challenge to get an overview about dependencies in the huge
code base and to link the technical implementation to methodological concepts and
documentation. On top, the large-scale character of CAPRI often asked for technical features
in the GAMS code which are far from the solution chosen for tiny examples as often
presented in courses, as the wide spread usage of dynamic sets, conditional includes, the
usage of $batcinludes or the application of the grid solve feature.
The task of documenting and keeping an overview of the CAPRI code base is certainly not
eased by the fact that basically any object in GAMS has global scope. The concept of
functions of subroutines underlying many other programming languages with clearly defined
lists of variables passed in and out is not implemented in GAMS. Encapsulation and
modularisation are hence not naturally supported by GAMS. That also renders automated
documentation of the code more challenging compared to other languages.
Since quite a while, CAPRI user community discusses about some refactoring of the code
base on more clearer coding standards with the aim to ease code maintenance, documentation
and further development. That refactoring should also cover standard for in-line
documentation, including a better link to the methodological documentation. The project
CAPRI-RD which will most probably start in spring 2009 will attack some of these tasks in
specific working packages. But clearly, that will only become success if the underlying
Wolfgang Britz, Version July 2014
68
GGIG Graphical Interface Generator - Documentation
concept is generally accepted and implemented by the community of CAPRI developers. That
means that the value added of following coding and documentation standards must be visible
to any developer.
The paper is thought to open the discussion and trigger feedback about how to generate an
easy to maintain and useful technical documentation for CAPRI, based on the example of
JAVADOC (http://de.wikipedia.org/wiki/Javadoc). It is organized as follows. The next short
paragraphs will list desired properties of a technical documentation for CAPRI, followed by a
more detailed discussion of a proposal for an implementation which is working as a prototype.
The last chapter will then show selected screenshots.
Desired properties
The main properties a automated technical documentation of a tool under GGIG such as
CAPRI should fulfil are as follows:
Avoiding redundancies, i.e. information should whenever possible only inputted once.
Specifically, selected comments added in-line in the code should be ported over to the
technical documentation.
Changes in the code structure should possibly be reflected automatically
The documentation must be able to reflect different GAMS projects (CAPMOD,
CAPREG ..) and to differentiate between instances of the same project (CAPMOD in
basline or calibration mode …).
Its biggest part of the technical documentation should be constructed directly from the
code based in an automated way.
It should also collect information from the SVN versioning system
Technical implementation
The main ingredients of the proposed implementation are as follows:
The final format of the technical documentation is based on automatically generated
static HTML pages, following the example of JAVADOC, with some JavaScript to
allow for collapsible trees
The methodological documentation will continue to be edited in Word, and converted
into a PFD-document. It will comprise references to GAMS sources (individual
Wolfgang Britz, Version July 2014
69
GGIG Graphical Interface Generator - Documentation
GAMS files) or even GAMS objects (variables, equations, models, parameters). Those
references can be addressed in the GAMS code, and the HTML pages will allow
opening the PDF-document at the referenced point.
As with JAVADOC, technical documentation should be edited as in-line comments
into the GAMS sources, based on clear in-line documentation standards. Each GAMS
source as a file header with standard properties about the file.
In-line documentation will be mostly based on two levels: the level of individual
GAMS files and on the level of individual GAMS objects. In some cases, that may
require to break down larger programs in smaller pieces, with a clear task and
eventually clear inputs and outputs.
Overview
The following diagram depicts the general approach. The SVN server will host the GAMS
sources, the documentation builder (Builddoc) as a Java application and the PDF with the
methodological documentation. Users synchronize their local work copies with the server. In
order to avoid developing in Java a new parser for GAMS code, the GAMS compiler itself is
used to generate the necessary input for the technical documentation. Two different types of
files for each “project” or “instance” included in the documentation are used for that purpose
so far:
1. So called “REF” files, which list information in which files and in which line symbols
are declared, defined, assigned and referenced. They also comprise information about
long texts and domain of the symbols. The “REF” file can be generated by the
argument rf=filename when GAMS is called (e.g. ”GAMS capmod a=c
rf=capmod.ref”). As the GAMS compiler itself is used, conditional includes and the
like are automatically treated as during execution time. That opens also the possibility
to include the generation of the documentation in the GUI.
2. GDX files generated with an empty symbol list at compile time ($GDOUT
module.gdx; $UNLOAD; $GDOUT). The resulting GDX file will comprise all sets,
parameters etc. used by the programs, and most importantly, the set elements as
declared. The name of the GDX file could be passed as a parameter by the GUI.
Those files hence reflect the actual local code base with any local modification, and can be
generated for a specific instances of the projects (e.g. for CAPMOD with and without the
market module etc.). A JAVA application named Builddoc parses both types of files, on
Wolfgang Britz, Version July 2014
70
GGIG Graphical Interface Generator - Documentation
demand for several projects, and generates static HTML pages. The GAMS code comprises
in-line comments carrying information about references to the methodological documentation,
and the HTML pages comprise calls to the editor to open the actual source code at the local
machine, as well as information about relation between the different GAMS Symbols.
SVN
server
GAMS
sources
Ref-Files
GAMS
compiler
GDX
with symbol
Builddoc
java
PDF
doc
HTML
docs
Editor
Handling of GDX files
The “expand” option generates information about GDXIN and GDXOUT statements as those
are executed at compile time. Consequently, files addressed via GDXIN or GDXOUT are
automatically reported in the documentation system.
Hovever, the file does not comprise information about the “execute_load” and
“execute_unload” executed at run time. That is quite clear, as the statements may be
comprised in program structures as loops or if statements where there are never reached at
execution time. We need hence a work around to report those files in the documentation
system if we would avoid writing a new GAMS parser.
However, “$IF EXIST” statements are taken into account by the expand command. It is
therefore proposed to put an “$IF NOT EXIST” combined with an abort statement before all
“execute_load” statements. As seen in:
Wolfgang Britz, Version July 2014
71
GGIG Graphical Interface Generator - Documentation
By doing so, the program will already at compile exit if one of the necessary files is missing.
That avoids starting a process and eventually overwriting files which then will stop later due
to missing input data. The HTML page will report that sequence as:
The use of “$IF EXIST” in the context of “execute_unload” can only be motivated with the
fact to produce code which is better documented. Here, is it proposed to warn the user at run
time about the fact that the file is overwritten.
Index
Controls to change numerical values, slider 30
Generate GAMS documentation 62
Controls to change numerical values, spinner
Left aligned 35
31
Controls to change numerical values, tables 32
Predefined selection groups in multilists 28
Several controls on one line 35
File selection, subdirectories 26
Wolfgang Britz, Version July 2014
72

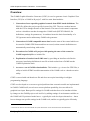
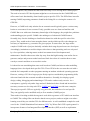
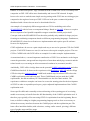
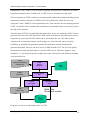
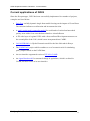
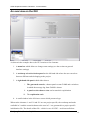
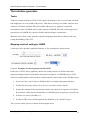
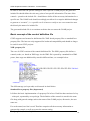
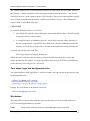
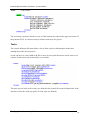
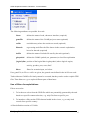
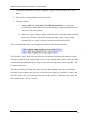
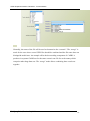
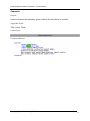
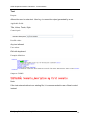
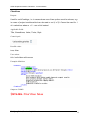
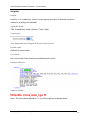
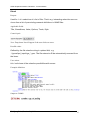
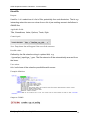
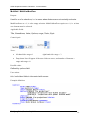
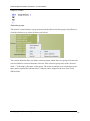
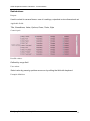
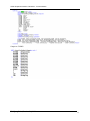
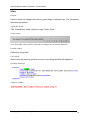
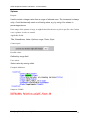
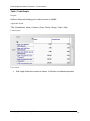
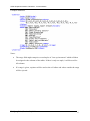
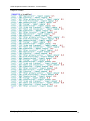
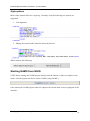
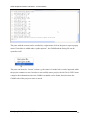
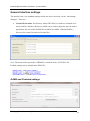
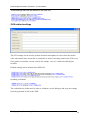

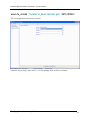
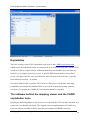
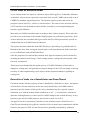
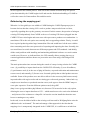
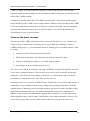
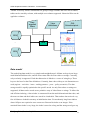
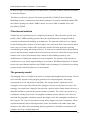
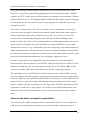
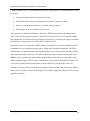
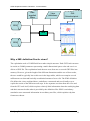
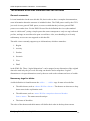
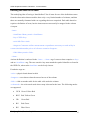

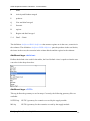
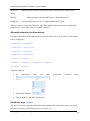
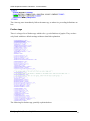
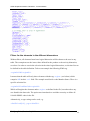
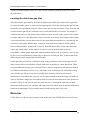
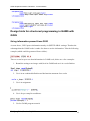
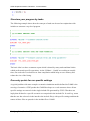
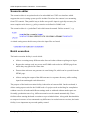
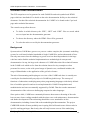
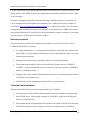
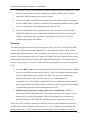
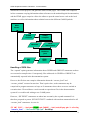
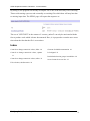


![UT1 Capitole Mag n°86 [PDF - 660 Ko ]](http://vs1.manualzilla.com/store/data/006492599_1-ec8fb949aefb4f4bd39ef7fcb477c505-150x150.png)