1
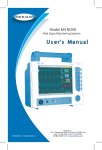
Patient Monitor User Manual (Part II) This Manual is written and compiled in accordance with the IEC 60601-1(Medical electrical equipment Part1: General requirements for safety), and MDD 93/42/EEC. It complies with both international and enterprise standards and is also approved by State Technological Supervision Bureau. The Manual is written for the current Patient Monitor. In case of modifications and software upgrades, you will be advised in due time with a Modification Notice. The Manual describes, in accordance with this Patient Monitor’s features and appearance. as well as the instructions to operate the equipment. Refer to the respective chapters for details. This manual consists of two parts, the part II (this part) only includes the operation instructions for the user interface, while the part I covers almost all other necessary contents in a separate document. The Manual is published in English and we have the ultimate right to explain the Manual. No part of this manual may be photocopied, reproduced or translated into another language without the prior written consent. We reserve the right to improve and amend it at any time without prior notice. Amendments will however be published in a new edition of this manual. All rights reserved. Version of This Manual: V1.3 Issue Date: February 11th, 2014 Marks in the Manual: 0 Warning: must be followed to avoid endangering the operator and the patient. Note: contains some important information and tips about operations and application. Attention: must be followed to avoid causing damage to the monitor. 3502-2560005 I Table of Contents Chapter 1 Overview......................................................................................................................................................... 1 1.1 Features................................................................................................................................................................ 1 1.2 Introduction to Panels........................................................................................................................................... 2 1.2.1 Front Panel................................................................................................................................................ 2 1.2.2 Left and Right Panel.................................................................................................................................. 4 1.2.3 Rear Panel................................................................................................................................................. 5 Chapter 2 Screen Display................................................................................................................................................ 6 2.1 Default Screen Display......................................................................................................................................... 6 2.1.1 Date and Time Setup......................................................................................................................................... 6 2.1.2 Screen Description............................................................................................................................................ 7 2.3 Screen Display for Remote Observation............................................................................................................ 10 2.3.1 Screen Description.................................................................................................................................. 10 2.3.2 NIBP Screen Display............................................................................................................................... 11 2.3.3 Screen Display with ECG Waveforms only............................................................................................ 12 2.3.4 Five Channels Real-time Waveforms and Trends on the Same Screen................................................... 13 2.3.5 Parameter Screen..................................................................................................................................... 14 2.4 ECG Waveform Freezing and S-T Segment Measurement................................................................................ 15 2.4.1 Screen Description.................................................................................................................................. 15 2.4.2 Operating Instructions............................................................................................................................. 16 Chapter 3 Screen Display for System Menu............................................................................................................. 17 3.1 System Menu Screen.......................................................................................................................................... 17 3.1.1 How to Select the Menu Item.................................................................................................................. 17 3.2 SpO2 Trend Data List Screen.............................................................................................................................. 18 3.2.1 Screen Description.................................................................................................................................. 18 3.2.2 Operating Instructions............................................................................................................................. 18 3.3 NIBP Data List Screen....................................................................................................................................... 18 3.3.1 Screen Description.................................................................................................................................. 18 3.3.2 Operating Instructions............................................................................................................................. 18 3.4 Screen Display for Graphic Trend...................................................................................................................... 19 3.4.1 How to View the Graphic Trend.............................................................................................................. 19 3.4.2 Operation Instructions............................................................................................................................. 21 3.5 Screen Display for Waveform Recall................................................................................................................. 21 3.5.1 Operation Instructions............................................................................................................................. 22 3.6 Screen Display for Arrhythmia Event List......................................................................................................... 23 3.6.1 Operation Instructions............................................................................................................................. 23 3.7 Screen Display for System Setting..................................................................................................................... 24 3.7.1 How to Select the System Setup Item..................................................................................................... 24 3.7.2 Parameter Settings................................................................................................................................... 24 3.8 Display Color Settings....................................................................................................................................... 29 3.8.1 How to Change the Parameter Color....................................................................................................... 29 II 3.9 File Management Screen.................................................................................................................................... 29 3.9.1 How to Add a New Patient...................................................................................................................... 29 3.10 oxyCRG Screen................................................................................................................................................ 30 3.10.1 Operation Instructions........................................................................................................................... 30 3.11 Event List Screen.............................................................................................................................................. 30 3.11.1 Screen Description................................................................................................................................ 30 3.11.2 Operating Instructions........................................................................................................................... 30 3.12 MC Calculator.................................................................................................................................................. 31 3.12.1 Medicine Dosage Calculator................................................................................................................. 31 3.13 Tourniquet Function......................................................................................................................................... 32 3.13.1 Operation Instructions........................................................................................................................... 33 Chapter 4 CO2 Monitoring (optional).......................................................................................................................... 34 4.1 CO2 Related Settings.......................................................................................................................................... 34 4.2 CO2 Monitoring Screen...................................................................................................................................... 35 4.3 CO2 Graphic Trend............................................................................................................................................. 37 III Chapter 1 Overview 1.1 Features This patient monitor can be used for monitoring multiple physiological parameters, such as ECG, non-invasive blood pressure (NIBP), oxygen saturation (SpO2), respiration rate (RR), pulse rate (PR), and body temperature. Note: If CO2 module is added, the monitoring will not have these two functions: central networking and body temperature (temperature connector doesn't exist) It is lightweight, easy to carry and operate; 7″ high-resolution (800 × 480 pixel) color TFT (refer to the monitor you purchased) to display multiple traces of signal waveforms for ECG, plethysmogram and respiratory waveform; User-friendly and intuitive display interface, multiple configuration of ECG waveform display: Main monitoring screen view: displays the information of all the waveforms and parameters visually. Observing screen view: heart rate value and SpO2 value display in big fonts, and displays one channel ECG waveform. Seven lead waveforms on one screen view: displays the information of 7 ECG lead waveforms and different monitoring parameters on one screen. Five channel real-time waveforms and two hours’ trends screen view: intuitionistic knowing the physiological status of patient. oxyCRG screen: displays heart rate trend, SpO2 trend, respiration trend or waveform simultaneously on oxyCRG screen, to know the instantaneous the change of physiological parameters of respiration. The cuff can be also used as a tourniquet, which is convenient and practical in use as an additional function, and different cuff pressure can be set according to patient’s condition. Automatic analysis of 20 types of arrhythmia, manual measurement of S-T segment while ECG waveform frozen or automatic measurement while monitoring; Up to 1000 hours trend data storage for parameter of ECG, S-T, TEMP, CO2, SpO2, RESP and NIBP; Up to 2000 groups of arrhythmia events’ can be stored, as well as the corresponding HR , TEMP, CO2, SpO2, and RR; Up to 12000 groups of NIBP measurement can be stored, as well as the corresponding HR, CO2, TEMP, RR SpO2 and PR while the blood pressure measurement is taken, it can be recalled by list table or graphic trend. Up to 60 hours of ECG waveform storage (non-volatile) and can be reviewed; Accurate NIBP measurement with over-pressure protection; Unique pulse oximetry technique achieves accurate SpO2 and PR measurement; Visual and audible alarm, recall of alarm events; Flexible high and low alarm limits setting operation; Real-time monitoring of battery capacity, when the battery power is insufficient, low battery voltage alarm indication will display on LCD screen. Easy to configure the display color, font and waveforms layout for user customization; Protection against defibrillator discharge and resistance against the interference from electrosurgical unit; Pacemaker pulse detection and inhibition functions are available; Patient type can be selected among “Adult”, “Pediatric” and “Neonate” in setup menu; 1 CO2 measuring function is optional; Optional built-in printer can output waveforms and texts. Networking capability for connecting to the central workstation; 1.2 Introduction to Panels 1.2.1 Front Panel Figure 1.1 Front Panel Note: The appearance described in this manual may be a little different with the monitor you purchased, for example, the operation keys may be located at the right side of the front panel. But the operating procedure is the same. Therefore, please refer to the monitor in your hand for details. 1. Power switch: Press it for 3 seconds to start the monitor or turn off the monitor. 2. 3. ~-AC power indicator: When it is light it means that AC power supply is being used -Built-in DC power indicator: When both AC and DC indicators are on, it means that AC power supply is applicable, and the battery is being recharged. If only DC indicator is on, it means that the battery is being used. 4. ECG lead: Click it to shift the ECG monitoring circulatory among Ⅰ, Ⅱ, Ⅲ, AVR, AVL, AVF and V. z When the option of Print in the System Menu is ON, the ECG lead Key will be changed into Print Press this key to print different waveform on different screen. z In the Initial Screen, press this key to print Lead II ECG waveform and Waveform 2 which can be selected in the System Menu. z In the Data List Screen, press this key to print NIBP data list. z In the Observing Screen, press this key to print Lead II ECG waveform and Waveform 2. z In the 7 leads on the Same Screen, press this key to print Lead II ECG waveform and Waveform 2. 2 z In the SpO2 Data List Screen, press this key to print SpO2 data list. z In the Graphic Trend Screen, press this key to print trend graph. z In the System Parameter Setting Screen, press this key to print the system parameter setup. z In the Recall Screen, press this key to print recalled data list or current ECG waveform and arrhythmia waveform. z In the Arrhythmia Screen, press this key to print arrhythmia list or current ECG waveform and arrhythmia waveform. 5. Alarm silence: Press key to set or activate the system alarm. In the monitoring screen, press “Alarm” to set the alarm timer. There are four options of alarm silent time: 2 minutes, 5 minutes, 10 minutes and 20 minutes. The time shows up on the upper left corner of the screen. When the alarm timer is activated, the system begins to count down. If alarm occurs during that period, the system alarm will be activated automatically and the monitor will give alarm. If there is no alarm during that period, when the set time has passed, the system alarm will be activated as well. When the monitor alarms, press key to suspend the alarm and set the alarm silence time. 0 DO NOT silence the audible alarm or decrease its volume or patient safety could be compromised. 6. Freeze: Press the key to freeze/unfreeze ECG waveform or the waveforms of ECG, SpO2 and RESP according to the device setting, and enter into ST segment measurement screen for analysis (on Observing Screen). 7. NIBP: Press it to start or stop NIBP measurement. 8. DISP: Click it to shift the display modes or return to the Main Screen from other screens. Press it to shift between Main Screen and Display 2 Screen which can be set in System Menu screen. 9. Navigation Knob: It is the major operating key of the system, which can be used to select functions or parameters. Press and release it to shift the screen and to confirm the function or other operating tips. 10. Alarm indicator: Indicator Color Alarm Level Alarm Event Red flashing High priority alarm Parameter exceeding the limits, asystole or apnea Yellow flashing Middle priority alarm Leads and probe off, VE RONT and SVE RONT Yellow light Low priority alarm Other arrhythmia events Green light Normal 3 1.2.2 Left and Right Panel Figure 1.2 the left panel Figure 1.3 the right panel Different ports are located in different positions of the monitor for operating convenience. The cable and transducer ports are at the left panel, shown in Figure 1.2. 1. SpO2: SpO2 probe connector 2. NIBP: NIBP hose connector 3. TEMP: TEMP probe connector (CO2 : CO2 probe connector) 4. ECG/RESP: ECG cable connector 5. Symbol definition With type BF applied parts With type CF applied part and applicable during the defibrillator is used. Caution. Please read the manual for details. The power supply socket and ports are at the left panel, shown in Figure 1.3. 1. 2. 3. :Power supply socket(DC input) :Serial communication port which is used to network with central monitoring system. :USB port (reserved for future use); 4 1.2.3 Rear Panel Figure 1.4 Rear panel The following are at the rear panel of the monitor. (1) S/N: Serial Number (2) Power supply socket: 100-240VAC (3) Nameplate CE mark Serial number Authorised representative in the European community Disposal of this device according to WEEE regulations (4) — battery lid. Remove the battery lid to install or change the rechargeable battery. Battery specifications: Li-ion 14.8V/2200mAh rechargeable battery pack. To avoid battery damage, do remove battery(s) before shipping or storage. Caution: Burn hazard (the built-in battery) Do not disassemble, incinerate or expose to high temperature (60℃/140℉). Refer to instruction manual. 5 Chapter 2 Screen Display 2.1 Default Screen Display 2.1.1 Date and Time Setup Instead of entering into the default screen display, it shows the date and time setting screen immediately after the monitor is powered up at the first time since battery installation, shown in Figure 2.1: Figure 2.1 Time Setup The monitor will stay on this screen for 10 seconds. If you do not rotate the navigation knob within this period, the screen will enter into the default screen display. Follow the steps below to set date and time. Step 1: Rotate Navigation Knob, move the gray cursor to “Edit”. Step 2: Press the knob, and then “Edit” turns into “Save”. The gray cursor stays on the Year of the date. Press the knob again and the gray cursor becomes highlighted. Rotate the knob left or right to increase or decrease the year value. Step 3: When the Year is set, press the knob to move the gray cursor to the Month of the date. Step 4: Repeat Step 2 and Step3 to adjust the Year, Month, Date, Hour and Minute. Step 5: If you have finished adjusting the date and time, press the knob and rotate the knob to move the cursor to “Save”. Press it to save the settings and exit the date and Time Setup screen, meanwhile enter into the Main Screen shown in Figure 2.2. If you press “Exit”, the settings will not be saved. The monitor then does the initialization and enters into the default screen display for monitoring and operation (as shown in Figure 2.2). 6 2.1.2 Screen Description Figure 2.2 the default screen display Heading area “Alarm ”: Audible alarm status, green “ ” indicates the audible alarm is enabled, yellow “ ” indicates the alarm sound is silent. The audible alarm will be activated again automatically after the end of given counting down or when a new type of alarm event occurs. Red “ ” indicates the audible alarm is disabled, that means the alarm sound is off, this is also normal situation when the alarm sound volume is set to “0” in system parameter settings. “ADUL”: The patient type. There are two types available: “Adult” and “Pediatric”. “MON”: ECG Filter type. There are three types: “Diagnosis”, “Monitor” and “Operation”. The option can be set in the setting menu. : battery voltage indicator; When the indicator is yellow and displays only one “grid”, it means there is a little battery power left. When the indicator turns red and blinks, as well as less than one “grid” displays, the system alarm will be on to remind the low battery voltage. Please connect the device to the mains power supply in time to ensure the normal use of monitor, and the battery will be recharged. When the battery is fully charged, battery voltage indicator displays full grid. During recharging, the grids in the battery indicator are rolling circularly. “2011-03-02 13:57:25”: the current calendar time and date. The system time and date can be set during the system start-up when the screen displays the time and data setups. The current figure shows the time and date is March 2nd, 13:57:25, 2011. “Push knob for System Menu”: System prompt or description for the current status. “ID”: The patient ID. The patient ID can be entered or changed in the archive management window. Waveform area 1st trace: The first trace is ECG waveform for lead II. The left side of the ECG waveform shows the scale bar looking like “I”, which indicates the ECG scale. This scale bar will change its height 7 according to the ECG gain setting. All ECG waveforms have their own scale. When the third trace of ECG waveform changes to lead II, the first trace will automatically change to ECG waveform for lead I. 2nd trace: The second trace is for the ECG waveform of lead III. When the third trace displays the ECG for the lead III, this trace automatically changes to the ECG for lead I. 3rd trace: Its lead can be adjusted and will not repeat the 1st and 2nd traces. 4th trace: Plethysmogram for SpO2 measurement 5th trace: Respiration waveform. Data area: Figure 2.3 Heart rate area “HR”: The currently displayed heart rate. The "61" on the right side is the heart rate measured. “bpm”: The heart rate unit. bpm = beat per minute. “ ”: The heart beating symbol. Its flashing corresponds to a QRS complex in the ECG waveform. The flashing speed is the same with the heart rate. “ST+0.09mv”: the measured mili-volts value for S-T segment level. “X1”: ECG waveform gain (amplification), available options are: “Auto” Automatic waveform scale. “×1/4” 1/4 scale size of the base gain. “×1/2” Half scale size of the base gain. “×1” Waveform scale with the base gain. “×2” Twice scale size of the base gain. “×4” Four times scale size of the base gain Figure 2.4 Blood pressure data area “NIBP”: The blood pressure labels and the measured value. 8 “mmHg”: Blood Pressure unit “12:56”: The time of NIBP measuring “Manu”: The NIBP measurement mode. Figure 2.5 TEMP data area “TEMP”: Temperature label. The value below “36. 7” is the temperature value. “℃”: Body temperature unit.℃ is Celsius, and °F is Fahrenheit. "YSI": Temperature sensor type. Details see Temperature related setting in Section 3.7.2 Parameter settings. Figure 2.6 SpO2, pulse rate, and respiration data area “SpO2”: SpO2 label. The “98” on the right side is the current SpO2 value measured. “PR”: Pulse rate label. The value “62” on the lower left shows the pulse rate value. "PI": Perfusion Index label. “5.6%” is the perfusion index value. This function is optional, please refer to the monitor in your hand. (Note: If the monitor is configured with Nellcor SpO2 module, then PI display is always not available. The note will not be repeated in the later section) “ ”: Pulse bar-graph. The height of this bar-graph varies along with the arterial pulsation. “RR”: Respiration Rate label: if there is no breath detected, then message "Searching" will be displayed on RR data area. “16”: Respiration rate. The "rpm" is the unit of the respiration. “X2”: Respiration gain (amplification) “X1/2”: Half scale size of the base gain “X1”: Waveform scale with base gain “X2”: Twice scale size of the base gain. “X4”: 4 times scale size of the base gain Operation Instructions: 9 ECG lead: press it to shift the ECG monitoring circulatory among Ⅰ, Ⅱ, Ⅲ, AVR, AVL, AVF and V. Alarm silence: press it to set or activate the system alarm. Freeze: press it to freeze ECG waveform or the waveforms of ECG, SpO2 and RESP according to the system setting. NIBP: press it to start or stop NIBP measure. DISP: press it to shift the display to Display 2 Screen. Navigation Knob: 1. Press the navigation knob about 3 seconds, enter system menu screen. 2. Rotate the knob to move the gray cursor to the corresponding item, and press it for 1 second to enter 2.3 Screen Display for Remote Observation 2.3.1 Screen Description Press the DISP key to shift screen to Observing Screen when setting Disp2 as “Obsev” in System Setup screen, as shown in Figure 2.7. Figure 2.7 Screen display for remote observation Operation Instructions: ECG lead: press it to shift the ECG monitoring circulatory among Ⅰ, Ⅱ, and Ⅲ, AVR, AVL, AVF and V. Alarm silence: press it to set or activate the system alarm. Freeze: press it to freeze the ECG waveform and perform manual S-T segment analysis. Double press this key within 2 seconds to lock or unlock the operation of all other buttons (except power switch) on the front panel. 10 NIBP: press it to start or stop NIBP measure. DISP: press it to shift the display to the Main Screen. Navigation Knob: No action. When pressing the “Freeze” key, this key is used for S-T segment analysis. 2.3.2 NIBP Screen Display Figure 2.8 NIBP Screen display Press the DISP key to shift the Main Screen to NIBP screen , as shown in Figure, when setting Disp 2 as “NIBP” in “system menu→system setup→Disp2”. In NIBP screen, PR from SpO2 is shown prior to PR from NIBP. Operation Instructions: EGG lead: No action. When the printer is on, it serves as the printing key. Alarm silence: Press it to enable/disable alarm silence. Freeze: No action. NIBP: Press it to start NIBP measurement, and press it again to cancel measuring NIBP. Shift: Press it to shift the display to the Main Screen. Navigation knob: No action. 11 2.3.3 Screen Display with ECG Waveforms only Press the DISP key to shift screen to 7 ECG Waveform Screen when setting Disp2 as “7 ECG” in System Setup screen. In this screen, the operator can view 7 traces of ECG waveforms simultaneously for lead I, II, III, AVR, AVL, AVF and V, as shown in Figure 2.9. Figure 2.9 7 traces of the ECG waveforms display only Operation Instructions: ECG lead: No action. When the printer is on, it serves as the printing key. Alarm silence: press it to set or activate the system alarm. Freeze: press it to freeze all 7 ECG waveforms. Double press this key within 2 seconds to lock or unlock the operation of all other buttons (except power switch) on the front panel. NIBP: press it to start or stop NIBP measure. DISP: press it to shift the display to the Main Screen. Navigation Knob: rotate the knob to adjust the gain for all 7 trace of ECG waveforms. The ECG gain includes 6 options: “Auto”, “X1/4” “X1/2”, “X1”, “X2”, “X4”. Note:when "3" lead wires are chosen in "Cable" setting of ECG Setup, then the display view of 7 traces of ECG waveforms will not be available. When "3" lead wires are chosen in "Cable" setting of ECG Setup, the screen changes to the below figure: 12 2.3.4 Five Channels Real-time Waveforms and Trends on the Same Screen When the Disp2 option is “Trend” on System Menu screen, press the DISP key on the Main Screen, the system will enter the trend screen, as shown in Figure 2.10. Five channel real-time waveforms and trend graph can be viewed on this screen. Figure 2.10 Five Channel Real-time Waveforms and Two Hours Trends On this screen, the first channel waveform is ECG waveform of Lead II; the second one one is ECG waveform of Lead III; the third one is ECG waveform of Lead I; the fourth one is SpO2 waveform; the last channel is respiration waveform. On the right of waveform area, from the top down, respectively is heart rate, temperature, SpO2, RR trend graph, the abscissa of trend graph (-2h-0) means various trend of every parameter value from now on to two hours before, waveform in trend graph shifts from right to left. Operation Instructions: 13 ECG lead: press it to shift the ECG monitoring circulatory among Ⅰ, Ⅱ, and Ⅲ, AVR, AVL, AVF and V. Alarm silence: press it to set or activate the system alarm. Freeze: press it to freeze ECG waveform or the waveforms of ECG, SpO2 and RESP according to the system setting. Double press this key within 2 seconds to lock or unlock the operation of all other buttons (except power switch) on the front panel. NIBP: press it to start or stop NIBP measure. DISP: press it to shift the display to the Main Screen. Navigation Knob: no action. Note:when "3" lead wires are chosen in "Cable" setting of ECG Setup, then the display view of 2 hours trends screen will not be available. 2.3.5 Parameter Screen Press the DISP key to shift screen to Parameter Screen when setting Disp2 as “Parameter” in System Setup screen, as shown in Figure 2.11 Figure 2.11 Parameter screen Operation Instructions: ECG lead: when the printer is on, it serves as the printing key. Alarm silence: press it to set or activate the system alarm. Freeze: no action. Double press this key within 2 seconds to lock or unlock the operation of all other buttons (except power switch) on the front panel. NIBP: press it to start or stop NIBP measurement. DISP: press it to shift the display to the Initial Screen. Navigation Knob: no action. 14 2.4 ECG Waveform Freezing and S-T Segment Measurement During the process of monitoring, the ECG waveform can be frozen to perform detailed analysis in the observing screen, as shown in Figure 2.12. Figure 2.12 Frozen and S-T Analysis Screen 2.4.1 Screen Description The manual S-T segment measurement can be done at the frozen screen display. For example, the Figure 2.13 is a portion of the frozen waveform. The symbols on the screen were described briefly on the screen. Figure 2.13 Frozen waveform 15 2.4.2 Operating Instructions The operator can use the “Navigation Knob” to do the S-T segment measurement, i.e. measuring the voltage difference between the S-T segment and the base line. The value is displayed after the measurement with “S-T + 0.000 mV”. The operation is carried out in 4 steps. Step 1: rotate the “Navigation Knob” to move the base point (the red cross) horizontally to base line point (the base line is between the Q wave and the P wave). At this point, the frozen screen shows “S-T+0.xxx mV, Set Base, Dirc Hor” Step 2: press the “Navigation Knob”. The screen shows “S-T+0.xxx mV, Set Base, Dirc Ver”. Then rotate the knob to move the base point vertically to the base line point. Step 3: press the “Navigation Knob” again. The screen shows “S-T+0.xxx mV, Set S-T, Dirc Hor”. Rotate the knob to move the S-T point (the yellow cross) horizontally to the point to be measured on the ST segment. Step 4: press the “Navigation Knob” again. The screen shows “S-T+0.xxx mV, Set S-T, Dirc Ver”. Rotate the knob to move the S-T point vertically to the point to be measured on the S-T segment. Only the default screen display allows pressing the freeze key to do the S-T segment measurement. NOTE: The S-T segment starts from the end point of S wave, and ends at the start point of T wave, the st point to be measured is a point within the S-T segment. Operation Instructions: ECG lead: press it to shift the ECG monitoring circulatory among Ⅰ, Ⅱ, and Ⅲ, AVR, AVL, AVF and V. Alarm silence: press it to set or activate the system alarm. Freeze: press it to unfreeze ECG waveform. NIBP: press it to start or stop NIBP measure. DISP: press it to shift the display to the Main Screen. Navigation Knob: analyze the S-T segment waveform 16 Chapter 3 Screen Display for System Menu 3.1 System Menu Screen Longtime press the “Navigation Knob” in the default screen display as shown in Figure 2.2, the System Menu screen will display in the lower left area on the screen, as shown in Figure 3.1. Figure 3.1 System Menu Screen 3.1.1 How to Select the Menu Item Step 1: rotate the knob to move the gray cursor to the corresponding item. Step 2: press the knob to enter the corresponding screen: SpO2 Data List Screen, NIBP Data List Screen, Graphic Trend Screen, Recall Screen, Arrhythmia Screen, System Setup Screen, Color Settings, File/Archive Management Screen, oxyCRG Screen, Event List Screen, MC Calculator Screen or Cuff (Tourniquet Function) Screen. The following chapters will describe each one respectively. Pressing “ ” key to return to the Main Screen. 17 3.2 SpO2 Trend Data List Screen Figure 3.2 SpO2 Trend Data Listing Screen 3.2.1 Screen Description When monitoring, the newest data will be displayed on the top of list including “Time, HR, RR, TEMP, SpO2, PR”. The time shows the time when the SpO2 measurement was taken. Up to 6 groups of SpO2 data can be displayed on one screen. There is only one record every 4 seconds. 3.2.2 Operating Instructions Up to 400 groups of SpO2 data can be memorized. Using the Navigation Knob allows the user to scroll the list up and down to view SpO2 data. When rotating the knob anti-clockwise, the list scrolls upward. When rotating knob clockwise, the list scrolls down. Please note that when the groups of data are less than 6, the Navigation Knob can not be used to scroll up or down the listing. Pressing “ ” key to return to the Main Screen. 3.3 NIBP Data List Screen Figure 3.3 NIBP Data List screen 3.3.1 Screen Description When monitoring, the newest data will be displayed on the top of list including “ Time, NIBP, PR, HR, RR,TEMP”. The time shows the time when the NIBP measurement was taken. Up to 6 groups of NIBP data can be displayed on one screen. There is only one record every 4 seconds. 3.3.2 Operating Instructions Up to 12000 groups of NIBP data can be memorized. Using the Navigation Knob allows the user to scroll the list up and down to view NIBP data. When rotating the knob anti-clockwise, the list scrolls upward. When rotating knob clockwise, the list scrolls down. Please note that when the groups of data are less than 6, the Navigation Knob can not be used to scroll up or down the listing. Pressing “ ” key to return to the Main Screen. 18 3.4 Screen Display for Graphic Trend Figure 3.4 HR Trend Graph 3.4.1 How to View the Graphic Trend Figure 3.4 is the HR trend graph. There are 3 options on the right of the graph, as described below. “HR” indicates the current trend graph is HR trend graph. If you want to enter other trend graphs, the procedures are: move cursor to “HR” and rotate the “Navigation Knob” to choose the trend graph from “HR”, “S-T”, “Temperature”, “NIBP”, “PR”, “RR” and “SpO2” trend graphs, next press the knob to confirm. Their screens are described in the following figures. After choosing “Cursor”, the trend graph display a triangle and a vertical line, a moving ruler mark that can be moved by rotating the knob. As shown in the figure, when you move the cursor to a specific point, the data area below the graph will display the timestamp, and its corresponding heart rate, respiration rate, SpO2, temperature. When rotating “Navigation Knob” key to move the cursor, the moving step is a variable value depending on the dialing speed. The rule is that the initial step is 5sec, after moving it towards the same direction 1 time, the step becomes 30 sec, and with more steps the step becomes 1min, 10min and 30min.. Therefore, it is very easy to find the time point you are looking for. The “5 sec” on the top shows the interval time. Move the focus to the trend time, press the knob and rotate it, and the trend graph time will change to 30 sec, 1 min, 10 min, 30 min, which changes the horizontal axis to be 30 min, 3 hour, 6 hours, 60 hours, 180 hours. For example, the monitoring can record 360 times data continuously when setting to “5 sec” within 30 minutes. Changing the interval time of 30 seconds, it can record 360 times data within 3 hours. Other changes are similar to that situation. The Trend graph shows parameter value of the current time. For example, in the “5 sec” trend graph, the monitoring can record the current data with the interval of 5 seconds. Once the monitor is out of power, the data can be stored automatically and you can scan the history record when turning on the monitor next time. This ensures the screen always display the current data continuously. Other trend graph follows the same rule. Please note that the maximum value on the vertical axis of the HR is 150, not the value of HR upper limit (300). The graph is scaled down for better view of the trend curve. When the HR value exceeds 150, the vertical axis’s maximum value will automatically change to 300. That is to say, the vertical axis value 0-75-150 will change to 0-150-300 automatically if the ECG value exceeds 150. When the monitor gets reset or the patient ID is changed, the vertical axis will return to its original value of 0, 75, and 150. Other changes of vertical axis value in other trend graph are similar to that of HR. The respiration rate, body temperature and other trend graph are similar to that of HR’s and we will not cover them in detail again. Please note that for NIBP trend graphs, the horizontal axis is the sequence number of times the blood pressure measurement instead of timestamp. NIBP graphic trend is a little different from the other graphic trends. Rotate the knob to move the cursor to “ ”, then press the knob for activating this item. Next, rotate the knob towards left or right for viewing 19 another 400 groups’ graphic trend. Figure 3.5 Figure 3.6 S-T Segment Trend Graph Body Temperature Trend Graph Figure 3.7 ETCO2 Graphic Trend Figure 3.8 Figure 3.9 SpO2 Trend graph PR Trend Graph 20 Figure 3.10 Respiration Trend Graph 3.4.2 Operation Instructions Rotate the Navigation Knob to choose the parameter and press the knob to review the trend graph. Pressing “ ” key to return to the Main Screen. 3.5 Screen Display for Waveform Recall Figure 3.11 Waveform Recall Screen It shows the monitoring can recall the history data continuously. If you change the patients’ ID or the monitor is out of power, the measuring data will not being a new single record, but connect to the last record you have measured. It is a continuous record. The ECG lead, gain and other parameters will not change during recall. Shown in Figure 3.12, it is different from the Main Screen in its 3rd waveform area and the operation area. We will explain them in detail below. 21 Figure 3.12 Recall Listing 3.5.1 Operation Instructions Rotate the “Navigation Knob” and choose “Recall”, “HIST”, “Delete” or “Exit”. We explain the functions of each button below. Recall: Press the Recall and the first record in recall list becomes green. Rotate the knob to choose a record, and press the knob to recall it. The recalled waveform is displayed on the 3rd trace of the waveform area, as shown in Figure 3.13. Figure 5.13 Recalled Waveform Figure 3.13 Recalled ECG Waveform Rotate the “Navigation Knob” to move forward or backward to review the ECG waveform. Press the “Navigation Knob” to exit the ECG waveform recall and return to the initial ECG waveform recall screen. During ECG waveform recall, the monitor not only displays the current recalled waveform, but also displays the setting of ECG lead, gain and filter type for the recalled waveform and timestamp. HIST: Press the key to shift between the History key and Current key. Press HIST and the recall list on the left displays the history data list. Press the Current, the recall list on the left side displays the current one. When entering the recall screen display, the monitor defaults the current one. Delete: Press this key, and the selected record in the recall list becomes green. Rotate the “Navigation Knob” to choose the reviewed record that is to be detected, press it longer than 2 seconds and release it, then the record will be deleted. The current record cannot be deleted, or the monitor will exit Delete screen Exit: Press this key to return to the System Menu screen. 22 3.6 Screen Display for Arrhythmia Event List Figure 3.14 Arrhythmia Event List Screen 3.6.1 Operation Instructions The structure is similar to recall screen. We will cover each function key below. Start: This button is used to start and end the system Arrhythmia detection. The default is OFF. When the Arrhythmia is not ON, the “Learn” key is disabled. Press this key and the monitor enters learning stage at before detecting arrhythmia. The “Start” changes to “End”. Press it again to end the learning. When “Learn” key change to yellow from gray, it indicates the learning has finished. When the ARR detection begins after learning, the monitor will automatically detect the ARR event. If an ARR event is detected, the ECG waveform with corresponding ARR event will be displayed in the 3rd trace of waveform, shown in Figure 3.14. When the monitor get Reset or the patient ID has been changed, the ARR detection needs to be re-learned. Learn: Because the Arrhythmia detection is based on the pattern of normal ECG waveform, which is built up during learning stage. When the patient changes, the ARR detection could be incorrect, so that re-learning is needed. To get better result of the learning function, it is recommended to start learning while a segment of good quality ECG waveform appears during the ECG monitoring. View: Press this key, and the selected record in the Arrhythmia event list, which is to be reviewed, becomes the green. Rotate the “Navigation Knob” to choose the record and display the corresponding waveform in the 3rd trace of waveform. Press the knob again to exit. Exit: press this key to exit the Arrhythmia detection screen and return to the System Menu screen. During monitoring, if an ARR event is detected, the monitor will alarm. The ARR alarm is system default and does not need setup. During ARR detection, incorrect detection might occur if the large interference signal (e.g. square pulse or triangle pulse) appear. Before starting 1mV calibrating signal selection, please turn off the ARR detection. During ARR detection, the learning template is very important. The monitor requires a segment of stable and clean ECG waveform. If the monitor detects the ARR event incorrectly, please do re-learn by pressing “Learn” button again for capturing good template. 23 3.7 Screen Display for System Setting Figure 3.15 System Setup 3.7.1 How to Select the System Setup Item Step 1: rotate the knob to move the gray cursor to the corresponding item. Step 2: press the knob to enter the corresponding setting screen: System Setup, Printer Setup, ECG Setup, TEMP setup, CO2 Setup, NIBP Setup, SpO2 Setup, RESP Setup or resuming Default setting. The following contents will be described each one respectively. Pressing “ ” key to return to the Main Screen or “Exit” button to return to the System Menu screen. Note: If you disabled Hi and Lo limit alarm function of parameter monitoring, all the alarms related to its parameter monitoring will be disabled as well. 3.7.2 Parameter Settings Step 1: rotate the knob to move the gray cursor to the setting item and press the knob to confirm your selection. Step 2: rotate the knob to change the setting or modify the setting value. Step 3: press the knob again to change and repress it to save the setting. Pressing “ ” key to return to the Main Screen SYSTEM PARAMETER SETTINGS Figure 3.16 System Setup Type: The category of patient being monitored, this can be selected from Adult, Pediatric and Neonate. Adult: the patient is adult. Pediatric: the patient is pediatric. Neonate: the patient is neonate. The default is “Adult” When changing the patient type, the monitor will change the default alarm settings, and initialize the NIBP and SpO2 measuring module accordingly. Please pay special attention to the patient type before 24 starting the monitoring. It is forbidden to use Adult type on the Pediatric patient, or it may cause serious injury. Mode: Monitor working mode selection. The “Real Time” shows the normal working mode with real time waveform and data. The “Demo” shows the demo working mode with demo waveform and data. In the demo mode, all the signals and data are generated by the device for demonstrating and testing purpose. The default is “Real Time” LANG: The current language used, which can be selected by the user. There is no default for this setting. However, the setting can be saved. Fill: When the fill setting is ON, the plethysmogram and respiration waveform will be displayed with filled curves. When it is OFF, the monitor displays the line graph. The default is OFF. Frze: Pressed the key to freeze the selected waveforms. The options are “All” and “ECG”. When "ECG" is selected, the monitor only freezes the ECG waveform. When “All” is selected, the monitor freezes all the waveforms including ECG, plethysmogram, and respiration waveform. The factory default is “ECG” Disp2: The alternative screen display to be viewed. Options: “Obsev” (Remote Observation) “7 ECG” (7 traces of ECG waveforms), "NIBP", "Parameter" and "Trend" can be selected. The factory default is “Observ”. AlmVol: The alarm sound volume. The maximum volume is 7 and minimum is 0, i.e. no sound. When the setting is “0”, the icon “ ” will be displayed on screen to remind user that the alarm sound is off and Alarm Silence function is disabled. The default is 5. Beep: If the setting is ON, the press of the button will generate a keystroke sound. The factory is ON. DefView: when the monitor is powered up, and 3 seconds later, the monitor will shift into default monitoring view (screen) specified by "DefView" automatically. Two options: "Main" and "Disp 2". "Main" means the main screen as default screen, and "Disp 2" means the default display screen will be set as alternative screen "Disp 2" while power up. Exit: return to the System Setup screen. PRINTER SETUP Printer: For switch on or off the printer. Timer: If printer is ON, rotate navigation knob to set on the Timer to enable timed print, and set the value of printing intervals in the cycle category. When the time is reached, the system will automatically take the record. The interval is 1,2,3…….to 240 minutes. Wav2: When printer is selected, you can choose SpO2, respiration, I, III, AVR, AVL, AVF or V to be printed with II-lead ECG waveform. The default is SpO2 ARR: Arrhythmia trigging print. “ON” means the printer will trig once arrhythmia occurs and record the arrhythmia waveform information. The initial setting is “OFF” means closing the arrhythmia trigging record. 25 Exit: return to the System Setup screen. Printer is optional function. If the purchased machine has printer, please refer to above Printer Setup.ECG related settings Figure 3.17 ECG related settings Lead: Can be chosen among Lead I, II, III, AVR, AVL, AVF, and V (V1-V6). The default is I. Gain: The ECG gain, 6 options x1/4, x1/2, x1, x2, x4 and Auto. Auto is for automatic gain control. The factory default is x1 HR Hi: High limit alarm for heart rate Lo: Low limit alarm for heart rate The adjustable range and the factory default value can be found in chapter 12.2 Speed: ECG waveform sweeping speed. 4 options: 6.25, 12.5, 25, 50 mm/s. The factory default is 25 mm/s Mode: ECG filtering mode. Three options: MON, DIA, and OPE MON: Monitoring mode. Moderate filtering, it can filter out interference and present good ECG waveforms. DIA: Diagnosis mode. No filtering, represent the true ECG siganl without filtering. OPE: Operation mode. Deep filtering, it can filter out strong interference. The factory default is MON. 1mV: Generating the 1mV calibrating signal. This signal is used to test the ECG function of the device. It is not used during normal operation. Factory default is OFF Notch: frequency filter. Different hardware configuration may make its options various. One is “ON”/ “OFF” (The factory default is ON.), and it means turn on or turn off the 50Hz frequency filter. The other option is “OFF”/ “50 Hz”/ “60 Hz”, please choose “50 Hz” or “60 Hz” frequency filter according to your power supply frequency. The factory default is “50 Hz”. Pace: Cardiac pacemaker pulse detection. When Pace is “ON”, the function of pacemaker pulse detection will be effective. A mark will be displayed on the ECG waveform if the pacemaker generates a pacing pulse when the patient wears a cardiac pacemaker. The factory default is OFF. Grid: The grid on the background for Observing Screen and Frozen & S-T Analysis Screen. Factory default is OFF. Cable: Choose the number of lead wires for ECG cable. "3" and "5" for optional. 26 Exit: return to the System Setup screen. ☞ Limits setup: Move the gray cursor to the High or Low limits of the alarm settings, and press the “Alarm silence” key to turn ON or OFF the alarm for the setting. Yellow color shows ON status, and gray color shows the OFF status. Temperature related settings Figure 3.18 Temperature related settings TEMP Hi: High alarm limit for temperature Lo: Low alarm limit for temperature Unit: the temperature unit, and ℃(Celsius) and ℉(Fahrenheit) can be selected, the factory default is "℃". Sensor: temperature sensor type, "KRK" and "YSI" can be selected. KRK and YSI temperature sensors are different type of thermistors with different R-T characteristic. Please set the sensor type according to the actual used sensor. Exit: exit from system settings. Note: For KRK temperature sensor, its resistance at 25.0℃ is10Kohms, while for YSI temperature sensor, its resistance at 25.0℃ is 2.252K ohms. NIBP related settings Figure 3.20 NIBP related settings Unit: The pressure unit, and mmHg and kPa can be selected. The factory default is mmHg. Mode: The measuring mode, manual or automatic. The factory default is manual. The operator needs to press the NIBP button to perform blood pressure measurement. If the Auto mode is chosen, the operator needs to set an cycle interval as well. Cycle: The time interval between measurements when the measuring mode is set to Auto. The options are STAT, 1 min, 2 min…480 min. Press NIBP to start measurement and the monitor begins to count down as well. It will take blood pressure measurement automatically after finishing counting down. If “STAT” is selected, press NIBP to take the blood pressure measurement as many times as possible, but it will sustain this state not longer than 5 minutes. WARNING: STAT can only be used for Adult. Using this mode to Pediatric patient can cause serious injury. 27 NIBP Cali: It is used to check the accuracy of pressure measuring system within NIBP module, which should be conducted by technicians in test house or service department. There are three options: “Mode 1”, “Mode 2” and “OFF” available. After the verification, it is necessary to make sure it is in “OFF” status again, or other operations can’t be carried out and NIBP key will be inactivated. Factory default status is “OFF”. Gas Leak: it is used by technicians to perform a leakage inspection for NIBP pneumatic system. SYS Hi/Lo: High and Low alarm limits for systolic pressure DIA Hi/Lo: High and Low alarm limits for diastolic pressure MAP Hi/Lo: High and Low alarm limits for MAP PR Hi/Lo: High and Low alarm limits for PR Initial inflation pressure setting: Cuff pressure to be inflated initially, its options are different depending on patient type. for neonate: initial inflation pressure can be: 60, 70, 80mmHg, default setting: 70 mmHg; for Pediatric: initial inflation pressure can be: 80, 100, 120, 140 mmHg, default setting: 100 mmHg; for adult: initial inflation pressure can be: 80, 100, 120, 140, 160, 180, 200mmHg, default setting: 150 mmHg. Exit: return to the System Setup screen. SpO2 related settings Figure 3.21 SpO2 related settings SpO2 Hi/Lo: High and Low alarm limits for SpO2 Pulse Hi/Lo: High and Low alarm limits for pulse rate. Exit: return to the System Setup screen. Respiration related settings Figure 3.22 Respiration related settings Gain: Respiration amplification/gain, 4 options, x1/2, x1, x2, and x4. The default is x2 Speed: Respiration waveform sweeping speed, 2 options 6.25mm/s and 12.5 mm/s. The default is 12.5 mm/s Apnea: timeout setting for apnea alarm. Options: "OFF" and any number from 5 to 120. The step is 1 and its unit is second. When the breathing action is not detected after the time longer than this set period, 28 the trace for respiration waveform will display warning “Apnea xxx second”. The default is "OFF". Type: Respiration impedance Lead: Signal source selection for respiration measurement. 3 options: ECG electrode Lead "I"and "II" RR Hi: High limit of respiratory rate alarm Lo: Low limit of respiratory rate alarm Exit: return to the System Setup screen. Restoring to Factory Default Settings In the System setup screen as shown in Figure 3.15, rotate knob to choose “RESET” and then press the knob, all the value of parameters will resume default setting. 3.8 Display Color Settings Figure 3.23 Display Color Settings 3.8.1 How to Change the Parameter Color Step 1: rotate the knob to move the gray cursor to the setting item and press the knob to confirm your selection. Step 2: rotate the knob to choose the color. Step 3: press the knob again to confirm the chosen color. Pressing “ ” key to return to the Main Screen or “Exit” button to return to the System Menu screen. 3.9 File Management Screen Figure 3.24 Document management screen 3.9.1 How to Add a New Patient The document/archive management screen can be used to manage information about the patient. In the screen, the operator can enter and modify the patient ID, Name, Bed number, Sex, and Age. The operator can also choose to save the patient data in the permanent storage. The screen is shown in Figure 3.24. ID: Or Patient ID. To enter patient ID, choose the patient ID field by using the “Navigation Knob”. Press it to 29 enter the text entry box. Rotate the knob to choose the letter and press the knob to enter the letter. To delete the letter, move the cursor to the letter and rotate the knob to enter spaces (after the H). Use the spaces to replace the letters. After finishing entering the patient ID, choose “Exit” button and press the knob to exit the text entry. The patient ID is the unique identifier for the patient. When the patient ID changes, the system considers the patient has changed. Name: Enter the patient’s name. Bed: Enter the bed number. Sex: Choose between M or F for male and female. Age: Choose the age field and use the “Navigation Knob” to select an age. Save: The operator can choose how much of the data that needs to be saved. The unit is hour. Once the time is chosen, the system starts to save data from the current time. If OFF is selected, it means that the data will not be saved. The system will determine the time range according to the available disk space. If no disk space available, SAVE will be displayed as OFF. When the user intends to save the current ECG waveform permanently, please delete the history files. Refer to Chapter 3.1.1 for deletion methods. Exit: Press this key to return to the System Menu screen. 3.10 oxyCRG Screen Figure 3.25 oxyCRG Screen This screen displays the value or waveform of HR, SpO2, and RESP waveform or Respiration Rate in selected time. 3.10.1 Operation Instructions Step 1: rotate the knob to move the gray cursor to the button “ selection. ” or “ ” and press the knob to confirm your Step 2: rotate the knob to choose the setting. The time can be set as 1 minute, 2 minutes or 4 minutes. The third channel waveform display can be set as RWAVE (Respiration waveform) or RR (Respiration Rate). Step 3: press the knob to confirm your setting. Pressing “ ” key to return to the Main Screen. 3.11 Event List Screen 30 Figure 3.26 Event List 3.11.1 Screen Description The Event List displays the time, event type, the value detected and high and low alarm limits. The time shows the time when the event occurred. Up to 5 groups of event data can be displayed on one screen. 3.11.2 Operating Instructions Up to 2000 groups of event data can be memorized. Using the Navigation Knob allows the user to scroll the list up and down to view event data. When rotating the knob anti-clockwise, the list scrolls upward. When rotating knob clockwise, the list scrolls down. Please note that when the groups of data are less than 5, the Navigation Knob can not be used to scroll up or down the listing. Pressing “ ” key to return to the Main Screen. 3.12 MC Calculator This monitor supplies 10 kinds of medicine calculation and titration display function. Figure 3.27 Medicine Dosage Calculator Screen 3.12.1 Medicine Dosage Calculator Medicine types which can be perform drug dosage calculation: AMINOPHYLLINE, DOBUTAMINE, DOPAMINE, EPINEPHRINE, HEPARIN, ISUPREL, LIDOCAINE, NIPRIDE, NITROGLYCERIN, and PITOCIN. Drug Dosage Calculation adopts the following formula: Medicine Consistency (MC) =Medicine Gross/ Cubage (Dose/minute)= (Dose/hour) /60 (Dose/Kg/m)= (Dose/m) /Weight (Dose/Kg/h)= (Dose/h) /Weight Transfusion Speed (TS) = (Dose/h) /MC Drop Speed=TS/ (Cubage/drop) Duration=Medicine Gross/Dose/h) Formula Introduction : Dose/m=Dose per minute; Dose/h=Dose per hour; Dose/Kg/m=Dose per Kg per minute; Dose/Kg/h=Dose per Kg per hour. 31 On medicine calculation screen, at first the operator should move the gray cursor to “Medicine” to select the calculated medicine name, and then move the cursor to “Weight” to select and confirm patient weight, at this time MC analysis screen is shown as Figure 3.28 Figure 3.28 MC Analysis Screen Rotate the Navigation knob to move the cursor to the option which needs to be calculated, press the knob and rotate it to obtain calculating value. When the calculating value is selected, the calculated value will be displayed in corresponding position. Each calculating option has limit range, if the result exceeds range, it will display “…”. On MC analysis screen, other menu options can not enter value unless entering patient’s weight and medicine name again, in default status it is no effective. The values in system is a group of stochastic initial values, the operator should not consider it as calculating standard, please according to doctor’s device enter a group values which are suitable for patient. The unit of every medicine is settled unit or unit series. The operator must select the appropriate unit according to doctor’s device. In a unit series, unit carry performs automatic adjustment along with the current entering value. When exceeding the range of this unit expression, the system will display “…”. When the operator finishes one option entering, the system will give visible indication in menu to remind operator to check the correctness of entering value. For every new entering value, please perform confirming. The operator should take it seriously, only the entering is correct, the calculating result is believable and reliable. Select Medicine Type: Move the cursor to “Medicine”, rotate Navigation knob to perform selection. Ten options: AMINOPHYLLINE, DOBUTAMINE, DOPAMINE, EPINEPHRINE, HEPARIN, ISUPREL, LIDOCAINE, NIPRIDE, NITROGLYCERIN, and PITOCIN. The default medicine is AMINOPHYLLINE. Weight: when entering into medicine calculating window, the operator should enter patient’s weight; the weight is used for MC calculation only; weight: 0.5Kg to 300Kg selectable; step: 0.5Kg; default: 70 Kg for adult; 20Kg for Pediatric. Medicine calculation function just supplies a medicine calculator function. The values in table can have no relation with the monitored patient, so the weight in this menu and the weight in system are two different values. When update a patient in system operation, the value in this menu will not be affected. 3.13 Tourniquet Function Figure 3.29 32 Cuff “Pressure”: when you use Tourniquet function, you need to preset a cuff pressure for hemostasia. The pressure is adjustable, and its adjusting limit is different depending on patient type: for neonate: preset range: 70~100 mmHg, default value: “90” mmHg; for Pediatric: preset range: 80~130 mmHg, default value: “110” mmHg; for adult: preset range: 80~180mmHg, default value: “140” mmHg. ☞ If the pressure drops down slowly under 10mmHg compared with the preset value due to little air leakage in the pneumatic system when time passes by, the monitor will re-inflate to maintain the cuff pressure close to the preset pressure value. Note: the unit of cuff pressure is the same as the NIBP unit in NIBP Setup. “Duration”: After presetting the cuff pressure, you need to set the time period for maintaining the preset pressure after inflation. “5, 6, 7,…120” minutes adjustable. The default value is “40” minutes. If the set value is “xx” minutes, the monitor will count down from “xx” minutes automatically when starting cuff inflation. When time is up, it will deflate automatically. “Alarm”: the alert time is for reminding user that the preset operation of tourniquet is going to end. It can be chosen from 1 to 60 minutes, and the default value is “5” minutes. If the set value is “xx” minutes and when counting down time reaches “xx” minutes, the monitor will give off alarm sound until deflation ends. The alarm type is high priority alarm. (For example: if the duration is 40 minutes and the alert time is 5 minutes, the alarm will ring to prompt when the duration counts down to 5 minutes. The Prompt Info area starts to prompt: TOUR C-D 300 seconds. ) “Start”: shift cursor to “Start” and press “■” key, “Start” becomes “Stop” and meanwhile the blood cuff starts being inflated; Pressing “Stop” button can stop using this function. After deflation, it will change to “Start” again. 3.13.1 Operation Instructions Step 1: rotate the knob to move the gray cursor to the setting item and press the knob to confirm your selection. Step 2: rotate the knob to change the setting or modify the setting value. Step 3: press the knob again to change and repress it to save the setting. Pressing “ ” key to return to the Main Screen or “Exit” button to return to the System Menu screen. 33 Chapter 4 CO2 Monitoring (optional) If your monitor has CO2 monitoring function, please follow the instructions in this chapter to perform CO2 monitoring on patient. The parameter setting menu and monitoring menu differ from different models, please refer to the monitor on hand. 4.1 CO2 Related Settings 1. On the default screen display, press the knob to enter System Menu Screen. Then choose “SETUPÆC02”to enter CO2 related settings screen. Figure 4.1 CO2 Related Settings (1) CO2 Related Settings (2) NOTE: CO2 parameter setting screen will be displayed in two pages. Focus the gray cursor on “ ”, then press the navigation knob to enter the second page where the operator can set some other parameters of CO2 (As shown in above figures). Switch: enable or disable the CO2 function. It is recommended that the switch is turned on only when there is a need to monitor CO2 parameter. This can not only reduce the power consumption and also extend the life of the CO2 measurement module. In order to maintain the monitor, please set CO2 switch at OFF state in system setup when CO2 function is not used. Gain: the CO2 waveform gain. Unit: Choosing the EtCO2 and the minimum InsCO2. It can be set up as kPa, mmHg, and %. Respiration Rate High: Setting the upper alarm limit of CO2 respiration rate. Low: Setting the lower alarm limit of CO2 respiration rate. EtCO2 High: Setting the upper alarm limit of EtCO2. Low: Setting the lower alarm limit of EtCO2. InsCO2 High: Setting the upper alarm limit of InsCO2. 34 Low: Setting the lower alarm limit of InsCO2. Baro (Barometric pressure): set ambient atmospheric pressure. It can be determined by barometer or the ambient altitude. Altitude can be used to determine the typical barometric pressure if a barometer is not available, refer to Appendix Typical Pressures and CO2 Readings at Altitudes for details. Zero: The method to calibrate CO2: Zero calibration. Calibration must be carried out in a drafty place, and the CO2 module must have worked continuously for 5 minutes to ensure an accurate calibration, or the calibration will not work. Flow (CO2 flow): It is flow rate of the CO2 sampling. Its value is 50ml/min. The information promoted for Zero calibration is as follows: Please apply the reference air with 0% CO2, the air in the drafty room usually can be regarded as the air with 0% CO2. Press “OK”, and the result will be displayed on the screen several seconds later. Apnea: display timeout setting for the respiration rate measurement when the previous respiration has been detected while the next one is not, meanwhile, the device will prompt apnea information. The setting range is 10s~60s, the default is 20s. For example, if 20 seconds is set here, it means the respiration rate value will disappear after it has been shown for 20 seconds if on respiration is detected during this period. Period: setting the calculation cycle of EtCO2 value, there are three selectable options: “1b”, “10s” and “20s”. “1b”: means the EtCO2 value will be calculated once every respiration cycle; “10s”: means the EtCO2 value will be calculated once every 10s, and the maximum EtCO2 value measured during this 10s will be displayed on data area; “20s”: means the EtCO2 value will be calculated once every 20s, and the maximum EtCO2 value measured during this 20s will be displayed on data area TEMP: setting the temperature value of the current measured air flow. For instance, the temperature is usually set as 37℃ while measuring the patient’s respiration by air flow. However, if the air flow to be measured is the reference gas, the temperature is set as 25℃. The setting range: 0~50; Unit: ℃; Default value: 35.0. O2 Compen: adjusting the concentration of compensating gas in patient’s respiration air flow. Generally, the compensating gas is oxygen, so it can be called oxygen compensation concentration. The unit: %; Setting range: 0%~100%; Default value: 16. Balance: setting the balance gas in patient’s respiration air flow. There are three kinds of selectable balance gas: “Air”, “N2O” and “He”, namely: air, nitrous oxide and helium. If on specific balance gas is given, the balance gas can be set as “Air”. Agent: setting whether adding the anesthetic gas to patient’s respiration air flow and the concentration of anesthetic gas. The setting range is 0.0%~20.0%, the default status is: not adding anesthetic gas, that’s to say, the concentration is 0.0%. 2. To set the color of CO2 parameters on Color Settings screen. 4.2 CO2 Monitoring Screen 35 Figure 4.2 CO2 Monitoring Screen Waveform area 5th trace: CO2 waveform. It can be respiration waveform or CO2 waveform. Data area Figure 4.3 RR, EtCO2, and Ins Data Area “RR”: Respiration Rate: The rpm after that is the unit of the respiration, i.e., respiration per min. “EtCO2 39.0”: The label and the value will become gray when CO2 is turned off. Ins: The label of the minimal inhalational CO2, the label and the value will become gray when CO2 is turned off. “16”: Respiration rate. It will display the respiration rate of CO2, when the switch is turned on. “X1”: Respiration gain(amplification) : “×1/2” Waveform scaled with half of the base gain. “×1” Waveform scaled with base gain. “×2” Waveform scaled with twice of the base gain. “×4” Waveform scaled with four times of the base gain Observing Screen, 7 Leads on the Same Screen and other display screen will display CO2 monitoring data as well besides Main Screen. 36 Note: only when the setting item “System Menu→SETUP→CO2→Switch”is set as “ON”, CO2 monitoring function is available. 4.3 CO2 Graphic Trend On Graphic Trend screen, rotate the knob and move the cursor to “CO2”, then press the knob to enter EtCO2 Graphic Trend. Refer to Chapter 2.4 Graphic Trend Screen for detailed instructions and operations. Figure 4.4 EtCO2 Graphic Trend 37