1
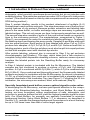
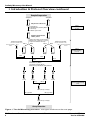
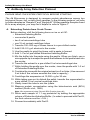
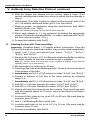
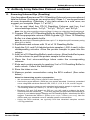
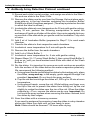
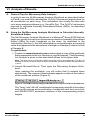
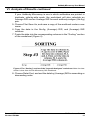
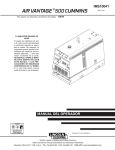
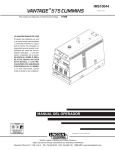
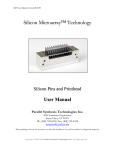
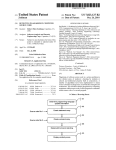
CLONTECH
Innovative
Tools to
Accelerate
Discovery
Antibody Microarrays
User Manual
PT3648-1 (PR23092)
Published 20 March 2002
See List of Components for storage conditions
FOR RESEARCH USE ONLY
Antibody Microarrays User Manual
Table of Contents
I. Introduction & Protocol Overview
3
II. List of Components
9
III. Additional Materials and Equipment Required
10
IV. General Considerations
11
V. Antibody Array Detection Protocol
12
A. Extracting Protein from Crude Tissue
12
B. Extracting Protein from Cells
13
C. Preparing Protein from Body Fluids
13
D. Labeling Protein with Fluorescent Dye
14
E. Removing Unbound Dye (Desalting)
15
F. Detecting Labeled Protein with the Ab Microarray
16
VI. Analysis of Results
19
VII. References
23
VIII. Related Products
23
List of Figures
Figure 1. The Ab Microarray Procedure
6–7
Figure 2. The Ab Microarray Analysis Workbook is composed
of three worksheets
19
Figure 3. The “Import & Analyses” worksheet has three sections:
Import, Analyses, and Sorting.
20
Figure 4. The “sorting” section of the “Import & Analyses” worksheet
21
Notice to Purchaser
This product is intended to be used for research purposes only. It is not to be used for drug or diagnostic
purposes nor is it intended for human use. BD Biosciences Clontech products may not be resold,
modified for resale, or used to manufacture commercial products without written approval of BD
Biosciences Clontech.
AtlasTM and FalconTM are trademarks of Becton, Dickinson and Company.
Milli-Q® is a registered trademark of Millipore Corporation.
Microsoft® is a registered trademark of Microsoft Corporation.
GenePixTM is a trademark of Axon Instruments.
© 2002, Becton, Dickinson and Company
BD Biosciences Clontech
2
www.bdbiosciences.com
Protocol # PT3648-1
Version # PR23092
Antibody Microarrays User Manual
I. Introduction & Protocol Overview
With several genome sequencing projects nearing completion, attention is
turning towards understanding the complete complement of proteins—the
proteome. One goal of proteomics is to measure changes in the expression
levels of entire sets of proteins to gain a full view of biological processes and
disease states. To help accelerate this avenue of proteomics, BD Biosciences
Clontech has developed the Ab MicroarrayTM, a powerful new chip-based
technology for profiling hundreds of proteins simultaneously. The Ab Microarray
is composed of hundreds of distinct monoclonal antibodies printed at high
density on a glass microscope slide. Using this innovative detection platform and
our simple yet robust array protocol, you can measure the abundances of
hundreds of proteins with a single experiment.
Ab Microarrays can be used to measure protein levels in virtually any biological
sample, including cells, whole tissue, and body fluids. This array analysis system
includes all necessary buffers for protein extraction, labeling, and detection; an
incubation tray; and two identical Ab Microarrays.
Production of Ab Microarrays
The production of our Ab Microarrays consists of two main steps. First, the
surface of a glass microscope slide is chemically modified to present functional
groups for covalent binding with antibodies. Second, antibodies are printed on
the slide using a high-precision robot. Our proprietary chemistry ensures that
even after immobilization, antibodies remain active. Because the Ab Microarray
is immobilized on a glass slide, only small volumes of sample and reagents are
required to complete the analysis. And because you detect captured antigens by
fluorescence, data collection is especially convenient; slides can be scanned
with commercially available microarray scanners.
Specifications of the Ab Microarray
Ab Microarrays detect a wide variety of cytosolic and membrane-bound proteins,
which, together, represent a broad range of biochemical pathways. Our Extraction/Labeling and Incubation Buffers, each a unique blend of salts and detergents, ensure that even membrane-bound receptors can be extracted from
whole tissue or cells, labeled with fluorophore, and profiled with the appropriate
microarray.
All antibodies on our Ab Microarrays have been extensively tested to verify their
specificities. Each was raised against a known protein. To find out which protein
and to review the layout of your Ab Microarray, please refer to the Product
Analysis Certificate provided. When available, database accession numbers
(e.g., SWISS-PROT and Locus Link) of target antigens are also listed so that you
can retrieve detailed information about the proteins profiled with your array. You
can also view the list of arrayed antibodies and review pertinent array specifications by visiting www.clontech.com. (Be sure to note the Lot Number of the
Protocol # PT3648-1
Version # PR23092
www.bdbiosciences.com
BD Biosciences Clontech
3
Antibody Microarrays User Manual
I. Introduction & Protocol Overview continued
microarray you wish to review, as the composition of each lot may vary slightly,
depending on antibody availability at the time of printing.)
The arrayed antibodies can be purchased individually from BD Biosciences
Pharmingen or BD Biosciences Transduction Labs. If you need specific information about one or more antibodies on the microarray, please visit
www.bdbiosciences.com and navigate to the appropriate technical support
pages.
Sensitivity and species cross-reactivity of the Ab Microarray
Because no two antibodies have exactly the same binding affinity (KA), the lower
detection limit of the Ab Microarray must be defined for each antibody. But on
average, we find that the Ab Microarray can detect as little as 20 pg/ml of a given
target protein.
Although we have not thoroughly tested each microarray for its cross-species
reactivity, it is likely that many of the epitopes recognized by arrayed antibodies
are conserved among closely—or even distantly—related species. In practice,
however, it is difficult to predict how a given microarray will perform for different
species. We recommend you review the array-specific antibody list (available at
www.clontech.com) to decide which Ab Microarray is suitable for your experimental system.
Overview of the Ab Microarray Procedure
The Ab Microarray Protocol, outlined in Figure 1, is a fluorescence-based
procedure in which solid-phase antibody is used to capture fluorescently-labeled
antigen. The entire procedure, from sample preparation to array scanning, takes
just one day to complete. Note that Ab Microarrays do not measure absolute
concentrations. Instead, they provide a relative measure of protein abundance;
that is, the protein levels in one sample (Sample A) are compared to those of a
second sample (Sample B).
Measuring protein abundances with Ab Microarrays consists of five main steps:
1.
2.
3.
4.
5.
Extracting protein
Labeling protein with Cy5 and Cy3 dyes
Removing unbound dye
Incubating labeled protein with Ab Microarrays
Scanning microarrays to measure bound antigen
In Step 1, total protein is extracted from 50–200 mg of cells or whole tissue. The
samples are first centrifuged to produce a pellet. Then, after a single freeze-thaw
cycle, each pellet is resuspended in Extraction/Labeling Buffer. (Before
resuspension, whole tissue must first be homogenized using a mortar & pestle,
as described in Section V.) Extraction/Labeling Buffer contains non-denaturing
BD Biosciences Clontech
4
www.bdbiosciences.com
Protocol # PT3648-1
Version # PR23092
Antibody Microarrays User Manual
I. Introduction & Protocol Overview continued
detergents, which emulsify membrane-bound protein but do not interfere with
antibody binding. This extraction protocol recovers ≥95% of the cell’s total protein
content. (This result is based on side-by-side comparison with a commonly used
SDS-boiling method.)
Step 2, protein labeling, results in the covalent attachment of multiple (2–6)
fluorophores to each protein molecule. This step showcases one of the key timesaving features of our protocol: Because protein extraction and labeling take
place in the same buffer, no buffer exchange steps are necessary to generate
labeled antigen. This not only saves you time, but prevents sample loss as well.
The second step also consists of some of the most critical hands-on manipulations in the microarray protocol. The manipulations, summarized in Figure 1
(Step 2), are necessary to control for variations in labeling efficiency. To prevent
the labeling step from skewing the array results, Samples A and B are each split
into two equal portions. Each portion is then labeled with either Cy5 or Cy3 to
produce four samples: A-Cy3, A-Cy5, B-Cy3, and B-Cy5. Notice as well that, in
labeling proteins, each of the dye solutions must also be split into equal portions
so that both samples react with identical dye stocks.
After protein labeling, unbound dye is removed in Step 3 by gel exclusion
chromatography (gel filtration). This step, which takes just a few minutes to
complete using small disposable desalting columns, removes excess dye and
transfers the labeled protein into the Desalting Buffer ready for microarray
analysis.
In Step 4, labeled protein is incubated with the Ab Microarrays. The labeled
samples are first combined to produce a mixture of Cy5- and Cy3-labeled
proteins. A-Cy5 is combined with B-Cy3 (Mix 1), while A-Cy3 is combined with
B-Cy5 (Mix 2). Once combined and thoroughly mixed, the fluorescently-labeled
antigens are ready for incubation with the Ab Microarray. An aliquot (comprising
10–50 µg of total protein) from each mix is incubated with a separate array in
separate chambers of the Incubation Tray (see Figure 1). Following the 30 min
incubation, the microarrays are washed, dried, and scanned (Step 5).
Specially formulated wash buffers ensure optimal signal-to-noise ratios
In developing the Ab Microarray, we have paid special attention to the compositions of the Extraction/Labeling, Incubation, and Wash Buffers. By careful
testing, we have formulated unique combinations of salts, detergents, and
polymers to produce buffers that will yield the highest possible signal-to-noise
ratio. Our Wash Buffers, for example, are specially formulated to minimize
background binding. Using Wash Buffers 1–7 in sequence, as described in
Section V.D., reduces the average background fluorescence to a level that may
be up to 100 times lower than that of some target signals.
Protocol # PT3648-1
Version # PR23092
www.bdbiosciences.com
BD Biosciences Clontech
5
Antibody Microarrays User Manual
I. Introduction & Protocol Overview continued
Sample Preparation
Sample A
Sample B
Cell pellet or crude tissue
Step 1
Protein extraction
(1–2 hr)
a. Freeze/thaw
b. Add Extraction/Labeling Buffer
c. Centrifuge
d. Collect supernatant
Complex solution of total
cellular protein
a. Measure protein concentration
b. Dilute each sample to 1.1 mg/ml
c. Split and combine with dye
Cy3 Fluorescent Dye
(monfunctional NHS-ester)
Extraction/Labeling
Buffer
110 µl
450 µl
450 µl
450 µl
Cy5 Fluorescent Dye
450 µl
(monfunctional NHS-ester)
110 µl
Extraction/Labeling
Buffer
Step 2
Protein labeling
(2–3 hr)
A-Cy3
A-Cy5
50 µl
B-Cy3
B-Cy5
50 µl
50 µl
50 µl
a. Incubate at 4°C for 90 min
b. Add Blocking Buffer
c. Incubate at 4°C for 30 min
d. Filter through PD-10 Desalting Columns
A-Cy3
A-Cy5
100 µg
B-Cy3
B-Cy5
100 µg
Step 3
Removing unbound dye
(1 hr)
Mix 1 (A-Cy5 + B-Cy3)
100 µg protein
100 µg protein
Mix 2 (A-Cy3 + B-Cy5)
Array Detection
Figure 1. The Ab Microarray procedure. This figure continues on the next page.
BD Biosciences Clontech
6
www.bdbiosciences.com
Protocol # PT3648-1
Version # PR23092
Antibody Microarrays User Manual
I. Introduction & Protocol Overview continued
Array Detection
Mix 1
10–50 µg protein
10–50 µg protein
Mix 2
5 ml Incubation Buffer
Incubation Tray
Wash
Incubation
Slide 1 Chambers
Wash
Incubation
Slide 2 Chambers
a. Incubate at room temperature for 30 min.
b. Place microarray slides array-side-up
in the incubation chambers using forceps
or gloved hands.
Step 4
Array incubation
(~2 hr)
567xcv4
567xcv4
Incubation Tray
Incubation
Wash
Slide 1 Chambers
Incubation
Wash
Slide 2 Chambers
Incubate at room temperature for 30 min
with constant rocking motion
Transfer slides to their respective
wash chambers and begin washing
Dry slides by centrifugation.
Step 5
Scanning Microarrays
(~30 min)
Scan
Figure 1. The Ab Microarray Procedure continued.
Protocol # PT3648-1
Version # PR23092
www.bdbiosciences.com
BD Biosciences Clontech
7
Antibody Microarrays User Manual
I. Introduction & Protocol Overview continued
Internally normalized results
By following our protocol, you obtain an Internally Normalized Ratio (INR) for
each antibody-antigen pair on the microarray. Internal normalization refers to the
sampling method described above (Steps 2–3) in which a portion of each protein
sample is labeled with a portion of each fluorophore (see Figure 1). This sampling
method controls for differences in labeling efficiency. For example, if Cy5 reacts
more efficiently with your protein targets than Cy3 does, your results will be
biased in favor of the sample labeled with Cy5. With our method, however, these
differences are eliminated because each protein extract is allowed to react with
each label, thus generating four individual samples: A-Cy3, A-Cy5, B-Cy3, and
B-Cy5.
After gel filtration, these four samples are combined in equal proportions to form
just two samples: Mix 1, which comprises A-Cy5 and B-Cy3; and Mix 2, which
comprises A-Cy3 and B-Cy5. These mixes are then incubated with the two Ab
Microarrays. One microarray is incubated with Mix 1; the second with Mix 2. In
this set up, Array 1 measures A-Cy5/B-Cy3 (Ratio 1). Whereas, Array 2
measures B-Cy5/A-Cy3 (Ratio 2).
After the slides are scanned and the fluorescence data are arranged in our Ab
Microarray Analysis Workbook (Microsoft ® Excel 97/98), an Internally
Normalized Ratio is obtained for each coordinate on the array by computing
Ratio 1
Ratio 2
.
This value represents the abundance of an antigen in Sample A relative to that
of Sample B. Please see Section VI for more details.
Controls
Several bovine serum albumin (BSA) spots are included on all Ab Microarrays.
Some of these spots are pre-labeled with Cy3 and Cy5, and, as discussed in
Section IV, serve as orientation markers to help you identify the printed area of
the microarray. Other BSA spots, not labeled with fluorophore, serve as negative
controls. The coordinates of all BSA spots are given on the Product Analysis
Certificate.
BD Biosciences Clontech
8
www.bdbiosciences.com
Protocol # PT3648-1
Version # PR23092
Antibody Microarrays User Manual
II. List of Components
Store Ab Microarrays at –20°C.
Store all other reagents at 4°C.
•
2
•
1
Ab Microarrays
(Supplied in Storage Buffer inside a green-capped Storage Vial)
Storage Vial (empty; green-capped)
•
1
Incubation Tray
•
10 ml
Extraction/Labeling Buffer
• 100 µl
Blocking Buffer
•
20 ml
10X Desalting Buffer
•
80 ml
Stock Incubation Buffer
•
5 ml
•
10 ml
Wash Buffer 1
•
10 ml
Wash Buffer 2
•
10 ml
Wash Buffer 3
•
10 ml
Wash Buffer 4
•
10 ml
Wash Buffer 5
•
10 ml
Wash Buffer 6
•
10 ml
Wash Buffer 7
•
Background Reducer
Ab MicroarrayTM Analysis Workbook
(A Microsoft Excel 97/98 file used for array data analysis. This
workbook must be downloaded from our website at
www.clontech.com)
Protocol # PT3648-1
Version # PR23092
www.bdbiosciences.com
BD Biosciences Clontech
9
Antibody Microarrays User Manual
III. Additional Materials and Equipment Required
The following materials are required but not supplied:
• Alumina (Sigma #A-2039; for disintegrating tissue samples)
• Bicinchoninic acid (BCA) solution (protein assay reagent)
Available from Pierce, or prepare your own (Smith et al., 1985; Coligan et al.,
1995)
• Bovine serum albumin (BSA; protein standard)
• 0.1 M sodium carbonate buffer (pH 8.3)
Used in the preparation of body fluids for array analysis
• Cy5 mono-Reactive Dye Pack (Amersham Biosciences; PA25001)
• Cy3 mono-Reactive Dye Pack (Amersham Biosciences; PA23001)
Cy5 and Cy3 are fluorescent dyes that have distinct emission spectra.
Amersham Pharmacia supplies the Cy5 and Cy3 dyes as monofunctional
N-hydroxysuccinimide (NHS)-esters in dried pre-measured amounts. The
NHS-ester is a functional group that reacts with primary amines. The reaction
produces a covalent bond, which links the dye to the protein. To use these
dyes with the Ab Microarray, follow the labeling procedure given in Section V.
• 1.5-ml and 2.0-ml microcentrifuge tubes
• 15-ml and 50-ml conical centrifuge tubes (e.g., BD FalconTM)
• Disposable PD-10 Desalting Columns
(Amersham Biosciences; 17-0851-01)
• Mortar & pestle (for grinding tissue)
• Rocking platform
(To provide a constant “see-saw” motion during slide incubation and
washing.)
• Swinging-bucket centrifuge (with adaptors for spinning 50-ml tubes)
• Microcentrifuge
• Microarray slide scanner
You may use any scanner that is compatible with 75 x 25 x 1 mm slides and
with dual-color analysis using Cy5 and Cy3 fluorescent labels.
• Microsoft® Excel 97/98 (software application)
Used for calculating Internally Normalized Ratios based on fluorescence data
from a microarray analysis.
• Internet connection
To download the Ab Microarray Analysis Workbook (a Microsoft® Excel 97/98
file) from www.clontech.com.
BD Biosciences Clontech
10
www.bdbiosciences.com
Protocol # PT3648-1
Version # PR23092
Antibody Microarrays User Manual
IV. General Considerations
Handling Ab Microarray Slides
• Wear laboratory gloves whenever handling Ab Microarrays. Alternatively, use
tweezers to manipulate slides.
• Always hold slides at the end nearest the affixed data label. (Note: This label
includes unique identifying information for the array.)
Orienting Microarrays
• To assist you in identifying the different blocks of the printed area after
scanning, spots of Cy3/Cy5-labeled bovine serum albumin (BSA) have been
printed on the slide. These BSA spots serve as orientation markers that you
can use to align the grid of your array analysis software. The Cy3/Cy5-labeled
spots are located at or near the outermost corners of the printed area. The
precise coordinates are given on the Product Analysis Certificate included
with your microarrays.
• Note that the data label is affixed to the printed surface of the slide.
• Please see the enclosed Product Analysis Certificate for the identity and
location of all array spots.
Using the Ab Microarray Storage Chamber
• Ab Microarrays are supplied inside a green-capped Storage Vial.
Do not remove the microarray slides until you have labeled your protein
samples and are ready to start the incubation (Section V.F).
• An empty, green-capped Storage Vial is also supplied. Use this vial to dry the
microarray slides as described in Section V.
Protocol # PT3648-1
Version # PR23092
www.bdbiosciences.com
BD Biosciences Clontech
11
Antibody Microarrays User Manual
V. Antibody Array Detection Protocol
PLEASE READ THE ENTIRE PROTOCOL BEFORE STARTING.
The Ab Microarray is designed to compare protein abundances among two
biological (tissue, cell, or body fluid) samples. In the following protocol, we refer
to these samples as “Sample A” and “Sample B.” While preparing Samples A and
B for array analysis, you may find it helpful to refer to Figure 1.
A. Extracting Protein from Crude Tissue
Before starting, chill the following items on ice or at 4°C:
• Extraction/Labeling Buffer
• one mortar & pestle
• two 2-ml microcentrifuge tube
• one 15-ml conical centrifuge tubes
1. Transfer 100–200 mg of frozen tissue to a pre-chilled mortar.
2. Add 0.25–0.5 g of alumina to the mortar.
3. Use the pestle to grind the tissue until a paste is formed.
4. Add 1–2 ml of pre-chilled Extraction/Labeling Buffer.
5. Mix the buffer into the paste using the pestle. When you finish, use a
micropipette tip to scrape the paste that adheres to the pestle back into
the mortar.
6. Transfer the extract to a pre-chilled 2-ml microcentrifuge tube.
7. While holding the pestle over the mortar, rinse the pestle with 1–2 ml
of Extraction/Labeling Buffer.
8. Combine the rinse with the original extract in a 2-ml tube. (Use a second
2-ml tube if the volume exceeds the tube’s capacity.)
9. Centrifuge the suspension at 10,000 x g for 30 min.
10. While taking care not to disturb the pellet, transfer the supernatant to
a pre-chilled 15-ml conical centrifuge tube.
11. Gently invert the tube to mix the lysate.
12. Measure protein concentration using the bicinchoninic acid (BCA)
method (Smith et al., 1985).
Note: We recommend using Pierce’s BCA Protein Assay Kit.
13. Dilute each sample to 1.1 mg protein/ml by adding the appropriate
volume of Extraction/Labeling Buffer. (In order to proceed with Part D,
the final volume must be ≥1 ml.)
14. Proceed immediately with Part D.
BD Biosciences Clontech
12
www.bdbiosciences.com
Protocol # PT3648-1
Version # PR23092
Antibody Microarrays User Manual
V. Antibody Array Detection Protocol continued
B. Extracting Protein from Cells
1. Centrifuge 50–150 mg of cells in a pre-weighed centrifuge tube.
Note: We find that two 150-mm culture plates, when combined, yield ~150 mg of cells.
We typically harvest two 150-mm plates for each Sample A and B. Before starting the
freeze-thaw procedure, we wash the cells four times with PBS (20 volumes each wash).
2. Decant the supernatant and aspirate any residual traces of liquid. Then
reweigh the tube to determine the weight of the cell pellet.
3. Freeze your samples by placing them in liquid nitrogen (–196°C) or in
a –80°C freezer.
4. Place your samples at room temperature, and add Extraction/Labeling
Buffer to each.
Note: Add 20 µl of Extraction/Labeling Buffer for each mg of cells or tissue—e.g., if your
sample comprises 50 mg of cells or tissue, add 1 ml of Extraction/Labeling Buffer.
5. Mix thoroughly by vortexing. Check to be sure the mixture is
homogeneous.
6. Incubate the samples at room temperature for 10 min with constant
rotation.
7. Centrifuge the suspension at 10,000 x g for 30 min at 4°C.
8. Transfer the supernatant to a clean tube. (Discard the pellet.)
9. Measure protein concentration using the bicinchoninic acid (BCA)
method (Smith et al., 1985).
Note: We recommend using Pierce’s BCA Protein Assay Kit.
10. Dilute each sample to 1.1 mg protein/ml by adding the appropriate
volume of Extraction/Labeling Buffer. (In order to proceed with Part D,
the final volume must be ≥1 ml.)
11. Proceed immediately with Part D.
C. Preparing Protein from Body Fluids
To measure protein levels in body fluids, you will need to complete the
following buffer exchange (desalting) steps. As long as you work quickly,
Steps 1–6 can be completed at room temperature. Otherwise, if you have
access to a cold room, we suggest you complete Steps 1–6 at 4°C.
1. Measure the concentration of protein in your sample using the
bicinchoninic acid (BCA) method (Smith et al., 1985).
Note: We recommend using Pierce’s BCA Protein Assay Kit.
2. Dilute your sample to ~4 mg protein/ml by adding the appropriate
volume of 0.1 M sodium carbonate buffer (pH 8.3).
3. Equilibrate a PD-10 Desalting Column with 15 ml of 0.1 M sodium
carbonate buffer (pH 8.3).
4. Load 2.5 ml of your sample on the PD-10 column.
Protocol # PT3648-1
Version # PR23092
www.bdbiosciences.com
BD Biosciences Clontech
13
Antibody Microarrays User Manual
V. Antibody Array Detection Protocol continued
5. After the sample has passed into the column, place a clean 15-ml
conical centrifuge tube under the column to collect the flow-through in
Step 6.
6. With a clean 15-ml tube in place to collect the flow-through, add 3.5 ml
of 0.1 M sodium carbonate buffer (pH 8.3) to the column.
7. Measure protein concentration using the bicinchoninic acid (BCA)
method (Smith et al., 1985).
Note: We recommend using Pierce’s BCA Protein Assay Kit.
8. Dilute each sample to 1.1 mg protein/ml by adding the appropriate
volume of Extraction/Labeling Buffer. (In order to proceed with Part D,
the final volume must be ≥1 ml.)
9. Proceed immediately with Part D.
D. Labeling Protein with Fluorescent Dye
Important: Complete Steps 1–10 rapidly without interruption. Once the
Cy3 and Cy5 dyes are dissolved in buffer, they must be used immediately.
1. Label four 1.5-ml microcentrifuge tubes: “A-Cy3,” “A-Cy5,”
“B-Cy3,” and “B-Cy5.”
2. Dissolve the Cy3 dye in 110 µl of Extraction/Labeling Buffer by adding
the buffer directly to the tube in which the dye is supplied.
Note: Our studies show, that each tube of dye contains a quantity of dye that will
optimally label 1 mg of total protein.
3. Mix thoroughly by vortexing for 20 sec.
4. Centrifuge the tube at moderate speed for 10 sec to recover the liquid
in the bottom of the tube.
5. Immediately add 50 µl of Cy3 solution to tubes “A-Cy3” and “B-Cy3.”
6. Prepare a solution of Cy5 dye in the same manner by following
Steps 2–4.
7. Immediately add 50 µl of Cy5 solution to tubes “A-Cy5” and “B-Cy5.”
8. Add 450 µl of Protein Sample A to tubes “A-Cy3” and “A-Cy5.”
9. Add 450 µl of Protein Sample B to tubes “B-Cy3” and “B-Cy5.”
10. Invert each tube three times to mix the contents. Then centrifuge each
tube at moderate speed for 10 sec to recover the liquid in the bottom
of the tube.
11. Incubate all four tubes on ice (or at 4°C) for 90 min. Mix each tube by
inversion every 20 min.
12. Add 4 µl of Blocking Buffer to each tube.
13. Incubate each tube on ice (or at 4°C) for 30 min. Mix each tube by
inversion every 10 min.
14. Proceed immediately with Part E.
BD Biosciences Clontech
14
www.bdbiosciences.com
Protocol # PT3648-1
Version # PR23092
Antibody Microarrays User Manual
V. Antibody Array Detection Protocol continued
E. Removing Unbound Dye (Desalting)
Use Amersham Biosciences PD-10 Desalting Columns to remove unbound
label as follows. (As long as you work quickly, Steps 1–7 can be performed
at room temperature. Otherwise, if you have access to a cold room, we
suggest you complete Steps 1–7 at 4°C.)
1. Set up and label four PD-10 Desalting Columns and four 2-ml
microcentrifuge tubes: “A-Cy3,” “A-Cy5,” “B-Cy3,” and “B-Cy5.”
Note: Use the microcentrifuge tubes at Step 6, below, to collect the final flowthrough.
2. Prepare 100 ml of 1X Desalting Buffer by diluting 10X Desalting Buffer
with the appropriate volume of Milli-Q-grade H2O. Store 1X Desalting
Buffer in a clean plastic bottle.
Note: Be sure that 1X Desalting Buffer has a pH = 7.4. Adjust the pH if necessary using
dilute HCl or NaOH.
3. Equilibrate each column with 15 ml of 1X Desalting Buffer.
4. Apply the Cy3- and Cy5-labeled protein samples (~500 µl each) to the
corresponding columns. Allow the protein sample to pass into the
column.
5. Add 2 ml of 1X Desalting Buffer to each column. Allow the buffer to pass
into the column to push the protein sample further along.
6. Place the 2-ml microcentrifuge tubes under the corresponding
columns.
7. Elute each protein sample by applying 2 ml of 1X Desalting Buffer to
each column. Collect the flowthrough.
8. Store the tubes on ice.
9. Measure protein concentration using the BCA method. (See notes
below.)
Notes for determining protein concentration:
• We recommend using Pierce’s BCA Protein Assay Kit.
• Use bovine serum albumin (BSA) as your protein standard. Construct a standard
curve using BSA solutions that are 0.02, 0.05, 0.1, 0.2, 0.3, 0.4, and 0.5 mg/ml.
• We recommend you measure each standard and protein sample in triplicate. Use
1X Desalting Buffer as a blank (i.e., as the 0 mg/ml sample).
• Because Cy3 and Cy5 absorb at 562 nm, you will need to subtract the dyes’
contribution to the overall OD562. To do this, prepare a protein blank that contains an
aliquot of your labeled protein sample and 1X Desalting Buffer, substituted for BCA
reagent. Calculate the ∆OD562 = [OD562 (protein sample) – OD562 (protein blank)]. Use the
∆OD562 and your standard curve to estimate protein concentration.
• Using the BCA method, we typically find that desalted samples contain
~0.2 mg protein/ml.
Protocol # PT3648-1
Version # PR23092
www.bdbiosciences.com
BD Biosciences Clontech
15
Antibody Microarrays User Manual
V. Antibody Array Detection Protocol continued
10. [Optional] Estimate the average number of dye molecules covalently
coupled to each protein. Follow the protocol in the Amersham Product
Specification Sheet, but first see the notes below.
Notes for estimating the average number of coupled dye molecules:
• Unless you have more precise measurements for the distribution of protein mass in
your sample, assume that the average molecular weight of protein is 60 kDa.
• Use the value determined with the BCA method, not the A280 method, to calculate
the molar concentration of protein in your sample.
• Measure Cy3 absorbance at 552 nm and Cy5 absorbance at 650 nm. Then use the
appropriate molar extinction coefficient (ε) to determine the molarity of each
(ε552 of Cy3 = 150,000 M–1 cm–1; ε650 of Cy5 =250,000 M–1 cm–1). See the sample
calculation below.
• For best results, the dye/protein ratio should be in the range of 2–4. When this ratio
is significantly greater (e.g., >6), the label may begin to interfere with antigenantibody binding.
11. Proceed immediately with Part F.
Sample calculation for Step E.10:
If you use 1-cm cuvettes, and you find that
• A552 of Sample A-Cy3 = 0.9
and
• [protein] of Sample A-Cy3 as measured by BCA assay = 0.18 mg/ml
then:
a. [Cy3] in Sample A-Cy3 = (0.9/150,000) x 106 = 6 µM
b. [protein] = (0.18 [g/L]/60,000 [g/mol]) x 106 = 3 µM
c. Cy3/protein = 6/3 = 2
F. Detecting Labeled Protein with the Ab Microarray
1. Prepare 45 ml of Incubation Buffer by mixing 4.5 ml of Background
Reducer with 40.5 ml of Stock Incubation Buffer*. Store Incubation
Buffer in a clean plastic bottle or tube.
* We provide you with 80 ml of Stock Incubation Buffer. You use 40.5 ml at this step,
to make “Incubation Buffer,” and the remainder (~39.5 ml) at Step 8.b, below.
2. Set up the Incubation Tray provided. Note that it contains four separate
chambers for incubating and washing microarrays 1 and 2. You may
find it helpful to mark the exterior surface of the tray with a pen to remind
you of these assignments: Slide 1 Incubation, Slide 1 Wash, Slide 2
Incubation, Slide 2 Wash.
BD Biosciences Clontech
16
www.bdbiosciences.com
Protocol # PT3648-1
Version # PR23092
Antibody Microarrays User Manual
V. Antibody Array Detection Protocol continued
3. Add 5 ml of Incubation Buffer to each incubation chamber of the
Incubation Tray.
4. Set up two 1.5-ml microcentrifuge tubes. Label the tubes Slide 1 Mix
and Slide 2 Mix.
5. In the 1.5-ml microcentrifuge tubes, combine Protein Samples A and B
as follows:
• Slide 1 Mix: combine 100 µg of Protein Sample A-Cy5 with 100 µg
of Protein Sample B-Cy3.
• Slide 2 Mix: combine 100 µg of Protein Sample A-Cy3 with 100 µg
of Protein Sample B-Cy5.
Note: If desired, the remainders of Samples A and B can be stored at 4°C (short-term
storage) or –20°C (long-term storage) for later use in other applications—e.g., Western
blotting. We do not recommend you use stored protein samples for future microarray
analyses.
6. Transfer 10–50 µg of protein from the Slide 1 Mix to the Slide 1
incubation chamber. Transfer an equal quantity of protein from the
Slide 2 Mix to the Slide 2 Incubation chamber.
Note: The amount of protein you add is partly dependent on the source of your sample.
If you suspect that some or many of the antigens are under-represented in one or both
of your samples, you may wish to add the maximum amount (i.e., 50 µg). For those cell
lines and tissue samples tested so far, we find that 10–20 µg of protein is usually
sufficient for detecting differences in antigen abundance.
7. Incubate the tray at room temperature for 30 min with gentle rocking.
8. Meanwhile, prepare the Ab Microarrays by washing the slides two
times as follows:
Notes:
• Use gloved hands or tweezers to hold and manipulate the microarrays.
• Never touch the array-end of the slide. Instead, always hold the slide at the end
nearest the affixed label.
a. While pressing your gloved finger against the top of the vial to keep
the slides from falling out, decant the Storage Buffer from the greencapped Storage Vial.
Note: The Storage Buffer contains glycerol and should be disposed of in a properly
labeled waste container.
b. Add 30 ml of Stock Incubation Buffer.
c. Cap the Storage Vial. Then slowly invert the vial 10 times.
d. Decant the Stock Incubation Buffer while using your gloved finger
to keep the slides from falling out.
e. Add 20 ml of Incubation Buffer (prepared at above at Step F.1).
f. Repeat Step c.
g. Stand the vial upright in a rack.
Protocol # PT3648-1
Version # PR23092
www.bdbiosciences.com
BD Biosciences Clontech
17
Antibody Microarrays User Manual
V. Antibody Array Detection Protocol continued
9. Record each slide’s serial number, and assign one slide to the Slide 1
Mix and one slide to the Slide 2 Mix.
10. Remove the slides one-by-one from the Storage Vial and place each,
array-side-up, in the tray chamber containing the Incubation Buffer/
Slide Mix to which it has been assigned. (The array is printed on the side
to which the label is affixed.)
11. Incubate the slides at room temperature for 30 min with gentle rocking.
Every 10 min, perform the following manipulation to assist the
exchange of liquid on all sides of the slide: Use a micropipette tip to pry
up one end of the slide while you gentle rock the Incubation Tray once
or twice.
12. Add 5 ml of Incubation Buffer (prepared in Step F.1) to each wash
chamber.
13. Transfer the slides to their respective wash chambers.
14. Incubate at room temperature for 5 min with gentle rocking.
15. Remove the buffer from the wash chambers.
16. Add 5 ml of Wash Buffer 1.
17. Incubate at room temperature for 5 min with gentle rocking.
18. Repeat Steps 15–17 using Wash Buffer 2; then using Wash Buffer 3.
And so on, until you have washed each Slide with each of the Wash
Buffers 1–7.
19. Dry the slides. It is important to remove as much moisture as possible
from the surface of the slides before the water evaporates passively.
We recommend the following method:
a. Using gloved hands and holding the slides by their edges only, place
the slides, array-end-up, in the empty, green-capped Storage Vial
provided. Important: Do not touch the array surface.
b. Cap the vial and centrifuge the slides at 1,000 x g for 25 min at room
temperature.
c. Using gloved hands, uncap the vial. While holding your finger over
the top of the vial to prevent the slides from falling out, tip the vial
slightly to nudge the slides near the rim of the vial. When the slides
protrude by ~2 cm, remove the slides one-by-one. Important: Do
not touch the array surface when removing the slides. Instead, hold
the slides by their edges.
20. Scan the slides with a microarray scanner.
If you need to postpone the scanning, keep the slides in a dry chamber
and protect them from light until you are ready to scan.
Note: Slides should be scanned ≤24 hours after drying.
BD Biosciences Clontech
18
www.bdbiosciences.com
Protocol # PT3648-1
Version # PR23092
Antibody Microarrays User Manual
VI. Analysis of Results
A. General Tips for Microarray Data Analysis
In order to use our Ab Microarray Analysis Workbook as described below
in Part B, you must first calculate the Cy5/Cy3 fluorescent signal ratios for
all coordinates on each array. This calculation can usually be done with
your array analysis software (e.g., GenePix Pro). The Cy5/Cy3 values are
required to calculate Internally Normalized Ratios (INRs), as described
below in Part B.
B. Using the Ab Microarray Analysis Workbook to Calculate Internally
Normalized Ratios
The Ab Microarray Analysis Workbook is a Microsoft® Excel 97/98 file that
helps you quickly convert your fluorescence data into Internally Normalized
Ratios (INRs) for each coordinate on the array. As described in the
Introduction (Section I), the INR calculated by our workbook is a numerical
value that represents the abundance of antigen in Sample A relative to that
of Sample B.
To get started:
1. Connect to www.clontech.com and download a copy of the workbook
that corresponds to the Lot Number of your Microarray. The Microarray
Lot Number is given on the data label affixed to the glass slide.
Note: The Microarray Lot Number differs from that of the assembled Kit. The Kit Lot
Number is shown on the Product Analysis Certificate and on the labels affixed to Boxes
1 and 2.
2. Launch Microsoft Excel. Then open the Microarray Analysis Workbook.
Upon opening the workbook, you will notice that it contains three
worksheets. The names of these sheets appear on tabs at the bottom
of the workbook window (Figure 2).
Figure 2. The Ab Microarray Analysis Workbook is composed of three worksheets.
The “Array” and “Ab List” worksheets contain array-specific information
such as the names and coordinates of antibodies and the Locus Link
and SWISS-PROT accession numbers of the corresponding protein
targets.
Protocol # PT3648-1
Version # PR23092
www.bdbiosciences.com
BD Biosciences Clontech
19
Antibody Microarrays User Manual
VI. Analysis of Results continued
The third worksheet, “Import & Analyses,” contains formulas that
perform arithmetic operations on the fluorescence data (i.e., Cy5/Cy3
signal ratios) that you paste into the worksheet. Other formulas in this
sheet combine the values of these operations to generate an INR for
each coordinate on the array. The INR can be represented by the
following expression:
INR =
Ratio 1
Ratio 2
where Ratio 1 =
and Ratio 2 =
A-Cy5 relative fluorescence units
B-Cy3 relative fluorescence units
B-Cy5 relative fluorescence units
A-Cy3 relative fluorescence units
Note that the Ratio 1 values are obtained from Slide 1. Whereas the
Ratio 2 values are obtained from Slide 2.
3. Click on the “Import & Analyses” tab to make it the active the window.
4. Paste the Cy5/Cy3 signal ratios from each array into the appropriate
columns of the worksheet (Figure 3). Be sure that your Cy5/Cy3 ratios
are listed in the same order as the corresponding Ab-Ag in the
worksheet.
When you paste your data into the worksheet, it automatically calculates Ratio 1/Ratio 2 and places these values in the next column, which
in Figure 3 is labeled “R/R.”
Figure 3. The “Import & Analyses” worksheet has three sections: Import, Analyses, and
Sorting. To use this worksheet, first paste your fluorescence data into the Import section (shown).
Be sure the data correspond to the correct antibody-antigen (Ab-Ag) pairs given in the leftmost
column. Note: The view shown is that from the Ab Microarray 380 Workbook.
BD Biosciences Clontech
20
www.bdbiosciences.com
Protocol # PT3648-1
Version # PR23092
Antibody Microarrays User Manual
VI. Analysis of Results continued
If your Antibody Microarray is one in which antibodies are printed in
duplicate, side-by-side spots, the worksheet will also calculate an
Average R/R and an Average INR for each antibody-antigen (Ab-Ag)
pair.
5. Choose File>Save As, and save a copy of the workbook under a new
name.
6. Copy the data in the Ab-Ag, (Average) R/R, and (Average) INR
columns.
7. Paste the data into the corresponding columns in the “Sorting” section
of the worksheet (Figure 4).
Figure 4. The “Sorting” section of the “Import & Analyses” worksheet. Note: the view
shown is that from the Ab Microarray 380 Workbook.
8. Choose Data>Sort, and sort the data by (Average) INR in ascending or
descending order.
Protocol # PT3648-1
Version # PR23092
www.bdbiosciences.com
BD Biosciences Clontech
21
Antibody Microarrays User Manual
VI. Analysis of Results continued
C. Interpretation of Results
• Average values (e.g., Average R/R and Average INR) are usually
considered invalid if they are based on duplicates that differ by more
than 30%. INR values are usually considered invalid if they are based
on Cy5/Cy3 ratios in which one or more of the antigen signals is(are)
less than twice the background signal.
• When an INR>1, an antigen is more abundant in Sample A than in
Sample B. Conversely, when an INR<1, an antigen is less abundant in
Sample A than in Sample B. This is the strict meaning of an INR.
But as you analyze your INRs, you should also consider the underlying
causes of an antigen’s apparent scarcity. A given antigen may be less
abundant in one cell (or tissue) type compared to another if posttranslational modifications obscure or alter the required epitope, or if rates
of degradation or expression differ. Any or all of these possibilities may
affect the levels of a protein as measured by the Ab Microarray.
• Although internal normalization improves the quality of your data, only
you can decide how large or small an INR must be for it to qualify as a
valid indicator of protein abundance. In our experience, INR values that
are ≥2.0 or ≤0.5 indicate with very high probability that there is a
difference in protein abundance. Changes of 1.5 and lower can be
accepted but with less confidence.
• To validate your results, you may wish to repeat the assay using
individual antibodies with a Western blot procedure.
BD Biosciences Clontech
22
www.bdbiosciences.com
Protocol # PT3648-1
Version # PR23092
Antibody Microarrays User Manual
VII. References
Abbott, A. (1999) A post-genomic challenge: learning to read patterns of protein synthesis. Nature
402:715–720.
Abbott, A. (1999) How to spot a protein in a crowd. Nature 402: 715–717.
Blattner, F. R., et al. (1997) The complete genome sequence of Escherichia coli K-12. Science 277:
1453–1470.
Bult, C. J., et al. (1996) Complete genome sequence of the methanogenic archaeon, Methanococcus
jannaschii. Science 273: 1058–1073.
Coligan, J. E., Dunn, B. M., Ploegh, H. L., Speicher, D. W. & Wingfield, P. T. (1995 et seq.) Current
Protocols in Protein Science (John Wiley & Sons, Inc., NY)
Dalton, R. & Abbott, A (1999) Can researchers find recipe for proteins and chips? Nature 402: 719–
720.
Goffeau, A., Barrell, B. G., Bussey, H., Davis, R. W., Dujon, B., Feldmann, H., Galibert, F., Hoheisel,
J. D., Jacq, C. , Johnston, M., Louis, E. J., Mewes, H. W., Murakami, Y., Philippsen, P., Tettelin, H.
& Oliver, S. G. (1996) Life with 6000 genes. Science 274:546, 563–7.
Haab, B. B., Dunham, M. J. & Brown, P. O. (2001) Protein microarrays for highly parallel detection
and quantitation of specific proteins and antibodies in complex solutions. Genome Biol. 2(2):
research0004.1–0004.13.
Hodgkin, J., Plasterk, R. H. & Waterston, R. H. (1995) The nematode Caenorhabditis elegans and
its genome. Science 270:410–414.
Lander, E. S., et al. (2001) Initial sequencing and analysis of the human genome. Nature 409:860–
921.
Simpson, R. J. & Dorow, D. S. (2001) Cancer proteomics: from signaling networks to tumor markers.
Trends Biotechnol. 19(suppl.):S40–S48.
Smith, P. K., Krohn, R. I., Hermanson, G. T., Mallia, A. K., Gartner, F. H., Provenzano, M. D,
Fujimoto, E. K., Goeke, N. M., Olson, B. J. & Klenk, D. C. (1985) Measurement of protein using
bicinchoninic acid. Anal. Biochem. 150:76–85.
de Wildt, R. M., Mundy, C. R., Gorick, B. D. & Tomlinson, I. M. (2000) Antibody arrays for highthroughput screening of antibody-antigen interactions. Nat. Biotechnol. 18:989–994.
Venter, J. C., et al. (2001) The sequence of the human genome. Science 291:1304–1351.
Zhou, H., Roy, S., Schulman, H. & Natan, M. J. (2001) Solution and chip arrays in protein profiling.
Trends Biotechnol. 19(suppl.): S34–S39.
VIII. Related Products
For the latest and most complete listing of all BD Biosciences Clontech
products, please visit www.clontech.com
• Ab Microarray 380
The Ab Microarray 380 recognizes 378 distinct
intracellular proteins.
• AtlasTM Glass Microarrays
• AtlasTM Plastic Microarrays
• AtlasTM cDNA Expression Arrays (membrane-based)
Protocol # PT3648-1
Version # PR23092
www.bdbiosciences.com
#K1847-1
many
many
many
BD Biosciences Clontech
23