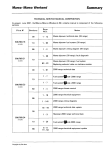
1
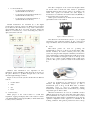
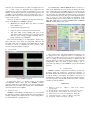
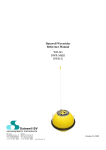
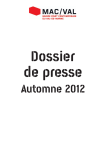
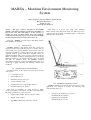
MAREA – Maritime Environment Monitoring
System
Marin Stipanov, Zdravko Eškinja, Dražan Skelin
Brodarski Institut d.o.o.
Zagreb,Croatia
[email protected]
Abstract — This paper contains a description of the MAREA
maritime environment monitoring system and its installation on
barge based crane. The main purpose of this system is to
monitor, log, detect and alarm critical crane work conditions,
considering wind direction and speed, wave direction and height
and three dimensional accelerations of the crane boom.
The barge is a closed type barge with structural
reinforcements of the deck in the crane area. The barge is also
equipped with diesel tanks, and ballast tanks for automated
pitch and roll compensation.
Keywords – MAREA, sea crane, barge, enviroment, wireless,
data acquisition, acceleration
I.
INTRODUCTION
MAREA maritime environment monitoring system was
designed and developed with the purpose to monitor and log
work condition for special maritime objects. In this case, the
system was installed on a barge based crane. The crane was
originally built for ground work where dynamic effects are
minimal. Installing such a crane on a barge gave this crane the
ability of maritime work thus widening its field of work and
making it much more cost-effective. For this crane to be useful
and safe for maritime work, the MAREA maritime
environment monitoring system was installed with a purpose of
monitoring, logging, detecting and alarming critical work
conditions.
II.
BARGE BASED CRANE DESCRIPTION
Technical details of the mentioned self-powered crawler
crane [1] are:
•
boom length: 97.5 m
•
mast height: 42.7 m
•
maximum payload: 251.4 tons
•
operational radius: 76 m
•
maximum allowed counterweight: 390 tons
•
maximum wind speed: 10 m/s
This crane was installed on a barge (Figure 1.) which
serves as an offshore work station, as well as a towed platform.
The barge specifications [2] are as follows:
•
length / width / height: 78.5 m / 31.0 m / 4.50 m
•
draught: 2.30 – 2.80 m
•
class HRB *50A1 barge with crane on deck
Figure 1. Barge based crane layout
III.
MAREA SYSTEM INSTALLATION
MAREA maritime environment monitoring system, in this
application, was designed to monitor the following vital
environmental values [3]:
•
wind speed VW at 10m above sea level
(maximum allowed: 10 m/s)
•
significant wave height Hm
(maximum allowed: 1,3 m)
•
boom accelerations:
o
boom alongside acceleration aX
(maximum allowed: 1,0 m/s2)
o
boom transverse horizontal acceleration aY
(maximum allowed: 0,2 m/s2)
o
boom transverse vertical acceleration aZ
(maximum allowed: 1,0 m/s2)
The data is displayed on the screen and adequate alarms
are shown when a monitored value reaches a predefined
maximum allowed value. For the values to be visible to the
actual crane operator in real-time, the same display is
broadcasted over a Wireless Local Area Network (WLAN) to
a screen in the crane operator cabin.
Wind speed is measured by an ultrasonic 2D anemometer
[4] installed on the control station.
Inertial accelerations are measured by a 3D digital
accelerometer on the tip of the boom. Wind speed is measured
by an ultrasonic 2D anemometer on top of the control station
(approximately 10m above sea level), and wave height and
direction is measured by a wave measuring buoy that is
deployed near the work site.
Figure 3. Ultrasonic anemometer
The ultrasonic 2D anemometer (Figure 3.) is a digital
anemometer with a RS-232 interface. It has a wind speed
range of 0-60 m/s, with 2% tolerance and 0.01 m/s resolution.
B. Crane
Photovoltaic panels are used for powering the
instrumentation on the tip of the boom (accelerometer, GPS,
wireless modules). To ensure constant power, the power
system was designed with adequate redundancy and the three
12V / 12Ah batteries together with the three 55 W photovoltaic
panels were installed on strategic locations on the tip of the
crane boom to ensure enough sunlight in all possible crane
positions. This power system is located in the accelerometer
box.
Figure 2. MAREA system installation chart
Wireless data transmission was imperative in this
application, because installing a cable along the boom was not
an option. Therefore a problem emerged due to the crane
extreme height and large work area.
Figure 2. shows how the system is divided in four different
sections:
•
Control station
•
Crane
•
Sea
•
Land
A. Control station
Main purpose of the control station is overall data
acquisition, logging and display. The control station consists
of an Industrial Personal Computer (IPC) to which all the data
is sent by sensory elements.
Figure 4. 3D Digital Accelerometer
Boom tip accelerations are measured by an RS-485
interface 3D digital accelerometer (Figure 4) with a
measurement span of ±2 g on all three axes. A built-in
temperature sensor is used for temperature change
measurement compensation. The accelerometer [5] working
temperature span is -40°C to 80°C.
Measured accelerations are sent via a WLAN converter
(WiPort) along the boom to the crane cabin relay station where
the measurements are relayed to the control station located
behind the crane. This wireless communication set-up was the
optimum configuration where signal loss is minimal in all
working conditions. The greatest problem was the boom tip
possible height and distance in relation to the control station.
Since no wireless antenna can give spherical coverage, the
boom tip readings could not be accessed without the relay
station on the crane cabin. In this configuration, all the used
antennas are very directional and therefore of high gain, except
for one omni-directional antenna used to relay data from the
cabin to the control station. It had to be omni-directional to
give coverage in all crane’s possible orientations.
Another set of WLAN equipment was used to transmit the
MAREA software display to the crane cabin display. This
separate WLAN was not necessary, but it was the best way to
prevent digital image transmission with high baud-rate needs to
cause measurement data delays or loss.
C. Sea
monitored values exceeds a predefined maximum an SMS
containing exact time and all critical values is sent.
IV.
MAREA SOFTWARE DESCRIPTION
MAREA system software was developed in the National
Instruments LabViewTM programming language due to its high
accountability for real-time applications and ease of code
maintenance.
MAREA system software is designed for real-time sensory
data acquisition, logging, display, and critical environment
situation detection. The graphic user interface (GUI) is
designed to be as user friendly as possible, which means that it
is easily understandable and usable by personnel with almost
no computer knowledge. The GUI is generally divided in these
three sections:
A. Main Tab
MAREA Main tab (Figure 6.) displays current sensory data
in real-time. Values critical for work environment are:
•
boom tip accelerations:
o
X (m/s2)
o
Y (m/s2)
o
Z (m/s2)
Figure 5. Wave measurement buoy
Wave measurement is done (Figure 5.) by a high precision
wave measurement buoy [6]. The only sensor used to measure
waves is a built-in GPS system that measures vertical
movement via GPS signal phase difference. Technical
characteristics are as follows:
•
wave height accuracy (free floating): 1 ÷ 2 cm
•
wave height accuracy (anchored): 1 ÷ 2 cm + 0.5%
•
calibration need: never
•
wave period: 1.6 ÷ 100 s
•
wave height resolution: 1 cm
•
wave height measurement span: -20 ÷ +20 m
•
measurement data: wave direction (NE), wave height
and period
•
wave direction resolution: 1.5°
The wave measurement buoy is deployed (anchored) near
the crane work site, and the data is transmitted via VHF RX-D2
protocol to the control station. The buoy is also equipped with
a GSM module to send warning messages via SMS in case it
detects it’s moved more than 50 meters from the desired
location. The GSM module is also used to send measurement
data via GPRS in an alternate configuration.
D. Land
MAREA system is equipped with a GSM module so alarms
could be sent via SMS to authorized personnel. If any of
•
wind direction (°) and speed (m/s)
•
significant wave height Hm (m)
Figure 6. MAREA Main Tab
Background color of mentioned values is dependant of the
displayed value. If a certain value surpasses the yellow or red
alarm level the background changes color accordingly. If a red
alarm is reached, an SMS message is sent to all predefined cell
phone numbers automatically, and a confirmation status
message is shown afterwards. Also a warning dialog box is
shown with a warning sound in case of a red alarm of any
value, which awaits operator’s confirmation. This way it is
assured that no environmental critical situation passed
unnoticed. Displayed values change at a rate dependant on the
sensor to which they apply. Anemometer values are sampled at
1 Hz rate, wave measurement buoy values are sampled at a rate
of 1 – 2 Hz, except for significant wave height Hm and
significant wave period Ti, which are calculated every cca. 30
minutes. Accelerometer values are sampled and logged at a rate
of 20 Hz, but only maximum values are displayed in every 1 s
timeframe. This way the three accelerations are much easier to
follow for the operator.
There are several less significant yet important values also
shown on the Main tab of MAREA software:
•
Maximum wave height Hmax (m) and its associated
period T(Hmax) (s)
•
accelerometer temperature (°C)
•
battery level (V): accelerometer box battery level
•
disk space (GB): shows available disk space of the
drive where values are being logged. According to the
disk free space change, logging remaining time is
being estimated every 30 minutes
If a COM LOSS or READ ERROR alarm is shown for a
value in the Main Tab, the error can here be diagnosed easily,
since original messages and CRC statuses are shown here. In
case of an instrument permanent malfunction, the instrument
can be turned off at will which disables logging of associated
values and warning messages. This option was implemented in
case of need for crane work whilst an instrument needs
replacement. This way associated values are grayed-out on the
Main Tab while lack of according COMM LOSS and READ
ERROR warning reduces annoyance.
The crane cabin display is an antireflective display since
almost all sides of the cabin are transparent. Therefore all
important values and color changes in the Main Tab are shown
as clearly as can be to minimize the crane operator’s time
needed to understand what is displayed.
B. Logging Tab
Figure 8. MAREA Diagnostic Tab
Since alarm values and critical instrument parameters can
be changed here, the Diagnostic Tab is not intended for
operator use and therefore its access is password protected. In
case of a change in operational parameters or alarm levels, all
relevant changes are made by adequate personnel or software
manufacturer. This was made to allow changes only to
personnel responsible for the MAREA system measurement
accuracy.
V.
Figure 7. MAREA Logging Tab
Logging Tab (Figure 7.) displays trends of all critical
environmental values since the last MAREA software
activation. This tab is used mainly for recent red alarm state
back-monitoring. An alarm state is much more understandable
when the values trend is available.
C. Diagnostic Tab
MAREA software Diagnostic Tab (Figure 8.) is used for all
the application settings possible. Parameters such as COM port
settings, sampling rates, alarm levels etc. can be changed here,
for each instrument or peripheral used.
CONCLUSION
MAREA maritime environment monitoring system was
designed, built and applied by experienced engineers of
Brodarski Institut. The system was designed for long time use
in harsh offshore environment and reduces any need for
maintenance as much as possible. Presented dedicated software
was developed in a user friendly manner and offers complete
real-time system surveillance.
REFERENCES
[1]
[2]
[3]
[4]
[5]
[6]
Manitowoc Cranes Inc., “Manitowoc 18000 Service Manual”,
September 2008.
Brodarski Institut, “General Arrangement - Crane based barge”, 2009.
Brodarski Institut, “Offshore Manual - Crane based barge”, 2010.
Gill Instruments Ltd., “Wind Sonic GPA Manual”, March 2008.
Summit Instruments Inc., “35201A User Manual”, August 2008.
Datawell BV, “DWR-G User Manual”, July 2008.