1
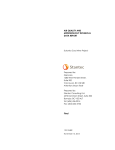
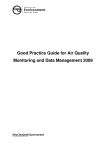
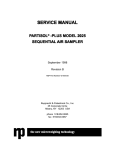
Hope Bay Mining Limited
client logo
Doris North Gold Mine Project:
Air Quality Compliance Report for
Section 4 Item 30 of the Project Certificate
Engineers & Scientists
Rescan™ Environmental Services Ltd.
Sixth Floor - 1111 West Hastings Street
Vancouver, BC Canada V6E 2J3
Tel: (604) 689-9460 Fax: (604) 687-4277
November 2009
DORIS NORTH GOLD MINE PROJECT
AIR QUALITY COMPLIANCE REPORT FOR SECTION 4 ITEM 30 OF THE
PROJECT CERTIFICATE
Executive Summary
Executive Summary
The following atmospheric monitoring requirements are outlined in the Doris North Gold Mine Project
Certificate (NIRB No. 003, issued September 15, 2006):
1. Section 4.0. Item 8. Newmont will fund and install a weather station at the mine site to collect
atmospheric data, including air temperature and precipitation. The design and location of this
station shall be developed in consultation with Environment Canada officials.
2. Section 4.0. Item 30. Newmont will install and fund an atmospheric monitoring station. This
station and its location shall be developed in consultation with EC and HC air quality officials and
focus on particulates of concern generated at the mine site. The results of air-quality monitoring
are to be reported every 6 months to NIRB through the Monitoring Officer, and from there to all of
the parties.
3. Commentary: NIRB expects that Canada Wide Standards for Dioxins and Furans and the Canada
Wide Standards for Mercury will apply and should be followed including stack testing of
incinerators.
This report is intended to meet the requirements outlined in bullet 2 above. Separate reports will be
submitted for the remaining bullets.
In order to comply with Item 30 in Section 4.0 of the Project Certificate, Newmont Mining Corporation
(Newmont) along with Rescan Environmental Services (Rescan) conducted the following activities in
2009:
o
Consulted with Mr. Dave Fox (Air Protection Management Analyst) of Environment Canada on
the operation and location of the two Partisol samplers and the ambient air quality monitoring
station prior to installation;
o
Collected measurements of particulates of concern, including both suspended particulate
matter (by the use of 2 Partisol samplers which measured PM10, PM2.5 and TSP) and dustfall (5
dustfall monitoring stations); and
o
Collected measurements of ambient air quality, including sulphur dioxide, nitrogen dioxide,
and ozone (SO2, NO2 and O3; by the use of 2 Passive Air Monitoring Systems (PASS)).
Two continuous suspended particulate matter samplers (Partisol instruments manufactured by
Thermo Fisher Scientific) and three dustfall collectors were installed in early summer 2009 to improve
the previous ambient air quality monitoring program. The ambient air samplers (PASS) were installed
in March 2009.
The samples collected for particulate matter (PM10, PM2.5 and TSP), dustfall and SO2, NO2 and O3 were
analyzed at an accredited laboratory. All parameters were compared with the Nunavut Environmental
Guideline for Air Quality Sulphur Dioxide and Suspended Particulates, and the National Ambient Air
Quality Objectives (NAAQOs) established under the Canadian Environmental Protection Act (CEPA).
2009 air quality monitoring results indicated that there were no exceedances for any of the monitored
parameters, and results were indicative of background concentrations associated with undeveloped
areas.
HOPE BAY MINING LIMITED
I
DORIS NORTH GOLD MINE PROJECT
AIR QUALITY COMPLIANCE REPORT FOR SECTION 4 ITEM 30 OF THE
PROJECT CERTIFICATE
Table of Contents
DORIS NORTH GOLD MINE PROJECT:
AIR QUALITY COMPLIANCE REPORT FOR
SECTION 4 ITEM 30 OF THE PROJECT
CERTIFICATE
Table of Contents
Executive Summary ......................................................................................................................................................................................I
Table of Contents ....................................................................................................................................................................................... III
List of Appendices.....................................................................................................................................................................IV
List of Figures..............................................................................................................................................................................IV
List of Tables ...............................................................................................................................................................................IV
List of Plates ................................................................................................................................................................................IV
Abbreviations and Definitions ...............................................................................................................................................................VI
1.
Introduction ............................................................................................................................................................................ 1–1
2.
Particulate Matter.................................................................................................................................................................. 2–1
2.1
Suspended Particulate Matter ......................................................................................................................... 2–1
2.1.1
2.1.2
2.1.3
2.2
Dustfall..................................................................................................................................................................... 2–7
2.2.1
Site Selection ........................................................................................................................................ 2–7
2.2.2
Monitoring Method............................................................................................................................ 2–7
2.2.3
3.
Results and Comparison................................................................................................................... 2–9
Ambient Air Quality Monitoring by Passive Samplers.............................................................................................. 3–1
3.1
Site Selection ......................................................................................................................................................... 3–1
3.2
3.3
4.
Site Selection ........................................................................................................................................ 2–1
Monitoring Method............................................................................................................................ 2–1
Results and Comparison................................................................................................................... 2–4
Monitoring Method............................................................................................................................................. 3–2
Results and Comparison .................................................................................................................................... 3–2
Results and Discussion ........................................................................................................................................................ 4–1
References................................................................................................................................................................................................. R–1
HOPE BAY MINING LIMITED
III
DORIS NORTH GOLD MINE PROJECT: AIR QUALITY COMPLIANCE REPORT FOR SECTION 4 ITEM 30 OF THE
PROJECT CERTIFICATE
List of Appendices
Appendix 1. Suspended Particulate Matter Results (TSP, PM10 and PM2.5) Partisol Samplers
Appendix 2. Passive Ambient Air Quality Results
Appendix 3. Dustfall Analysis Results
Appendix 4. Standard Operation Procedure for Partisol Ambient Air Quality Samplers
List of Figures
FIGURE
PAGE
Figure 2.1-1. Total Suspended Particulate (TSP), PM10 and PM2.5 Monitoring Station.................................................... 2–2
Figure 2.1-2. PM10/PM2.5 Sampler Simplified Diagram............................................................................................................... 2–5
Figure 2.2-1. New Dustfall Stations, Passive Samplers and Existing Dustfall Station ..................................................... 2–8
List of Tables
TABLE
PAGE
Table 1.1-1. PM10 and PM2.5 Results.................................................................................................................................................. 2–6
Table 1.1-2. Total Suspended Particulate Results....................................................................................................................... 2–7
Table 1.2-1. Dustfall Results (New Stations).................................................................................................................................. 2–9
Table 1.2-2. Dustfall Results (Previously Installed Stations) ..................................................................................................2–10
Table 1.2-3. Dustfall Limits in Several Jurisdictions..................................................................................................................2–10
Table 2.3-1. Passive Ambient Air Quality Monitoring Results................................................................................................. 3–3
Table 2.3-2. Ambient Air Quality Limits ......................................................................................................................................... 3–3
List of Plates
PLATE
PAGE
Plate 2.1-1. The Partisol ambient air samplers are located at the top of a butte that is approximately 660 m
north of the Doris camp. Doris Lake is shown in the background of this photograph. ............................... 2–3
Plate 2.1-2. Temperature controlled shelter housing the Partisol ambient air samplers, late August 2009. ......... 2–3
Plate 2.1-3. Inside the temperature controlled shelter the Partisol sampler for TSP is shown on the left and
the PM10/PM2.5 sampler is on right............................................................................................................................... 2–4
IV
RESCAN ENVIRONMENTAL SERVICES LTD. (PROJ#1009-002-02/REV A.1) NOVEMBER 2009
TABLE OF CONTENTS
Plate 2.1-4. The new Partisol air sampler filters are contained in a magazine on the left side of the unit.
The filters laden with suspended particulate matter are contained in a magazine on the right side
of the unit................................................................................................................................................................................. 2–6
Plate 2.2-1. Dustfall monitoring station three near the Doris project site. For locations using the ASTM
(2004) method two sample containers are required to provide a sufficient volume of sample for
the various parameters (e.g. particulate, anions, cations, total metals). Locations using the Alberta
Environment (AMD 1989) method only require one collector. ............................................................................. 2–9
Plate 3.1-1. The white circular device shown in this photo is the passive air sampling system near the Doris
automated meteorological station. ................................................................................................................................ 3–1
Plate 3.2-1. Passive air samplers under a rain shelter................................................................................................................ 3–2
V
RESCAN ENVIRONMENTAL SERVICES LTD. (PROJ#1009-002-02/REV A.1) NOVEMBER 2009
DORIS NORTH GOLD MINE PROJECT
AIR QUALITY COMPLIANCE REPORT FOR SECTION 4 ITEM 30 OF THE
PROJECT CERTIFICATE
Abbreviations and Definitions
Abbreviations and Definitions
Air Quality Standards
Objectives for maximum concentrations of criteria air contaminants in the atmosphere
developed to ensure long-tern protection of public health and the environment.
Ambient Air Quality
The outdoor air quality at particular site.
ASTM
American Society for Testing and Materials.
BCMoE
British Columbia Ministry of Environment.
Criteria Air Contaminants
Contaminants for which environmental regulatory agencies have established ambient air
concentration limits.
Fugitive Dust
Particulate matter, often sand or mineral dust, released to the atmosphere by mechanical
disruption of soil or by wind scouring.
Inhalable particulate matter
(PM10)
PM10 particles are airborne particles that have a diameter of 10 μm or less and are thus a
subset of total suspended particulate. The majority of PM10 particles are from fugitive
dust sources. PM10 can enter the respiratory system and have been linked to health
problems.
Oxides of Nitrogen (NOx)
NOx gas primarily consists of nitrogen oxide (NO) and nitrogen dioxide (NO2). The gases
are emitted with exhaust from combustion engines and products from blasting
operations. NOx can be converted to nitric acid in the atmosphere and thus contribute to
acid deposition.
Ozone (O3)
A colorless, odorless reactive gas naturally found in the earth’s stratosphere, where it
absorbs the ultraviolet component of incoming solar radiation that could be harmful to
life on earth. It is also found near earth’s surface where pollutants emitted from human
activities react in the presence of sunlight to form ozone. How sunny weather and
stagnant conditions favor ozone formulation. The principal pollutants involved in these
reactions are NOx, volatile organic carbon (VOC) and carbon monoxide (CO).
Respirable particulate matter
(PM2.5)
PM2.5 particles are a subset of PM10 and are defined as particles with a diameter less than
2.5 μm. These particles are small enough to enter deep into the respiratory system. The
majority of PM emitted in diesel engine exhaust is PM2.5.
Sulphur Dioxide (SO2)
Fossil fuel contains a small amount of organic compounds. During fuel combustion, the
sulphur is oxidized and emitted as SO2 gas with the engine exhaust. In the atmosphere,
SO2 can further oxidize to sulphate particles, which contribute to acid deposition.
TSP
Total suspended particulates (TSP) are solid matter or liquid droplets from smoke, dust,
fuel ash, or condensing vapours that can be suspended in the air.
USEPA
United States Environmental Protection Agency. The USEPA has promulgated a variety of
guidelines, objectives, emission factors, air dispersion modelling procedures and statutes
for the protection of ambient air quality.
HOPE BAY MINING LIMITED
VI
DORIS NORTH GOLD MINE PROJECT
AIR QUALITY COMPLIANCE REPORT FOR SECTION 4 ITEM 30 OF THE
PROJECT CERTIFICATE
1. Introduction
1.
Introduction
The following atmospheric monitoring requirements are outlined in the Doris North Gold Mine Project
Certificate (NIRB No. 003, issued September 15, 2006):
1. Section 4.0. Item 8. Newmont will fund and install a weather station at the mine site to collect
atmospheric data, including air temperature and precipitation. The design and location of this
station shall be developed in consultation with Environment Canada officials.
2. Section 4.0. Item 30. Newmont will install and fund an atmospheric monitoring station. This
station and its location shall be developed in consultation with EC and HC air quality officials and
focus on particulates of concern generated at the mine site. The results of air-quality monitoring
are to be reported every 6 months to NIRB through the Monitoring Officer, and from there to all of
the parties.
3. Commentary: NIRB expects that Canada Wide Standards for Dioxins and Furans and the Canada
Wide Standards for Mercury will apply and should be followed including stack testing of
incinerators.
This report is intended to meet the requirements outlined in bullet 2 above. Separate reports will be
submitted for the remaining bullets.
In order to comply with Item 30 in Section 4.0 of the Project Certificate, Newmont Mining Corporation
(Newmont) along with Rescan Environmental Services (Rescan) conducted the following activities in
2009:
o
Collected measurements of particulates of concern, including both suspended particulate
matter (by the use of 2 Partisol samplers) and dustfall (5 dustfall monitoring stations); and
o
Collected measurements of ambient air quality, including sulphur dioxide (SO2), nitrogen
dioxide (NO2), and ozone (O3, by the use of 2 Passive Air Monitoring Systems (PASS)).
As required in the Project Certificate, the locations for the instruments used to measure the above
parameters along with the monitoring objectives were reviewed and approved by Mr. Dave Fox (Air
Protection Management Analyst North, Environment Canada, Yellowknife).
Chapter 2 of this report provides the results from the particulate matter (both suspended particulate
matter and dustfall) measurements, and Chapter 3 of this report provides the results from the passive
ambient air quality samplers for SO2, NO2 and O3. Chapter 4 provides a brief discussion of the results.
HOPE BAY MINING LIMITED
1–1
DORIS NORTH GOLD MINE PROJECT
AIR QUALITY COMPLIANCE REPORT FOR SECTION 4 ITEM 30 OF THE
PROJECT CERTIFICATE
2. Particulate Matter
2.
Particulate Matter
Particulate matter is a criteria air quality contaminant (CAC) associated with mining and mineral
processing operations. It is generated by mobile equipment, crushing, blasting, bulk handling and
storage and other associated mineral processing and construction activities. As part of the ambient air
quality compliance monitoring program, particulate matter was monitored in 2009 at various
locations for the concentration of suspended particulate matter and dustfall.
2.1
SUSPENDED PARTICULATE MATTER
Suspended particulate matter (SPM) in ambient air generally is a complex, multi-phase system of all
airborne solid and low vapor pressure liquid particles having aerodynamic particle sizes from 0.01 to
100 μm in diameter and larger. SPM concentrations in ambient air were monitored using two Partisol
samplers located on the butte near the Doris camp. The site selection, methods and results are
presented below.
2.1.1
Site Selection
As with any type of ambient air monitoring study, the validity of conclusions depends on
representativeness of the sample data. Therefore, the sampling location and the siting of the ambient
air samplers are important.
Nunavut does not have established siting requirements for ambient air samplers. Therefore, the siting
criteria from the British Columbia Ministry of Environment (BC MoE 2009) and the USEPA methods
(USEPA 2009 and USEPA 1999) were used.
Additional factors, not specified in standard site selection criteria, were also considered. Due to the
very cold climate the Partisol samplers were installed inside a temperature controlled shelter. As a
result the sample schedule interruptions potentially caused by cold weather, wet conditions and
excess humidity (filter conditioning), air leaks and pump malfunctioning will be minimized. The
Partisol air sampler location is free from obstructions and nearby pollutant sources that may cause
interference in suspended particulate monitoring (Figure 2-1.1 and Plates 2-1.1 and 2.1-2).
2.1.2
Monitoring Method
Suspended particulate matter is being monitored by the Partisol ambient air samplers in three forms;
TSP, PM10 and PM2.5. The Partisol plus model 2025 ambient air sampler monitors TSP and the Partisol
Sequential Dichotomous Model 2025D ambient air sampler monitors PM10 and PM2.5 simultaneously
(Plate 2.1-3). The Partisol instruments are widely used in Canada for compliance monitoring programs
and are recognized as reference equivalent methods by the USEPA (USEPA 2009).
The Partisol ambient air samplers draw a particulate-laden ambient air stream through a size-selective
inlet, and then through a 47 mm diameter filter. A built-in pump provides the vacuum required to pull
the air flow through the sample filter and a volume flow controller monitors and automatically adjusts
the flow rate (Figure 2.1-2). The filters, approved for use with the Partisol ambient air samplers, were
the Pallflex TX40H120-WW teflon coated fibre glass type. The Partisol air sampler filters are pre and
post weighted at a laboratory that is accredited by the Canadian Association for Laboratory
Accreditation (CALA).
HOPE BAY MINING LIMITED
2–1
PROJECT # 1009-002-02
GIS # HB-12-003
November 2 2009
50
±
434000
15
0
10
0
50
150
7560000
50
7560000
433000
GF
Partisol Ambient
Air Samplers
50
7559000
7559000
Doris
North
Camp
Doris Automated
Meteorological
Station
50
7558000
GF
7558000
Doris Lake
Partisol Ambient
Air Samplers
)
Camp Location
500
7557000
7557000
1:15,000
250
100
ExistingQuarry
Road A
0
50
Doris Automated
Meteorological Station with
Passive Air Sampling
System and Dustfall
Station (Alberta Method)
Metres
Projection: UTM13, NAD83
433000
434000
Location of Partisol Ambient Air Samplers for
Total Suspended Particulate (TSP), PM10 and PM2.5
Figure 2.1-1
PARTICULATE MATTER
Plate 2.1-1. The Partisol ambient air samplers are located at the top of a butte that
is approximately 660 m north of the Doris camp. Doris Lake is shown in the
background of this photograph.
Plate 2.1-2. Temperature controlled shelter
housing the Partisol ambient air samplers, late
August 2009.
HOPE BAY MINING LIMITED
2–3
DORIS NORTH GOLD MINE PROJECT: AIR QUALITY COMPLIANCE REPORT FOR SECTION 4 ITEM 30 OF THE
PROJECT CERTIFICATE
Plate 2.1-3. Inside the temperature controlled
shelter the Partisol sampler for TSP is shown on
the left and the PM10/PM2.5 sampler is on right.
The filter exchange is performed using pneumatic pressure from the sample pump, and does not
involve any special electromechanical components, belts or motors. New filter cassettes from the
supply magazine (left) are pushed up and rightward to the sampling position, while the previous
cassette is moved to the storage magazine (right, Plate 2.1-4). The supply and storage magazines are
covered to seal off the filter cassettes thereby protecting them from environmental interferences
during sampling operations.
The Partisol Plus 2025 TSP sampler (the instrument on left at Plate 2.1-3) monitors only TSP therefore,
the instrument does not split the incoming ambient air and all sampling air goes through one filter.
The Partisol ambient air samplers at the Doris project are programmed to follow Environment
Canada’s National Air Pollution Surveillance (NAPS) schedule. The NAPS program requires 24-hour
sampling every six days for particulate matter monitoring.
2.1.3
Results and Comparison
The ambient air quality sampling program for suspended particulate matter started on August 17,
2009. Table 2.1-1 summarizes the results from the Partisol 2025 Dichotomous sampler which provides
ambient PM10 and PM2.5 concentrations. The PM10 and PM2.5 concentrations are representative of
baseline conditions in an undisturbed remote area. There are no ambient air quality standards in
Nunavut for PM10 and PM2.5 therefore the Canada-Wide Standards were used to compare PM2.5 and the
British Columbia and Ontario standards for PM10. The Canada-Wide Standards were created by the
Canadian Council for Ministers of the Environment (CCME).
2–4
RESCAN ENVIRONMENTAL SERVICES LTD. (PROJ#1009-002-02/REV A.1) NOVEMBER 2009
PROJECT # 1009-002-02
November 2, 2009
ILLUSTRATION # a24917f
PM-10 Inlet
(16.7 l/min)
Virtual
Impactor
1.7 l/min
Coarse PM
(PM10 - PM2.5)
15 l/min
Fine PM
(PM2.5)
Filter
Cassettes
5 l/min
Flow
controller
20 l/min
Flow
controller
Pump
Source: Thermo Fisher Scientific, 2007
Simplified Diagram for the Partisol Sequential
Dichotomous Model 2025D Ambient Air Sampler
Figure 2.1-2
DORIS NORTH GOLD MINE PROJECT: AIR QUALITY COMPLIANCE REPORT FOR SECTION 4 ITEM 30 OF THE
PROJECT CERTIFICATE
Plate 2.1-4. The new Partisol air sampler filters are contained in a magazine on the
left side of the unit. The filters laden with suspended particulate matter are
contained in a magazine on the right side of the unit.
Table 2.1-1. PM10 and PM2.5 Results Summary
Parameter
Units
24-hr
Limit
PM10
PM2.5
μg/m3
μg/m3
50*
30**
17-Aug09
23-Aug09
29-Aug09
04-Sep09
10-Sep09
16-Sep09
22-Sep09
2.9
1.6
2.2
1.4
4.2
2.2
7.8
3.5
4.8
2.9
6.4
4.1
4.8
2.8
* British Columbia and Ontario
** Canada-Wide Standard based on 98 percentile
Since the program was recently initiated, there are only seven sampling results and therefore a
definitive trend for particulate matter concentration cannot be discerned. The next 6 month reporting
period will provide sufficient data to be able to determine if there is a trend of increasing, decreasing
or steady particulate matter concentrations at the site.
Table 2.1-2 summarizes the results from the Partisol Plus 2025 sampler which monitors TSP
concentrations. None of the 24 hour TSP concentrations exceeded the Health Canada - National
Ambient Air Quality Objective (NAAQO) or the Nunavut Environmental Guideline for Air Quality.
Overall, the results are lower than expected because the TSP concentrations should be higher than the
PM10 and PM2.5 concentrations. PM10 and PM2.5 are subsets of TSP and the TSP sampler should be
collecting all PM with an approximate aero dynamic diameter of 100 μm or less. The cause of these
lower than normal TSP concentrations is currently being investigated.
2–6
RESCAN ENVIRONMENTAL SERVICES LTD. (PROJ#1009-002-02/REV A.1) NOVEMBER 2009
PARTICULATE MATTER
Table 2.1-2. Total Suspended Particulate (TSP) Results Summary
Sampling Date
TSP
Units
24-hr Limit
μg/m
120*
3
17-Aug09
23-Aug09
29-Aug09
4-Sep09
10-Sep09
16-Sep09
22-Sep09
1.6
1.8
2.3
1.8
1.2
1.2
0.9
* 24-hr limit specified in Canadian Ambient Air Quality Objective and the Nunavut Environmental Guideline for Air Quality
2.2
DUSTFALL
The purpose of the dustfall monitoring program is to quantify the amount of dust deposition near to
the Doris North project site and compare the results to the available criteria and standards.
Two dustfall monitoring stations began collecting data in March 2009. Three new dustfall monitoring
stations were established early July 2009. The first two dustfall stations are collocated with
meteorological stations at Doris and Boston. The dustfall results have been prorated by the laboratory
to a 30-day average, so that they can be compared with the standards. The first two existing dustfall
stations use an Alberta Environment method (Alberta AMD 1989), and the remaining three stations
use the ASTM 2004 method.
2.2.1
Site Selection
The two existing dustfall monitoring stations are located at the Doris North and Boston automated
meteorological stations. Three new dustfall stations were installed in the vicinity of Doris camp
(Figure 2.2-1) following the ASTM 2004 site selection recommendations. The dominant wind
directions as well as present and future project activities were considered during the site selection
process. There are no obstructions or local sources of air pollutants near the new stations. In addition,
the topography is very convenient to collect representative data (Figure 2.2-1). The dustfall
monitoring stations are in open areas that are free of structures higher than 1 m within a 20 m radius
of the collection container.
2.2.2
Monitoring Method
Dustfall (settleable particulate matter) was monitored at the three new dustfall monitoring stations by
using the ASTM D1739-98 method (ASTM 2004). The dustfall monitoring stations collect particles
small enough to pass through a 1 mm screen and large enough to settle by virtue of their weight.
This method requires containers of a standard size and shape which are sealed in a laboratory. The
containers are opened and installed inside of a wind screen for about 30 days. Monthly samples were
sent to the laboratory for analysis of total, soluble and insoluble particulate matter. There were two
dustfall collectors at each new dustfall station. One of the containers measured particulates (total,
soluble and insoluble) and anions (sulphate, nitrate, chloride, and ammonia) and the other measured
total metals and various cations. Because algae are an interference for the dustfall measurement the
deionized water in the dustfall containers also contains algaecide. The wind screen around the
sample container improves the dustfall collection efficiency and bird spikes are used to minimize
contaminants from bird droppings (Plate 2.2-1).
The two original dustfall stations were operated by using the Alberta Environment method (Alberta
AMD 1989). Each station consisted of one dustfall collector. Monthly samples were sent to the
laboratory for analysis of total dustfall and total fixed dustfall. Total dustfall is defined as the amount
of material left after evaporation of a sample of dustfall and its subsequent drying. Total fixed dustfall
is the residue that is left after ignition of the total dustfall sample (AMD 1989).
HOPE BAY MINING LIMITED
2–7
GIS # HB-12-004
November 2 2009
437500
50
DF1
50
50
50
50
50
50
7562500
435000
50
±
432500
GF
430000
7562500
PROJECT # 1009-002-02
50
50
50
50
50
50
50
50
7560000
50 50
1
150 00
7560000
50
100
50
Doris
Camp
50
50
50
50
50
50
50
50
50
7557500
GF
50
DF2
Doris Automated
Meteorological
Station
7557500
50
50
50
50
150
10
0
50
50
50
50
50
50
50
50
Metres
50
DF3
432500
435000
437500
Figure 2.2-1
Dustfall and Passive Air Quality Monitoring Stations
7552500
50
50
2,000
GF
GF
7555000
50
50
50
50
Existing Road
Projection: UTM13, NAD83
430000
50
50
Camp Location
1:50,000
1,000
50
50
50
50
50
0
50
50
50
)
50
50 50
Dustfall Monitoring
Station (July 2009)
Doris Automated
Meteorological Station with
Passive Air Sampling
System and Dustfall
Station (Alberta Method)
7552500
50
50
50
7555000
50
50
50
PARTICULATE MATTER
Plate 2.2-1. Dustfall monitoring station three near the Doris project site. For locations
using the ASTM (2004) method two sample containers are required to provide a
sufficient volume of sample for the various parameters (e.g. particulate, anions,
cations, total metals). Locations using the Alberta Environment (AMD 1989) method
only require one collector.
2.2.3
Results and Comparison
The dustfall results and standards are summarized in Table 2.2-1 and Table 2.2-2, respectively. Table
2.2-3 summarizes the dustfall limits in various jurisdictions. There is no consistency in dustfall limits
among various authorities and jurisdictions. Overall the Doris project dustfall results were lower than
any of the limits listed in Table 2.2-3. This was expected and indicates typical baseline levels for an
undisturbed area.
The concentration of total metals in the dustfall samples was also analyzed and the laboratory results
are in Appendix III. The results indicate that most of the total metal concentrations were below the
detection limit.
Table 2.2-1. Dustfall Results using the ASTM method (mg/dm2/day)
Dustfall
DF1
DF2
DF3
Jul-2009
Aug-2009
Jul-2009
Aug-2009
Jul-2009
Aug-2009
0.19
< DL
0.15
0.13
< DL
0.13
0.23
< DL
0.19
0.12
< DL
0.13
0.13
< DL
0.12
< DL
< DL
0.11
Total
Total Insoluble
Total Soluble
Note : < DL = Less than the detection limit of 0.10 mg/dm2/ day
HOPE BAY MINING LIMITED
2–9
DORIS NORTH GOLD MINE PROJECT: AIR QUALITY COMPLIANCE REPORT FOR SECTION 4 ITEM 30 OF THE
PROJECT CERTIFICATE
Table 2.2-2. Dustfall Results using the Alberta Environment method (mg/dm2/day)
Doris Station
Doris Total Dustfall
Doris Total Fixed Dustfall
Boston Station
Boston Total Dustfall
Boston Total Fixed Dustfall
Mar-2009
0.073
0.023
Apr-2009
0.097
0.073
May-2009
0.093
0.023
Jun-2009
0.153
0.100
Jul-2009
0.213
0.190
Aug-2009
0.473
0.437
Sep-2009
*
*
0.123
0.050
0.160
0.113
0.137
0.070
0.190
0.150
0.160
0.113
0.467
0.467
0.227
0.227
* Not available yet.
Table 2.2-3. Dustfall Limits in Several Jurisdictions
Jurisdiction
Dustfall Criterion Level
(mg/m2/day)
Comments
Dustfall Criterion
Level (mg/dm2/day)
175
averaged over 30 days
1.75
525
averaged over 30 days
5.25
Alberta
residential and
recreational areas
commercial and
industrial areas
Ontario
230
averaged over 30 days
2.3
Australia (new mines)
130
pro-rata compensation if
level exceeded
total compensation if level
exceeded
1.3
95th percentile complaints likely if
exceeded
96th percentile complaints likely if
exceeded
97th percentile complaints likely if
exceeded
1.0
330
United Kingdom
open country
100
residential areas
150
commercial areas
190
3.3
1.5
1.9
New York
Level I
Level II
Level III
Level IV
British Columbia Pollution
Control Objective (BC MOE 1979)
100
100
130
200
170 to 290
1.0
1.0
1.3
2.0
1.7 to 2.9
Source: Hrebenyk & Enns 2005 (except for the BC Pollution Control Objectives)
The total metal concentrations that were not below the detection limits were very low and for all
intents and purposes would be considered negligible. There are no specific criteria for total metals in
environmental dustfall. However, there is workplace or occupational air quality standards (e.g.,
industrial hygiene) for metals that are of concern with respect to human health. The metals that are a
concern for human health are cadmium, lead and arsenic. The concentrations of total arsenic in the
dustfall samples were below the detection limit in August but just above the limit of detection in July.
The concentrations of total cadmium and lead in the dustfall samples were negligible.
2–10
RESCAN ENVIRONMENTAL SERVICES LTD. (PROJ#1009-002-02/REV A.1) NOVEMBER 2009
DORIS NORTH GOLD MINE PROJECT
AIR QUALITY COMPLIANCE REPORT FOR SECTION 4 ITEM 30 OF THE
PROJECT CERTIFICATE
3. Ambient Air Quality Monitoring
by Passive Samplers
3.
Ambient Air Quality Monitoring by
Passive Samplers
Starting in March 2009, the passive ambient air quality samplers obtained monthly average
concentrations for criteria air contaminants at the Project site. Passive ambient air samplers were
collocated with the Boston and Doris automated meteorological stations and monitored SO2, NO2 and
O3 (Figure 2.2-1).
3.1
SITE SELECTION
The samplers (Plate 3.1-1) were placed in environmentally safe locations where they would not be
affected by weather or damaged by wildlife. They were placed far from obstructions and there were
no nearby roadways that could influence measurements. One sampler was located near the Doris
meteorological station (Figure 2.2-1) and the other was located near the Boston meteorological
station.
Plate 3.1-1. The white circular device shown in this photo is the passive air
sampling system near the Doris automated meteorological station.
HOPE BAY MINING LIMITED
3–1
DORIS NORTH GOLD MINE PROJECT: AIR QUALITY COMPLIANCE REPORT FOR SECTION 4 ITEM 30 OF THE
PROJECT CERTIFICATE
3.2
MONITORING METHOD
Passive air sampling is a diffusive method which monitors gas or vapor pollutants from the
atmosphere at a rate controlled by a physical process, such as diffusion through a static air layer or
permeation through a membrane. The passive method does not involve the active movement of the
air through the sampler; therefore no electric air moving pump is required. The number of days of
contact between the ambient air and the permeation membrane is important. The local
meteorological conditions are also used in the calculations. The meteorological parameters that are
used in the PASS calculations are air temperature, wind speed and relative humidity.
The passive air monitoring sampling system (PASS) provides low detection limits, is very easy to install
and does not require power. The passive sampler is kept under a rain shelter (Plate 3.2-1) on a tripod
beside the Doris meteorological station. The other PASS monitoring site is located at the Boston
meteorological station. Duplicate PASS samplers are collected at the Boston station.
Plate 3.2-1. Passive air samplers under a rain shelter.
3.3
RESULTS AND COMPARISON
Monthly PASS samples were analyzed at Maxxam Analytical Laboratory. The PASS results and
standards are summarized in Table 3.3-1 and Table 3.3-2, respectively. The original laboratory reports
are in Appendix II.
The PASS results are expressed as monthly average concentrations; however Health Canada’s National
Ambient Air Quality Objectives (NAAQO) and the Nunavut Environmental Guideline for Air Quality
only use averaging periods of 1-hour, 24-hour and 1-year. Therefore the PASS results cannot be
directly compared with the Canadian and Nunavut ambient air quality objectives or guidelines. After
a full year of PASS data has been collected, it will be possible to compare with the annual limit in the
NAAQO and Nunavut guidelines.
3–2
RESCAN ENVIRONMENTAL SERVICES LTD. (PROJ#1009-002-02/REV A.1) NOVEMBER 2009
AMBIENT AIR QUALITY MONITORING BY PASSIVE SAMPLERS
Overall the concentrations of SO2, NO2 and O3 were low and representative of baseline concentrations
in an undisturbed area.
Duplicate PASS samples are collected at the Boston station. During June 2009 there was a discrepancy
between the two results for ozone. The ozone concentration for the first PASS sampler was 20.7 ppb
but below the detection limit (0.1 ppb) for the second PASS sampler. The sample that was below the
detectable limit was eliminated from the data set because 20.7 ppb is more representative of the
baseline ozone concentrations at the Boston station.
Table 3.3-1. Passive Ambient Air Quality Monitoring Results
Doris Station
Parameter
Sampling Period
Units
Mar-2009
Apr-2009
May-2009
Jun-2009
Jul-2009
Aug-2009
μg/m3
ppb
μg/m3
ppb
μg/m3
ppb
< DL
< DL
3.0
1.6
1.4
0.7
< DL
< DL
0.4
0.2
60.2
30.7
< DL
< DL
0.8
0.4
79.6
40.6
0.3
0.1
< DL
< DL
55.9
28.5
< DL
< DL
0.2
0.1
40.6
20.7
< DL
< DL
0.6
0.3
39.4
20.1
μg/m3
ppb
μg/m3
ppb
μg/m3
ppb
0.2
0.1
0.2
0.1
65.6
33.5
< DL
< DL
5.6
3.0
50.2
25.6
< DL
< DL
1.9
1.0
57.5
29.3
< DL
< DL
0.2
0.1
40.6
20.7
< DL
< DL
< DL
< DL
39.6
20.2
< DL
< DL
0.6
0.3
38.2
19.5
SO2
NO2
O3
Boston Station1,2
Parameter
SO2
NO2
O3
< DL = Less than the detection Limit
Detection limits are (0.1 ppb) (0.26 ug/m3) for SO2, 0.1 ppb (0.188 ug/m3) for NO2 and 0.1 ppb (0.196 ug/m3) for O3.
Note 1 = The average of two samples are presented in the Table 2.3-1 above.
Note 2 = If one of the samples below detection limit and the other sample is in detectable limit, the undetectable concentration was
assumed as half of the detection limit (0.05 ppb) in average calculations.
Table 3.3-2. Ambient Air Quality Limits
SO2 *
NO2 **
O3 **
Unit
Annual
Daily
1-Hour
μg/m3
μg/m3
μg/m3
30
60
30
150
200
30
450
300
100
* Nunavut Environmental Guideline for Air Quality
** National Ambient Air Quality Objectives (NAAQOs) established and reviewed based on recommendations under the Canadian
Environmental Protection Act (CEPA)
Although direct comparisons cannot be made between the monthly PASS results and the NAAQO and
Nunavut air quality guidelines due to the different averaging periods some general observations can
be made.
The ozone concentrations at Doris and Boston were lower than the 1-hour NAAQO. They were also
lower than the CCME - Canada-Wide Standard which has an 8-hour limit of 65 ppb (127 μg/m3) for the
4th highest value. However, Health Canada’s National Ambient Air Quality Objectives (NAAQO) for
HOPE BAY MINING LIMITED
3–3
DORIS NORTH GOLD MINE PROJECT: AIR QUALITY COMPLIANCE REPORT FOR SECTION 4 ITEM 30 OF THE
PROJECT CERTIFICATE
Ground-level Ozone suggests that the average background ozone concentrations are 25 to 40 ppb for
a monthly average (Health Canada 1999). The ozone concentrations at the site ranged from 0.7 to
40.6 ppb and roughly one half of the ozone concentrations at Doris and Boston were lower than
Health Canada‘s suggested range for background ground-level ozone concentrations. These
observations are only based on 6 months of data collection and future data will add to the robustness
of the data set and allow for a more accurate comparison.
3–4
RESCAN ENVIRONMENTAL SERVICES LTD. (PROJ#1009-002-02/REV A.1) NOVEMBER 2009
DORIS NORTH GOLD MINE PROJECT
AIR QUALITY COMPLIANCE REPORT FOR SECTION 4 ITEM 30 OF THE
PROJECT CERTIFICATE
4. Results and Discussions
4.
Results and Discussion
The ambient air quality monitoring program at the Doris project site was substantially improved
during the summer of 2009. The two previously installed passive ambient air monitoring and dustfall
stations remained the same and three new dustfall stations were installed. In addition, two Partisol
ambient air quality samplers were installed to monitor TSP, PM10 and PM2.5.
The Partisol sampler and program follows the Environment Canada – National Air Pollutant
Surveillance (NAPS) schedule and allows for collection of a 24-hr sample every six days. The Partisol
program was initiated in mid August 2009 and there were seven results included in this report. The
PM10 and PM2.5 concentrations at the Doris site were typical of background concentrations for a
remote undisturbed area in Canada and they were lower than the Health Canada – National Ambient
Air Quality Objectives, Canada-Wide Standards and Nunavut Environmental Guideline for Air Quality.
The total suspended particulate matter concentrations at the Doris site were lower than expected;
therefore, the ambient air sampler with undergo an operational check. It is possible that a leak in the
system may have caused the lower than normal concentrations. A second possible cause could be an
error in the pre and post weighing of the Partisol air sampler filters at the analytical laboratory.
Three new dustfall stations were installed near the Doris site according to the ASTM 1739-98 method
(reapproved in 2004). The two original dustfall stations used the 1985 Alberta Air Monitoring Directive
Method. The monthly dustfall values were all below dustfall criteria in various jurisdictions. The
maximum recorded dustfall concentration of 0.23 mg/dm2/day (July 2009 at DF2) was below the
Alberta limit (5.25 mg/dm2/day) and British Columbia limit (1.7 to 2.3 mg/dm2/day).
The passive ambient air quality monitoring program included monthly sampling for SO2, NO2 and O3.
The maximum observed concentrations were 0.1, 3.0 and 40.6 ppb for SO2, NO2 and O3 respectively.
The background concentrations were representative of a remote undisturbed area. Because of
different averaging periods the PASS results (monthly average) cannot be directly compared with the
Nunavut Environmental Guideline for Air Quality or Health Canada’s National Ambient Air Quality
Objectives – NAAQO (annual, 24-hour and 1-hour averages). Generally the monthly average ozone
concentrations at the Doris site were in the range of background concentrations recommended by
Health Canada, 1999 (25 to 40 ppb monthly average). Additional future data will provide for more
useful comparisons to be made. After one year of PASS data has been collected it will be possible to
calculate an annual average for direct comparisons with the Nunavut Guidelines and Health Canada’s
NAAQO.
The ambient air quality monitoring program at the Doris site will continue with the collection of TSP,
PM10 and PM2.5 samples for 24-hr every 6 days, and monthly dustfall monitoring and passive air
sampling for SO2, NO2 and O3.
HOPE BAY MINING LIMITED
4–1
DORIS NORTH GOLD MINE PROJECT
AIR QUALITY COMPLIANCE REPORT FOR SECTION 4 ITEM 30 OF THE
PROJECT CERTIFICATE
References
References
Alberta Environment. 1989 (amended in 2006). Air Monitoring Directive (AMD) Appendix A-6
Determination of Dustfall, Edmonton, AB.
American Society for Testing and Materials (ASTM). 2004. Standard Test Method for Collection and
Measurement of Dustfall (Settleable Particulate Matter) Designation D 1739-98 Reapproved 2004,
West Conshohocken, PA.
British Columbia Ministry of Environment (BCMoE). 1979. Pollution Control Objectives for the Mining,
Smelting and Related Industry of British Columbia. Victoria, BC.
British Columbia Ministry of Environment (BCMoE). 2009. Air Monitoring Site Selection and Exposure
Criteria, Victoria, BC.
Canadian Council of Ministers of the Environment, (CCME). 2000. Canada-Wide Standards for
Particulate Matter (PM) and Ozone, Canadian Council of Ministers of the Environment, Quebec
City, QC.
Health Canada. 1999. National Ambient Air Quality Objectives for Ground-Level Ozone, Federal-Provincial
Working Group on Air Quality Objectives and Guidelines, Ottawa, ON.
Hrebenyk and Enns. 2005. Peer Review of Diavik Diamond Mine Air Quality Monitoring Program. Report
prepared for Environmental Monitoring Advisory Board, Yellowknife, NWT.
Nunavut Government. 2002. Environmental Guideline for Air Quality – Sulphur Dioxide and
Suspended Particulates. Government of the Nunavut, Environmental Protection Service,
Department of Sustainable Development, Iqaluit, NU.
US Environmental Protection Agency (US EPA). 1999. Compendium Method IO-2.3 Sampling of Ambient
Air for PM10 Concentration Using the Rupprecht and Patashnick (R&P) Low Volume Partisol
Sampler. Center for Environmental Research Information – Office of Research and
Development, Cincinnati, OH.
US Environmental Protection Agency (US EPA). 2009. Title 40: Protection of Environment Part 58Ambient air Quality Surveillance, Subpart G - Federal Monitoring Appendix E – Probe and
Monitoring Path Siting Criteria for Ambient Air Quality Monitoring, Research Triangle Park, NC.
HOPE BAY MINING LIMITED
R-1
DORIS NORTH GOLD MINE PROJECT
AIR QUALITY COMPLIANCE REPORT FOR SECTION 4 ITEM 30 OF THE
PROJECT CERTIFICATE
Appendix 1
Suspended Particulate Matter Results (TSP, PM10 and PM2.5)
Partisol Samplers
DORIS NORTH GOLD MINE PROJECT
AIR QUALITY COMPLIANCE REPORT FOR SECTION 4 ITEM 30 OF THE
PROJECT CERTIFICATE
Appendix 2
Passive Ambient Air Quality Results
DORIS NORTH GOLD MINE PROJECT
AIR QUALITY COMPLIANCE REPORT FOR SECTION 4 ITEM 30 OF THE
PROJECT CERTIFICATE
Appendix 3
Dustfall Analysis Results
DORIS NORTH GOLD MINE PROJECT
AIR QUALITY COMPLIANCE REPORT FOR SECTION 4 ITEM 30 OF THE
PROJECT CERTIFICATE
Appendix 4
Standard Operation Procedure for Partisol Ambient Air Quality
Samplers
STANDARD OPERATING PROCEDURE (SOP) FOR
HOPE BAY BELT PROJECT – BASELINE AMBIENT AIR
QUALITY MONITORING FOR PARTICULATE MATTER
(TSP, PM10 and PM2.5)
Project # 1009-002-02
Thermo 2025 D Sequential Dichotomous Partisol®-Plus
Thermo 2025 Partisol®-Plus
TABLE OF CONTENTS
1.
FILTER HANDLING, EXCHANGE and SHIPPING ............................................................................................................. 1-1
1.1
1.2
2.
SOFTWARE OVERVIEW.............................................................................................................................................................. 5
2.1
2.2
2.3
3.
Preparing the Filter Cassette Magazine......................................................................................................... 1-1
Installing a Filter Cassette Magazine .............................................................................................................. 1-1
Modes of Operation ................................................................................................................................................. 5
Basic Filter Setup Screen......................................................................................................................................... 6
Operation After Power Failure.............................................................................................................................. 9
SECTION 3 - AUDIT ...................................................................................................................................................................10
3.1
Leak Check.................................................................................................................................................................10
3.2
Flow Verification......................................................................................................................................................11
List of Appendices
APPENDIX A
Partisol Ambient Air Sampler Maintenance Record and Template for Calibration
APPENDIX B
Environment Canada NAPS Schedule
APPENDIX C
Example Chain of Custody for Maxaam Analytics
List of Plates
PLATE
PAGE
Plate 1.1-1. Placing filter cassettes in a magazine. ...................................................................................................................... 1-1
Plate 1.2-1. Thermo Partisol 2025 TSP Sampler............................................................................................................................ 1-2
Plate 1.2-2. Transport Container (left) and placing the magazine (right)............................................................................ 1-2
Plate 1.2-3. Cassette serial numbers to be recorded and entered in the software. ......................................................... 1-3
Plate 1.2-4. The sampling inlets (TSP on left and PM10/PM2.5 on right)............................................................................. 1-3
Plate 2.1-1. Stand-by screen display..................................................................................................................................................... 5
Plate 2.1-2. Partisol Keypad..................................................................................................................................................................... 6
Plate 2.1-3. Filter information screen................................................................................................................................................... 6
Plate 2.2-1A. 2025D Sequential Dichotomous ambient air quality sampler - Left side magazine loaded
with new filters and right side magazine for used filters. The front magazines are for PM10 and
the back magazines are for PM2.5........................................................................................................................................ 7
Plate 2.2-1B Main Screen........................................................................................................................................................................... 7
HOPE BAY MINING LTD.
i
STANDARD OPERATING PROCEDURE (SOP) FOR HOPE BAY BELT PROJECT – BASELINE AMBIENT AIR QUALITY
MONITORING FOR PARTICULATE MATTER (TSP, PM10 AND PM2.5)
Plate 2.2-2 The sample information screen (after <f3> filtsetup on main screen) ................................................................ 8
Plate 2.3-1. Thermo 2025 TSP Sampler. The left hand magazine contains new filters and the right hand
magazine contains used filters. ............................................................................................................................................. 9
Plate 3.1-1. Flow audit adapter. ...........................................................................................................................................................10
Plate 3.2-1. Sample tube and the flow verifier................................................................................................................................11
ii
RESCAN ENVIRONMENTAL SERVICES LTD. (PROJ#1009-002-02) (REV 0.2) October 2009
1.
FILTER HANDLING, EXCHANGE and SHIPPING
1.1
PREPARING THE FILTER CASSETTE MAGAZINE
Place the filters (in cassettes) coming from the laboratory into an empty magazine. These Teflon filters
(47 mm diameter, Pull flex TX-40) were pre-weighted at the laboratory and placed in numbered
cassettes. The metal part should be facing down when you are placing cassettes in the magazines.
(Plate 1.1-1).
Plate 1.1-1. Placing filter cassettes in a magazine.
1.2
INSTALLING A FILTER CASSETTE MAGAZINE
There are 2 Thermo Scientific Partisol ambient air quality samplers for suspended particulate matter
monitoring in the shelter. When you open the doors, the sampler on the left hand side is being used
for total suspended particulate (TSP) sampling (Partisol Plus 2025 TSP Sampler) and the width of this
sampler is relatively smaller than the other one and this width difference can be distinguished by eye.
The instrument has one sampling compartment which uses two magazines (Plate 1.2-1). The left hand
side will contain unused filter cassettes and the used filters will be stored on the right hand side.
hope bay mining ltd.
1-1
STANDARD OPERATING PROCEDURE (SOP) FOR HOPE BAY BELT PROJECT – BASELINE AMBIENT AIR QUALITY
MONITORING FOR PARTICULATE MATTER (TSP, PM10 AND PM2.5)
Plate 1.2-1. Thermo Partisol 2025 TSP Sampler.
New filter cassettes are always placed in the left magazine, and the used filter cassettes in the right
hand side magazine. Remove the tubing connected to the bottom of both magazines; the metal clip
on the tubing should be pressed to unlock the connection. No tools are necessary for this change out.
Remove the existing magazines by pushing gently up and than moving counter clockwise until it
releases itself and place the magazine, which contains used filters, in a transport container (Plate 1.22).
Plate 1.2-2. Transport Container (left) and placing the magazine (right).
After securing the samples (filter loaded cassettes) in transport container, install the new magazine
(which contains the unused filter cassettes) by matching the notches in the filter cassette magazine
with the mounting studs on the sampler. Push the magazine upward and rotate clockwise to lock it
into place.
Ensure that the cassette magazines are labeled prior to installation in the sampler because there are
different magazines that sample different types of particulate matter – for this sampler all samples are
for total suspended particulate (TSP). Record the serial numbers of the cassettes (Plate 1.2-3) in the
1-2
RESCAN ENVIRONMENTAL SERVICES LTD. (PROJ#1009-002-02) (REV 0.2) October 2009
FILTER HANDLING, EXCHANGE AND SHIPPING
order you placed them in the magazine. The filter numbers will be entered in the software program
by using the LCD screen. Instructions for the software program are available below in Section 2.
Plate 1.2-3. Cassette serial numbers to be recorded
and entered in the software.
The other Partisol ambient air quality sampler (Partisol PLUS Sequnetial Dichotomous Model #2025D)
is located on the right hand side of the enclosure. This Partisol had 2 compartments because it
samples both PM10 and PM2.5. These compartments have identical functionality with the Partisol
2025 TSP sampler. The difference is the PM10 inlet (Plate 1.2-4) at the end of the + 2 meter high
sampling tubes above the roof of the outdoor enclosure.
Plate 1.2-4. The sampling inlets (TSP on left and
PM10/PM2.5 on right).
hope bay mining ltd.
1-3
1-3
STANDARD OPERATING PROCEDURE (SOP) FOR HOPE BAY BELT PROJECT – BASELINE AMBIENT AIR QUALITY
MONITORING FOR PARTICULATE MATTER (TSP, PM10 AND PM2.5)
Fill out the chain of custody with sampling date and volumes and send the filter cassettes in a weather
proof hard case to;
Maxxam Analytics
Hope Bay Project (1009-002-02) – Partisol Filters
9331 - 48 Street, Edmonton, Alberta T6B 2R4
Tel: (780) 577-7100
1-4
RESCAN ENVIRONMENTAL SERVICES LTD. (PROJ#1009-002-02) (REV 0.2) October 2009
2.
SOFTWARE OVERVIEW
2.1
MODES OF OPERATION
Plate 2.1-1 summarizes the information displayed on the first “page” of the LCD screen. However, the
flow rate will be 16.7 l/min for the Partisol 2025 TSP sampler and 15 / 1.67 l/min for the Sequential
Dichotomous 2025D (PM2.5/ PM10) sampler. The mode will be “Wait” because this Project follows the
NAPS (National Air Pollution Surveillance) schedule from Environment Canada. This means that the air
samplers will work 24 hours every 6 days therefore if you don’t visit during a 24-hr sampling period,
you will always see the “wait” mode displayed.
Plate 2.1-1. Stand-by screen display.
Navigating among screens is done using the keypad. In order to edit, you should switch to “Stop”
mode from “Wait” mode, which is displayed on top right corner of the screen, by using run/stop
button on the left bottom button on the keypad (Plate 2.1-2). Since the software is already
programmed, the user will only use the instrument to enter filter names. Always remember to swith
“wait” mode by pressing lower-left button (Run/Stop) before leaving the shelter, otherwise the system
will not operate and partisol sampler will be on standby mode.
Once samples are collected in the right hand side filter magazine, make sure to fill in the data sheet in
Appendix A and send it to the laboratory with the samples and the chain of custody. To determine the
actual total volume of air sampled (m3) press <F4> Data and then press “filter data screen”.
Plate 2.1-3 summarizes the sampling data for filter “P 123456” with an actual sampled volume of 6 m3
on Apr 11, 1999. This information is to be filled in Appendix A form for laboratory calculations.
The filters will be weighted at the accredited laboratory (Section 1.2), and the actual volume of air
sampled will enable the laboratory staff to calculate the mass concentration of particulate matter in
ambient air.
hope bay mining ltd.
5
STANDARD OPERATING PROCEDURE (SOP) FOR HOPE BAY BELT PROJECT – BASELINE AMBIENT AIR QUALITY
MONITORING FOR PARTICULATE MATTER (TSP, PM10 AND PM2.5)
Plate 2.1-2. Partisol Keypad.
Plate 2.1-3. Filter information screen.
2.2
BASIC FILTER SETUP SCREEN
The Partisol ambient air quality sampling schedule is synchronized with Environment Canada NAPS.
The 2009 NAPS schedule is provided in Appendix B.
NAPS requires 24-hour sampling every 6 days. This sample frequency is already programmed in both
Partisols therefore no further programming is necessary. The memory keeps the sampling program
even there is a power failure.
After removing the magazine full of used filters and installing a magazine of new filters (Plate 2.2-1),
the new filter numbers should be entered on the field data sheet (Appendix A) in order to get
statistical data in the future, such as actual total volume of air sampled.
6
RESCAN ENVIRONMENTAL SERVICES LTD. (PROJ#1009-002-02) (REV 0.2) October 2009
SOFTWARE OVERVIEW
Plate 2.2-1A. 2025D Sequential Dichotomous ambient air quality sampler
- Left side magazine loaded with new filters and right side magazine for
used filters. The front magazines are for PM10 and the back magazines
are for PM2.5.
To enter filter names (numbers), press setup <F5> on the main screen (Plate 2.2-1B). (If you think
you’re not on the main screen, please press ESC button until you reach the main screen).
Plate 2.2-1B Main Screen
Then select the filter list setup screen, you will see a list to be edited. Press the edit button and enter
the name (number) of new filters in order. Remember that last filter you put in the magazine will be
number 1 in this list.
hope bay mining ltd.
77
STANDARD OPERATING PROCEDURE (SOP) FOR HOPE BAY BELT PROJECT – BASELINE AMBIENT AIR QUALITY
MONITORING FOR PARTICULATE MATTER (TSP, PM10 AND PM2.5)
You should also remind that front magazines are for coarse particulates (PM10 minus PM2.5) and rear
magazines are for fine particulates (PM2.5). The same types of filters are used for both the PM10 and
PM2.5 sampling. The only important point is to record which ones were at the rear (PM2.5) and at the
front (PM10) in the form at Appendix A. Make sure you know the order of filters installed in magazine
so if you made a mistake entering a filter name, data can be gathered by using date and time data. The
easiest way of gathering data is to take pictures of records on the screen (Plate 2.2-2). As it is seen on
Plate 2.2-2, the 6th filter in the magazine was sampled on September 22, 2009 with a total volume of
25.4 m3.
Plate 2.2-2 The sample information screen (after <f3> filtsetup on main screen)
The TSP model 2025 Partisol PLUS sampler has only one compartment (Plate 2.3-1). Both Partisol
samplers have the same system for organizing the filters in the left magazine contains new filters and
right magazine contains (or will contain) used filters.
As a summary, the operation needs attention to 2 important factors.
1. Taking the used filters with their sampling date and total volume.
2. Installing new filters and recording their filter names in order
Your shelter visit will be step by step as the following;
- Never visit the shelter during an operation day (NAPS scheduled) because the sampler is running.
- Take the used filters and write down on the magazine their compartment (TSP, Coarse-PM10 or FinePM2.5).
- Take pictures of the sampling records (see example as in Plate 2.2-2)
- Install new magazines and don’t forget to hook up air pumping tubing.
- Press <Run/Stop> button on left bottom corner of the keypad, and than once you see “Stop” on right
top corner of the LCD screen, enter filter names. And than make sure pressing <Run/Stop> button and
see “Wait” mode on the screen before you leave.
8
RESCAN ENVIRONMENTAL SERVICES LTD. (PROJ#1009-002-02) (REV 0.2) October 2009
SOFTWARE OVERVIEW
2.3
OPERATION AFTER POWER FAILURE
In the event of a power failure settings are not changed, the operation will continue when power
comes back. The system lots a “Z” condition to mark the power failure. Depending upon how much
time has passed, the unit will perform a filter exchange until it reaches the next filter scheduled to
sample. It then either begins sampling or enters the Wait Operating Mode to await the start of the
next sequential sample. If the unit begins sampling, the “Z” status condition will be retained in the
current record of filter data. However, if the unit enters the Wait Operating Mode, the unit will
automatically clear the “Z” status condition.
Therefore, the operator does not need to make any special programming changes but has to record
the power failure date and time in the form in Appendix A.
Plate 2.3-1. Thermo 2025 TSP Sampler. The left hand magazine contains new
filters and the right hand magazine contains used filters.
hope bay mining ltd.
99
3.
SECTION 3 - AUDIT
Because these parameters determine the flow rate used to calculate the TSP, PM10 and PM2.5
concentrations, a leak check, flow verification and temperature check should be performed
periodically.
3.1
LEAK CHECK
To determine if there are any air leaks, a filter cassette containing a new 47 mm filter must be installed
in the sampling position of the sampler. Then the following procedures should be followed:
1. Attach the flow audit adapter to the sample tube and close the valve on the flow audit adapter
(Plate 3.1-1).
Plate 3.1-1. Flow audit adapter.
2. While in the Audit screen, press LeakChk <F5> to display the Leak Check screen. Press <F2>
Start, and follow the instructions displayed on the screen.
3. A “Pass” or “Fail” message will display at the end of the leak check cycle. A pressure drop of 25
mm Hg or less is the Partisol air sampler’s leak check pass criteria.
4. If a “Fail” message is displayed, insert a new 47 mm filter into a filter cassette and place it in the
topmost position of the audit magazine. Usually previously used cassettes may cause a leak
problems because of damages caused during opening and closing. Make sure the cassettes
are tightened properly. Press <F4: FiltAdv> to move the new filter into sampling position.
Repeat the leak check procedure.
5. If a “Fail” message is again displayed, perform the troubleshooting procedures detailed in the
Service Manual.
hope bay mining ltd.
10
SECTION 3 - AUDIT
6. If a “Pass” message is displayed, slowly open the valve on the flow audit adapter. Record the
leak check results on the calibration and maintenance record (Appendix A).
7. Remove the flow audit adapter from the sample tube.
3.2
FLOW VERIFICATION
A leak test and temperature check should be done before verification of air flow. The ambient air
temperature readings should be ± 2 oC of the Partisols readings.
1. Remove the 2 m extension tube, and place the short sampling tube (Plate 3.2-1). A Streamline FTS
Flow Transfer Standard is used for verification. If necessary, remove the flow audit adapter (Plate
11) and install the FTS on the sample tube (Plate 3.2-1).
2. Press <F5: Audit> to enter the Audit screen. Confirm that 15.0 l/min and 1.67 l/min are the set
flows in the Set Flow field. Press <F2: Valve 1> and then <F1: Pump>. Wait for the flow rate
displayed in the Cur Flow column to stabilize.
3. If using the FTS, press <EDIT>, enter the pressure drop (inches H2O) from the Digital Manometer
display, and then press <ENTER>. The sampler will calculate and display the FTS volumetric air
flow rate. Follow steps 4a) to 7a) below for the Sequential Dichotomous 2025D air sampler. Follow
steps 4b) to 6b) below for the Partisol PLUS 2025 ambient air sampler.
Plate 3.2-1. Sample tube and the flow verifier.
If you are auditing the Sequential Dichotomous 2025D sampler:
o
When using the flow audit adapter, ensure that the first variable in the Cur Flow field is close
to 15.0 l/min. The measured flow should be within ± 5% of the displayed Cur Flow.
o
Press <F3: Valve 2> and <F1: Pump>. Wait for the flow rate displayed in the Cur Flow column
to stabilize.
o
If using the FTS, press <EDIT>, enter the pressure drop (inches H2O) from the Digital
Manometer display, and then press <ENTER>. The sampler will calculate and display the FTS
volumetric flow.
hope bay mining ltd.
11
11
STANDARD OPERATING PROCEDURE (SOP) FOR HOPE BAY BELT PROJECT – BASELINE AMBIENT AIR QUALITY
MONITORING FOR PARTICULATE MATTER (TSP, PM10 AND PM2.5)
o
When using the flow audit adapter, ensure that the second variable in the Cur Flow field is
close to 1.67 l/min. The measured flow should be within ± 5% of the displayed Cur Flow. If this
is not the case, perform the flow rate calibration procedure described in the Service Manual.
Press <F1: Pump> and <F3: Valve 2> to turn off the pump. Record the results of the flow
verification on the maintenance/calibration data sheet (Appendix A).
If you are auditing the Partisol PLUS 2025 (TSP) sampler:
12
o
When using the flow audit adapter, ensure that the first variable in the Cur Flow field is close
to 16.7 l/min. The measured flow should be within ± 5% of the displayed Cur Flow.
o
Press <F3: Valve 2> and <F1: Pump>. Wait for the flow rate displayed in the Cur Flow column
to stabilize.
o
When using the FTS, press <EDIT>, enter the pressure drop (inches H2O) from the Digital
Manometer display, and then press <ENTER>. The sampler will calculate and display the FTS
volumetric flow. Record the results of the flow verification on the maintenance/calibration
data sheet (Appendix A).
RESCAN ENVIRONMENTAL SERVICES LTD. (PROJ#1009-002-02) (REV 0.2) October 2009
Appendix A
Thermo Partisol Ambient Air Sampler Calibration Record
Hope Bay Belt Project, Nunavut (#1009-002-02)
Date
Time
Personnel(s)
:
:
:
Temperature (°C) at weather station
Barometric Pressure (kPa) at weather station
Circle One
:
:
:
Partisol 2025D Sequential Dichotomous Air Sampler S/N 99-004728-0120
Partisol 2025 Partisol Plus Air Sampler S/N 99-004724-0120
MAIN MENU
Partisol Sampler Date (YY-MMM-DD)
Partisol Sampler Time (0.00 – 24.00)
Status (normal value is “OK”)
Is it in “RUN” mode?
(top right hand corner of screen)
Next Sampling Date (DD-MMM)
(right hand side of screen under the column “Date”)
:
:
:
:
Y/N
:
AUDIT SCREEN
Ambient Temperature (°C)
Ambient Pressure (atm.)
:
:
* The difference between these two readings should not be below half the value of #1
* To convert kPa to atm, multiply by 0.009869. Ambient Press must be within +/-0.02 atm.
LEAK TEST
1. Vacuum gauge reading with flow control value closed. (Inch/Hg)
2. Vacuum gauge reading with both flow control manual valve and
pump manual value (Inch/Hg)
:
:
* The difference between these two readings should not be below half the value of #1
FLOW AUDIT
– Streamline FTS S/N
:
– Streamline FTS calibration date:
:
–m=
:
–b=
:
– Average Reading of FTS (Inches of water)
:
57-004506-0001
* FTS Flow should be within ±5% of 16.7 l/min
Note: The serial # can be found inside of the door or on the side of the filter / sampling compartment.
2009
National Air Pollution Surveillance Network
2009 High-Volume, PM10 SSI, and Dichotomous Partisol Sampling Schedule
Réseau National de Surveillance de la Pollution Atmosphérique
Échantillonneurs à Grand Débit, MP SSI, et Dichotomique: l’horaire 2009
Thursday
Wednesday
Tuesday
Monday
Sunday
Saturday
1-Jan-09
7-Jan-09
13-Jan-09
19-Jan-09
25-Jan-09
31-Jan-09
jeudi
mercredi
mardi
lundi
dimanche
samedi
Friday
Thursday
Wednesday
Tuesday
6-Feb-09
12-Feb-09
18-Feb-09
24-Feb-09
vendredi
jeudi
mercredi
mardi
Monday
Sunday
Saturday
Friday
Thursday
Wednesday
2-Mar-09
8-Mar-09
14-Mar-09
20-Mar-09
26-Mar-09
1-Apr-09
lundi
dimanche
samedi
vendredi
jeudi
mercredi
Tuesday
Monday
Sunday
Saturday
Friday
7-Apr-09
13-Apr-09
19-Apr-09
25-Apr-09
1-May-09
mardi
lundi
dimanche
samedi
vendredi
Thursday
Wednesday
Tuesday
Monday
Sunday
7-May-09
13-May-09
19-May-09
25-May-09
31-May-09
jeudi
mercredi
mardi
lundi
dimanche
Saturday
Friday
Thursday
Wednesday
Tuesday
6-Jun-09
12-Jun-09
18-Jun-09
24-Jun-09
30-Jun-09
samedi
vendredi
jeudi
mercredi
mardi
Monday
Sunday
Saturday
Friday
Thursday
6-Jul-09
12-Jul-09
18-Jul-09
24-Jul-09
30-Jul-09
lundi
dimanche
samedi
vendredi
jeudi
Wednesday
Tuesday
Monday
Sunday
Saturday
5-Aug-09
11-Aug-09
17-Aug-09
23-Aug-09
29-Aug-09
mercredi
mardi
lundi
dimanche
samedi
Friday
Thursday
Wednesday
Tuesday
Monday
4-Sep-09
10-Sep-09
16-Sep-09
22-Sep-09
28-Sep-09
vendredi
jeudi
mercredi
mardi
lundi
Sunday
Saturday
Friday
Thursday
Wednesday
4-Oct-09
10-Oct-09
16-Oct-09
22-Oct-09
28-Oct-09
dimanche
samedi
vendredi
jeudi
mercredi
Tuesday
Monday
Sunday
Saturday
Friday
3-Nov-09
9-Nov-09
15-Nov-09
21-Nov-09
27-Nov-09
mardi
lundi
dimanche
samedi
vendredi
Thursday
Wednesday
Tuesday
Monday
Sunday
Saturday
3-Dec-09
9-Dec-09
15-Dec-09
21-Dec-09
27-Dec-09
2-Jan-10
jeudi
mercredi
mardi
lundi
dimanche
samedi
ANALYTICAL REQUEST FORM
Calgary: 2021-41st Ave. NE, T2E 6P2. Ph: (403) 291-3077, Fax: (403) 291-9468, Toll free: (800) 386-7247
Page
Edmonton: 9619 - 42 Ave, T6E 5R2. Ph: (780) 465-1212, Fax: (780) 450-4187, Toll free: (877) 465-8889
1
of
Burnaby: 8577 Commerce Court, V5A 4N5 Ph: (604) 444-4808, Fax (604) 444-4511, Toll free: (800) 440-4808
Invoice To:
Require Report?
Yes
X
No
Report To:
PO# / AFE#:
Company Name:
Rescan Environmental Services Ltd.
Rescan Enviornmental Services Ltd.
Quotation #:
Contact Name:
Michelle Van Wyck
Dan Jarratt, P.Eng.
Project # :
1009-002-02
Address:
600 - 1111 West Hastings Street
600 - 1111 West Hastings Street
Proj. Name:
Hope Bay Belt Environmental Baseline Study
Nunavut, Canada
Vancouver, B.C.
REGULATORY REQUIREMENTS:
AT1 - Soil Contamination
CCME
Fax:
PST
CDWQG
CCME FWAL
G50
Regulatory Limits to appear on Final report
SERVICE REQUESTED:
RUSH (Please ensure you contact the lab)
Date Required:
(604) 687-4277
Ph:
(604) 689-9460
PC:
V6E 2J3
Location:
Fax:
(604) 687-4277
Sampler's Initials:
ANALYSIS REQUESTED
REPORT DISTRIBUTION:
Mail
Fax
X PDF
X Excel
Other:
X Email: [email protected]
METALS: (WATERS)
X REGULAR Turnaround
Total
Extractable
Dissolved
Hold >
60
Sample
Days Container #
Matrix
Date/Time
Sampled
Sample Type
Grab/Comp
1 23890
47 mm filter
3-Jul-08
Continuous
Y
2 23891
47 mm filter
3-Jul-08
Continuous
Y
3 23892
47 mm filter
3-Jul-08
Continuous
Y
4 23893
47 mm filter
9-Jul-08
Continuous
Y
5 23894
47 mm filter
9-Jul-08
Continuous
Y
6 23895
47 mm filter
9-Jul-08
Continuous
Y
7 23896
47 mm filter
15-Jul-08
Continuous
Y
8 23897
47 mm filter
15-Jul-08
Continuous
Y
9 23898
47 mm filter
15-Jul-08
Continuous
Y
10 23899
47 mm filter
21-Jul-08
Continuous
Y
11 23900
47 mm filter
21-Jul-08
Continuous
Y
12 23901
47 mm filter
21-Jul-08
Continuous
Y
Sample Identification
__
Particulate mass (TSP)
(604) 689-9460
Vancouver, B.C.
Particulate mass (PM10)
Ph:
V6E 2J3
Particulate mass (PM2.5)
Phone / Fax#:
PC:
X
X
X
X
X
X
X
X
X
X
X
X
** For water samples, please indicate if sample container has been preserved (P) and/or filtered (F).
Relinquished By:
Date/Time:
Mr. ____ ______
September 8, 2008
Received
Temperature
Signature:
COMMENTS/SPECIAL INSTRUCTIONS:
these are 47 mm diameter filters from a Partisol air sampler, the
attached note indicates volume of air filtered & sample time for each
FCD - 0026 Chain of Custody R4 - April 11, 2005
C of C #
1