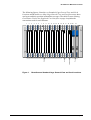
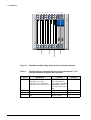
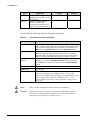
1
B r o a d A c c e s s Maintenance Guide P/N 760-000731 Rev A BroadAccess Maintenance Guide Table of Contents List of Figures __________________________________________________________________ iv List of Tables ___________________________________________________________________ vi 1. Introduction _____________________________________________________________ 1 1.1. Related Publications ______________________________________________ 2 1.2. Conventions and Terminology ______________________________________ 2 2. BroadAccess System Overview _____________________________________________ 7 3. Logging In ______________________________________________________________ 9 4. User Interface __________________________________________________________ 11 5. 4.1. Configuration Tree ______________________________________________ 12 4.2. Work Area_____________________________________________________ 13 4.3. Status Bar _____________________________________________________ 14 4.4. Menus and Toolbars in the NE Operation Window _____________________ 15 4.4.1. Menu Bar ____________________________________________ 15 4.4.2. Toolbar ______________________________________________ 19 4.4.3. Shortcut Menu ________________________________________ 20 4.5. Finding Subscriber Ports__________________________________________ 20 4.6. Creating Reports ________________________________________________ 26 4.6.1. Hiding Columns of Data in Tables ________________________ 27 4.6.2. Using the Advanced Database Filter _______________________ 28 4.6.3. Using the Report Designer_______________________________ 30 Fault Management _______________________________________________________ 37 5.1. Enabling and Disabling Audible Notification__________________________ 37 5.2. Modifying the Audible Notification Sound ___________________________ 38 5.3. Alarm Color Codes and Symbols ___________________________________ 39 5.4. Viewing Active Alarms __________________________________________ 40 5.5. Filtering and Sorting Alarms ______________________________________ 43 5.6. Searching for Specific Text in the Alarm Table ________________________ 45 5.7. Acknowledging and Deacknowledging Active Alarms __________________ 47 5.8. Entering and Editing Free Text for a Specific Alarm ____________________ 47 5.9. Viewing the Network's Alarm History _______________________________ 48 5.10. Viewing the Alarm Archive _______________________________________ 48 P/N 760-000731 Rev A 000731a BA40 Maint Guide Rel 7.doc 3/22/2006 5:10 PM Page i Table of Contents 5.11. Saving Alarm Reports to File ______________________________________ 51 5.12. Printing Alarm Reports ___________________________________________ 51 5.13. Editing NEs' Alarm Severity Levels _________________________________ 52 5.14. Viewing the Event Log ___________________________________________ 56 5.15. Viewing the Configuration Log_____________________________________ 58 5.16. 5.17. 6. Searching for Specific Text in the Configuration Log __________ 62 5.15.2. Printing Reports from the Configuration Log ________________ 63 5.15.3. Saving the Configuration Log to File _______________________ 63 Alarms and Troubleshooting _______________________________________ 64 5.16.1. Alarms and Indicators___________________________________ 64 5.16.2. Troubleshooting Methodology ____________________________ 65 5.16.3. Alarms Generated by BroadAccess ________________________ 66 5.16.4. Other Problems ________________________________________ 94 5.16.5. Troubleshooting Procedures ______________________________ 96 Line Testing___________________________________________________ 164 5.17.1. Viewing Line Test History ______________________________ 169 5.17.2. Selecting a Line or Lines to Perform Tests On_______________ 169 5.17.3. Performing External Line Tests __________________________ 170 5.17.4. Performing Background Line Tests _______________________ 171 5.17.5. Setting Line Test Thresholds ____________________________ 172 5.17.6. Performing an Alarm Simulation _________________________ 174 5.18. External Alarm Settings__________________________________________ 175 5.19. Loopback Tests ________________________________________________ 177 Performance Management ________________________________________________ 179 6.1. Page ii 5.15.1. Summary of Performance Monitoring Counters _______________________ 179 6.1.1. SDH Performance Monitoring ___________________________ 179 6.1.2. PDH Performance Monitoring ___________________________ 180 6.1.3. HDSL Performance Monitoring __________________________ 181 6.1.4. IP Uplink Performance Monitoring _______________________ 181 6.1.5. ATM Connection Performance Monitoring _________________ 185 6.1.6. ATM UNI Performance Monitoring_______________________ 185 6.1.7. ADSL Performance Monitoring __________________________ 186 6.1.8. G.SHDSL Performance Monitoring _______________________ 187 6.1.9. Ethernet Service Performance Monitoring __________________ 188 March 2006 P/N 760-000731 Rev A BroadAccess Maintenance Guide 6.2. Setting Up a Database of Performance Monitoring Statistics ____________ 189 6.3. Viewing Performance Monitoring Statistics__________________________ 191 6.3.1. Viewing ADSL Performance ____________________________ 192 6.3.2. Viewing G.SHDSL Performance_________________________ 200 6.3.3. Viewing ATM, Uplink and Bridge Port Statistics, and Learned MACs for the IP-UL-x Card _____________________ 203 6.3.4. Viewing ATM Performance_____________________________ 209 6.3.5. Viewing SDH Link Performance_________________________ 217 6.3.6. Viewing PDH Link Performance_________________________ 221 6.3.7. Viewing PCM E1 Link Performance ______________________ 223 6.3.8. Viewing HDSL Link Performance _______________________ 224 6.3.9. Viewing Ethernet Service Performance Monitoring __________ 230 6.4. Setting up Threshold Crossing Alerts _______________________________ 231 6.5. Viewing Traffic Reports _________________________________________ 232 6.5.1. Current Active Lines __________________________________ 232 6.5.2. Daily Usage _________________________________________ 234 6.5.3. Current Traffic _______________________________________ 235 6.5.4. Peak Hour Report_____________________________________ 237 6.5.5. Hour of Interest Report ________________________________ 238 7. Glossary of Terms ______________________________________________________ 243 8. Index ________________________________________________________________ 247 P/N 760-000731 Rev A March 2006 Page iii Table of Contents List of Figures Figure 1. BroadAccess Standard Cage General View and Card Locations __________________ 3 Figure 2. BroadAccess Mini Cage General View and Card Locations _____________________ 4 Figure 3. BroadAccess Standard Cage ______________________________________________ 8 Figure 4. The ClearAccess+ Main Window and NE Operation Secondary Window _____________________________________________________________ 11 Figure 5. Configuration Tree ____________________________________________________ 13 Figure 6. NE Operation Window's Status Bar _______________________________________ 14 Figure 7. Customer Phones Editor Window _________________________________________ 24 Figure 8. Phone Book Window___________________________________________________ 25 Figure 9. Field Chooser Dialog Box _______________________________________________ 27 Figure 10. Advanced Database Filter _______________________________________________ 29 Figure 11. Report Designer Dialog Box - Options Tab _________________________________ 33 Figure 12. Report Designer Dialog Box - Colors Tab __________________________________ 34 Figure 13. Report Designer Dialog Box - Fonts Tab ___________________________________ 35 Figure 14. Report Designer Dialog Box - Behaviors Tab _______________________________ 36 Figure 15. Alarm Sound Control Dialog Box_________________________________________ 38 Figure 16. Current Alarms Display in ClearAccess+ Main Window _______________________ 41 Figure 17. Grouped Alarms Using One Column Heading _______________________________ 45 Figure 18. Grouped Alarms Using Two Column Headings ______________________________ 45 Figure 19. Find Text Window_____________________________________________________ 46 Figure 20. Notes Window ________________________________________________________ 48 Figure 21. Alarm Archive Window ________________________________________________ 49 Figure 22. Alarm Archive Clean-Out Dialog Box - Now Tab ____________________________ 50 Figure 23. Alarm Archive Clean-Out Dialog Box - Schedule Tab_________________________ 50 Figure 24. NE Alarm Configuration Window ________________________________________ 54 Figure 25. Event Viewer Window _________________________________________________ 56 Figure 26. Configuration Log Window _____________________________________________ 59 Figure 27. Line Tests Window ___________________________________________________ 166 Figure 28. Line Tests Window - Choose Line Ports Dialog Box _________________________ 170 Figure 29. Background Line Tests Dialog Box ______________________________________ 171 Figure 30. Line Test Thresholds Dialog Box ________________________________________ 172 Figure 31. Alarm Simulation Window _____________________________________________ 175 Page iv March 2006 P/N 760-000731 Rev A BroadAccess Maintenance Guide Figure 32. External Alarm Settings Window ________________________________________ 176 Figure 33. PM Collection Settings Dialog Box ______________________________________ 190 Figure 34. ADSL Performance Dialog Box, Physical Tab, Interval Tab __________________ 193 Figure 35. ADSL Performance Dialog Box, Channel Fast Tab, Interval Tab _______________ 196 Figure 36. ADSL Performance Dialog Box, TC Layer Tab, Interval Tab__________________ 199 Figure 37. SHDSL Performance Monitoring Window ________________________________ 202 Figure 38. IP Uplink Window - ATM Statistics _____________________________________ 205 Figure 39. IP Uplink Window - Uplink Statistics ____________________________________ 206 Figure 40. IP Uplink Window - Bridge Port Statistics Index ___________________________ 207 Figure 41. IP Uplink Window - MACs Learned _____________________________________ 208 Figure 42. ATM Cross-Connect Performance Monitoring Window ______________________ 211 Figure 43. STM1-ATM Performance Monitoring Window ____________________________ 215 Figure 44. SDH Link Configuration Window - SDH Performance Tab, VC-12 Statistics ___________________________________________________________ 218 Figure 45. SDH Link Configuration Window - SDH Performance Tab, STM-1 ATM Statistics ______________________________________________________ 218 Figure 46. PDH, PCM E1 and HDSL Link Configuration Window - Performance Tab _______________________________________________________________ 222 Figure 47. HDSL Link Configuration Window - HDSL Quarter Hour Span Performance Tab_____________________________________________________ 226 Figure 48. HDSL Link Configuration Window - HDSL Daily Span Performance Tab _______________________________________________________________ 228 Figure 49. Ethernet Card Performance Monitoring: Port Window _______________________ 230 Figure 50. Currently Active Lines Window_________________________________________ 233 Figure 51. Unit Daily Usage Dialog Box___________________________________________ 234 Figure 52. Unit Current Traffic __________________________________________________ 236 Figure 53. Unit Peak Hour Report ________________________________________________ 238 Figure 54. Hour of Interest Report Dialog Box ______________________________________ 239 Figure 55. Set Hour of Interest Dialog Box _________________________________________ 240 P/N 760-000731 Rev A March 2006 Page v Table of Contents List of Tables Table 1. Element Naming Conventions used in the ClearAccess+, LCT and NE Operation Graphical User Interface_________________________________________ 4 Table 2. Conventions used in this Guide____________________________________________ 6 Table 3. Status Bar____________________________________________________________ 14 Table 4. Menu Bar Commands in the NE Operation Window __________________________ 15 Table 5. Buttons in the NE Operation Window's Toolbar______________________________ 19 Table 6. Phone Book Window Settings____________________________________________ 25 Table 7. Filter Window Generic Buttons___________________________________________ 28 Table 8. Report Types and Access Methods ________________________________________ 30 Table 9. Alarm Status Color Codes _______________________________________________ 39 Table 10. Domain and NE Color Codes ____________________________________________ 39 Table 11. Alarm Symbols _______________________________________________________ 40 Table 12. Active Alarms/Alarm History Windows Settings _____________________________ 41 Table 13. Find Text Window Settings______________________________________________ 46 Table 14. NE Alarm Configuration Window Settings _________________________________ 54 Table 15. Event Viewer Window Settings __________________________________________ 56 Table 16. Configuration Log Window Settings_______________________________________ 59 Table 17. BroadAccess Alarms ___________________________________________________ 67 Table 18. System Problems ______________________________________________________ 94 Table 19. ATM Problems _______________________________________________________ 94 Table 20. Transmission Problems _________________________________________________ 95 Table 21. Service Problems ______________________________________________________ 95 Table 22. AC Alarm ___________________________________________________________ 96 Table 23. AC or DC Test Failed __________________________________________________ 96 Table 24. ADSL Line LCD Alarm - LI-ADSL4P _____________________________________ 97 Table 25. AIS, RAI, LOS or High/Low Code Error Alarm at LI-4E1 Series Card ___________ 97 Table 26. Allocation Failed ______________________________________________________ 98 Table 27. ATM Bus Failure______________________________________________________ 98 Table 28. ATM Connection Problems______________________________________________ 99 Table 29. ATM Ring Failure at CU________________________________________________ 99 Table 30. ATM Ring Failure at RU_______________________________________________ 100 Table 31. ATM VC Alarms_____________________________________________________ 100 Page vi March 2006 P/N 760-000731 Rev A BroadAccess Maintenance Guide Table 32. ATM VP Alarms_____________________________________________________ 101 Table 33. Bus Conflict ________________________________________________________ 101 Table 34. Bus Conflict - VoIP __________________________________________________ 102 Table 35. Bus Fail____________________________________________________________ 102 Table 36. Cage Not Working ___________________________________________________ 103 Table 37. Cage Slave Out ______________________________________________________ 103 Table 38. Cannot Dial - Regular Subscriber________________________________________ 104 Table 39. Card Does Not Respond _______________________________________________ 104 Table 40. Card Misplaced______________________________________________________ 105 Table 41. ClearAccess+ Access Violation Error ____________________________________ 105 Table 42. ClearAccess+ Client Multi-Homed Computer Problem_______________________ 105 Table 43. ClearAccess+/LCT Not Working - Direct Connection _______________________ 106 Table 44. Clock Failure _______________________________________________________ 106 Table 45. Configuration Line Missing ____________________________________________ 107 Table 46. Configuration Line Missing - LI-4E1 Series Card ___________________________ 108 Table 47. Configuration Mismatch - PSDCx/PSRGx ________________________________ 108 Table 48. Common Control Card Backup Failure ___________________________________ 109 Table 49. CPT Slave Failure____________________________________________________ 109 Table 50. CRC Error, LOMF or TS 16 AIS ________________________________________ 110 Table 51. Cross-Connect Configuration Mismatch __________________________________ 110 Table 52. Data Transfer Problem - LI-ADSL4P_____________________________________ 110 Table 53. DC Alarm __________________________________________________________ 111 Table 54. Door Open Alarm ____________________________________________________ 111 Table 55. E1/UNI ATM Failure _________________________________________________ 112 Table 56. External Alarm ______________________________________________________ 112 Table 57. External Links Configuration Mismatch __________________________________ 113 Table 58. Facility Near/Far End _________________________________________________ 113 Table 59. Fan Failure _________________________________________________________ 113 Table 60. Hardware Loopback Indication _________________________________________ 114 Table 61. Hardware Malfunction ________________________________________________ 114 Table 62. Illegal Link Configuration _____________________________________________ 114 Table 63. Input Voltage Alarm __________________________________________________ 115 Table 64. Leakage Fault _______________________________________________________ 116 Table 65. Line is Down - LI-ADSL Series Cards____________________________________ 117 P/N 760-000731 Rev A March 2006 Page vii Table of Contents Table 66. Line is Down - LI-SHDSL Series Cards ___________________________________ 118 Table 67. Line is Down - VOIP-MG Series Cards ___________________________________ 118 Table 68. Link Blocked by Local Exchange ________________________________________ 119 Table 69. Link Configuration Mismatch ___________________________________________ 119 Table 70. Link Failure - LTM/HDSL Cards ________________________________________ 120 Table 71. LI-SHDSL Card Limit Exceeded ________________________________________ 120 Table 72. LOF Alarm at LI-4E1/LI-16E1 Series Card ________________________________ 121 Table 73. LOF or LOS Alarm at LI-8Nx64 Card ____________________________________ 121 Table 74. Management Communication Failure on the Link ___________________________ 123 Table 75. Many Alarm Indication Signal (AIS) _____________________________________ 123 Table 76. Many Line Alarms____________________________________________________ 123 Table 77. Many Remote Defect Indication (RDI) - VP ATM Layer _____________________ 124 Table 78. Media Failure________________________________________________________ 125 Table 79. Metering Mismatch ___________________________________________________ 125 Table 80. Mismatched HW Version Control________________________________________ 126 Table 81. Mismatched Subscribers _______________________________________________ 126 Table 82. No Clock/Sync Failed _________________________________________________ 127 Table 83. No Communication - RU and CU E1 Long Haul (LTM card) __________________ 127 Table 84. No Communication - RU and CU E1 Short Haul (LTM card) __________________ 128 Table 85. No Communication - RU and CU HDSL - 1 Doubler ________________________ 130 Table 86. No Communication - RU and CU HDSL - No Doublers ______________________ 131 Table 87. No Communication - RU and CU ONTU __________________________________ 132 Table 88. No Communication - RU and CU ONTU (with backup ONTU cards) ___________ 134 Table 89. No Dial Tone - Group of Subscribers or the Entire Cage (two cards or more) ______________________________________________________________ 135 Table 90. No Dial Tone - Regular Subscriber _______________________________________ 136 Table 91. No Dialing - Group of Subscribers (two cards or more) _______________________ 136 Table 92. No Intracalls ________________________________________________________ 137 Table 93. No Power ___________________________________________________________ 138 Table 94. No Power at CU______________________________________________________ 138 Table 95. No Power at an RU ___________________________________________________ 139 Table 96. No Power Feeding - Regular Subscriber ___________________________________ 140 Table 97. No Power Feeding to a Group of Subscribers (two cards or more) ______________ 140 Table 98. No Ringing - Group of Subscribers (two cards or more) ______________________ 141 Page viii March 2006 P/N 760-000731 Rev A BroadAccess Maintenance Guide Table 99. No Service DAT64-CO Subscriber ______________________________________ 142 Table 100. No Service - ISDN Subscriber (ISDNE Card) ______________________________ 143 Table 101. No Service - ISDN Subscriber (ISDNE or 4B3T Card) _______________________ 144 Table 102. No Service - LLSI Channel ____________________________________________ 145 Table 103. Power Limit Exceeded, Card Disabled____________________________________ 146 Table 104. Power Threshold Exceeded ____________________________________________ 146 Table 105. PSTN DL Failure ____________________________________________________ 146 Table 106. Read-Only Access to NEs using ClearAccess+ Client________________________ 147 Table 107. Remote Defect Indication (RDI) - STM1 ATM Interface _____________________ 148 Table 108. Same Line Element Detected in More than One RU _________________________ 149 Table 109. SHDSL VC12 Interface Alarms _________________________________________ 149 Table 110. Software Version Control Mismatch _____________________________________ 150 Table 111. STM1 ATM Interface Alarms __________________________________________ 150 Table 112. STM1 Problem ______________________________________________________ 151 Table 113. STM4 Problem ______________________________________________________ 153 Table 114. STM4 Series Backup Card Failure _______________________________________ 154 Table 115. Temperature Alarm___________________________________________________ 155 Table 116. Test Module Failed ___________________________________________________ 155 Table 117. Transmission Card Does Not Respond____________________________________ 156 Table 118. Unrecognized Card ___________________________________________________ 156 Table 119. Unsupported Card____________________________________________________ 157 Table 120. V5 Cycling Problem __________________________________________________ 157 Table 121. V5 Out of Service ____________________________________________________ 157 Table 122. V5 Variant Error _____________________________________________________ 158 Table 123. VC-12 Alarm _______________________________________________________ 159 Table 124. VC TIM Alarm ______________________________________________________ 160 Table 125. VF Failure__________________________________________________________ 160 Table 126. WDM Problem ______________________________________________________ 161 Table 127. xDSL LCD at Near End _______________________________________________ 162 Table 128. xDSL LCD at Near End - SHDSL Line ___________________________________ 163 Table 129. xDSL LCD at Far End - ADSL Line _____________________________________ 163 Table 130. xDSL LCD at Far End - SHDSL Line ____________________________________ 164 Table 131. Line Test Window Settings ____________________________________________ 166 Table 132. Line Test Thresholds Dialog Box Settings_________________________________ 173 P/N 760-000731 Rev A March 2006 Page ix Table of Contents Table 133. External Alarm Settings Window Settings _________________________________ 176 Table 134. SDH Performance Monitoring __________________________________________ 180 Table 135. PDH Performance Monitoring __________________________________________ 180 Table 136. HDSL Performance Monitoring _________________________________________ 181 Table 137. IP Uplink ATM Connection Performance Monitoring ________________________ 182 Table 138. IP Uplink Performance Monitoring_______________________________________ 182 Table 139. IP Uplink Bridge Port Performance Monitoring _____________________________ 184 Table 140. ATM Connection Performance Monitoring ________________________________ 185 Table 141. ATM-UNI Performance Monitoring ______________________________________ 186 Table 142. ADSL Performance Monitoring _________________________________________ 186 Table 143. G.SHDSL Performance Monitoring ______________________________________ 188 Table 144. Ethernet Service Performance Monitoring _________________________________ 188 Table 145. PM Archive Settings Dialog Box Settings _________________________________ 190 Table 146. ADSL Performance Window, Physical Tab Settings _________________________ 193 Table 147. ADSL Performance Window, Channel Fast Tab and Channel Interleave Tab Settings ________________________________________________ 196 Table 148. ADSL Performance Window, TC Layer Tab Settings ________________________ 199 Table 149. SHDSL Performance Window Settings ___________________________________ 202 Table 150. IP Uplink Window - ATM Statistics ______________________________________ 205 Table 151. IP Uplink Window - Uplink Statistics_____________________________________ 206 Table 152. IP Uplink Window - Bridge Port Statistics Index ____________________________ 208 Table 153. IP Uplink Window - MACs Learned______________________________________ 209 Table 154. ATM Cross-Connect Performance Monitoring Window Settings _______________ 211 Table 155. STM1-ATM Performance Monitoring Statistics_____________________________ 215 Table 156. SDH Performance Tabs Settings _________________________________________ 218 Table 157. PDH, PCM E1 and HDSL link Performance Tab Settings _____________________ 222 Table 158. HDSL Quarter Hour Span Performance Tab Settings_________________________ 227 Table 159. HDSL Daily Span Performance Tab Settings _______________________________ 228 Table 160. Ethernet Service Performance Monitoring Settings __________________________ 231 Table 161. Currently Active Lines Window Settings __________________________________ 233 Table 162. Unit Daily Usage Dialog Box Settings ____________________________________ 235 Table 163. Unit Current Traffic Window Settings ____________________________________ 236 Table 164. Peak Hour Report Window Settings ______________________________________ 238 Table 165. Hour of Interest Report Dialog Box Settings _______________________________ 239 Page x March 2006 P/N 760-000731 Rev A BroadAccess Maintenance Guide Table 166. Set Hour of Interest Dialog Box Settings __________________________________ 240 P/N 760-000731 Rev A March 2006 Page xi BroadAccess Maintenance Guide 1. Introduction This document explains how to troubleshoot and view performance monitoring statistics for BroadAccessTM Rel 7 systems, using either ClearAccess+TM or LCT. Information about managing BroadAccess Release 7 systems using ClearAccess+ can be found in the following user guides: • ClearAccess+ Installation and Administration Guide (included in the ClearAccess+ User Guide, which is supplied when you purchase ClearAccess+) - includes information about installation, logging in, network configuration, security and the alarm database. • BroadAccess Configuration Guide (included in the BroadAccess Release 7 Service Manual, and in the ClearAccess+ User Guide) - includes detailed information about configuring a BroadAccess Rel 7 system. • BroadAccess Maintenance Guide (this document, which is included in the BroadAccess Release 7 Service Manual, and in the ClearAccess+ User Guide) - includes detailed information about performance monitoring, fault management and troubleshooting a BroadAccess Rel 7 system. Information about managing BroadAccess Release 7 systems using LCT can be found in the following user guides: • LCT Installation and Administration Guide (located in the BroadAccess Release 7 Service Manual) - provides information about installation, logging in, security, using the Telnet Command Line Interface and the alarm database. • BroadAccess Configuration Guide (included in the BroadAccess Release 7 Service Manual, and in the ClearAccess+ User Guide) - includes detailed information about configuring a BroadAccess Rel 7 system. • BroadAccess Maintenance Guide (this document, which is included in the BroadAccess Release 7 Service Manual, and in the ClearAccess+ User Guide) - includes detailed information about performance monitoring, fault management and troubleshooting a BroadAccess Rel 7 system. This guide is intended for system engineers, administrators and end users that are responsible for planning, administering, configuring and maintaining BroadAccess systems. Familiarity with common network technologies, (such as IP, PDH, SDH, ATM, xDSL, POTS, ISDN and V5 telephony) is required. You access the windows specific to BroadAccess systems from the ClearAccess+ network tree or LCT main window. For more information about main window menu commands, installation and administration of ClearAccess+ or LCT, please refer to the corresponding user guide or access the corresponding help system from the ClearAccess+ or LCT main menu bar. P/N 760-000731 Rev A March 2006 Page 1 1. Introduction This document includes the following chapters: This chapter, Introduction, includes information about related publications, acronyms, abbreviations, conventions and terminology used in this guide. BroadAccess System Overview on page 7 provides a brief description of the BroadAccess system. Logging In on page 9 explains how to login to a ClearAccess+ client or to LCT. User Interface on page 11 describes the graphical user interface used to configure and manage BroadAccess systems. Fault Management on page 37 explains how to use ClearAccess+/LCT alarm features, lists the alarms generated by the system and suggested troubleshooting procedures, and explains how to perform tests on the system's lines. Performance Management on page 179 describes how to collect and view performance monitoring and traffic statistics. 1.1. Related Publications The following BroadAccess documentation was available on the release date of this guide: 1.2. • System Overview • System Description • Service Manual • Planning Guide • Applications and Engineering Guide (in Service Manual) • BroadAccess Configuration Guide (in Service Manual) • LCT Installation and Administration Guide (in Service Manual) • ClearAccess+ User Guide Conventions and Terminology A list of acronyms and abbreviations used in this guide can be found in the Glossary of Terms on page 243. ClearAccess+ and LCT refer to lines, links and ports corresponding to their location relative to the cards installed in the cage. Page 2 March 2006 P/N 760-000731 Rev A BroadAccess Maintenance Guide The following figures, BroadAccess Standard Cage General View and Card Locations and BroadAccess Mini Cage General View and Card Locations show card types and their position in BroadAccess cages. The table Element Naming Conventions Used in the Graphical User Interface on page 4 explains the conventions used for each Element. 1 2 LI16CU- E 3 LI16CU- E 4 LI16CU-E 5 LI16CU-E 6 LI16CU-E 7 LI16CU- E 8 LI16CU-E 10 9 LI16CU-E LI16CU- E LI16CU-E 11 LI16CU-E 12 LI16CU-E 13 LI16CU- E 14 LI16CU-E 15 LI16CU-E 16 17 ONTUE15 ONTUE15 18 19 20 CPT 21 CPT FAIL F AIL Vin Vin PSDC PSDC ON ON Figure 1. P/N 760-000731 Rev A OFF Power Transmission Control Service OFF BroadAccess Standard Cage General View and Card Locations March 2006 Page 3 1. Introduction 1 2 LI16CU-E 3 LI16CU-E 4 LI16CU-E 5 LI16CU-E 6 ONTUE15 7 ONT UE15 8 CPT 10 9 CPT FAI L FAI L Vin Vin PSDC PSDC ON ON Power Transmission OFF Figure 2. BroadAccess Mini Cage General View and Card Locations Table 1. Element Naming Conventions used in the ClearAccess+, LCT and NE Operation Graphical User Interface Term Page 4 Control Service OFF Explanation Format NE Network Element: a BroadAccess system, consisting of a Central Unit and one or more Remote Units The IP address of the NE is displayed in the title bar of the NE Operation window corresponding to the NE. CU RU Unit Central Unit in the NE Remote Unit in the NE Central or Remote Unit in the NE March 2006 Example CU (#33), RU#1 - RU#8 P/N 760-000731 Rev A BroadAccess Maintenance Guide Term Cage Card An NE can contain up to two cages in each CU, RU or single-side unit system. In BroadAccess systems, there are two types of cage: a standard cage that contains up to 21 cards, and a mini-cage that contains up to 10 cards. Line (service) Card CP Control Card Link Card Link (transmission) Cards PS Power Supply Card Line (Port) Line port on a card. For instance, if a line card contains 16 lines, their port numbers are 1-16 Link Link port on a card that transmits between the CU and the RU. For instance, if a link card contains 4 links, the port numbers are 1-4 A link that transmits between an LE and CU, or between an RU and a subscriber (for example, LI4E1 card). The LI-Link card is a type of line card, thus it is located in line slots 1 -15 V5 digital interface standard LI - Link V5.1 Interface V5.2 Interface STM-1 P/N 760-000731 Rev A Explanation Format <Unit > Card <Cage#>:<Slot#> Refers to service cards in slots 1 - 15 <Unit> CP <Cage#><Slot#> Refers to Control cards 1 and 2 <Unit> Link Card <Cage#>:<Slot#> Refers to Link cards 1 and 2 <Unit> PS <Cage#>:<Slot#> Refers to Power Supply cards 1 and 2 <Unit>Line <Cage#>:<Slot#>: <Port#> Refers to service cards in slots 1 - 15 <Unit>Link <Cage#>:<Slot#>: <Port#> Example Cage 1:07 RU#3:1:8 RU#5 CP 1:02:A/B RU#2 Link #1:02 CU PS 1:01 RU#3 Line 1:05:10 RU#5 Link 2:01:04 <Unit>LI - Link <Cage#>:<Slot#>: <Port#> Refers to service cards in slots 1- 15 CU LI-Link 1:02:04 V5.1#< Interface#> V5.1 #15 V5 digital interface standard V5.2 # 1 V5.2 #1 Synchronous Transport Module that transmits at a rate of 155 Mbit/s CU Link 1:02:1 STM -1 #2 March 2006 Page 5 1. Introduction Term STM-4 VC-12 Explanation Format Example Synchronous Transport Module that transmits at a rate of 622 Mbit/s Virtual Container level 12, which is used in SDH transmission to map services and path overhead information You will find the following elements throughout the manual: Table 2. Conventions used in this Guide Convention Screen Elements Shortcut Menu Sequence of Menu Options File Name Path Name or Typed Text <Key> Page 6 Description This font is used to indicate screen elements such as buttons, menu options, commands, icons, boxes, fields and options which you can select in the graphical user interface. For example, the OK button, the Performance menu or the Cage View option. The Shortcut menu refers to a context sensitive menu, which is accessed by clicking the right mouse button. The commands displayed differ, depending on the object on the screen that the mouse is pointing to when the right mouse button is clicked. A sequence of menu options is indicated using the pipe (|) symbol. For example, View|Alarm History means you should click View on the menu bar and then select the Alarm History option. This font indicates file names. This font indicates a path name on a computer, or text that you have to type. This convention indicates the name of the key on the keyboard that you need to press; for example, <Enter> refers to the "Enter" key. Simultaneous key strokes are represented by a plus sign (+) between key names. For example, <Ctrl> + <A> indicates that you press the "Ctrl" key and the "A" key at the same time. Note: Notes contain information about special circumstances. Caution: Cautions indicate operations or steps that could induce a safety problem in a managed device, destroy or corrupt information, or interrupt or stop network or client services. March 2006 P/N 760-000731 Rev A BroadAccess Maintenance Guide 2. BroadAccess System Overview BroadAccessTM is a Multiservice Access Gateway (MSAG) based on advanced technology, providing Next Generation Network (NGN) and Triple Play solutions. The system provides simultaneous support of TDM and VoIP network interfaces, enabling smooth migration from a circuit switch to the NGN, and a gradual transition of the voice subscribers to the VoIP network. The BroadAccess MSAG also combines Access Gateway and IP DSLAM functions in a single solution. Using the BroadAccess system, Service Providers can select any mix of services (from POTS to xDSL and IP), capacities, and topologies, and can gradually adjust the system according to their needs. The system’s effective integrated architecture allows changing network technologies to be implemented by simply replacing plug-in transmission and service cards. A standard open protocol enables interfacing any standard softswitch via MGCP and H.248. All the media processing - compression, silence suppression and echo cancellation – complies with the relevant standards, with a wide variety of options. The system offers integrated fiber transmission (up to STM-4), as well as copper transmission. Automatic configuration enables immediate system commissioning and operation, eliminating complicated and time-consuming system turn-up. BroadAccess systems are managed by ClearAccess+, a smart, comprehensive EMS that offers efficient, cost-effective control of hundreds of BroadAccess MSAGs. The system’s advanced functionalities and effortless operation significantly reduce operating costs and improve service quality, thus assuring smooth network performance and maximizing the network’s potential. A single BroadAccess system can also be managed locally or remotely by the BroadAccess' Windows-based Local Craft Terminal (LCT), providing full maintenance functionality via the same, familiar ClearAccess+ graphical user interface (GUI). When connected to the RU and communication between the CU and RU is not available, a limited range of management functions can be performed using a Telnet Command Line Interface (CLI) by connecting a PC to the RU. For more information about the BroadAccess system, see the BroadAccess System Overview, BroadAccess System Description or BroadAccess Planning Guide. P/N 760-000731 Rev A March 2006 Page 7 2. BroadAccess System Overview The system’s compact structure enables a single 19” cage, 6U in height, to support as many as 480 subscribers. The BroadAccess CAG40D-M, with cards installed, is shown below. Figure 3. Page 8 BroadAccess Standard Cage March 2006 P/N 760-000731 Rev A BroadAccess Maintenance Guide 3. Logging In This section explains how to log in to a ClearAccess+ client, and to LCT. For more information about user names and passwords, please refer to the ClearAccess+ Installation and Administration Guide or the LCT Installation and Administration Guide, respectively. After you have logged in, you open the NE Operation window for the particular BroadAccess NE that you want to manage. For more information about how to open the NE Operation window, see User Interface on page 11. Note: Before opening a ClearAccess+ session, ensure that: ClearAccess+ Client software has been installed on your computer. You know your user name and password for logging in to ClearAccess+. To login to ClearAccess+: 1. Click the Windows Start button and select the Programs option. The list of program files opens. Select the ClearAccess+ option, and then the ClearAccess+ client option. The ClearAccess+ client opens, and the Login dialog box is displayed. 2. In the Login dialog box, enter the following and then click OK: User Name - enter your user name. Password - enter your password. The ClearAccess+ server IP address that was used the last time that this ClearAccess+ client connected to the server is displayed in the Server Address field. You can enter a different IP address, if necessary. Note: Before opening an LCT session, ensure that: You have connected your computer to the connector marked "COM3" on the system backplane, using an Ethernet cable. The CU and RUs have power switched on. The local craft terminal software has been installed on your computer. You know your user name and password for logging in to LCT, and your LCT User user name and password for connecting to the NE. P/N 760-000731 Rev A March 2006 Page 9 3. Logging In To log in to the LCT: Page 10 3. Ensure that the LCT Start application is running (it should appear as one of the buttons on the Windows task bar). If it is not running, start it as follows: Click the Windows Start button and select the Programs option, then the Startup option and then the LCT Start option. 4. Click the Windows Start button and select the Programs option, then the LCT option, then the BroadAccess 40 LCT folder, and then the BroadAccess 40 LCT option. The BroadAccess 40 Local Craft Terminal (LCT) opens, and the Login dialog box is displayed. 5. In the Login dialog box, enter the following: User Name - type your user name. Password - type your password. Server Address - read only. 6. Click the OK button. The LCT main window is displayed. 7. Click on the NE icon in the left pane of the LCT main window. If an NE icon has not been defined for the NE, refer to Creating and Configuring a BroadAccess 40 Network Element (in the LCT Installation and Administration Guide/LCT Online Help system). 8. Select the Configuration menu option, and then the Connect option. 9. If you are connecting to an NE where no LCT Users have been defined, type admin in the User Name box, and BroadAccess40 in the Password box. If LCT Users have been defined, obtain your user name and password from your system administrator, and enter them. The LCT connects to the BroadAccess system. If any alarms exist in the system, they are displayed in the right pane of the main LCT window. You can perform configuration activities and view performance data by selecting Configuration and then NE Operation options from the menu bar. March 2006 P/N 760-000731 Rev A BroadAccess Maintenance Guide 4. User Interface This section explains how to use the graphical user interface which is used to manage individual BroadAccess NEs. You can access online help at any time for the feature you are currently using, by pressing the <F1> key. Network-wide operations and alarm monitoring features are accessed from the main ClearAccess+ or LCT window. Configuration and Performance Monitoring activities are performed using the NE Operation window. The following figure illustrates the ClearAccess+ main window, and a secondary NE Operation window, which is used to manage a BroadAccess NE. ClearAccess+ Window's Menu Bar ClearAccess+ Window's Tool Bar BroadAccess 40 SNMP NE Operation Window's Menu Bar BroadAccess 40 SNMP NE Operation Window's Tool Bar NE Operation Window's Status Bar BroadAccess NE Configuration Tree Cage View displayed in the NE Operation Window's Work Area Network Tree Figure 4. P/N 760-000731 Rev A Alarms displayed in the ClearAccess+ Work Area The ClearAccess+ Main Window and NE Operation Secondary Window March 2006 Page 11 4. User Interface The NE Operation window is identical in both ClearAccess+ and LCT applications, but is accessed in different ways: • If you are managing a BroadAccess system using ClearAccess+, you access the NE Operation window via the ClearAccess+ Network Tree. Refer to ClearAccess+ Installation and Administration Guide or the ClearAccess+ online help system (accessed from the ClearAccess+ menu bar) for more information about network-wide operations using ClearAccess+. You open the NE Operation window using one of the following methods: WAN and ATM Inband network connection - you right click on the BroadAccess network element on the Network Tree, and then select the NE Operation option. • PSTN connection - you select the required NE on the Network Tree, and then from the ClearAccess+ main window's menu bar, select Configuration|Connect (Dial-Up). If you are managing a BroadAccess system using LCT, you access the NE Operation window by right clicking on the BroadAccess network element displayed in the left pane of the LCT's main window, clicking the Connect button to connect to the system, and then right clicking on the NE icon and selecting the NE Operation option. Refer to the LCT Installation and Administration Guide (located in the Service Manual) or the LCT online help system (accessed from the LCT menu bar) for more information about connecting to a BroadAccess system using LCT. When procedures in this manual direct you to point to a BroadAccess NE, you should use one of the methods described above, depending on whether you are using ClearAccess+ or LCT. The BroadAccess NE Operation window consists of the following main areas: 4.1. • Menu Bar • Toolbar • Configuration Tree • Work Area • Status Bar Configuration Tree The configuration tree includes the following features: Page 12 • Highlights the element currently being configured: for example, unit, cage, slot, port • Displays the names of the cards installed in the cage slots • Opens the corresponding configuration window when you double-click on a port icon March 2006 P/N 760-000731 Rev A BroadAccess Maintenance Guide • A toolbar, which lets you shrink or restore the configuration tree pane, collapse or expand the elements in the tree, and lets you display the telephone number and other information assigned to the selected port • Context-sensitive shortcut menus for items displayed in the tree • Alarm indications on icons representing units, cages, cards or ports where alarms are active Note: STM4-AEL cards are displayed as STM4-AE cards in the configuration tree. To determine whether a card is an STM4-AE or STM4-AEL, check the card's Part Number in the Card Inventory window (accessed from the Cage View). Restore Tree Icon Collapse Tree Icon Expand Tree Icon Phone Book Icon Shrink Tree Icon Alarm Indication Slot Icon Card Icon Port Icon Selected Port Figure 5. 4.2. Configuration Tree Work Area When you select commands from the Menu Bar or from the Toolbar in the BroadAccess NE Operation window, a corresponding window or dialog box is displayed in the NE Operation window's work area. P/N 760-000731 Rev A March 2006 Page 13 4. User Interface 4.3. Status Bar The NE Operation window's Status bar provides you with information about the NE's communication status, your Authorization level, Access Mode and the name of the ClearAccess+ user who currently has Write privileges for the NE. Figure 6. NE Operation Window's Status Bar Table 3. Status Bar Screen Element Options NE Communication OK LOSS Authorization Administrator Supervisor Configurator Service Operator Normal View Only Access Mode Locked By Page 14 March 2006 Description Default Displays the current communication status between the NE and ClearAccess+/LCT OK - Communication between ClearAccess+ server/LCT and the NE is functioning normally LOSS - there is no communication (ping) between the NE and the ClearAccess+ server Displays the authorization level of the user currently using the NE Operation window on this client. Displays the current access mode of the user using the NE Operation window on this client: Normal - has all the privileges allowed for this user for the NE being managed View Only - has read-only privileges for this NE because another user is managing it Displays the name of the user who currently has management (normal) privileges for this NE. If your user name does not appear here, you cannot make any changes to this NE. If you have administrator privileges, you can force another user to logout, by using the Logout button in the Users window. P/N 760-000731 Rev A BroadAccess Maintenance Guide 4.4. Menus and Toolbars in the NE Operation Window Commands can be accessed from the NE Operation window's menu bar, the toolbar and shortcut menus. Some of the commands are accessible in more than one way (for example, from the menu bar and from a shortcut menu). A description of the menu commands and toolbar buttons that appear in ClearAccess+ and LCT's main window can be found in ClearAccess+ Installation and Administration Guide and LCT Installation and Administration Guide, respectively. 4.4.1. Menu Bar The NE Operation window's Menu Bar includes the commands listed in the table below. Some of the commands can also be accessed using shortcut menus or buttons on the Toolbar. Functions of the ClearAccess+ and LCT main window's menu bar and toolbar are described in the ClearAccess+ Installation and Administration Guide and LCT Installation and Adminstration Guide, respectively. You can access online help for the feature you are currently using by pressing the <F1> key. A sequence of options is indicated using the pipe (|) symbol. Table 4. Menu Bar Commands in the NE Operation Window Command Fault|Tests|Line Test Fault|Tests|External Line Test|Disconnect Fault|Tests|External Line Test|Connect Fault|Tests|Lines Background Test Fault|Tests|Line Test Thresholds Fault|Tests|History Results Fault|Tests|Alarm Simulation P/N 760-000731 Rev A March 2006 Action Performs tests on specified lines. Available tests include: AC, DC, Leakage, Capacitance, VF and Noise Disables line testing with external test equipment Enables line testing with external test equipment Tests all lines in the background, without BroadAccess management software supervision. VF and metallic are the available tests. Sets threshold values used to determine pass or fail results in line tests Lets you view results of line tests that were performed in the past Simulates an alarm in order to check the alarm mechanism Page 15 4. User Interface Command Fault|External Alarm Settings Configuration|General Unit Information Configuration|Configure NE|Links Configuration|Configure NE|V5.1 Configuration|Configure NE|V5.2 Configuration|Configure NE|National Protocol Configuration|Configure NE|Cage View Configuration|Configure NE|Cross-Connect Page 16 March 2006 Action Displays a list of External Alarms names as set by the systems administrator. The names can be modified as required. Displays information about active and backup control cards, metering and voltage jumper settings and software version. See BroadAccess Configuration Guide for more information. Displays link performance and mapping data, and link properties; enables loopback tests; enables and disables links. See BroadAccess Configuration Guide for more information. Lets you configure V5.1 protocol settings. See BroadAccess Configuration Guide for more information. Lets you configure V5.2 protocol settings. See BroadAccess Configuration Guide for more information. Lets you configure national protocol settings. See BroadAccess Configuration Guide for more information. Displays a graphical representation of the selected RU or CU cage, and the cards installed in it. See BroadAccess Configuration Guide for more information. Lets you cross-connect lines (TDM). See BroadAccess Configuration Guide for more information. P/N 760-000731 Rev A BroadAccess Maintenance Guide Command Configuration|Configure NE|Voice over IP Configuration|Configure NE|Broadband Cross-Connect Configuration|Configure NE|Synchronization Configuration|Configure NE|System Settings Configuration|CPT Swap Control Configuration|NE Configuration Files|Download to NE Configuration|NE Configuration Files|Upload from NE P/N 760-000731 Rev A March 2006 Action Lets you configure Voice over IP settings. See BroadAccess Configuration Guide for more information. Lets you establish ATM connections between the broadband network and xDSL or Ethernet Service subscribers. See BroadAccess Configuration Guide for more information. Sets each unit's SDH synchronization parameters and CPT's clock priorities. See BroadAccess Configuration Guide for more information. Lets you modify system settings. See BroadAccess Configuration Guide for more information. Swap Control - passes (swaps) control from the currently active control card to the backup control card. See BroadAccess Configuration Guide for more information. Loads (restores) previously saved configuration files from a PC to the BroadAccess system. See BroadAccess Configuration Guide for more information. Saves the NE's configuration data to file on a PC. See BroadAccess Configuration Guide for more information. Page 17 4. User Interface Command Configuration|Software Download Configuration|IP Address Settings Configuration|RU E1 Delay Performance|Performance Monitoring Performance|Threshold Crossing Alert Performance|Traffic|NE Current Active Lines Performance|Traffic|Unit Daily Usage Performance|Traffic|Unit Current Traffic Performance|Traffic|Unit Peak Hour Traffic Page 18 March 2006 Action Opens the Software Download window, from which you can import software version profiles, download software files to cards and swap active software versions. See BroadAccess Configuration Guide for more information. Lets you edit IP Address settings for the BroadAccess system's communication with the carrier's IP network, and for management of the CU and RU that comprise the NE. For more information, see the ClearAccess+ or LCT Installation and Administration Guide. Sets the delay time for the communication link between the RU and CU when the link is transmitted over satellite. See BroadAccess Configuration Guide for more information. Opens the Performance Monitoring window for the port currently selected in the NE Configuration Tree. Lets you configure Threshold Crossing Alert profiles for ADSL and SHDSL ports. See BroadAccess Configuration Guide for more information. Displays a list of non-idle lines in the system Displays the accumulated hourly usage for the selected unit Displays current traffic data Displays the traffic during the selected unit's peak hour P/N 760-000731 Rev A BroadAccess Maintenance Guide Command Action Performance|Traffic|Unit Hour of Interest Traffic|Hour of Interest Report Performance|Traffic|Unit Hour of Interest Traffic|Set NE hour of Interest Window|Cascade Window|Tile Horizontally Window|Tile Vertically Window|Minimize All Window|Arrange 4.4.2. Displays the selected unit's traffic during the hour defined as the "hour of interest" Defines a specific hour of the day for which traffic data is collected Arranges windows in an overlapping order from back to front, tip left to bottom right Arranges windows in equal horizontal proportion in the BroadAccess management software Work Area Arranges windows in equal vertical proportion in the BroadAccess management software Work Area Minimizes all windows opened from the NE Operation window Arranges the windows Toolbar The buttons on the NE Operation window's Toolbar are used to perform the commands listed in the table below. Most of the commands can also be accessed from the Menu Bar or shortcut menus. Functions of the ClearAccess+ and LCT main window's menu bar and toolbar are described in the ClearAccess+ Installation and Administration Guide and LCT Installation and Adminstration Guide, respectively. Table 5. Buttons in the NE Operation Window's Toolbar Name Configure Line Links Cage View P/N 760-000731 Rev A Description Opens the line configuration window corresponding to the selected port in the configuration tree. The type of window opened depends on the type of service provided by the port. See BroadAccess Configuration Guide for more information. Displays link performance and mapping data, and link properties; enables loopback tests; enables and disables links. See BroadAccess Configuration Guide for more information. Opens the Cage View window, where a graphical representation of a CU or RU cage and installed cards are displayed. See BroadAccess Configuration Guide for more information. March 2006 Page 19 4. User Interface Name Voice over IP V5.1 Opens the Voice over IP window, where you configure lines connected to a soft-switch using VoIP technology. See BroadAccess Configuration Guide for more information. Lets you configure V5.1 protocol settings. See BroadAccess Configuration Guide for more information. V5.2 Lets you configure V5.2 protocol settings. See BroadAccess Configuration Guide for more information. National Protocol Lets you configure national protocol settings. See BroadAccess Configuration Guide for more information. Cross-Connect Broadband CrossConnect Synchronization Refresh Tree Auto Refresh 4.4.3. Description Lets you cross-connect lines (TDM). See BroadAccess Configuration Guide for more information. Lets you establish broadband connections between the ATM or IP network and xDSL or Ethernet service subscribers. See BroadAccess Configuration Guide for more information. Sets each unit's SDH synchronization parameters and CPT card's clock priority table. See BroadAccess Configuration Guide for more information. Refreshes the Configuration Tree The system automatically refreshes the Configuration Tree every 10 minutes Shortcut Menu The shortcut menu is a context sensitive pop-up menu, which is displayed by clicking the right mouse button. You can access the shortcut menu for a specific port, by selecting a card displayed in the Configuration Tree and right-clicking on a port icon. The options available in the shortcut menus vary, depending on the item upon which you click. Many of the shortcut menu options can also be accessed from the Menu Bar or from the Toolbar. 4.5. Finding Subscriber Ports ClearAccess+ provides you with an easy way of locating ports and drilling down to configuration and status information about a specific subscriber port in a BroadAccess 40 SNMP system, according to the subscriber's telephone number, ID number (in the case of G.SHDSL lines), or information configured in the Description field for the port. You can also sort the phone numbers in the Customer Phones table according to Phone #, Description, Network Element, Port Location or Card Type. Page 20 March 2006 P/N 760-000731 Rev A BroadAccess Maintenance Guide For each port, you can configure one "Main Number" and an unlimited number of other phone numbers or IDs. The Main Numbers are saved in the NE itself, and can be configured or viewed using ClearAccess+ or LCT. When phone numbers are configured for an NE using LCT, they are automatically configured as Main Numbers. The non-Main Numbers can only be configured or viewed using ClearAccess+, and are saved in the ClearAccess+ database. Although the phone book is accessed from the ClearAccess+ main menu bar, entries in the phone book are created and deleted using the NE Operation window. You can view, create or delete a phone book entry by selecting an RU port in the configuration tree, and then clicking the button in the configuration tree's tool bar. You can also view, create or delete phone book entries for ADSL ports directly from the ADSL Port Configuration window, on the Line tab. During provisioning of a BroadAccess system, the telephone or ID number and subscriber name (or other free text) is entered for each port and is stored in the Customer Phones phone book. Ports can be configured individually or as a bulk operation. When a subscriber reports a problem with a line, you can easily locate the corresponding port in the BroadAccess system, using the Customer Phones window. When you click the Go to Port button, you can choose to either open the configuration window corresponding to the selected port, or perform a line test on the line. Note: If no configuration window is associated to the port, the NE Operation window corresponding to the BroadAccess system to which the port belongs, is displayed. Note: Only the “Main” phone numbers in the phone book feature are available when using LCT. To drill-down to a port using the phone book: 1. On the ClearAccess+ main menu bar, select Configuration option and then Customer Phones option. The Customer Phones window is displayed. 2. Locate the port you require in the phone book, using one of the sorting, filtering or search methods described in the following procedures in this section. 3. Click the Go to Port button and select one of the following options: Configure Port - displays the corresponding Line Configuration window for the port Line Test - performs a line test on the port To sort the rows in the phone book: 1. P/N 760-000731 Rev A On the ClearAccess+ main menu bar, select Configuration and then Customer Phones. The Customer Phones window is displayed. March 2006 Page 21 4. User Interface 2. Click on the arrow in the heading cell of the column by which you want to sort the table. A gray arrow appears, which indicates the sort direction currently in use. To filter the rows in the phone book: 1. On the ClearAccess+ main menu bar, select Configuration and then Customer Phones. The Customer Phones window is displayed. 2. Do one of the following: 3. If a filter has already been defined, click the Filtered button. If no filter has been defined, or if you want to modify the filter, click the Define Filter button. Set up the filter as required and click the OK button (for more information, see Using the Advanced Database Filter on page 28). To cancel the filtering mechanism, click the Filtered button. To search for specific text in the phone book: 1. On the ClearAccess+ main menu bar, select Configuration and then Customer Phones. The Customer Phones window is displayed. 2. Click the Search button. The Find Text dialog box is displayed. 3. Type the required text in the Text to find box, and select the other options you require for the text search. 4. Click the Find Text button, and repeat until you find the item you are searching for. To save the data in the phone book: 1. On the ClearAccess+ main menu bar, select Configuration and then Customer Phones. The Customer Phones window is displayed. 2. Click the Save As button. The Save As dialog box is displayed. 3. Navigate to the required location, enter a file name, select the file type and click the Save button. To format and print a report from the phone book: Page 22 1. On the ClearAccess+ main menu bar, select Configuration and then Customer Phones. The Customer Phones window is displayed. 2. Click the Report button. Choose the options you require to set up page and report formatting and then click the Print button. For more information about using the Report Designer, see Creating Reports on page 26. March 2006 P/N 760-000731 Rev A BroadAccess Maintenance Guide To create or delete individual phone book entries: 1. Select a port in the NE Operation window's configuration tree and then click the 2. 3. button. The Customer Phones Editor window is displayed. Do one of the following: To create a new entry for the port, click the New Row button. Type the subscriber's telephone or ID number in the Phone # cell (only numbers and spaces can be used), and the subscriber's name or other free text in the Description cell. If this number is the main number for this subscriber, select the Main Number box (the Main Number is stored at the NE; other numbers are only stored in the ClearAccess+ database, and cannot be accessed using LCT). To delete the entry, ensure that the row you wish to delete is selected, and click the Delete button. Click the Apply button. The changes you made are applied to the phone book. To create a set of phone numbers in the phone book: 1. Select the first port in the series that you want to configure in the NE Operation window's configuration tree, and then click the Customer Phones Editor window is displayed. button. The 2. Click the New Row button. Type the first subscriber's telephone number of the set in the Phone # cell. 3. In the Bulk Insert box, enter the total number of lines for which you want to configure telephone or ID numbers. When using LCT, the maximum number of lines you can enter is 32 (you should not exceed the maximum number of lines supported by the service card that you intend to install in that slot), and they are saved as Main Numbers; however there is no limitation when using ClearAccess+ (one Main Number and an unlimited amount of non-Main Numbers can be saved for each line when using ClearAccess+). 4. Click the Apply button. Numbers are automatically assigned to the ports in increments of 1. If a telephone or ID number in the series is already in use, an error message is displayed. If a port in the sequence is already assigned with a Main Number, a warning message appears, and you may choose one of the following options: P/N 760-000731 Rev A Choose the Only on Current option to configure the new number as the Main Number. The old number will revert to a non-Main Number for that port (ClearAccess+ only) Choose the Apply on All option to configure all the new numbers as Main Numbers. The old numbers will revert to a non-Main Numbers for those ports (ClearAccess+ only) Choose the Abort option to cancel the bulk insertion process March 2006 Page 23 4. User Interface Page 24 5. To enter subscriber details for each port, select the corresponding row for the port and type the subscriber's name or other free text in the Description cell. If this number is the main number for this subscriber, check the Main Number box (the Main Number is stored at the NE; other numbers are only stored in the ClearAccess+ database, and cannot be accessed using LCT). 6. Click the Apply button after modifying details for a specific port. Note: The button at the bottom of the Customer Phones Editor window allows you to navigate to ports in the system. In cases where cards are not yet installed in certain slots, you can configure them by clicking this button and entering the Unit:Cage:Slot:Port location in the upper box of the dialog box that is displayed, and then clicking Set Entity. Figure 7. Customer Phones Editor Window March 2006 P/N 760-000731 Rev A BroadAccess Maintenance Guide Figure 8. Phone Book Window Table 6. Phone Book Window Settings Screen Element Refresh button More Rows button Define Filter button Filtered button Search button Report button Save As button P/N 760-000731 Rev A Options Description Default Refreshes the information displayed in the window Displays the next set of rows saved in the database Lets you define a filter with which to filter the rows displayed in the phone book. For more information, see Using the Advanced Database Filter on page 28. Toggles between filtered and unfiltered display of the rows in the phone book Lets you search for specific text in the phone book Lets you format and print a report from the data in the phone book Lets you save the data in the TXT phone book in the following file formats: TXT, XML, HTML and XLS March 2006 Page 25 4. User Interface Screen Element Options Go to Port button Configuration Line Test Phone # Description Domain Network-Element Port Location Card Type Main Number 4.6. Selected Cleared Description Default Opens the NE Operation window, and inside it, the corresponding port configuration window (Configuration option), if one exists for that port, or Line Test window (Line Test option) Displays the telephone numbers or ID numbers (for G.SHDSL lines) that were entered in the phone book for the ports Displays the free text entered in the phone book for the ports Displays the domain where the port is located Displays the name assigned to the BroadAccess NE, to which the port belongs Displays the location of the port according to RU number, cage number, card slot number and port number Displays the type of card to which the port belongs Indicates whether or not this is the main telephone number for the port. Main Numbers are saved at the NE. Other numbers are only saved in the ClearAccess+ database. Creating Reports You filter data, and save or print reports about data collected by the system using the field chooser, database filter and the report designer. To create a report: Page 26 1. Hide the columns in the table that you do not require (Broadband CrossConnect table, Alarm display and Dial-Up Alarms window only - see Hiding Columns of Data in Tables on page 27 for more information). 2. Sort, group and change the order of the columns in the table from which you want to generate the report. March 2006 P/N 760-000731 Rev A BroadAccess Maintenance Guide 4.6.1. 3. Filter the desired data using the advanced database filter feature (see Using the Advanced Database Filter on page 28 for more information), or using the table's built-in grid filter (depending on the data you are viewing). If you want to use the same advanced database filter again in the future, you can save the filter to file. 4. Use the report designer to format the design of the report (see Using the Report Designer on page 30 for more information). 5. Print and/or save the report (in windows where print/save features are supported). Hiding Columns of Data in Tables You can hide columns in the alarm display and in the Dial-Up Alarms window, so that only the columns that you require are displayed. The columns will remain hidden every time you view that table, unless you drag the column headings from the field chooser back into the heading row of the table. To hide columns in a table: 1. Click the Customize Columns button on the ClearAccess+/LCT main toolbar. A dialog box is displayed. 2. Drag the header cells of the columns you want to hide into the dialog box. 3. Close the window. The columns you dragged into dialog box are hidden. To return hidden columns to the table: 1. Click the 2. Drag the header cells of the columns you want to display from the dialog box back to the table's header row. Figure 9. P/N 760-000731 Rev A Customize Columns button. A dialog box is displayed. Field Chooser Dialog Box March 2006 Page 27 4. User Interface 4.6.2. Using the Advanced Database Filter The ClearAccess+ and LCT GUIs include an advanced database filter, which lets you filter the rows displayed in a particular window, so that only information relevant to your needs appears on the screen. The filter is available for a variety of data types. You can filter the display according to a combination of categories and sub-categories. The items that appear in the advanced database window vary, depending on the type of data being filtered. Each box in the advanced filter represents the columns that appear in the table which you want to filter. Each box also includes the sub-types which are displayed in the corresponding column. For example: • Example 1 - if you are filtering the alarm table, two possible sub-types in the Acknowledged box are Yes and No. If you want to display all the alarms in the network which have not been acknowledged, you select the Acknowledged checkbox, and the No checkbox. • Example 2 - if you want to display all unacknowledged alarms for G.SHDSL lines, you select the Acknowledged checkbox, the No checkbox, the Originator Type checkbox and the SHDSL Line checkbox. When you have finished defining your filter, click the Apply button and then the OK button, to close the window. If you want to save the filter for later use, save it using the Save Filter button, and reuse later it by using the Load Filter button. The following table explains the use of the generic buttons that appear at the bottom of all the various filter windows. Table 7. Filter Window Generic Buttons Screen Element Options Clear All button Default Clears all parameters currently selected in the filter Applies the filtering criteria to the table without closing the filter Refreshes the criteria displayed in the filter window, and updates the options available if they were recently changed Saves the filter to file in XML format. You can use the filter again in the future by loading it into the Filter window. Lets you load and reuse a filter that was saved to file in XML format Applies the filter criteria to the table, and closes the filter window Apply button Refresh button Save Filter button Load Filter button OK button Page 28 Description March 2006 P/N 760-000731 Rev A BroadAccess Maintenance Guide Screen Element Options Cancel button Description Default Closes the filter window, and reverts the table display to the data displayed before the filter criteria were changed, or since the Apply button was last clicked Represents a column in the table displayed in the GUI. You can select one or more column types. Represents the sub-types of data that can be displayed in each column of the table in the GUI. You can select one or more sub-types for your filter. Figure 10. Advanced Database Filter P/N 760-000731 Rev A March 2006 Page 29 4. User Interface 4.6.3. Using the Report Designer ClearAccess+/LCT lets you create reports from data collected by the system, and allows you to present them in a number of formats, using the Report Designer feature. The following table lists the type of data from which you can create reports, and how to access the Report Designer for each data type. In addition, some windows offer a Print Preview option, and the Report Designer can also be accessed from the Print Preview window. The Report Designer only modifies the way data is arranged when the reports are printed, not how data is displayed in the ClearAccess+/LCT GUI. Table 8. Report Types and Access Methods Type of Report Faults (Alarms) Access Method From the main ClearAccess+/LCT window's menu bar: Fault|Report|Report Designer Event Log From the main ClearAccess+/LCT window's menu bar: Fault|Events Log; then click the Report Designer button Security Log From the main ClearAccess+/LCT window's menu bar: Security|Security Log; then click the Report Designer button Configuration Log From the main ClearAccess+ window's menu bar: Configuration|Configuration Log; then click the Report Designer button Threshold Crossing Alert From the main ClearAccess+/LCT Log window's toolbar, click the Threshold Crossing Alert button Customer Phone From the main ClearAccess+ Numbers window's menu bar: Configuration|Customer Phones; then click the Report button; and the Report Designer option NE Units List From the main ClearAccess+ window's menu bar: Configuration|NE Units List, then click the Report button and choose the Report Designer option. Line Test History Results From the NE Operation window's menu bar: Fault|Tests|History Results; then click the Report button and choose the Report Designer option. Page 30 March 2006 Comments Information available at network level when using ClearAccess+ Information available at network level when using ClearAccess+ Information available at network level when using ClearAccess+ Information available at network level when using ClearAccess+ Information available at network level when using ClearAccess+ Information available at network level when using ClearAccess+ Information available at network level when using ClearAccess+ Per individual BroadAccess 40 NE P/N 760-000731 Rev A BroadAccess Maintenance Guide Type of Report SDH Performance Access Method From the NE Operation window's menu bar: Comments Per individual BroadAccess 40 NE Configuration|Configure NE|Links; V5.2 Configuration Broadband Cross-Connections TDM Cross-Connections then click the More Details button, the SDH Performance tab, the Report button and the Report Designer option. From the NE Operation window's menu bar: Configuration|Configure NE|V5.2; then click the Report button and choose the Report Designer option. From the NE Operation window's menu bar: Configuration|Configure NE|Broadband Cross-Connect; then click the Report button and choose the Report Designer option. From the NE Operation window's menu bar: Currently Active Lines Configuration|Configure NE| Cross-Connect; then click the Report button and choose the Report Designer option. From the NE Operation window's menu bar: Per individual BroadAccess 40 NE Per individual BroadAccess 40 NE Per individual BroadAccess 40 NE Per individual BroadAccess 40 NE Traffic|NE Current Active Lines; click the Report button. ADSL Performance ATM Performance Inventory Select the required port on the NE's configuration tree. From the NE Operation window's menu bar: Performance|Performance Monitoring; in the LI-ADSL Performance window, click the Report button, and choose the Report Designer option. In the NE Operation window, click the Broadband Cross-Connect button. In the Broadband Cross-Connect window, click the Performance button. In the ATM Cross-Connect Performance Monitoring window, click the Report button and choose the Report Designer option. From the main ClearAccess+ window's menu bar: Configuration|Inventory P/N 760-000731 Rev A March 2006 Per individual ADSL port. Per individual BroadAccess 40 NE Information available at network level when using ClearAccess+ Page 31 4. User Interface Type of Report Bulk Operation Entities Access Method Comments In the NE Operation window, select Per individual BroadAccess 40 NE an ADSL or SHDSL port in the configuration tree, select the Configure Line option from the shortcut menu, then click the button for the required field. In the window that opens, click the Report button. Information available NE Configuration Backup From the main ClearAccess+ at network level when window's menu bar: Tools|Configuration using ClearAccess+ The Report Designer lets you format both the types of information that will be displayed in your printed report, and the format in which the report will be printed. The Preview pane in the Report Designer dialog box immediately displays the effects your selections will have on the printed report. Each tab in the Report Designer dialog box controls different aspects of the report, as follows: • Options tab - controls header and footer rows, sub-total rows and checkmarks • Colors tab - controls the colors used in the table's cells and grid lines (borders) • Fonts tab - controls the fonts used in the various types of rows in the table • Behaviors tab - controls recurring rows (headers, footers, etc.), printing of selected text only, and 3D and graphic effects Page 32 March 2006 P/N 760-000731 Rev A BroadAccess Maintenance Guide In addition, you can edit and format title headers using the Title Properties button. The following figures summarize how to use each of the tabs in the dialog box. Displays subtotals if you have grouped columns Displays more detailed information provided in each row of the table Preview pane - displays an example of the effect your formatting selections will have on the printed report The Grid options let you include grid lines in the printed table, for both the rows in the table and around the group footers totals Determines the style of checkmarks used Lets you display checkmarks in text format (True/False) Opens the Report Title dialog box, where you can enter and format the text that will appear at the top of each printed page Figure 11. Report Designer Dialog Box - Options Tab P/N 760-000731 Rev A March 2006 Page 33 4. User Interface Lets you set the color of the rows in the table, or leaves them transparent (no color) Lets you set the colors to be used in band rows, header rows, group node rows and group footer rows. You can also set these types of rows to transparent (no color). Lets you set the color of the grid lines in the table Figure 12. Report Designer Dialog Box - Colors Tab Page 34 March 2006 P/N 760-000731 Rev A BroadAccess Maintenance Guide Lets you set specific fonts for each of the row types in the table. To change the font for a particular row type (for example, Bands), click on the corresponding type in this table, and then click the Change Font button. Make your selection and click OK. Figure 13. Report Designer Dialog Box - Fonts Tab P/N 760-000731 Rev A March 2006 Page 35 4. User Interface Lets you include or omit Bands, Headers or Footers on every printed page Lets you print selected text only Lets you print parent nodes as well as the selected text Expands categories in the printed report, even if they are collapsed in the display on the screen Lets you apply three dimensional effects to the fixed rows in the table (bands, headers, footers, etc.). Figure 14. Report Designer Dialog Box - Behaviors Tab Page 36 March 2006 P/N 760-000731 Rev A BroadAccess Maintenance Guide 5. Fault Management ClearAccess+ and LCT provide you with easy access to current information on active alarms detected in the BroadAccess system, as well as a database which stores a history of alarms that are no longer active. You can filter, sort, save and print alarm information. You can also modify the default alarm severity levels and enter a free text note for each alarm. These activities are performed using the ClearAccess+ or LCT main window. In addition to alarms, BroadAccess NEs also generate Performance Monitoring data and Event logs, which can assist you in identifying faults in the system. For more information, see Performance Management on page 179 and Viewing the Event Log on page 56. For a detailed alarm list and troubleshooting procedures for BroadAccess systems, please refer to Alarms and Troubleshooting on page 64. The NE Operation window's fault management features allow you to: • Perform line tests • Perform external line tests • Perform background line tests • Set line test thresholds • View current line test results • View history line test results • Define external alarm labels • Simulate a major or critical alarm For more information, see Line Testing on page 164 and External Alarm Settings on page 175. 5.1. Enabling and Disabling Audible Notification ClearAccess+ and LCT generate an audible "beep", using your computer speakers, every time a new critical or major alarm is detected in the system. To mute or enable the audible alarm, select the ClearAccess+/LCT main window's Fault|Enable Alarm Sound option from the Menu Bar. Once you have acknowledged an alarm, the "beep" sound is muted. See Acknowledging Current Alarms on page 47 for more information about acknowledging alarms. P/N 760-000731 Rev A March 2006 Page 37 5. Fault Management 5.2. Modifying the Audible Notification Sound You can modify the alarm notification sound emitted by your computer, by either changing the beep frequency and beep duration, or by using an audio file of your choice. You can also return the beep settings to the factory default settings. To modify the audible notification sound: 1. Select the ClearAccess+/LCT main window's Tools|Options option from the Menu Bar. The Options window is displayed. 2. On the Alarm Sound Control tab, do one of the following: 3. Select the Use Beep option and then drag the sliders to change Beep frequency for the first, second, third and fourth beeps, and use the arrows to set the time duration of first, second, third and fourth beeps. Select the Use Audio file option and then use the Browse button to navigate to an audio file saved on your computer. Click the Default button to return all the settings in the Use Beep option to default settings. Click the Set button to apply the changes you made. Figure 15. Alarm Sound Control Dialog Box Page 38 March 2006 P/N 760-000731 Rev A BroadAccess Maintenance Guide 5.3. Alarm Color Codes and Symbols ClearAccess+ and LCT use color coding and symbols to graphically display information about alarms. In the Work Area on the ClearAccess+ Network layout, and on the Network Tree, ClearAccess+ displays faults detected in the system by color coding the Domain icons, and by coloring the frames around each of the NE icons where alarms are active. In LCT, the frame around the icon representing the BroadAccess system to which you are connected, is colored. The coloring is determined according to the alarm with the highest severity level that is currently active in the system. In addition, alarms are indicated by the icons of the configuration tree in the NE Operation window (BroadAccess 40 SNMP systems only). In the ClearAccess+/LCT main window's work area, colored symbols are used to indicate the severity level of each alarm and the background of each alarm line changes shades, from dark to light, once a user acknowledges an alarm. The table Alarm Symbols on page 40 describes the meaning of each symbol, the table Alarm Status Color Codes on page 39 describes the meaning of each color in the Current Alarm and History Alarm windows and the table Domain and NE Color Codes on page 39 describes the meaning of each color on the Network Tree. Table 9. Alarm Status Color Codes Color Red Light Red Orange Light Orange Yellow Light Yellow Sky Blue Light Sky Blue Table 10. Indication Critical Alarm Critical alarm has been acknowledged Major Alarm Major alarm has been acknowledged Minor Alarm Minor alarm has been acknowledged Warning Warning alarm has been acknowledged Domain and NE Color Codes Color Red Orange Yellow Sky Blue Gray Green P/N 760-000731 Rev A Indication Critical Alarm Major Alarm Minor Alarm Warning Illegal connection attempt No faults detected March 2006 Page 39 5. Fault Management Table 11. Alarm Symbols Alarm Severity Symbol Critical Major Minor Warning 5.4. Viewing Active Alarms You can use ClearAccess+ to view the alarms that are currently active in the network. This information is automatically updated when a new alarm occurs and when an alarm is cleared. When you use LCT, the alarms currently active in the NE to which you are connected are displayed. ClearAccess+ automatically downloads the first 500 alarms when you view the alarms for the network or for a particular domain or NE. The More Rows button shows the next set of alarms, but while you are viewing them, new alarms detected are not automatically displayed. ClearAccess+ notifies you of new alarms using the following methods: • the ClearAccess+ or LCT button on the Windows task bar flashes 10 times • an alarm icon is displayed in the Windows system tray toolbar; clicking this icon refreshes and restores the Active Alarms display, and brings the ClearAccess+/LCT main window to the front if other applications or windows are open • on the main toolbar flashes, indicating that the Pending Alarm indicator new alarms have been detected while you are viewing alarms in "More Rows" mode To view active alarms using ClearAccess+: • Click on the Domain or NE in the Network Tree for which you want to view active alarms. Active alarms for the tree node you selected are displayed in the Work Area of the ClearAccess+ main window. • To return to the Active Alarms display, from the main ClearAccess+ window, select the Fault|Show Active Alarms menu option. • To show all the alarms that appear in the network, ensure the Fault|Tree is filtering alarms menu option or icon in the ClearAccess+ main window is not selected. Note: Page 40 You can access online troubleshooting procedures for each alarm by selecting the row corresponding to the alarm in the alarm display, and pressing the <F1> key (BroadAccess 40 SNMP systems only). March 2006 P/N 760-000731 Rev A BroadAccess Maintenance Guide To view active alarms using LCT: Connect to the system, as explained in Logging In. on page 9 Active alarms for the system are displayed in the Work Area of the LCT main window. You can return to the Active Alarms display by selecting the LCT main window's Fault|Show Active Alarms menu option. To view active dial-up alarms: • Select the Fault|Dial-Up Alarms menu option. Figure 16. Current Alarms Display in ClearAccess+ Main Window Note: The position of the columns displayed in the window can be changed; therefore they may not necessarily appear in the order listed below. Table 12. Active Alarms/Alarm History Windows Settings Screen Element ID Severity Category P/N 760-000731 Rev A Options Description Default Displays the alarm's unique ID number Displays the severity of the alarm Critical Major Minor Warning Configuration Displays the category of Communicatio alarms to which the alarm belongs n Processing Equipment External March 2006 Page 41 5. Fault Management Screen Element Description Options See the alarm list provided in your system’s User’s Guide or online help system External Alarms Originator Type Location Start Time End Time On/Off On Off Domain Network Element Acknowledged Page 42 Checked Cleared Description Default Provides a detailed description of the alarm; for example: Door Open, Configuration Mismatch, Loss of Frame, No RUs. For BroadAccess SNMP systems only: displays the external alarm that has been triggered by the system. There are 8 external alarms; of which the last 5 are configurable. For more information, see External Alarm Settings on page 175 (BroadAccess Maintenance Guide or NE Operation online help system). Displays the name of the module or interface in the system which generated the alarm Displays the location of the module or interface in the system which generated the alarm, according to Unit Type and number (CU or RU), cage, card, slot and port Displays the date and time at which the alarm was triggered Displays the date and time at which the alarm was cleared Displays whether the alarm is active (On) or closed (Off) Displays the name of the Domain to which the NE is assigned in the ClearAccess+ Network Tree or LCT main window. Using ClearAccess+: Displays the name of the NE as it appears in the Network Tree. Using LCT: Displays the name configured for the NE in the LCT main window. Cleared Displays whether or not the alarm has been acknowledged by a user: Checked acknowledged Cleared - not acknowledged March 2006 P/N 760-000731 Rev A BroadAccess Maintenance Guide Screen Element Options Acknowledged By Acked Time Unacknowledged By Unacked Time Notes Exact End Time 5.5. Blank Yes No Description Default Displays the name of the user who acknowledged the alarm Displays the time/date on which the alarm was acknowledged Displays the name of the user who unacknowledged the alarm Displays the time/date on which the alarm was unacknowledged Displays free text entered by a user about the alarm Indicates whether the time displayed for the alarm closure reflects the time reported by the NE or the server's time stamp. Blank - alarm is still active Yes - reflects the time reported by the NE No - reflects the server's time stamp Filtering and Sorting Alarms You can filter alarms to display a subset of all the alarms reported by ClearAccess+ and LCT, or sort them according to the items displayed in each column. The alarm filters that you define can be saved to file in XML format, and restored to the system when required again. You can also group the alarms according to one or more column headings. When you use this feature, the alarms are gathered into groups and sub-groups, and a summary of the number of alarms belonging to each group is displayed. To filter alarms according to Domain or NE: 1. Click on a Domain or NE icon on the ClearAccess+ Network Tree. Only the alarms corresponding to that Domain or NE are displayed in the Work Area. To sort the information provided in the alarm display: 1. Click on the button in the header cell of the column by which you want to sort the table (not including Domain or NE). 2. Select one of the options that appears (but not the Custom option). The table will be sorted according to the option you selected. P/N 760-000731 Rev A March 2006 Page 43 5. Fault Management To define a filter for the information provided in the alarm display: 1. From the ClearAccess+ main menu bar, select the Fault option and then the Define Filter option. The Alarm Filter window is displayed. 2. Set up the filter as required. To apply the filter to the alarm display, click the Apply button. To save for later use, click the OK button. 3. To save to file in XML format, click the Save Filter button. Navigate to the location of your choice, assign a name to the file and click the Save button. Note: For more information about defining the database filter, see Using the Advanced Database Filter on page 28. To load a filter saved in XML file format: 1. From the ClearAccess+ main menu bar, select the Fault option and then the Define Filter option. The Alarm Filter window is displayed. 2. Click the Load Filter button. Navigate to the filter file that you require and click the Open button. 3. To apply the filter to the alarm display, click the Apply button. To save for later use, click the OK button. To filter the information provided in the alarm display: 1. Ensure that you have defined or loaded a filter, as described in the previous procedures. 2. From the ClearAccess+ main menu bar, select the Fault option and then ensure that the Filter Enabled option is selected. To group alarms according to one or more column headings: Page 44 1. Drag a column heading cell to the dark gray area above the heading row of the alarm table. 2. To group alarms according to a combination of column headings, drag another column heading cell as described in step 1. March 2006 P/N 760-000731 Rev A BroadAccess Maintenance Guide 3. Click on the + or - signs next to each group to expand or collapse the items displayed for each group. Figure 17. Grouped Alarms Using One Column Heading Figure 18. Grouped Alarms Using Two Column Headings 5.6. Searching for Specific Text in the Alarm Table You can search for specific text in the alarm table, using the Find Text window. To search for text in the alarm list: 1. In the ClearAccess+ or LCT main window, select the Fault|Find menu option. The Find Text window is displayed. 2. Type the text that you are searching for in the Text to Find box. 3. Set the other options in the window as required. 4. Click the Find Next button. The first item that matches your search requirements is highlighted in the alarm table. P/N 760-000731 Rev A March 2006 Page 45 5. Fault Management 5. To continue searching, click the Find Next button until you find the item you require. Figure 19. Find Text Window Table 13. Find Text Window Settings Screen Element Options Text to Find Search All Columns checkbox Cleared Selected Match Case checkbox Cleared Selected Direction Forward Backward Cancel button Find Next button Page 46 March 2006 Description Lets you type the text that you are looking for When selected, the search is performed on the entire table. When cleared, the search is performed only on the column selected in the table. When selected, searches for the text with the same case as you entered the text in the Text to Find box (for example, all capital letters, all small letters, or title case). Searches from the point you started in either forward or backward directions. Cancels the search and closes the window. Searches for the next instance of the text in the Text to Find box. Default Selected Cleared Forward P/N 760-000731 Rev A BroadAccess Maintenance Guide 5.7. Acknowledging and Deacknowledging Active Alarms To acknowledge an active alarm: • Select the check box in the Acknowledgement column of the alarm that you want to acknowledge. To acknowledge a group of alarms: • Select the alarms that you want to acknowledge using <Shift>+Click or <Ctrl>+Click, and then right-click and select the Acknowledge option. To deacknowledge an active alarm: • Clear the check box in the Acknowledgement column of the alarm that you want to deacknowledge. To deacknowledge a group of alarms: • 5.8. Select the alarms that you want to deacknowledge using <Shift>+Click or <Ctrl>+Click, and then right-click and select the Deacknowledge option. Entering and Editing Free Text for a Specific Alarm You can enter text for a specific alarm in the Notes column of the Active Alarms or History Alarms displayed in the work area. Entering free text for an alarm: 1. From the ClearAccess+ or LCT window's main menu bar, select the Fault|Show Active Alarms menu option, or Fault|Show History Alarms option, as required. 2. Scroll to the alarm for which you want to enter text, and click on the cell in the Notes column for that row. The Notes window is displayed. 3. Type the text you require and click the OK button. The text that you entered is now displayed in the Notes column. Editing or deleting note text: 1. From the ClearAccess+ or LCT window's main menu bar, select the Fault|Show Active Alarms menu option, or Fault|Show History Alarms option, as required. 2. Scroll to the alarm for which you want to edit note text, and click on the cell in the Notes column for that row. The Notes window is displayed. 3. Edit or delete the text, as required. P/N 760-000731 Rev A March 2006 Page 47 5. Fault Management 4. Click the OK button. The changes you made are reflected in the Notes column for the alarm note that you edited. Figure 20. Notes Window 5.9. Viewing the Network's Alarm History You can view a log of alarms that occurred in the network by selecting the Fault|Show History Alarms menu option. A log of alarms that occurred in the network is displayed in the Work Area. The layout of the alarms table, and filtering and sorting capabilities are similar to the Active Alarms display. 5.10. Viewing the Alarm Archive You can view the alarm archive by selecting the Fault|Alarm Archive menu option. A log of alarms that are saved in the archive is displayed in the Work Area. When the number of alarms for a particular NE saved in the History Alarms table is more than 400 rows, the oldest ones are moved to the Alarm Archive. When the Alarm Archive contains more than 300 rows for a particular NE, the oldest ones for that NE are deleted. The layout of the alarms table, and filtering and sorting capabilities are similar to the Active Alarms display. Page 48 March 2006 P/N 760-000731 Rev A BroadAccess Maintenance Guide The Clean-Out button opens a dialog box which lets you delete alarms from the Alarm Archive. You can perform an immediate clean-out, or schedule clean-outs for later on. You can delete all the entries in the archive, using the Clean out all checkbox, or delete a set of alarms, according to the following criteria: • Older than # days - deletes all the alarms older than the number of days you specify • Leave at least # per NE - leaves no less than the number of alarms you specify for each of the NEs • Periodic # days (on Schedule tab) - deletes all the alarms in the Alarm Archive periodically. The number of days between clean-outs is set in this box. After you have selected the criteria you require, click the Clean-Out button (on the Now tab) or Apply button (on the Schedule tab). Figure 21. Alarm Archive Window P/N 760-000731 Rev A March 2006 Page 49 5. Fault Management Figure 22. Alarm Archive Clean-Out Dialog Box - Now Tab Figure 23. Alarm Archive Clean-Out Dialog Box - Schedule Tab Page 50 March 2006 P/N 760-000731 Rev A BroadAccess Maintenance Guide 5.11. Saving Alarm Reports to File The alarm list displayed in the ClearAccess+/LCT main window's Work Area (Active Alarms or History Alarms) can be saved in XML, HTML, Excel or text file format. Only the alarms displayed will be saved. If you want to save all active alarms, make sure that you have cancelled filtering before saving it to file. To save an alarm report: 1. Display either Active Alarms or History Alarms in the Work Area, as required. 2. From the ClearAccess+ or LCT window's main menu bar, select the Fault|Save Alarms As menu option. The Save Alarms dialog box is displayed. 3. Navigate to the folder of your choice, if required. 4. Enter a file name for the alarm report. 5. Select the file format you require. 6. Click the Save button. The alarm report is saved to file. 5.12. Printing Alarm Reports The Print option lets you print out the alarms displayed in the Work Area, according the filters currently selected. Before you print the alarms, you can do the following: • Preview how the alarms will be printed out, by selecting the Fault|Report|Print Preview option from the ClearAccess+ or LCT main menu bar • Edit page setup, including page size, margins, scale, headers and footers, by selecting the Fault|Report|Page Setup option from the ClearAccess+ or LCT main menu bar • Use the Report Designer to set up alarm reports in a variety of formats, using the Fault|Report|Report Designer option from the ClearAccess+ or LCT window's main menu bar (for more information about the Report Designer, see Creating Reports on page 26) To print an alarm report: 1. Display Active Alarms or History Alarms in the Work Area. 2. Filter the alarm display as required. 3. From the ClearAccess+ or LCT window's main menu bar, select the Fault|Report option. 4. Select the options you require, modify if necessary, and click the Print button when you are ready to print. P/N 760-000731 Rev A March 2006 Page 51 5. Fault Management 5.13. Editing NEs' Alarm Severity Levels You can change the factory-set severity levels assigned to alarms in the system, or prevent the reporting of specific alarms. The modifications you make can be saved in text file format, and can be loaded to other NEs. You can also restore the default factory-set severity levels to the system, if required. To modify alarm severity levels for a single NE: 1. Select the NE you require in the Network Tree. 2. From the ClearAccess+/LCT main window's menu bar, select the Fault option, the Alarm Configuration option and then the Network Element option. The NE Alarm Configuration window is displayed. 3. Select the row corresponding to the alarm whose severity level you want to edit. 4. Select a severity level from the Modify To: box at the bottom of the window, or from the corresponding cell in the Modify To column. 5. Click the Apply Changes button. To modify alarm severity levels for several NEs: 1. Select one of the NEs you require in the Network Tree. 2. From the ClearAccess+ main window's menu bar, select the Fault option, the Alarm Configuration option and then the Network Element option. The NE Alarm Configuration window is displayed. 3. Select the row corresponding to the alarm whose severity level you want to edit. 4. Select a severity level from the Modify To: box at the bottom of the window, or from the corresponding cell in the Modify To column. 5. Click the Modify NEs button. Select the NEs to which you want the changes applied (the NE you selected in step 1 is automatically included). 6. Click the Apply Changes button. To copy alarm severities from one NE to other NEs: Page 52 1. Select the NE from which you want to copy (source NE), in the Network Tree. 2. Click the Copy to NEs button. 3. Select all the NEs to which you want to copy alarm severities (target NEs). 4. Click the Apply Changes button. March 2006 P/N 760-000731 Rev A BroadAccess Maintenance Guide To save alarm severity levels to file: 1. Select the NE you require in the Network Tree. 2. From the ClearAccess+/LCT main window's menu bar, select the Fault option, the Alarm Configuration option and then the Network Element option. The NE Alarm Configuration window is displayed. 3. Click the File Options button. 4. Select the Save Severities option. The Save Alarm Table Files dialog box is displayed. 5. Navigate to a different location, if required, and enter a name for the file. 6. Click the Save button. The alarm severities are saved in *.txt file format. To load an alarm severities file to the NE: 1. Select the NE you require in the Network Tree. 2. From the ClearAccess+/LCT main window's menu bar, select the Fault option, the Alarm Configuration option and then the Network Element option. The NE Alarm Configuration window is displayed. 3. Click the File Options button. 4. Select the Load Severities option. The Load Alarm Table Files dialog box is displayed. 5. Navigate to and select the file that you wish to load to the system, and click the Open button. P/N 760-000731 Rev A March 2006 Page 53 5. Fault Management Figure 24. NE Alarm Configuration Window Table 14. NE Alarm Configuration Window Settings Screen Element Options Apply Changes button Clear Selection button Reload from DB button Default Applies the changes you made to alarm severity levels Clears the alarms selected in the Checkbox column Refreshes the display of alarm severities from the database. The database contains the severities of "master" NE's alarms the last time they were fetched from this NE. "Master" means the NE whose alarm severities are displayed in the screen and which is used as a template to which other NEs will be changed. Master NE is marked with (unchangeable) teal color selection on the configuration tree. Fetches the master NE's severities, stores them in the DB and refreshes the display Reload from NE button Page 54 Description March 2006 P/N 760-000731 Rev A BroadAccess Maintenance Guide Screen Element Options Exit button Configuration tree Checkbox column Selected Cleared ID column Description column Category column Originator column Default column Current column Modify To column <Click> Critical Major Minor Warning Disabled Modify To box Critical Major Minor Warning Disabled Modify NEs button Copy to NEs button File Options button Restore Defaults button P/N 760-000731 Rev A Load Severities Save Severities Description Closes the window Displays the NE whose alarm configuration is displayed in the table Applies the severity level you select in the Modify To box to all alarms selected in the table Displays each alarm's unique ID number Displays a description of the alarm Displays the alarm category to which the alarm belongs Displays the module or interface which generates the alarm Displays the default alarm severity for the alarm Displays the severity level currently assigned to the alarm Lets you select an severity level to assign to the alarm. When you click on <Click>, the rest of the options are displayed. Note: Disabled is only supported by BroadAccess system release 7 or higher. Lets you select an alarm severity level to assign to the selected alarms Note: Disabled is only supported by BroadAccess system release 7 or higher. Lets user apply only the changes to severities to all the selected NEs Lets user copy all the severities to all the selected NEs Lets you save the alarms that appear in the table as a text file, or load an alarm severities text file to the NE Restores the default severity levels to the alarms in the selected NE March 2006 Default Cleared Page 55 5. Fault Management 5.14. Viewing the Event Log You can view an event log which lists all the events that occurred in the network, which are not alarms. This can be helpful when you are trying to troubleshoot problems with a system or track a system's performance. You can sort the event log in the same way as you sort the Active or History Alarm display (for more information, see Filtering and Sorting Alarms on page 43).You can print a list of events and save the events in text file format. To view the event Log: • In the ClearAccess+ or LCT main window, select the Fault|Event Log menu option. Figure 25. Event Viewer Window Table 15. Event Viewer Window Settings Screen Element Options Refresh button Page 56 Description Default Refreshes the information displayed in the event viewer March 2006 P/N 760-000731 Rev A BroadAccess Maintenance Guide Screen Element Options Auto Refresh button More Rows Define Filter button Filtered Report button Save Log As button Entry ID Category Description Details Originator P/N 760-000731 Rev A Selected Cleared Description Default Automatically refreshes the information displayed in the event viewer, in the following situations: No active filter (generic) – when there is a change, all and only the new rows that were appended since the last refresh will be retrieved from the database A filter is active – when there is a change, the same query is re-executed with the same filter criteria (therefore, any new rows not meeting the filter criteria will not be retrieved from the database) Displays the next set of rows of information from the database Lets you define the filter to be applied to the event viewer. For more information, see Using the Advanced Database Filter on page 28. When selected, indicates that the event viewer is currently being filtered. Lets you set up and print alarm reports in a variety of formats Lets you save the event log to file in *.txt file format Displays the event's ID number Displays the category to which each event belongs, such as Configuration events, Processing events, etc. Displays a brief description of the event Displays more details about the event, such as the location and type of the component corresponding to the event Displays the component that triggered the event report March 2006 Page 57 5. Fault Management Screen Element Options Location Default Displays the location of the component that triggered the event, according to Unit type, unit number, cage number, slot number and port number (where relevant) Displays the time at which the event occurred Displays the name of the Network Element Displays the domain to which the NE belongs Displays whether or not an LCT User is currently connected to the NE Time Network Element Domain Maintenance Description Yes No 5.15. Viewing the Configuration Log You can view a configuration log, which lists the configuration changes that have been made to the NEs, and details about each configuration change that was made. You can sort the log using the column heading cells, you can search for specific text, and you can filter the rows displayed in the window. You can also save the log to file, or print a report. Note: This feature is only available for BroadAccess 40 SNMP systems. To view the configuration log: • Page 58 From the ClearAccess+ or LCT main menu bar, select the Configuration|Configuration Log menu option. The Configuration Log window is displayed. March 2006 P/N 760-000731 Rev A BroadAccess Maintenance Guide Figure 26. Configuration Log Window Table 16. Configuration Log Window Settings Screen Element Options Refresh button Description Default Refreshes the items displayed in the Configuration Log window Lets you view the next set of rows in the More Rows button Configuration Log window Automatically sets the row height in the table Lets you set up criteria for filtering the events displayed in the Auto Row Height Define Filter button Configuration Log window. For more information, see Using the Advanced Database Filter on page 28. Applies or turns off the filtering mechanism used to filter the data displayed in the Configuration Log window Lets you search for specific text in the Configuration Log window Filtered button Search button P/N 760-000731 Rev A March 2006 Page 59 5. Fault Management Screen Element Report button Options Print Preview Page Setup Report Designer Save As button ID Date and Time Domain Network Element User Function Alarm Configuration Description Default Lets you format, preview and print a report from the log Lets you save the log to file Displays the ID number of each configuration event Displays the date and time that the configuration event occurred Displays the domain where the configuration event occurred Displays the name of the NE where the configuration event occurred Displays the name of the user who performed the configuration event Displays the type of function which was performed on the system Configuration Download Software Download Maintenance Topology Operations Page 60 March 2006 P/N 760-000731 Rev A BroadAccess Maintenance Guide Screen Element Operation Options Alarm Configuration types: Change Alarm Severity Description Default Displays the type of operation that was performed on the system (a subtype of the Function type) Restore Default Severities Software Download types: Start TFTP Process End TFTP Process Start Download End Download Stop Download Abort Download Swap Request Abort Swap Set Running Versions P/N 760-000731 Rev A March 2006 Page 61 5. Fault Management Screen Element Operation (cont.) Options Description Configuration Download types: Download to NE Upload from NE Displays the type of operation that was performed on the system (a subtype of the Function type) Default Maintenance types: Card Reset Details Topology Operations types: Add NE Add Domain Delete NE Delete Domain Modify NE Modify Domain Move NE Move Domain Software Download details: Profile Software Type Software Version File Name Status Delay Time Displays details about the configuration event, such as the success or failure of the operation, details about software version changes, the software profile that was used, etc. Configuration Download details: Downloading Succeeded Downloading Failed Uploading Completed 5.15.1. Searching for Specific Text in the Configuration Log You can search for specific text in the configuration log, using the Find Text window. Page 62 March 2006 P/N 760-000731 Rev A BroadAccess Maintenance Guide To search for text in the alarm list: 1. Click the Search button in the Configuration Log window (see Viewing the Configuration Log) on page 58. The Find Text window is displayed. 2. Type the text that you are searching for in the Text to Find box. 3. Set the other options in the window as required. 4. Click the Find Next button. The first item that matches your search requirements is highlighted in the configuration log. 5. To continue searching, click the Find Next button until you find the item you require. 5.15.2. Printing Reports from the Configuration Log The Report button in the Configuration Log window lets you print out the configuration events displayed in the window, according to the filters currently selected. Before you print the events, you can do the following: • Preview how the events will be printed out, by clicking the Report button and selecting the Print Preview option • Edit page setup, including page size, margins, scale, headers and footers, by clicking the Report button and selecting the Page Setup option • Use the Report Designer to set up configuration log reports in a variety of formats, by clicking the Report button and selecting the Report Designer option. For more information about using the Report Designer, see Creating Reports on page 26. To print a configuration log report: 1. Open the Configuration Log window, as described in Viewing the Configuration Log on page 58. 2. Filter the configuration log as required, as described in Using the Advanced Database Filter on page 28. 3. Click the Report button. Select the options you require, modify if necessary, and click the Print button when you are ready to print. 5.15.3. Saving the Configuration Log to File The configuration log can be saved in XML, HTML, Excel or text file format. Only the events displayed will be saved. If you want to save all the events, make sure that you have cancelled filtering, using the Filtered button, before saving the log to file. To save the configuration log to file: 1. P/N 760-000731 Rev A Click the Save button in the Configuration Log window (see Viewing the Configuration Log) on page 58. The Save As dialog box is displayed. March 2006 Page 63 5. Fault Management 2. Navigate to the folder of your choice, if required. 3. Enter a file name for the configuration log. 4. Select the file format you require. 5. Click the Save button. The configuration log is saved to file. 5.16. Alarms and Troubleshooting BroadAccess systems generate alarm messages, which help you to identify and rectify problems with the system. This section includes a summary of the alarms that can be generated, and suggested troubleshooting methodology for solving problems with the system. 5.16.1. Alarms and Indicators The BroadAccess system produces two kinds of alarms and indicators: card LEDs and alarm reports displayed via ClearAccess+ and LCT. These reports can be either displayed on the screen or printed out. In addition, the BroadAccess system has dry contacts that can be coupled to the scanning system of an exchange. • Alarms—ClearAccess+ and LCT report alarms that occur in the various units and elements of the system. Each alarm is reported along with a description, severity level (can be modified), category, origin of the alarm, location of the element causing the alarm and date and time that the alarm occurred. In addition, alarm conditions for specific cards can be viewed in the Cage View window and on the nodes of the NE's configuration tree. For a list of the alarms that can be generated by BroadAccess, see Alarms Generated by BroadAccess on page 66. • LEDs—On-site visual alarms are indicated by LEDs, at both the CU and at the RU. Each card has at least two on-board LED indicators, where a green LED indicates normal operation and a red LED indicates a fault condition. More information about card LEDs can be found in the corresponding card installation instructions. • Dry contact relays—Dry contact relays at the CU can signal critical, major, minor and AL_OUT alarms. These relays can be used for external alarm inputs (for example, fire or water level alarms), to be transferred to the exchange building. An AL_OUT solid state relay is closed if one or more of the eight user-defined external alarms, located at either the CU or RU are activated. These alarms are conveyed directly to ClearAccess+ or LCT, without system intervention. Any critical, major, minor or external alarm condition activates a specific alarm relay that can be connected to an external central alarm system (audible, visible, or both) in the exchange building. A total of four different alarm relays are provided for alarm distribution: critical, major, minor and AL_OUT. Page 64 March 2006 P/N 760-000731 Rev A BroadAccess Maintenance Guide Note: In addition to the alarms generated by the IP-UL-x card which are displayed in the alarm list, more specific alarms for the card can be viewed in the card's configuration window. For more information, see Managing the IP-UL-x Card via the Switched Network in the BroadAccess Configuration Guide. 5.16.2. Troubleshooting Methodology If you are not able to troubleshoot the system by yourself, by following the general guidelines mentioned here, or the troubleshooting procedures mentioned in this chapter, please contact the technical assistance representative in your country. As the primary management interface to the system, ClearAccess+/LCT is used to diagnose problems. This allows you to begin isolating the problem, and in some cases, solving it, before visiting the remote site. If the problem cannot be solved using ClearAccess+/LCT, it may be hardware related. In this case, check items such as cable connections and card operation at the CU side first, then at the RU side, and then check the repeaters or doublers, when used. Another way of determining whether a problem is located at either the CU or RU side, is to perform loopback tests, however it should be noted that loopbacks can cause interruption to services provided to subscribers. Some loopback tests can be performed using ClearAccess+ or LCT. Others require you to physically perform loopbacks at the CU or RU cable connections or distribution blocks. Finally, cards may need to be replaced in either the CU or RU. When setting out to the RU site, take supplies of the components that may need to be replaced and spare cables for performing loopbacks. For convenience sake, if you are already located at the RU site, you can perform all relevant checks at the RU first, and then if the problem is still not solved, check the CU. Note: Familiarize yourself with the BroadAccess system's hardware and software configuration prior to making any modifications to the system. You can make a backup file of the system's configuration data before you begin to make changes to system configuration (see Saving and Restoring NE Configuration Data in the BroadAccess Configuration Guide for more information). Note: Before beginning to isolate and diagnose problems with the system, check that the subscriber's telephone equipment, modem or CPE is in working order. If it is not working properly, replace the equipment and see if the problem persists. P/N 760-000731 Rev A March 2006 Page 65 5. Fault Management General Troubleshooting Guidelines: 1. Connect to the system with ClearAccess+ or LCT, and check whether the problem is at the CU or the RU, according to the alarm message displayed. Observe the other current alarms active in the system, and the alarm history. Note the alarms that have occurred in the past weeks. You may be able to spot a pattern of alarms, or a single alarm that may have an implication on the current system status. Check the status of card LEDs using the cage view. Performance Monitoring statistics (viewed from the NE Operation window) may also provide you with more detailed information. If connection to the system using ClearAccess+ or LCT fails, see ClearAccess+/LCT Not Working - Direct Connection on page 106. 2. If the problem is at the RU, skip the checks at the CU, and perform the recommended steps at the RU. 3. Check that the system is configured correctly, using the NE Operation window for the BroadAccess system where the problem occurs. 4. Check physical cable connections, backplane dipswitch configuration and LEDs at the CU. 5. Perform loopback tests at the CU. 6. Check physical cable connections, backplane dipswitch configuration and LEDs at the RU. 7. Perform loopback tests at the RU. 8. Check HDSL doublers or PCM repeaters, if they exist. 9. Replace cards at the CU and then at the RU (if you are already at the RU site, replace cards there, first). 5.16.3. Alarms Generated by BroadAccess The following table summarizes the alarm messages that can be generated by the BroadAccess system. Note: In addition to the alarms generated by the IP-UL-x card which are displayed in the alarm list, more specific alarms for the card can be viewed in the card's configuration window. For more information, see Viewing Alarms Generated by the IP-UL-x Card in the BroadAccess Configuration Guide. The alarms are arranged in this section according to their ID numbers, which are displayed in the Alarm ID column of the Alarm window in ClearAccess+ or LCT. Each alarm has a unique ID number, despite the fact that the Description may be similar to other alarms. Each row in the table corresponds to a particular alarm, and refers you to the appropriate troubleshooting procedure. Page 66 March 2006 P/N 760-000731 Rev A BroadAccess Maintenance Guide Table 17. BroadAccess Alarms Alarm ID Description 1 Temperature 2 Temperature 3 Temperature 4 Temperature 5 Door Open 6 Ringer P/N 760-000731 Rev A Troubleshooting Solution Temperature Alarm on page 155 Temperature Alarm on page 155 Temperature Alarm on page 155 Temperature Alarm on page 155 Door Open Alarm on page 111 No Ringing - Group of Subscribers on page 141 March 2006 Category Originator Type Default Severity Can be Viewed by LCT Telnet External CPU Card Major Yes External Major Yes External Power Supply Card LI32 Card Major No External SHDSL Card Major No External Unit Major Yes Equipment Power Supply Card Major Yes Page 67 5. Fault Management Alarm ID 7 Page 68 Description No RUs Troubleshooting Solution When STM4 cards are used: STM4 Problem on page 153 When LTM cards are used: No Communication RU and CU E1 Short Haul (LTM card) on page 128 No Communication RU and CU E1 Long Haul (LTM card) on page 127 When HDSL cards are used: No Communication RU and CU HDSL No Doublers on page 131 No Communication RU and CU HDSL 1 Doubler on page 130 When ONTU cards are used: No Communication RU and CU ONTU on page 132 No Communication RU and CU ONTU (with backup ONTU cards) on page 134 March 2006 Category Processing Originator Type System Default Severity Critical Can be Viewed by LCT Telnet No P/N 760-000731 Rev A BroadAccess Maintenance Guide Alarm ID Description 8 Alarm Test 9 Alarm Test 10 CPU Slave Fault 11 Sync Failed 12 Configuration Line Missing 13 Loss of Signal (LOS) 14 Loss of Signal (LOS) P/N 760-000731 Rev A Troubleshooting Solution No actions are required. This alarm indicates that the critical alarm mechanism has been tested and is functioning normally. No actions are required. This alarm indicates that the major alarm mechanism has been tested and is functioning normally. CPT Slave Failure on page 109 No Clock/Sync Failed on page 127 Configuration Line Missing - LI-4E1 Series Card on page 108 AIS, RAI, LOS or High/Low CODE Error Alarm at LI4E1 Series Card on page 97 LOS Alarm at LI-8Nx64 Card on page 121 March 2006 Category Originator Type Default Severity Can be Viewed by LCT Telnet Processing System Critical No Processing System Major No Equipment CPU Card Minor No Processing Unit Major No Configuration E1 Line Minor No Communication E1 Interface Major No Communication HDSL/N64 IF Major No Page 69 5. Fault Management Alarm ID Page 70 Description 15 Loss of Frame (LOF) 16 Alarm Indication Signal (AIS) 17 Remote Alarm Indication (RAI) 18 Test Module Fail 19 Hardware Malfunction 20 Hardware Malfunction 21 Hardware Malfunction 22 Hardware Malfunction 23 Card not Responding 24 Card not Responding 25 Card not Responding 26 Card not Responding Troubleshooting Solution Category LOF Alarm at LI4E1 Series Card on page 121 AIS, RAI, LOS or High/Low CODE Error Alarm at LI4E1 Series Card on page 97 AIS, RAI, LOS or High/Low CODE Error Alarm at LI4E1 Series Card on page 97 Test Module Failed on page 155 Card Does Not Respond on page 104 Card Does Not Respond on page 104 Card Does Not Respond on page 104 Card Does Not Respond on page 104 Card Does Not Respond on page 104 Card Does Not Respond on page 104 Card Does Not Respond on page 104 Card Does Not Respond on page 104 Communication E1 Interface Major No Communication E1 Interface Major No Communication E1 Interface Major No Equipment CPU Card Minor Yes Equipment 4E1 Card Major No Equipment ADSL Card Major No Equipment SHDSL Card Major No Equipment LI32 Card Major No Equipment STM4 Card Major No Equipment 4E1 Card Major No Equipment ISDN Card Major No Equipment ADSL Card Major No March 2006 Originator Type Default Severity Can be Viewed by LCT Telnet P/N 760-000731 Rev A BroadAccess Maintenance Guide Alarm ID Description 27 Card not Responding 28 Card not Responding 29 Card not Responding 30 Card not Responding 31 Restart Failed 32 Variant Error 33 External Alarm 34 Link Configuration Mismatch 35 High BER (>10E-3) 36 High BER (>10E-3) 37 Low BER (10E-6 - 10E-3) 38 Low BER (10E-6 - 10E-3) P/N 760-000731 Rev A Troubleshooting Solution Card Does Not Respond on page 104 Card Does Not Respond on page 104 Card Does Not Respond on page 104 Card Does Not Respond on page 104 Common Control Card Backup Failure on page 109 V5 Out of Service on page 157 V5 Variant Error on page 158 External Alarm on page 112 Link Configuration Mismatch on page 119 Link Failure LTM/HDSL Cards on page 120 No Communication RU and CU ONTU on page 132 Link Failure LTM/HDSL Cards on page 120 No Communication RU and CU ONTU on page 132 March 2006 Category Originator Type Default Severity Can be Viewed by LCT Telnet Equipment ATM Card Major No Equipment SHDSL Card Major No Equipment LI32 Card Major No Equipment CPU Card Major Yes Processing V5 IF Critical No Configuration V5 IF Major No External External Alarm Major Yes Configuration Unit Major No Communication LTM HDSL E1 Link Major No Communication ONTU E3 Link Major No Communication LTM HDSL E1 Link Minor No Communication ONTU E3 Link Minor No Page 71 5. Fault Management Alarm ID Page 72 Description 39 Loss of Frame (LOF) 40 Loss of Frame (LOF) 41 Alarm Indication Signal (AIS) 42 Alarm Indication Signal (AIS) Troubleshooting Solution Category Link Failure LTM/HDSL Cards on page 120 No Communication RU and CU ONTU on page 132 When LTM cards are used: No Communication RU and CU E1 Short Haul (LTM card) on page 128 No Communication RU and CU E1 Long Haul (LTM card) on page 127 When HDSL cards are used: No Communication RU and CU HDSL No Doublers on page 131 No Communication RU and CU HDSL 1 Doubler on page 130 No Communication RU and CU ONTU on page 132 No Communication RU and CU ONTU (with backup ONTU cards) on page 134 Communication LTM HDSL E1 Link Major No Communication ONTU E1 Link Major No Communication LTM HDSL E1 Link Major No Communication ONTU E1 Link Major No March 2006 Originator Type Default Severity Can be Viewed by LCT Telnet P/N 760-000731 Rev A BroadAccess Maintenance Guide Alarm ID Description 43 Loss of Signal (LOS) 44 Loss of Signal (LOS) 45 Suspected HW Loopback 46 Suspected HW Loopback P/N 760-000731 Rev A Troubleshooting Solution Category When LTM cards are used: No Communication RU and CU E1 Short Haul (LTM card) on page 128 No Communication RU and CU E1 Long Haul (LTM card) on page 127 When HDSL cards are used: No Communication RU and CU HDSL No Doublers on page 131 No Communication RU and CU HDSL 1 Doubler on page 130 No Communication RU and CU ONTU on page 132 No Communication RU and CU ONTU (with backup ONTU cards) on page 134 Hardware Loopback Indication on page 114 Hardware Loopback Indication on page 114 Communication LTM HDSL E1 Link Major No Communication ONTU E1 Link Major No Processing LTM HDSL E1 Link Major No Processing ONTU E1 Link Major No March 2006 Originator Type Default Severity Can be Viewed by LCT Telnet Page 73 5. Fault Management Alarm ID Page 74 Description 47 Out of Sync 48 Out of Sync Troubleshooting Solution Category Link Failure LTM/HDSL Cards on page 120; When LTM cards are used: No Communication RU and CU E1 Short Haul (LTM card) on page 128 No Communication RU and CU E1 Long Haul (LTM card) on page 127 When HDSL cards are used: No Communication RU and CU HDSL No Doublers on page 131 No Communication RU and CU HDSL 1 Doubler on page 130 No Communication RU and CU ONTU on page 132 No Communication RU and CU ONTU (with backup ONTU cards) on page 134 Communication LTM HDSL E1 Link Major No Communication ONTU E1 Link Major No March 2006 Originator Type Default Severity Can be Viewed by LCT Telnet P/N 760-000731 Rev A BroadAccess Maintenance Guide Alarm ID Description 49 Remote Side out of Sync 50 Remote Side Out of Sync 52 Hardware Malfunction 53 Mate Comm Fail P/N 760-000731 Rev A Troubleshooting Solution Category When LTM cards are used: No Communication RU and CU E1 Short Haul (LTM card) on page 128 No Communication RU and CU E1 Long Haul (LTM card) on page 127 When HDSL cards are used: No Communication RU and CU HDSL No Doublers on page 131 No Communication RU and CU HDSL 1 Doubler on page 130 No Communication RU and CU ONTU on page 132 No Communication RU and CU ONTU (with backup ONTU cards) on page 134 Card Does Not Respond on page 104 STM4 Series Backup Card Failure on page 154 Communication LTM HDSL E1 Link Major No Communication ONTU E1 Link Major No Equipment STM4 Card Major No Equipment STM4 Card Minor No March 2006 Originator Type Default Severity Can be Viewed by LCT Telnet Page 75 5. Fault Management Alarm ID 54 Loss of Signal (LOS) 55 Loss of Frame (LOF) 56 Loss of Pointer (LOP) 57 Loss of Pointer (LOP) 58 Loss of Multiframe 59 Alarm Indication Signal 60 62 Alarm Indication Signal (AIS) Alarm Indication Signal (AIS) Signal Failure 63 Signal Failure 64 Signal Failure 65 Signal Degraded 66 Signal Degraded 67 Signal Degraded 68 External Links Configuration Mismatch 61 Page 76 Description Troubleshooting Solution STM4 Problem on page 153 STM4 Problem on page 153 STM1 Problem on page 151 VC-12 Alarm on page 159 STM1 Problem on page 151 STM4 Problem on page 153 STM1 Problem on page 151 VC-12 Alarm on page 159 STM4 Problem on page 153 STM1 Problem on page 151 VC-12 Alarm on page 159 STM4 Problem on page 153 STM1 Problem on page 151 VC-12 Alarm on page 159 Link Configuration Mismatch on page 119 March 2006 Category Originator Type Default Severity Can be Viewed by LCT Telnet Communication STM4 Link Major No Communication STM4 Link Major No Communication STM1 Link Major No Communication VC12 Link Major No Communication STM1 Link Major No Communication STM4 Link Major No Communication STM1 Link Major No Communication VC12 Link Major No Communication STM4 Link Major No Communication STM1 Link Major No Communication VC12 Link Major No Communication STM4 Link Minor No Communication STM1 Link Minor No Communication VC12 Link Minor No Configuration LTM HDSL E1 Link Card Major No P/N 760-000731 Rev A BroadAccess Maintenance Guide Alarm ID Description 69 External Links Configuration Mismatch 70 Unequipped 71 Unequipped 74 TIM Alarm 75 SLM Alarm 76 SLM Alarm 77 82 Remote Defect Indication (RDI) Remote Defect Indication (RDI) Connectivity Remote Defect Indication (CRDI) Payload Remote Defect Indication (PRDI) Server Remote Defect Indication (SRDI) Rx Errors 83 Rx Errors 84 Voice Frequency Test Failed 78 79 80 81 P/N 760-000731 Rev A Troubleshooting Solution External Links Configuration Mismatch on page 113 STM1 Problem on page 151 VC-12 Alarm on page 159 VC TIM Alarm on page 160 STM1 Problem on page 151 VC-12 Alarm on page 159 STM4 Problem on page 153 STM1 Problem on page 151 VC-12 Alarm on page 159 VC-12 Alarm on page 159 VC-12 Alarm on page 159 Transmission Card Does Not Respond on page 156 Transmission Card Does Not Respond on page 156 VF Failure on page 160 March 2006 Category Originator Type Default Severity Can be Viewed by LCT Telnet Configuration ONTU E1 Link Card Major No Communication STM1 Link Major No Communication VC12 Link Major No Communication VC12 Link Major No Communication STM1 Link Major No Communication VC12 Link Major No Communication STM4 Link Minor No Communication STM1 Link Minor No Communication VC12 Link Minor No Communication VC12 Link Minor No Communication VC12 Link Minor No Communication LTM HDSL E1 Link Major No Communication ONTU E1 Link Major No Processing POTS Line Minor No Page 77 5. Fault Management Alarm ID 85 88 Voice Frequency Test Failed Voice Frequency Test Failed Voice Frequency Test Failed AC Test Failed 89 AC Test Failed 90 AC Test Failed 91 AC Test Failed 92 DC Test Failed 93 DC Test Failed 94 DC Test Failed 95 DC Test Failed 96 Leakage Fault 97 Leakage Fault 98 Leakage Fault 99 Leakage Fault 100 Many Line Alarms 86 87 Page 78 Description Troubleshooting Solution VF Failure on page 160 VF Failure on page 160 VF Failure on page 160 AC or DC Test Failed on page 96 AC or DC Test Failed on page 96 AC or DC Test Failed on page 96 AC or DC Test Failed on page 96 AC or DC Test Failed on page 96 AC or DC Test Failed on page 96 AC or DC Test Failed on page 96 AC or DC Test Failed on page 96 Leakage Fault on page 116 Leakage Fault on page 116 Leakage Fault on page 116 Leakage Fault on page 116 Many Line Alarms on page 123 March 2006 Category Originator Type Default Severity Can be Viewed by LCT Telnet Processing ADSL Line Minor No Processing Minor No Processing Special Service Line ISDN Line Minor No Processing POTS Line Minor No Processing ADSL Line Minor No Processing Minor No Processing Special Service Line ISDN line Minor No Processing POTS Line Minor No Processing ADSL Line Minor No Processing Minor No Processing Special Service Line ISDN Line Minor No Processing POTS Line Minor No Processing ADSL Line Minor No Processing Minor No Processing Special Service Line ISDN Line Minor No Configuration System Minor No P/N 760-000731 Rev A BroadAccess Maintenance Guide Alarm ID Description 101 Configuration Mismatch 102 Multiple Connection in Automatic Mode 103 Configuration Line Missing 104 AC Alarm 106 Input Voltage Alarm 107 Primary Clock Failed 108 Secondary Clock Failed 109 Configuration Mismatch 110 Metering Mismatch 111 Illegal Link Configuration 112 5V Output Voltage Alarm 113 -5V Output Voltage Alarm P/N 760-000731 Rev A Troubleshooting Solution Category Originator Type Default Severity Can be Viewed by LCT Telnet Cross-Connect Configuration Mismatch on page 110 Same Line Element Detected in More than One RU on page 149 Configuration Line Missing on page 107 Configuration System Minor No Configuration System Minor No Configuration System Minor No AC Alarm on page 96 Input Voltage Alarm on page 115 Clock Failure on page 106 Clock Failure on page 106 Configuration Mismatch PSDCx/PSRGx on page 108 Metering Mismatch on page 125 Illegal Link Configuration on page 114 DC Alarm on page 111 DC Alarm on page 111 External Unit Major No External Major Yes Processing Power Supply Card STM4 Card Major No Processing STM4 Card Major No Configuration Power Supply Card Major No Configuration Unit Minor No Configuration Unit Major No Equipment Power Supply Card Power Supply Card Major Yes Major Yes March 2006 Equipment Page 79 5. Fault Management Alarm ID 114 115 +3.3V Output Voltage Alarm Voltage Output Alarm 116 Loss of Pointer (LOP) 117 120 Alarm Indication Signal (AIS) Unequipped 121 Ring Comm Fail 122 Loss of Cell Delineation (LCD) SLM Alarm 123 124 127 Connectivity Remote Defect Indication (CRDI) Payload Remote Defect Indication (PRDI) Server Remote Defect Indication (SRDI) Bus Conflict 128 Bus Conflict 129 Bus Conflict 125 126 Page 80 Description Troubleshooting Solution DC Alarm on page 111 DC Alarm on page 111 VC-12 Alarm on page 159 VC-12 Alarm on page 159 VC-12 Alarm on page 159 Management Communication Failure on the Link on page 123 STM1 Problem on page 151 VC-12 Alarm on page 159 VC-12 Alarm on page 159 VC-12 Alarm on page 159 VC-12 Alarm on page 159 Bus Conflict on page 101 Bus Conflict on page 101 Bus Conflict on page 101 or Bus Conflict - VoIP on page 102 March 2006 Category Equipment Originator Type Communication Power Supply Card Power Supply Card VC12 IF Communication Default Severity Can be Viewed by LCT Telnet Major Yes Major Yes Major No VC12 IF Major No Communication VC12 IF Major No Processing STM4 Link Minor No Communication STM1 Link Major No Communication VC12 IF Major No Communication VC12 IF Minor No Communication VC12 IF Minor No Communication VC12 IF Minor No Configuration 4E1 Card Major No Configuration ISDN Card Major No Configuration ADSL Card Major No Equipment P/N 760-000731 Rev A BroadAccess Maintenance Guide Alarm ID Description 131 Bus Conflict 132 Bus Conflict 133 Bus Conflict 134 Line is Down 135 xDSL LCD at Near End 136 xDSL LCD at Far End 137 Allocation Failed 138 Allocation Failed 139 Allocation Failed 140 E1/UNI ATM Failure 143 Loss of Signal (LOS) at G703 Level - NX64 144 Loss of Frame (LOF) at G703 Level - NX64 145 Loss of Signal (LOS) at HDSL Level - NX64 P/N 760-000731 Rev A Troubleshooting Solution Bus Conflict on page 101 Bus Conflict on page 101 Bus Conflict on page 101 Line is Down - xDSL Cards on page 117 xDSL LCD at Near End - ADSL Line on page 162 xDSL LCD at Far End - ADSL Line on page 163 Allocation Failed on page 98 Allocation Failed on page 98 Allocation Failed on page 98 E1/UNI ATM Failure on page 112 LOF or LOS Alarm at LI-8Nx64 Card on page 121 LOF or LOS Alarm at LI-8Nx64 Card on page 121 LOF or LOS Alarm at LI-8Nx64 Card on page 121 March 2006 Category Originator Type Default Severity Can be Viewed by LCT Telnet Configuration LI8-N64 Card Major No Configuration SHDSL Card Major No Configuration LI32 Card Major No Communication ADSL Line Minor No Communication ADSL Line Minor No Communication ADSL Line Minor No Processing HDSL N64 Line Minor No Processing GSHDSL Line Minor No Processing ADSL Line Minor No Communication ADSL Line Minor No Communication HDSL N64 Line Minor No Communication HDSL N64 Line Minor No Communication HDSL N64 Line Minor No Page 81 5. Fault Management Alarm ID 146 Loss of Frame (LOF) at HDSL Level - NX64 147 Line Configuration Missing 148 ATM Bus Fail 149 Alarm Indication Signal 151 Remote Defect Indication (RDI) Many Alarm Indication Signal (AIS) 155 Page 82 Description 158 Many Remote Defect Indication (RDI) 162 Hardware Malfunction 163 Loss of Signal (LOS) 164 Loss of Frame (LOF) 165 Loss of Pointer (LOP) Troubleshooting Solution Category LOF or LOS Alarm at LI-8Nx64 Card on page 121 Mismatched Subscribers on page 126 ATM Bus Failure on page 98 ATM VP Alarms on page 101 ATM VP Alarms on page 101 ATM VP Alarms on page 101 Many Alarm Indication Signal (AIS) on page 123 ATM VP Alarms on page 101 Many Remote Defect Indication (RDI) VP ATM Layer on page 124 Card Does Not Respond on page 104 STM1 ATM Interface Alarms on page 150 STM1 ATM Interface Alarms on page 150 STM1 ATM Interface Alarms on page 150 Communication HDSL N64 Line Minor No Configuration ADSL Line Minor No Equipment ATM Bus Major No Communication VP ATM Layer Minor No Communication VP ATM Layer Minor No Communication VP ATM Layer Major No Communication VP ATM Layer Major No Equipment ATM Card Major No Communication STM1 ATM IF Major No Communication STM1 ATM IF Major No Communication STM1 ATM IF Major No March 2006 Originator Type Default Severity Can be Viewed by LCT Telnet P/N 760-000731 Rev A BroadAccess Maintenance Guide Alarm ID 166 Description 168 Alarm Indication Signal (AIS) Remote Defect Indication (RDI) Signal Failure 169 Loss of Cell Delineation 170 Signal Degraded 171 Loss of Pointer (LOP) 172 SLM Alarm 173 Alarm Indication Signal (AIS) 174 Connectivity Remote Defect Indication (CRDI) 175 Payload Remote Defect Indication (PRDI) 176 Server Remote Defect Indication (SRDI) 177 Signal Failure 167 P/N 760-000731 Rev A Troubleshooting Solution Category STM1 ATM Interface Alarms on page 150 STM1 ATM Interface Alarms on page 150 STM1 ATM Interface Alarms on page 150 STM1 ATM Interface Alarms on page 150 STM1 ATM Interface Alarms on page 150 SHDSL VC12 Interface Alarms on page 149 SHDSL VC12 Interface Alarms on page 149 SHDSL VC12 Interface Alarms on page 149 SHDSL VC12 Interface Alarms on page 149 SHDSL VC12 Interface Alarms on page 149 SHDSL VC12 Interface Alarms on page 149 SHDSL VC12 Interface Alarms on page 149 Communication STM1 ATM IF Major No Communication STM1 ATM IF Major No Communication STM1 ATM IF Major No Communication STM1 ATM IF Major No Communication STM1 ATM IF Major No Communication SHDSL VC12 IF Major No Communication SHDSL VC12 IF Major No Communication SHDSL VC12 IF Major No Communication SHDSL VC12 IF Minor No Communication SHDSL VC12 IF Minor No Communication SHDSL VC12 IF Minor No Communication SHDSL VC12 IF Major No March 2006 Originator Type Default Severity Can be Viewed by LCT Telnet Page 83 5. Fault Management Alarm ID Page 84 Description 178 Signal Degraded 179 Unequipped 180 Software Version Control Mismatch 181 Software Version Control Mismatch 182 Software Version Control Mismatch 183 Software Version Control Mismatch 184 Software Version Control Mismatch 185 Software Version Control Mismatch 186 Software Version Control Mismatch 187 Ring ATM Fail at CU 188 Ring ATM Fail at RU Troubleshooting Solution Category Originator Type SHDSL VC12 Interface Alarms on page 149 VC-12 Alarm on page 159 Software Version Control Mismatch on page 150 Software Version Control Mismatch on page 150 Software Version Control Mismatch on page 150 Software Version Control Mismatch on page 150 Software Version Control Mismatch on page 150 Software Version Control Mismatch on page 150 Software Version Control Mismatch on page 150 ATM Ring Failure at CU on page 99 ATM Ring Failure at RU on page 100 Communication SHDSL VC12 IF Minor No Communication SHDSL VC12 IF Major No Processing ATM Card Minor No Processing SHDSL Card Minor No Processing ISDN Card Minor No Processing LI32 Card Minor No Processing 4E1 Card Minor No Processing STM4 Card Minor No Processing CPU Card Minor No Communication VC ATM layer Major No Communication VC ATM Layer Major No March 2006 Default Severity Can be Viewed by LCT Telnet P/N 760-000731 Rev A BroadAccess Maintenance Guide Alarm ID Description 189 SHDSL Card Limit Exceeded (L) 190 SHDSL Card Limit Exceeded (H) 191 Fan Fail 192 Line is Down 193 xDSL LCD at Near End 194 xDSL LCD at Far End 195 Primary Clock Failed 196 Software Version Control Mismatch 197 Temperature 198 High Code Error 199 High CRC4 Error P/N 760-000731 Rev A Troubleshooting Solution LI-SHDSL Card Limit Exceeded on page 120 LI-SHDSL Card Limit Exceeded on page 120 Fan Failure on page 113 Line is Down - LISHDSL Series Cards on page 118 xDSL LCD at Near End - LI-SHDSL Line on page 163 xDSL LCD at Far End - LI-SHDSL Line on page 164 Clock Failure on page 106 Software Version Control Mismatch on page 150 Temperature Alarm on page 155 AIS, RAI, LOS or High/Low Code Error Alarm at LI4E1 Series Card on page 97 CRC Error, LOMF or TS 16 AIS on page 110 March 2006 Category Originator Type Default Severity Can be Viewed by LCT Telnet Configuration Cage Minor No Configuration Cage Minor No External Cage Major Yes Communication GSHDSL Line Minor No Communication GSHDSL Line Minor No Communication GSHDSL Line Minor No Processing Unit Major No Processing ADSL Card Minor No External ADSL Card Major No Communication E1 Interface Major No Communication E1 Interface Major No Page 85 5. Fault Management Alarm ID Page 86 Description 200 Temperature 201 Link Blocked by Local Exchange 207 Facility Near End 209 Facility Far End 213 Power Threshold Exceeded 214 Card Disabled Power Limit Exceeded 215 Card Disabled Power Limit Exceeded 216 Unrecognized Card 217 Unrecognized Card 218 Unrecognized Card 251 LOMF 252 TS 16 AIS Troubleshooting Solution Temperature Alarm on page 155 Link Blocked by Local Exchange on page 119 Facility Near/Far End on page 113 Facility Near/Far End on page 113 Power Threshold Exceeded on page 146 Power Limit Exceeded, Card Disabled on page 146 Power Limit Exceeded, Card Disabled on page 146 Unrecognized Card on page 156 Unrecognized Card on page 156 Unrecognized Card on page 156 CRC Error, LOMF or TS 16 AIS on page 110 CRC Error, LOMF or TS 16 AIS on page 110 March 2006 Category Originator Type Default Severity Can be Viewed by LCT Telnet External STM4 Card Major No Configuration V5 Interface Minor No Communication Application Line Major No Communication Application Line Major No Processing Cage Major No Processing SHDSL Card Major No Processing ADSL Card Major No Configuration Line Card Major No Configuration Link Card Major No Configuration General Card Major No Communication E1 Interface Major No Communication E1 Interface Major No P/N 760-000731 Rev A BroadAccess Maintenance Guide Alarm ID Description 253 Low CODE Error 254 Low CRC Error 255 Mismatch HW Version Control 260 Unequipped 261 Communication 262 Intermittent Facility Alarm 263 Card Misplaced 264 Card Misplaced 265 Card Misplaced 266 Hardware Malfunction 267 Hardware Malfunction 268 Port 2 Laser Fail P/N 760-000731 Rev A Troubleshooting Solution Category AIS, RAI, LOS or High/Low Code Error Alarm at LI4E1 Series Card on page 97 CRC Error, LOMF or TS 16 AIS on page 110 Mismatch HW Version Control on page 126 STM1 ATM Interface Alarms on page 150 STM1 ATM Interface Alarms on page 150 STM4 Problem on page 153 Card Misplaced on page 105 Card Misplaced on page 105 Card Misplaced on page 105 Hardware Malfunction on page 114 Hardware Malfunction on page 114 Hardware Malfunction on page 114 Communication E1 Interface Minor No Communication E1 Interface Minor No Processing ATM Card Major No Communication Major No Major No Communication STM1 ATM Interface STM1 ATM Interface STM4 Card Major No Configuration System Minor No Configuration System Major No Configuration System Major No Equipment Application Card Major No Equipment Application Card Major No Equipment WDM Card Major No March 2006 Communication Originator Type Default Severity Can be Viewed by LCT Telnet Page 87 5. Fault Management Alarm ID Page 88 Description 269 Supervisory Channel Fail 270 Near End LOS 271 1500 Trunk LOS 272 Far End LOS 273 1300 Trunk LOS 274 Cage Slave Out 275 276 Bus Fail Software Version Control Mismatch 277 Card not Responding 278 Bus Conflict 279 Software Version Control Mismatch 280 Hardware Malfunction 281 Card not Responding 282 Temperature Troubleshooting Solution Hardware Malfunction on page 114 WDM Problem on page 161 WDM Problem on page 161 WDM Problem on page 161 WDM Problem on page 161 Cage Slave Out on page 103 Bus Fail on page 102 Software Version Control Mismatch on page 150 Card Does Not Respond on page 104 Bus Conflict on page 101 Software Version Control Mismatch on page 150 Hardware Malfunction on page 114 Card Does Not Respond on page 104 Temperature Alarm on page 155 March 2006 Category Originator Type Default Severity Can be Viewed by LCT Telnet Equipment WDM Card Major No Communication WDM Line Major No Communication WDM Line Major No Communication WDM Line Major No Communication WDM Line Major No Processing Unit Major No Equipment Processing SDH Bus IP Uplink Card Major Minor No No Equipment IP Uplink Card Major No Configuration VoDSL Card Major No Processing VoDSL Card Minor No Equipment VoIP Card Major No Equipment VoIP Card Major No External VoIP Card Major No P/N 760-000731 Rev A BroadAccess Maintenance Guide Alarm ID Description 283 Bus Conflict 284 Software Version Control Mismatch 285 Temperature 286 Hardware Malfunction 287 Software Version Control Mismatch 288 Bus Conflict 289 Card not Responding 290 Loss of Signal (LOS) 291 Loss of Frame (LOF) 292 Alarm Indication Signal P/N 760-000731 Rev A Troubleshooting Solution Bus Conflict - VoIP on page 102 Software Version Control Mismatch on page 150 Temperature Alarm on page 155 Hardware Malfunction on page 114 Software Version Control Mismatch on page 150 Bus Conflict on page 101 Card Does Not Respond on page 104 AIS, RAI, LOS or High/Low Code Error Alarm at LI4E1 Series Card on page 97 LOF Alarm at LI4E1/LI-16E1 Series Card on page 121 AIS, RAI, LOS or High/Low Code Error Alarm at LI4E1 Series Card on page 97 March 2006 Category Originator Type Default Severity Can be Viewed by LCT Telnet Configuration VoIP Card Major No Processing VoIP Card Minor No External 16E1 Card Major No Equipment 16E1 Card Major No Processing 16E1 Card Minor No Configuration 16E1 Card Major No Equipment 16E1 Card Major No Communication E1 Interface Major No Communication E1 Interface Major No Communication E1 Interface Major No Page 89 5. Fault Management Alarm ID 293 Remote Alarm Indication (RAI) 294 High Code Error 295 Low Code Error 296 High CRC4 Error 297 Low CRC Error 298 LOMF 299 TS 16 AIS 300 Loss of Pointer (LOP) 301 Alarm Indication Signal (AIS) Signal Failure 302 Page 90 Description Troubleshooting Solution Category AIS, RAI, LOS or High/Low Code Error Alarm at LI4E1 Series Card on page 97 AIS, RAI, LOS or High/Low Code Error Alarm at LI4E1 Series Card on page 97 AIS, RAI, LOS or High/Low Code Error Alarm at LI4E1 Series Card on page 97 CRC Error, LOMF or TS 16 AIS on page 110 CRC Error, LOMF or TS 16 AIS on page 110 CRC Error, LOMF or TS 16 AIS on page 110 CRC Error, LOMF or TS 16 AIS on page 110 VC-12 Alarm on page 159 VC-12 Alarm on page 159 VC-12 Alarm on page 159 Communication E1 Interface Major No Communication E1 Interface Major No Communication E1 Interface Minor No Communication E1 Interface Major No Communication E1 Interface Minor No Communication E1 Interface Major No Communication E1 Interface Major No Communication Vc12 Interface Major No Communication Vc12 Interface Major No Communication Vc12 Interface Major No March 2006 Originator Type Default Severity Can be Viewed by LCT Telnet P/N 760-000731 Rev A BroadAccess Maintenance Guide Alarm ID Description 303 Signal Degraded 304 Unequipped 305 SLM Alarm 306 309 Connectivity Remote Defect Indication (CRDI) Payload Remote Defect Indication (PRDI) Server Remote Defect Indication (SRDI) PSTN DL Failure 310 Unsupported Card 311 Unsupported Card 312 Unsupported Card 313 Unrecognized Card 314 Unrecognized Card 315 Unrecognized Card 316 Hardware Malfunction 317 Mismatch HW Version Control 307 308 P/N 760-000731 Rev A Troubleshooting Solution Category VC-12 Alarm on page 159 VC-12 Alarm on page 159 VC-12 Alarm on page 159 VC-12 Alarm on page 159 VC-12 Alarm on page 159 VC-12 Alarm on page 159 PSTN DL Failure on page 146 Unsupported Card on page 157 Unsupported Card on page 157 Unsupported Card on page 157 Unrecognized Card on page 156 Unrecognized Card on page 156 Unrecognized Card on page 156 Hardware Malfunction on page 114 Mismatch HW Version Control on page 126 Communication Vc12 Interface Minor No Communication Vc12 Interface Major No Communication Vc12 Interface Major No Communication Vc12 Interface Minor No Communication Vc12 Interface Minor No Communication Vc12 Interface Minor No Processing V5 Interface Major No Equipment Line Card Major No Equipment Link Card Major No Equipment General Card Major No Equipment Line Card Major No Equipment Link Card Major No Equipment General Card Major No Equipment VoDSL Card Major No Processing CPU Card Minor No March 2006 Originator Type Default Severity Can be Viewed by LCT Telnet Page 91 5. Fault Management Alarm ID 318 Card not Responding 319 Temperature 320 Media Failure 321 Hardware Malfunction 322 Card not Responding 323 ATM Bus Fail 324 Software Version Control Mismatch 325 Temperature 326 328 Alarm Indication Signal (AIS) Remote Defect Indication (RDI) CC 329 Hardware Malfunction 331 TDM Bus Collision 332 Hardware Malfunction 327 Page 92 Description Troubleshooting Solution Card Does Not Respond on page 104 Temperature Alarm on page 155 Media Failure on page 125 Hardware Malfunction on page 114 Card Does Not Respond on page 104 ATM Bus Failure on page 98 Software Version Control Mismatch on page 150 Temperature Alarm on page 155 ATM VC Alarms on page 100 ATM VC Alarms on page 100 ATM VC Alarms on page 100 Hardware Malfunction on page 114 Bus Conflict - VoIP on page 102 Hardware Malfunction on page 114 March 2006 Category Originator Type Default Severity Can be Viewed by LCT Telnet Equipment VoDSL card Major No External VoDSL Card Major No Equipment ETH Card Minor No Equipment ETH Card Major No Equipment ETH Card Major No Equipment ATM Bus Major No Processing ETH Card Minor No External ETH Card Major No Communication VC ATM Layer Minor No Communication VC ATM Layer Minor No Communication VC ATM Layer Minor No Equipment CPU Card Major No Processing Special Service Card VoIP Card Major No Major No Equipment P/N 760-000731 Rev A BroadAccess Maintenance Guide Alarm ID Description 333 Media Failure 334 Line is Down 335 External Alarm 336 External Alarm 337 External Alarm 338 External Alarm 339 External Alarm 340 External Alarm 341 External Alarm 342 External Alarm P/N 760-000731 Rev A Troubleshooting Solution Media Failure on page 125 Line is Down VOIP-MG Series Cards on page 118 External Alarm on page 112 External Alarm on page 112 External Alarm on page 112 External Alarm on page 112 External Alarm on page 112 External Alarm on page 112 External Alarm on page 112 External Alarm on page 112 March 2006 Category Originator Type Default Severity Can be Viewed by LCT Telnet Processing VoIP Card Major No Processing Virtual Access Gateway Major No External External Alarm Major Yes External External Alarm Major Yes External External Alarm Major Yes External External Alarm Major Yes External External Alarm Major Yes External External Alarm Major Yes External External Alarm Major Yes External External Alarm Major Yes Page 93 5. Fault Management 5.16.4. Other Problems The following problems might not be reported by ClearAccess+ or LCT, but may be reported by on-site technicians or by subscribers. Each row in the following tables corresponds to a particular problem, and refers you to the appropriate troubleshooting procedure. Table 18. System Problems Problem Description CPT Failure Cage Not Working No Power Read-only access to NEs ClearAccess+ failure due to 2 network cards installed in ClearAccess+ Client computer Access Violation Error Message when closing ClearAccess+ Client ClearAccess+ or LCT Failure Intracall Failure Table 19. Problem ATM Connection Problems Page 94 Hardware or Software failure in the active CPT card. No backup. Cage not working; power may or may not be working, expansion cage not working properly No power in the cage When connecting to a BroadAccess NEs using a ClearAccess+ client, the NE Operation window provides read-only access ClearAccess+ may not function properly if the computer where ClearAccess+ Client is installed is a multi-homed computer. For example, the Go To Port feature fails. See Common Control Card Backup Failure on page 109 Cage Not Working on page 103 No Power on page 138 Read-Only Access to NEs using ClearAccess+ Client on page 147 ClearAccess+ Client MultiHomed Computer Problem on page 105 ClearAccess+ Client does not function/close properly when a utility called NewDotNet is installed on the Client computer. ClearAccess+ Access Violation Error on page 105 No direct connection to serial port ClearAccess+/LCT Not Working Direct Connection on page 106 Internal calls not linked up to RU No Intracalls on page 137 ATM Problems Description Unreported ATM connection problems detected by the craft terminal March 2006 See ATM Connection Problems on page 99 P/N 760-000731 Rev A BroadAccess Maintenance Guide Table 20. Transmission Problems Problem V5 Problem Table 21. Description See The interface stays in the Out of Service state, or stays in the Restart state, or cycles repeatedly from Restart, to Out of Service, to Restart. Normally, auto-recovery causes the interface to transit from Out of Service to Restart after 90 seconds. V5 Cycling Problem on page 157 Service Problems Problem No Service Group of subscribers (more than 16 lines) Description No power feeding No Power Feeding to a Group of Subscribers (two cards or more) on page 140 Subscribers have no dial tone No Dial Tone - Group of Subscribers or the Entire Cage (two cards or more) on page 135 No Dialing - Group of Subscribers (two cards or more) on page 136 No Ringing - Group of Subscribers (two cards or more) on page 141 No Power Feeding - Regular Subscriber on page 140 Subscribers cannot dial No ring for incoming calls No service group of subscribers (less than 16 lines) No power feeding Subscribers have no dial tone Subscribers cannot dial No service special subscriber P/N 760-000731 Rev A See No service March 2006 No Dial Tone - Regular Subscriber on page 136 No Dialing - Group of Subscribers (two cards or more) on page 136 No Service DAT64-CO Subscriber on page 142 No Service - ISDN Subscriber (ISDNE or 4B3T Card) on page 144 No Service - ISDN Subscriber (ISDNE Card) on page 143 No Service - LLSI Channel on page 145 Page 95 5. Fault Management Problem Description LI-ADSL4P card - problem with data transfer See Data is not being transmitted/received Data Transfer Problem - LIADSL4P on page 110 5.16.5. Troubleshooting Procedures The tables that follow provide instructions for solving problems you may be having with the system. In order to locate the correct procedure for your problem, do one of the following: • For alarms reported in LCT or ClearAccess+, look up the ID number of the alarm in Alarms Generated by BroadAccess on page 66 and then refer to the recommended procedure • For other problems reported by technicians or subscribers, look them up in Other Problems on page 94 and then refer to the recommended procedure Table 22. AC Alarm Relevant for the following Alarm IDs: 104 Check / Action 1. 2. 3. 4. 5. Is AC power connected to the cabinet? Is the circuit breaker switch up? Raise the circuit breaker switch. Does the circuit breaker jump? Is there an overload on the charger/AC box? Is the charger switched ON? Table 23. Result / Indication Perform Yes Go to step 2. Yes No Circuit breaker jumped Yes Go to step 5. Go to step 3. Go to step 4. No Yes Replace charger/AC box. Go to step 5. Replace charger. AC or DC Test Failed Relevant for the following Alarm IDs: 88, 89, 90, 91, 92, 93, 94, 95 Check / Action 1. Page 96 Check that the wires are connected properly (and that they haven't been damaged) between the RU and the subscriber's equipment. March 2006 Result / Indication Perform Fix if necessary. P/N 760-000731 Rev A BroadAccess Maintenance Guide Table 24. ADSL Line LCD Alarm - LI-ADSL4P Relevant for the following Alarm IDs: 135, 136 Check / Action 1. Result / Indication Perform Check that E1 links are configured between the LI-4E1 card and the LI-ADSL4P port. Table 25. AIS, RAI, LOS or High/Low Code Error Alarm at LI-4E1 Series Card Relevant for the following Alarm IDs: 13, 16, 17, 198, 253, 290, 292, 293, 294, 295 Check / Action 1. Is the alarm an RAI alarm? 2. Go to the CU or RU reporting the Alarm cleared problem. Create a local loop by shorting between the Tx and Rx at the distribution block. Alternatively, use Alarm not cleared ClearAccess+/LCT to set a loopback on the E1. Alarm cleared The problem is between the connection block and the LE or subscriber. Check the cable to the distribution block and fix the connection if necessary. Alarm not cleared Check the configuration of the Alarm cleared port, and fix if necessary. Alarm not cleared Replace the LI-4E1 card. Alarm cleared Alarm not cleared Reset the CPT card using the RST Alarm not cleared button on the card's front panel. If this doesn't solve the problem, replace the CPT card at the CU. 3. 4. 5. 6. P/N 760-000731 Rev A Result / Indication March 2006 No Yes Perform Go to step 2. Go to the local exchange (LE) end of the link or subscriber end and solve the problem at the LE/subscriber equipment. Go to step 3. Go to step 4. The problem is solved. Go to step 4. The problem is solved. Go to step 5. The problem is solved. Go to step 6. Contact Customer Support. Page 97 5. Fault Management Table 26. Allocation Failed Relevant for the following Alarm IDs: 137, 138, 139 Check / Action 1. Using ClearAccess+/LCT, check if the number of links in the system is sufficient for the number of active subscribers (including all the permanently allocated lines) Table 27. Result / Indication Number of links is not sufficient Perform Add links to the system. ATM Bus Failure Relevant for the following Alarm IDs: 148, 323 Check / Action 1. 2. 3. Using ClearAccess+/LCT, check which card raised the alarm. It could be an ATM card, and SDH card or an xDSL card. Check if hardware failure alarms are reported for the card. Check if the cards are installed in the cage properly. Result / Indication Go to step 2. Yes Refer to procedures for those alarms. Installed properly Go to step 4. Not installed properly Page 98 4. Replace the card reporting the alarm. 5. Replace the ATM card in the cage where the alarm is reported. March 2006 Perform Alarm clears Install card securely in the cage. If the problem is not solved, go to step 4. The problem is solved. Alarm still on Alarm clears Go to step 5. The problem is solved. Alarm still on Contact Customer Support. P/N 760-000731 Rev A BroadAccess Maintenance Guide Table 28. ATM Connection Problems Relevant for the following Alarm IDs: Not Applicable - see Other Problems on page 94 Check / Action 1. Many connections have alarms. Table 29. Result / Indication Yes Perform Perform the procedure described in UNI Alarm to solve network side problems. Perform the following procedures for system side problems: ATM Ring Failure at CU on page 99 ATM Ring Failure at RU on page 100 ATM VP Alarms on page 101 ATM Ring Failure at CU Relevant for the following Alarm IDs: 187 Check / Action 1. Check for multiple STM alarms or multiple topology failures. 2. Check that there is an ATMX card installed in the reported RU. 3. Check that the appropriate STM4 series card for your system's configuration is installed in the reported RU (refer to the Card Installation Overview in the Service Manual for more information). Replace the ATMX card in the reported RU. Contact Customer Support. 4. 5. P/N 760-000731 Rev A March 2006 Result / Indication Perform Alarms or topology failures exist No alarms or failures No ATM card installed ATM card installed Wrong type of STM4 series card installed Follow procedure for STM1 Problem on page 151. Go to step 2. Problem not solved Go to step 5. Install ATMX card in the RU. Go to step 3. Replace incorrect card with the appropriate STM4 series card. Page 99 5. Fault Management Table 30. ATM Ring Failure at RU Relevant for the following Alarm IDs: 188 Check / Action 1. Check for multiple STM alarms or multiple topology failures. 2. Check that there is an ATM-UNI card installed in the CU. 3. Check that the appropriate STM4 series card for your system's configuration is installed in the reported CU/RU (refer to the Card Installation Overview in the Service Manual for more information). Replace the ATM-UNI card in the reported CU. Contact Customer Support. 4. 5. Table 31. Result / Indication Perform Alarms or topology failures exist No alarms or failures No ATM-UNI card installed ATM-UNI card installed Wrong type of STM4 series card installed Follow procedure for STM1 Problem on page 151. Go to step 2. Problem not solved Go to step 5. Install ATM-UNI card in the CU. Go to step 3. Replace incorrect card with the appropriate STM4 series card. ATM VC Alarms Relevant for the following Alarm IDs: 326, 327, 328 Check / Action 1. Result / Indication Does the problem originate from Subscriber the subscriber's equipment or from equipment the ATM network? Network equipment 2. 3. 4. Page 100 Delete the ATM connection and reconfigure it on the same or on a different VP/VC. Reset the VoATM-MG card that reported the problem. Reset the ATM-UNI card or ATMX card that reported the problem. March 2006 Subscriber and ATM network equipment are OK. Problem not solved Problem not solved Problem not solved Perform Fix the problem at the subscriber's premises. If problem persists, go to step 2. Fix the problem in the ATM network. If the problem persists, go to step 2. Go to step 2. Go to step 3. Go to step 4. Contact Customer Support. P/N 760-000731 Rev A BroadAccess Maintenance Guide Table 32. ATM VP Alarms Relevant for the following Alarm IDs: 149, 151, 155, 158 Check / Action 1. Does the problem originate from the subscriber's equipment or from the ATM network? Result / Indication Subscriber equipment Network equipment 2. Delete the VP and reconfigure it. 3. Reset the ATM-UNI card or ATM-X card that reported the problem. Table 33. Subscriber and ATM network equipment are OK. Problem not solved Problem not solved Perform Fix the problem at the subscriber's premises. If problem persists, go to step 2. Fix the problem in the ATM network. If the problem persists, go to step 2. Go to step 2. Go to step 3. Contact Customer Support. Bus Conflict Relevant for the following Alarm IDs: 127, 128, 129, 131, 132, 133, 278, 288 1. P/N 760-000731 Rev A Check / Action Result / Indication Check whether more than one card is using the same bus, using ClearAccess+/LCT. Details about card/bus limitations are included in the Service Manual, in the Card Installation Overview. Current configuration is illegal Change the system configuration. Configuration is OK Contact Customer Support. March 2006 Perform Page 101 5. Fault Management Table 34. Bus Conflict - VoIP Relevant for the following Alarm IDs: 129, 283, 331 Check / Action 1. 2. 3. 4. Using ClearAccess+/LCT, NE Operation window, Cage View window, check whether one of the following cards is installed in cage slot 15: LLSI, LI-4WEM, LI-DDO, LIDDI, LI-TIE, LI-MGNT, LI-RMT-CU, LI-RMT-RU, LI-DAT64-CO, LI-PLAR, LI-DGT, LI-ADSL series? Is one of the cards mentioned in step 1 installed in slots 1 - 12, or 14? Using ClearAccess+/LCT, check whether the VoIP interface has been configured for 256 simultaneous calls, or 512 simultaneous calls (NE Operation window, VoIP Configuration window, System tab). Result / Indication Yes Perform No Remove the card from slot 15 (these cards cannot be used in slot 15 when VoIP is used). Go to step 2. Yes Go to step 3. No 256 Go to step 4. Go to step 4. 512 Change the configuration to 256 simultaneous calls. Contact Customer Support. Table 35. Bus Fail Relevant for the following Alarm IDs: 275 1. Page 102 Check / Action Result / Indication Go the unit which is generating the alarm. One of the following cards installed in the unit has shorted the COM bus: LI-4E1CF, STM4 series, LI-SHDSLTS. Remove cards of these types one by one Alarm clears when a specific card is removed. Replace the faulty card with a new card. Reinstall the other cards that you removed. Alarm still on when all cards of these types removed. Contact Customer Support. March 2006 Perform P/N 760-000731 Rev A BroadAccess Maintenance Guide Table 36. Cage Not Working Relevant for the following Alarm IDs: Not Applicable - see Other Problems on page 94 Check / Action 1. 2. 3. 4. Are the following dipswitches located on the backplane set correctly? - RU/CU - Cage number - RU number (if installed as an RU) - CU cage number (if installed at RU) Result / Indication Dipswitches are OK Dipswitches not OK Is the cage power supply working? No power Power exists Still not OK If cage #2 exists, check that the expansion cables are connected according to the installation instructions in the Service Manual and correct if necessary. Reset the CPT/CPTE/CPT-S card Still not OK using the RST button on the card's front panel. If this doesn't solve the problem, replace the CPT/CPTE/CPT-S card in the problematic cage. Is the problem solved? Table 37. Perform Go to step 2. Adjust the dipswitch settings as necessary. Refer to AC Alarm on page 96. Go to step 3. Go to step 4. Replace the cage. Cage Slave Out Relevant for the following Alarm IDs: 274 Check / Action 1. Go to the slave cage, and check if a CPT-S or power supply card is missing from the slave cage. Result / Indication No cards missing Cards missing P/N 760-000731 Rev A March 2006 Perform Check that expansion cable connecting between the main and slave cages is securely installed on the backplane connectors of both cages. Check that the power supply card in the slave cage is switched on. Install the missing cards. Page 103 5. Fault Management Table 38. Cannot Dial - Regular Subscriber Relevant for the following Alarm IDs: Not Applicable - see Other Problems on page 94 Check / Action 1. 2. Connect a telephone to the distribution block at the CU. Can you dial from there? Replace the service card at the CU. Can the subscriber dial? Table 39. Result / Indication Perform No Problem in the exchange. Yes Still no subscriber dialing Go to step 2. Replace the service card at the RU. Card Does Not Respond Relevant for the following Alarm IDs: 19, 20, 21, 22, 23, 24, 25, 26, 27, 28, 29, 30, 162, 277, 281, 289, 318, 322 Check / Action 1. 2. 3. Is there a Hardware Malfunction alarm? Check if more than one card is reporting Card Not Responding alarm. Check if there is a problem with the CPT card. Result / Indication Yes No Only one card More than one card Problem with CPT card CPT card is OK 4. Page 104 Perform Check the ClearAccess+/LCT alarm message: it provides the location of the problematic card. Replace the card. Go to step 2. Go to step 4. Go to step 3. Fix the problem with CPT card, or replace the CPT card. Go to step 4. Check the ClearAccess+/LCT alarm message: it provides the location of the problematic card. Replace the card. March 2006 P/N 760-000731 Rev A BroadAccess Maintenance Guide Table 40. Card Misplaced Relevant for the following Alarm IDs: 263, 264, 265 Check / Action 1. Result / Indication The wrong type of card is installed in the card slot indicated by the alarm. Identify the location of the card slot reporting the alarm. Table 41. Perform Remove the card from the slot and install it in a slot suitable for the card. The installation instructions for the card (in the Service Manual) detail the card slots in which the card can be installed. ClearAccess+ Access Violation Error Relevant for the following Alarm IDs: N/A Check / Action 1. 2. Search for newdotnet*.* on all hard drives. Result / Indication Perform File found Go to step 2. File not found Contact Customer Support. Uninstall the NewDotNet utility by using the Add/Remove Programs feature in Windows' Control Panel. Table 42. ClearAccess+ Client Multi-Homed Computer Problem Relevant for the following Alarm IDs: N/A Check / Action 1. P/N 760-000731 Rev A Result / Indication Perform Disable the second network card (the one not on the management subnet), or if that card is on DHCP and the management subnet's card is fixed, use the DOS command ipconfig /release. However, this solution requires you to do it every time you restart Windows. March 2006 Page 105 5. Fault Management Table 43. ClearAccess+/LCT Not Working - Direct Connection Relevant for the following Alarm IDs: Not Applicable - see Other Problems on page 94 Check / Action 1. 2. 3. 4. Make sure that the cable from the PC to the cage backplane is: - connected to connector COM1 - connected to the PC comm. port of the PC running ClearAccess+/LCT Check that the PC port # set in the ClearAccess+/LCT is correct. Check that the baud rate of the port is set to 19200. Replace the cable connecting the PC to the cage backplane. Table 44. Result / Indication Perform Still not OK Go to step 2. Still not OK Go to step 3. Still not OK Go to step 4. Still not OK Replace CPT card (at CU). Clock Failure Relevant for the following Alarm IDs: 107, 108, 195 Note: The default CU clock is internal; the default RU clock is recovered. Check / Action 1. 2. Page 106 ClearAccess+/LCT alarm shows which clock is primary and which is secondary. Check the source of the failed clock. Is the card that is the source of the clock operating normally? March 2006 Result / Indication Perform Internal clock Go to step 2. Recovered clock External clock Card is OK Go to step 5. Go to step 5. Go to step 3. Card is not OK Card is missing Replace the card. Install an STM4 card in the slot or change the clock settings using ClearAccess+/LCT (for more information, see Setting SDH Synchronization Status in the BroadAccess Configuration Guide). P/N 760-000731 Rev A BroadAccess Maintenance Guide Check / Action 3. 4. Result / Indication Alarm is cleared In the ClearAccess+/LCT Sync. Settings window, change the clock source type to None, then change the clock selection back to its previous state. (for more information, see Setting Alarm reappears SDH Synchronization Status in the BroadAccess Configuration Guide) Check if the alarm is raised on Both cards both STM4 cards. One card 5. Check for an alarm on the signal source. Alarm on source 6. Check that the clock source is connected. No alarm on source Source is connected Source is not connected 7. Check that both STM4 cards have the same alarm. Both cards One card Table 45. Perform The problem is solved. Replace the card that raised the alarm. Replace the card that sourced the clock. Replace the card that raised the alarm. Refer to STM4 Problem on page 153 or to the relevant No Communication procedure. Go to step 2. Go to step 7. Connect the source or change the clock selection using ClearAccess+/LCT (for more information, see Setting SDH Synchronization Status) in the BroadAccess Configuration Guide. Swap the CPT with its backup. Go to step 4. Contact Customer Support. Configuration Line Missing Relevant for the following Alarm IDs: 103 Check / Action 1. P/N 760-000731 Rev A Using ClearAccess+/LCT, check which service cards are installed in the RU reporting the alarm. March 2006 Result / Indication Perform Empty service card slots exist Go to step 2. All slots have cards installed Contact Customer Support. Page 107 5. Fault Management Check / Action 2. Check whether cross-connections (TDM) are configured for the empty slots. Result / Indication Crossconnections exist No crossconnections exist Table 46. Perform Install a service card in the slot for which cross-connections have been configured, and configure the ports, or delete the cross-connections configured for that card slot. Contact Customer Support. Configuration Line Missing - LI-4E1 Series Card Relevant for the following Alarm IDs: 12 Check / Action 1. Using ClearAccess+/LCT, check that the E1s supported by the LI4E1 card are configured correctly. Table 47. Result / Indication Perform Not configured Fix configuration. Configured correctly Contact Customer Support. Configuration Mismatch - PSDCx/PSRGx Relevant for the following Alarm IDs: 109 Check / Action 1. This alarm is raised if a PSDCx card is installed in an RU. Result / Indication Perform Replace the card with a PSRGx card to cancel the alarm. If installation of a PSDCx card in the RU is intentional, you can change the alarm severity level to a lower severity, using the Alarm Severities window (see Editing Alarm Severities on page 52 for more information). Page 108 March 2006 P/N 760-000731 Rev A BroadAccess Maintenance Guide Table 48. Common Control Card Backup Failure Relevant for the following Alarm IDs: 30 Check / Action 1. Check that there is a second CPT/CPTE card in the cage, and that it is operating properly. 2. Go to the problematic side (either CU or RU), as reported by ClearAccess+/LCT. Are both control cards in cage #1 CPT or CPTE (CPT-S should not be installed in cage #1)? 3. 4. Result / Indication Perform Yes Go to step 2. No Go to step 5. Go to step 3. Yes Go to step 4. No Replace the CPT-S with a CPT (in CU) or CPTE (in RU) card. Replace the failed card. Table 49. CPT Slave Failure Relevant for the following Alarm IDs: 10 Check / Action 1. 2. Check that expansion cables connecting between the cages is securely connected. Does the slave cage have power? 3. Is there a backup CPT-S card in the slave cage? 4. Replace the problematic CPT-S card. Result / Indication Problem not solved Go to step 2. Yes No Go to step 3. Fix power supply problem. Perform a swap and then go to step 4. If the swap fails, go to step 4. Go to step 4. Yes No P/N 760-000731 Rev A March 2006 Perform Page 109 5. Fault Management Table 50. CRC Error, LOMF or TS 16 AIS Relevant for the following Alarm IDs: 199, 254, 251, 252, 296, 297, 298, 299 Check / Action 1. 2. Check that framing is configured in the same mode on the LI-4E1 card and at the far end. (LOMF and TS 16 AIS alarms indicate that Multiframe mode is configured at near or far end). You set framing mode on the card using ClearAccess+/LCT, in the LI-4E1 Properties window, Mode box. Replace the LI-4E1 card reporting the problem. Table 51. Result / Indication Settings not identical on card and at far end. Perform Fix framing settings. If problem persists, go to step 2. Framing settings Go to step 2. are identical at the far end and on the LI-4E1 card. Problem persists. Contact Customer Support. Cross-Connect Configuration Mismatch Relevant for the following Alarm IDs: 101 1. Check / Action Result / Indication Perform Using ClearAccess+/LCT, check whether the type of cards installed in the RU reporting the alarm support the type of lines configured in the CrossConnect window (TDM). Unsuitable card Remove the card and replace with a suitable service card, or delete the cross-connections assigned to that slot. Suitable card Contact Customer Support. Table 52. Data Transfer Problem - LI-ADSL4P Relevant for the following Alarm IDs: Not Applicable - see Other Problems on page 94 Check / Action 1. Page 110 Are there BER alarms between the CU and the RU? March 2006 Result / Indication Perform No alarms Go to step 2. Alarms exist Fix cause of BER alarms. P/N 760-000731 Rev A BroadAccess Maintenance Guide Check / Action 2. Is the scrambling option of the LI-ADSL4P card configured the same way as the exchange of the operating company? 3. If there is an HEC error, check that the COSET option setting on the card is consistent with the network. Table 53. Result / Indication Perform No Fix the configuration. Yes Go to step 3. DC Alarm Relevant for the following Alarm IDs: 112, 113, 114, 115 1. 2. 3. 4. Check / Action Result / Indication Use ClearAccess+/LCT to find out at which side (CU or RU) the problem occurred. On the PSDCx/PSRGx card, are the green LED and red LED on (check physically or using ClearAccess+/LCT cage view)? Go to the problematic side Go to step 2. No Go to step 3. Yes Still not OK Go to step 4. Go to step 4. Set power switch to OFF and replace PSRGx and PSDCx cards. One of the other cards is causing a problem. Set the power switch to OFF and remove all service and transmission cards from the cage. Table 54. Perform Turn on the power and replace the cards one by one until you find the problematic card. Door Open Alarm Relevant for the following Alarm IDs: 5 Check / Action 1. 2. P/N 760-000731 Rev A Are the doors of the outdoor cabinet securely closed? When the door is closed, make sure the door switches are pressed all the way in. Does the alarm turn off? March 2006 Result / Indication Perform Yes Go to step 2. No Close the doors. If alarm persists, go to step 2. Go to step 3. Switches closed; door alarm still on Page 111 5. Fault Management Check / Action 3. Check the wiring between the door switches and the distribution block, and fix if necessary. Does alarm turn off? Table 55. Result / Indication Alarm still on Perform Reset the CPTE card, using the RST button on the card's front panel. If this does not solve the problem, replace the CPTE card at the RU. E1/UNI ATM Failure Relevant for the following Alarm IDs: 140 Check / Action 1. 2. 3. Check the physical connections between the exchange and the E1 UNI link and secure if necessary. Check that links are configured between the LI-4E1 and the LI-ADSL4P ports. Is the scrambling option of the LI-ADSL4P card the same as in the exchange of the operating company? Result / Indication Alarm cleared The problem is solved. Alarm still active Links are configured Go to step 2. Links are not configured No Yes 4. Perform Go to step 3. Configure the links. Configure scrambling options correctly. Go to step 4. Check the COSET option setting on the card is consistent with the network. Table 56. External Alarm Relevant for the following Alarm IDs: 33, 335, 336, 337, 338, 339, 340, 341, 342 Check / Action 1. Page 112 The cause of the alarm is outside your BroadAccess system. The alarm’s Location column provides the External Alarm ID number of the external equipment triggering the alarm. Check ClearAccess+/LCT to find out which piece of equipment is assigned to that external equipment ID number. March 2006 Result / Indication Perform Check external equipment supported by the BroadAccess system. P/N 760-000731 Rev A BroadAccess Maintenance Guide Table 57. External Links Configuration Mismatch Relevant for the following Alarm IDs: 69 Check / Action 1. Result / Indication Perform Check the jumper configuration on the ONTU card. Table 58. Facility Near/Far End Relevant for the following Alarm IDs: 207, 209 Check / Action 1. 2. 3. For a Near End alarm, check the cable connections at each end of the Rx cable connected to the card. For a Far End alarm, check the cable connections at each end of the Rx cable connected to the card. Replace the card reporting the alarm. Result / Indication Connections not OK Connections OK Alarm clears Alarm still on Cables are OK Check that cables connected to the card are intact: Rx cable for near end alarm or Tx cable for far end alarm. Cables not OK Table 59. Perform Fix cable connections. If problem persists, go to step 2. Go to step 2. Problem solved. Go to step 3. Contact Customer Support. Fix or replace the cables. Fan Failure Relevant for the following Alarm IDs: 191 Check / Action 1. 2. 3. P/N 760-000731 Rev A Go to the CU or RU where the fan tray is installed. Check if all the fans in the fan tray are moving. Check the cable that connects the fan tray to the system backplane. Is the cable intact, and is it connected properly? Result / Indication Perform Fans moving Go to step 2. Fans not moving Yes Go to step 3. No Fix connections or replace the cable, as necessary. Go to step 3. Replace the fan tray. March 2006 Page 113 5. Fault Management Table 60. Hardware Loopback Indication Relevant for the following Alarm IDs: 45, 46 Check / Action 1. Check the connections for the link on the distribution blocks and fix if necessary. If fiber optic links are used, check the connections on the fiber optic tray. Table 61. Result / Indication Perform Alarm cleared The problem is solved. Alarm not cleared Contact Customer Support. Hardware Malfunction Relevant for the following Alarm IDs: 266, 267, 268, 269, 280, 286, 316, 321, 329, 332 Check / Action 1. 2. Replace the card reporting the problem Replace the card transmitting to the card raising the alarm. Result / Indication Alarm clears Problem solved. Alarm still on For a Supervisory Channel Fail alarm, go to step 2. For other alarms, contact Customer Support. Problem solved. Alarm clears Alarm still on Table 62. Perform Contact Customer Support. Illegal Link Configuration Relevant for the following Alarm IDs: 111 Check / Action 1. Page 114 Check the CU's backplane dipswitch configuration; check which transmission cards are installed in the BroadAccess system. Refer to the cage installation instructions for the correct dipswitch settings. If you change dipswitch settings, reset the CPT card. Check that the links are configured correctly, using ClearAccess+/LCT, and fix if necessary. March 2006 Result / Indication Perform Alarm clears The problem is solved. Alarm does not clear Contact Customer Support. P/N 760-000731 Rev A BroadAccess Maintenance Guide Table 63. Input Voltage Alarm Relevant for the following Alarm IDs: 106 Note: 1. 2. 3. 4. 5. 6. 7. 8. P/N 760-000731 Rev A This alarm indicates that the DC power supply to the system is below the required level. At the exchange, there may be a problem with the power source to the cage. At an RU in an outdoor cabinet, the cause of this alarm could be that the system is running on batteries due to AC power failure, and the batteries are running out of power. Check / Action Result / Indication Perform Is the problem reported at the CU, at an RU in an outdoor cabinet, or an RU installed in a rack? Check the voltage of the cables connected to the power connectors on the system backplane Normal ranges should be as follows: CU (using PSDCx cards): -48V system: -44V ±2% -60V system: -55V ±2% RU (using PSRGx cards): -48V system: -47V ±2% -60V system: -58.5V ±2% Check that the power cable connectors are connected securely to the backplane connectors. Check that the exchange's power source is providing power at the correct voltage. CU RU in a cabinet RU in a rack Voltage within the normal range Go to step 2. Go to step 6. Go to step 2. Go to step 3. Voltage outside the normal range Go to step 4. Problem not solved Go to step 4. Power source OK. Go to step 5. Power source not Fix the problem with OK. the exchange's power source. Check that the correct type of Problem not Contact Customer cables are used between the power solved Support. source and the system. Check if the system is also Yes Go to step 7. reporting an AC Alarm (Alarm ID 104). No Go to step 8. Perform the procedure for AC Problem not There is a problem with alarms (see AC Alarm on page 96). solved the power source to the charger. Check the voltage of the cables Voltage within Go to step 9. connected to the power connectors normal range on the system backplane. The normal range should be as follows: Voltage outside Go to step 10. RU (using PSRGx cards): -48V system: -47V ±2% normal range -60V system: -58.5V ±2% March 2006 Page 115 5. Fault Management Check / Action 9. 10. 11. Result / Indication Check that the power cable Problem not connectors are connected securely solved to the backplane connectors. Check that the charger is providing Power source OK power at the correct voltage Power source not OK Check that the correct type of Problem not cables are used between the system solved backplane, the charger, the DC box and the batteries. Table 64. Perform Go to step 10. Contact Customer Support. There is a problem with the power source to the charger, or a problem with the charger. Contact Customer Support. Leakage Fault Relevant for the following Alarm IDs: 96, 97, 98, 99 Check / Action 1. 2. Identify the service card that failed the leakage test via the service card red ERR LED (physically, or using the ClearAccess+/LCT cage view). Is it an individual service card? From the distribution block, disconnect the lines, and test the loop using ClearAccess+/LCT. Result / Indication Individual service card Go to step 2. All service cards Leakage test failed Go to step 3. Leakage test passed 3. Page 116 Perform Go to step 3. Fix the problematic loop. Reset the CPTE card, using the RST button on the card's front panel. If the problem persists, replace the CPTE card at the RU. March 2006 P/N 760-000731 Rev A BroadAccess Maintenance Guide Table 65. Line is Down - LI-ADSL Series Cards Relevant for the following Alarm IDs: 134 Check / Action 1. 2. Check for the "No Peer ATUR" status message in the corresponding line configuration window in ClearAccess+/LCT (e.g. ADSL Configuration window, Line tab for ADSL lines). Check the connections to the CPE or the system and secure if necessary. 3. Check for an LPR (Loss of Power) alarm. 4. Check that CPE power is on. 5. Check for Protocol Initiate Fail message in ClearAccess+/LCT in the line's configuration window. 6. Check that the service type defined in the CPE is the same as configured in ClearAccess+/LCT. Result / Indication Message appears Go to step 2. Message does not appear Alarm cleared Go to step 3. Alarm still exists LPR alarm exists No LPR alarm On Off Message appears Go to step 3. Message does not appear Same service type Different service type 7. P/N 760-000731 Rev A Perform The problem is solved. Go to step 4. Go to step 5. Go to step 5. Turn CPE power on. Go to step 6. Go to step 7. Go to step 7. Fix configuration at either CPE or ClearAccess+/LCT. There is a modem training problem. Using the ADSL port's Configuration window in ClearAccess+/LCT, try to reduce the modem rate or SNR margin, or change the profile to Adaptive at Startup. March 2006 Page 117 5. Fault Management Table 66. Line is Down - LI-SHDSL Series Cards Relevant for the following Alarm IDs: 192 Check / Action 1. 2. 3. 4. 5. In the port's Configuration window, Endpoint Maintenance tab (in ClearAccess+/LCT, NE Operation window), check the status of the line. Check the cables and cable connections to the CPE and at the RU and fix if necessary. Result / Indication Perform No defects Go to step 3. Endpoint failure Alarm cleared Go to step 2. The problem is solved. Alarm still exists Go to step 3. Check that CPE power is on. Power off Turn CPE power on. If problem persists, go to step 4. Power on Go to step 4. Check that the service type defined Same service Go to step 5. at the CPE is the same as is type configured in ClearAccess+/LCT. Different service Fix the configuration at type either the CPE or ClearAccess+/LCT. If the problem persists, go to step 5. There is a modem training problem. Try to reduce the modem rate or SNR margin. Table 67. Line is Down - VOIP-MG Series Cards Relevant for the following Alarm IDs: 334 Check / Action 1. In the Voice over IP Configuration window, System tab (in ClearAccess+/LCT, NE Result / Indication Perform Enabled/In Service Go to step 4. Enabled/Out of Service Go to step 2. Alarm cleared The problem is solved. Operation 2. 3. Page 118 window), verify that the Admin Status and Operational Status of the Virtual Access Gateway are Enabled/In Service. Check the cables and cable connections between the VOIP-MG card and the uplink card or other network equipment, and fix if necessary. Contact Customer Support. March 2006 Alarm still exists Go to step 3. P/N 760-000731 Rev A BroadAccess Maintenance Guide Table 68. Link Blocked by Local Exchange Relevant for the following Alarm IDs: 201 Check / Action 1. Check if one or more links on the V5 interface are blocked by the exchange. Result / Indication Yes No 2. Block and then unblock the link(s) Alarm clears using ClearAccess+/LCT as described in Blocking V5.2 Links in the Configuring V5.2 Links section of the BroadAccess Configuration Guide. Problem persists Table 69. Perform It is possible that the links were blocked intentionally. To attempt to release them, go to step 2. Contact Customer Support. The problem is solved. The links were indeed blocked intentionally by the exchange. The alarm is for information only; no action is needed. Link Configuration Mismatch Relevant for the following Alarm IDs: 34, 68 Check / Action 1. P/N 760-000731 Rev A Check the configuration of the optical dipswitches on the master CU cage backplane Check that the link cards present in the BroadAccess system are operating normally, and check the configuration using ClearAccess+/LCT, and fix if necessary. See the cage installation guide in the service manual for more information about dipswitch settings. If you change the dipswitch settings, reset the CPT card. March 2006 Result / Indication Perform Alarm clears The problem is solved. Alarm does not clear Contact Customer Support. Page 119 5. Fault Management Table 70. Link Failure - LTM/HDSL Cards Relevant for the following Alarm IDs: 14, 35, 36, 39, 41, 82 Note: After each step described here, test the link using ClearAccess+/LCT. When the problem is fixed, the red LED on the transmission card will no longer be lit, and ClearAccess+/LCT will indicate the link's status. Check / Action 1. Is the link cable connection between the CU and RU secured? Result / Indication No Yes 2. 3. 4. 5. 6. Verify which link has failed using ClearAccess+/LCT (cage view or link configuration properties) or LEDs on the LTM/HDSL card. Use an external jumper to create a loop between Tx and Rx of the failed loop at the distribution block of the CU. Does the corresponding red LTM/HDSL LED turn off? At the CU, check that the P16 connector on the backplane is correctly connected to the distribution block and fix if necessary. Does the appropriate red LTM/HDSL LED turn off? Replace the LTM/HDSL card at the CU. Use an external jumper to create a loop between Tx and Rx at the RU. Did the corresponding red LTM/HDSL LED turn off? Table 71. Perform Secure cable connections. Go to step 2. Go to step 3. ER LED at CU is still on Go to step 4. ER LED at CU turned off ER LED still on Go to step 6. ER LED at RU is still on Connection problem or over-attenuation between CU and RU. ER LED at RU is still on Replace LTM/HDSL card at the RU. Go to step 5. LI-SHDSL Card Limit Exceeded Relevant for the following Alarm IDs: 189, 190 Check / Action 1. 2. Page 120 Check that the number of LISHDSL cards installed in the cage does not exceed the number allowed per cage. Result / Indication Perform Too many LI-SHDSL cards Remove the excess cards from the cage. Alarm still active Go to step 2. Contact Customer Support. March 2006 P/N 760-000731 Rev A BroadAccess Maintenance Guide Table 72. LOF Alarm at LI-4E1/LI-16E1 Series Card Relevant for the following Alarm IDs: 15, 291 Check / Action 1. Result / Indication Alarm cleared Go to the CU or RU where the problem is reported. Create a local loop by shorting between the Tx and Rx at the distribution block of the unit. Perform Go to step 2. Alternatively, use ClearAccess+/LCT to set a loop back to the exchange or the subscriber, depending on the location of the alarm reporting the alarm. 2. 3. 4. 5. The problem is between the connection block and the exchange/subscriber. Check the cable to the distribution block and fix the connection if necessary. Alarm not cleared Go to step 3. Alarm cleared The problem is solved. Alarm not cleared Check the configuration of the port Alarm cleared and fix if necessary. Alarm not cleared Replace the LI-4E1/LI-16E1 card. Alarm cleared Go to step 3. The problem is solved. Go to step 4. The problem is solved. Go to step 5 Reset the CPT card, using the RST Alarm not cleared Contact Customer button on the card's front panel. If Support. the problem persists, replace the CPT card at the CU. Table 73. LOF or LOS Alarm at LI-8Nx64 Card Relevant for the following Alarm IDs: 14, 143, 144, 145, 146 Check / Action 1. P/N 760-000731 Rev A Is the alarm an HDSL alarm or a G703 alarm? March 2006 Result / Indication Perform HDSL Go to step 2. G703 Go to step 6. Page 121 5. Fault Management Check / Action 2. 3. 4. 5. 6. 7. 8. Page 122 Result / Indication Using ClearAccess+/LCT, perform Loop OK a loopback test on the LI-Nx64 line, using the LDR option. (see Performing a Loopback Test on a Line Supported by a LI-8NX64 Card in the BroadAccess Configuration Guide for more information) Loopback test failed Using ClearAccess+/LCT, perform Loop OK a loopback test on the LI-Nx64 card using the Analog option (see Performing a Loopback Test on a Line Supported by a LI-8NX64 Card in the BroadAccess Configuration Guide for more information). Loopback test failed Check that the LI-Nx64 card is Configuration configured appropriately for use wrong. with the CPE (framing). Configuration OK Loopback OK Go to the CPE and perform a loopback tests (LAL, LDL) from the CPE unit (see corresponding CPE installation instructions in the Service Manual for more information). Loopback test failed Is the alarm LOS or LOF? LOF LOS Check that the LI-Nx64 card is Configuration configured appropriately for use wrong. with the LE equipment (framing). Configuration OK Problem with Check that the cable and cable cable or cable connections between the CU LI4E1CF port and the LE equipment connections are OK. No problem March 2006 Perform Go to step 5. Go to step 3. Fix the problem with the wires between the CPE and the RU, or connections at subscriber end or RU connection blocks. Go to step 4. Fix configuration. If the problem persists, go to step 9. Replace the LI-Nx64 card. If the problem persists, go to step 9. Go to step 4. Replace the CPE. Go to step 7. Go to step 8. Fix configuration. If the problem persists, go to step 9. Replace the LI-Nx64 card. If the problem persists, go to step 9. Fix the problem. If the problem persists, go to step 9. Replace the LI-Nx64 card. If the problem persists, go to step 9. P/N 760-000731 Rev A BroadAccess Maintenance Guide Check / Action 9. 10. Result / Indication Perform Replace the CPE card in the RU. Alarm cleared The problem is solved. Alarm not cleared Go to step 10. Reset the CPT card, using the RST Alarm not cleared Contact Customer Support. button on the card's front panel. If the problem persists, replace the CPT card at the CU. Table 74. Management Communication Failure on the Link Relevant for the following Alarm IDs: 121 Check / Action 1. Reset the STM4 series card. 2. There may be a hardware problem. Swap/replace the STM4 series card. Table 75. Result / Indication The alarm is cleared Alarm still on Perform The problem is solved. Go to step 2. Many Alarm Indication Signal (AIS) Relevant for the following Alarm IDs: 155 Check / Action 1. 2. Check the network for all of the configured ATM connections. Result / Indication ATM network connection configurations are OK. ATM network configurations wrong. Perform Go to step 2. Fix ATM network configurations. Contact Customer Support. Table 76. Many Line Alarms Relevant for the following Alarm IDs: 100 Check / Action 1. Are any No Communication or Rx Error alarms active for the system? Result / Indication Yes No P/N 760-000731 Rev A March 2006 Perform Follow the troubleshooting procedures for those alarms. If the problem persists, go to step 2. Go to step 2. Page 123 5. Fault Management Check / Action 2. Perform the procedure for CrossConnect Configuration Mismatch on page 110. Is the alarm still active? 3. Perform the procedure for Line Configuration Missing on page 107. Is the alarm still active? Table 77. Result / Indication Perform No Problem solved. Yes No Go to step 3. Problem solved. Yes Contact Customer Support. Many Remote Defect Indication (RDI) - VP ATM Layer Relevant for the following Alarm IDs: 158 Check / Action 1. How many VP RDI alarms are there? Are there RDI alarms on most of or all of the connections? Result / Indication One alarm Many alarms on most or all connections Page 124 2. Check the fiber optic cable with an Problem with optical power meter. optical power 3. Replace the fiber. 4. Replace the ATM-UNI card. 5. Contact Customer Support. March 2006 Problem not solved Problem not solved Perform Delete the connection and set it up on a different VPI both on the BroadAccess side and at the ATM switch. Check the physical STM1 connection from the Tx of the ATM-UNI card to the Rx of the ATM switch. Check the fiber optic cable connections. If the connections are OK, go to step 3. Go to step 4. Go to step 5. P/N 760-000731 Rev A BroadAccess Maintenance Guide Table 78. Media Failure Relevant for the following Alarm IDs: 320, 333 Check / Action 1. 2. 3. Identify the card reporting the alarm. Are the cables connected to the card intact, and connected properly to the card's front or rear connectors? Fix the cable or cable connections, as necessary. Is the problem solved? Check that the cables are connected properly to the network device at the far end (user side), and that the network device is powered up and operating normally Result / Indication Yes Go to step 3. No Go to step 2. Yes No Go to step 3. Cables are Go to step 4. connected; device operating normally Problem with cables or far end network device 4. Perform Fix the problem with the cables or network device. Contact Customer Support. Table 79. Metering Mismatch Relevant for the following Alarm IDs: 110 Check / Action 1. 2. 3. P/N 760-000731 Rev A Using ClearAccess+/LCT, verify whether the CU or RU side has reported a fault, as well as the cage number where the fault is reported. Is backplane dipswitch 11 setting correct? Reset the CPT card, using the RST button on the card's front panel. If the problem persists, replace the CPT card. Is the problem solved? March 2006 Result / Indication Perform Go to step 2. No Yes No Set dipswitch correctly. Go to step 3. Replace the cage. Page 125 5. Fault Management Table 80. Mismatched HW Version Control Relevant for the following Alarm IDs: 255, 317 Check / Action 1. Using ClearAccess+/LCT, check that the hardware version of the card matches the software version (using the Card Inventory window, accessed from the Cage View window). Table 81. Result / Indication Perform Hardware and software versions match Contact Customer Support. Hardware and software versions do not match Download the correct software version to the card. Mismatched Subscribers Relevant for the following Alarm IDs: 147 Check / Action 1. Page 126 When using automatic crossconnect mode, check if service cards are positioned correctly in the corresponding slots at both the CU and RU (automatic mode only, without cross-connect). When using manual cross-connect mode, check that crossconnections are configured correctly. March 2006 Result / Indication Perform Not positioned correctly (automatic mode); not configured correctly (manual mode) Place the cards in the correct slots and secure the cards in their slots (automatic mode). Fix cross-connections (manual mode). Positioned correctly/ configured correctly One of the cards has failed. Use ClearAccess+/LCT to identify the card that indicates a mismatch in the CU or RU, and replace it. P/N 760-000731 Rev A BroadAccess Maintenance Guide Table 82. No Clock/Sync Failed Relevant for the following Alarm IDs: 11 Check / Action 1. Verify that the clock source wire is inserted into the correct CU distribution block connector. Is the connection correct? Table 83. Result / Indication Perform No Reconnect the source. Yes Reset the CPT card, using the RST button on the card's front panel. If the problem persists, replace the CPT card at the CU. No Communication - RU and CU E1 Long Haul (LTM card) Relevant for the following Alarm IDs: 7, 41, 43, 47, 49 Check / Action 1. 2. 3. 4. 5. 6. P/N 760-000731 Rev A Is there a problem with all the links or with just one link? Are the cables connected and secured properly to P16 on the CU and RU backplanes? Is there a problem with the cables connecting the CU to the RU? Is the red ER LED on at the LTM card (check physically or using ClearAccess+/LCT cage view)? At the CU side, create a local loop by shorting between the Tx and Rx for the digital link at the distribution block. Is the ER LED still on? At the RU side, create a local loop by shorting between Tx and Rx for the digital link at the distribution block. Is the ER LED still on? March 2006 Result / Indication Perform One link Go to step 4. All the links Yes Go to step 2. Go to step 3. No No Yes, at CU side Secure cable connections. Replace the problematic cable. Go to step 8. Go to step 5. Yes, at RU side No LED is off Go to step 6. Go to step 10. Go to step 6. LED is still on LED is still on Go to step 7. Go to step 7. LED is off Go to step 11. Yes Page 127 5. Fault Management Check / Action 7. 8. 9. 10. 11. 12. 13. 14. 15. 16. Result / Indication Perform Check and secure the cable connection from P16 on the backplane. Is the LED still on? Replace the LTM card in the CU. Is the problem solved? Replace the LTM card in the RU. Is the problem solved? Reset the CPT card using the RST button on the card's front panel. If this doesn't solve the problem, replace the CPT card. LED is still on Go to step 8. Problem is not solved Problem is not solved Problem is not solved Go to step 9. Is the system configured the same way at both the RU and CU sides? Is there a problem with the link between the CU and the RU? Go to the first repeater from the CU side and perform a local loop by shorting between the Tx and Rx. Does the ER LED go off? Yes Reset the CPTE card using the RST button on the card's front panel. If this doesn't solve the problem, replace the CPTE card. If the problem is still not solved, go to step 11. Go to step 12. No Go to step 13. LED is off Go to step 14. LED is on Go to step 15. Go to step 13. Problem not solved Go to step 16. Problem not solved Contact Customer Support. Go to the next repeater and perform a loop. You have a problem in the link that runs between the repeater and the CU, or at the repeater. Replace the repeater. Check the loop between the repeater and the CU. Table 84. Go to step 10. No Communication - RU and CU E1 Short Haul (LTM card) Relevant for the following Alarm IDs: 7, 41, 43, 47, 49 Check / Action 1. 2. Page 128 Is there a problem with all the links or with just one link? Result / Indication One link All the links Is the cable connected and secured Yes properly to P16 on the CU and RU backplanes? No March 2006 Perform Go to step 4. Go to step 2. Go to step 3. Secure cable connections. P/N 760-000731 Rev A BroadAccess Maintenance Guide Check / Action 3. Is there a problem with the cable connecting the CU to the RU? 4. Is a red ER LED on at the LTM card (check physically or using ClearAccess+/LCT cage view)? 5. 6. 7. P/N 760-000731 Rev A Result / Indication Perform Yes Replace the cable. No Yes, at CU side Go to step 8. Go to step 5. Yes, at RU side No At the CU side, create a local loop LED is still on by shorting between the Tx and Rx for the digital link at the distribution block. Is the red ER LED still on? LED is off At the RU side, create a local loop LED is still on by shorting between Tx and Rx for the digital link at the distribution block. Is the ER LED still on? LED is off Go to step 6. Go to step 9. Go to step 7. LED is still on 8. Check the cable from P16 to the distribution block and fix the connection if necessary. Is the ER LED still on? Replace the LTM card in the CU. 9. Replace the LTM card in the RU. 10. 11. Are the backplane dipswitches configured correctly at the CU and the RU? Reset the CPT card using the RST Problem not button on the card's front panel. If solved this doesn't solve the problem, replace the CPT card. 12. Is the problem solved? March 2006 Problem not solved Problem not solved Yes Problem not solved Go to step 6. Go to step 7. There is a problem with the link between the CU and the RU. Go to step 8. Go to step 9. Go to step 10. Go to step 11. Reset the CPTE card using the RST button on the card's front panel. If this doesn't solve the problem, replace the CPTE card. Contact Customer Support. Page 129 5. Fault Management Table 85. No Communication - RU and CU HDSL - 1 Doubler Relevant for the following Alarm IDs: 7, 41, 43 Check / Action 1. 2. 3. 4. 5. 6. 7. 8. 9. 10. 11. 12. Page 130 Is there a problem with all the links or with just one link? Result / Indication One link All the links Are the cables connected and Yes secured properly to P16 on the CU and RU backplanes? No Is there a problem with the cables connecting the CU to the RU? Yes No Is a red ER LED on the HDSL No card on (check physically or using ClearAccess+/LCT cage view)? Yes Is the green ACT LED on the Power card OK HDSL card on? Is the card recognized by No ClearAccess+/LCT? Yes Replace the HDSL card in the CU. No Does ClearAccess+/LCT recognize the card now? Does ClearAccess+/LCT indicate Section I loop failure or Section II loop failure? Section I failure Section II failure Check the quality of the failed loop No (too long or too noisy) and the connections at the distribution block. Is the loop suitable for HDSL requirements? Yes Replace the HDSL card at the RU Still no side. communication Measure the voltage between loop Measured 118V 1 and loop 2. Wait for 2 minutes. +2V Measured 0V Check the connection to the Connection OK doubler. March 2006 Perform Go to step 4. Go to step 2. Go to step 3. Secure cable connections. Replace the problematic cable. Go to step 8. Go to step 5. Go to step 6. Go to step 7. Go to step 7. Go to step 8. Reset the CPT card using the RST button on the card's front panel. If this doesn't solve the problem, replace the CPT card in the CU. Go to step 11. Go to step 9. Use another loop. Go to step 10. Replace the doubler. Go to step 12. Go to step 15. Go to step 14. P/N 760-000731 Rev A BroadAccess Maintenance Guide Check / Action 13. Measure the voltage of the doubler. 14. Disconnect the doubler; does the power turn on every 2 minutes? 15. Check if there is any leakage or short circuit or AC/DC voltage between the two loops. Table 86. Result / Indication V<85V Perform V>85V Power OK The loop is too long. Change to a thicker line. Go to step 7. Replace doubler. Power failure No leakage Go to step 15. Go to step 7. No Communication - RU and CU HDSL - No Doublers Relevant for the following Alarm IDs: 7, 41, 43 Check / Action 1. 2. 3. 4. 5. 6. 7. Is there a problem with all the links or with just one link? Result / Indication One link All the links Is the cable connected and secured Yes properly to P16 on the CU and RU backplanes? No Is there a problem with the cable connecting the CU to the RU? Yes No Is a red ER LED of the HDSL card Red LED off on (check physically or using ClearAccess+/LCT cage view)? Red LED on Is the green ACT LED of the Green LED on HDSL card on? Green LED off Is the card recognized by No ClearAccess+/LCT? Yes Replace HDSL card in the CU. Not recognized Does ClearAccess+/LCT recognize the card now? No communication P/N 760-000731 Rev A March 2006 Perform Go to step 4. Go to step 2. Go to step 3. Secure cable connections. Replace the problematic cable. Go to step 7. Go to step 5. Go to step 6. Go to step 6. Go to step 7. Go to step 7. Go to step 8. Reset the CPT card using the RST button on the card's front panel. If this doesn't solve the problem, replace the CPT card at the CU. Replace the HDSL card at the RU. Page 131 5. Fault Management Check / Action 8. 9. Result / Indication What do the properties of the card ClearAccess+/LCT indicate? OEM communication error Loop A,B failed Check the quality of the failed loop No (too noisy or too long) and the connections at the distribution block at the RU and CU sides. Is the loop suitable for HDSL requirements? Yes Table 87. Perform Go to step 7. Go to step 9. Choose a better loop. Go to step 7. No Communication - RU and CU ONTU Relevant for the following Alarm IDs: 7, 36, 38, 42, 44, 48, 50 Check / Action 1. 2. 3. 4. 5. 6. Page 132 At the CU, which LEDs on the ONTU card are on and which are off (check physically or use ClearAccess+/LCT cage view)? Check that the CU backplane dipswitches are configured correctly (13 - 15) and correct the settings if necessary. If you change the dipswitch settings, reset the CPT card. Is the problem solved? Verify that the E1 external jumper on the CU ONTU card is in the correct position, and fix if necessary. If two cages exist in the CU, check the expansion cable connections between the cages, and fix if necessary. Reset the CPT card in the CU using the RST button on the card's front panel. If this doesn't solve the problem, replace CPT card. Is the red LED still on? Replace the ONTU card in the CU March 2006 Result / Indication Perform Green LED flashing, red LEDs off Go to step 6. Green LED on, Red ERR LED on Green LED on, Tx red LED on Green LED on, Rx LED on Problem not solved Go to step 2. Go to step 6. Go to step 7. Go to step 3. Problem not solved Go to step 4. Problem not solved Go to step 5. Problem not solved Go to step 6. Problem not solved Go to step 9. P/N 760-000731 Rev A BroadAccess Maintenance Guide Check / Action 7. At the CU, using an optical power meter, measure the optical power on the fiber optic cable connected between the CU's F-Tray (fiber optic splicing tray) Tx connector, and the Rx connector on the CU backplane. Push the Reset button on the CU's ONTU card. Does the attenuation meet the card's specified requirements? 8. At the CU, measure the optical power on the fiber optic cable connected between the CU's FTray (fiber optic splicing tray) Rx connector, and the Tx connector at the RU. Push the Reset button on the CU's ONTU card. Does the attenuation meet the card's specified requirements? 9. At the RU, which LEDs on the ONTU card are on and which are off? 10. 11. 12. 13. P/N 760-000731 Rev A Verify that the E1 external jumper on the RU ONTU card is in the correct position, and fix if necessary. If two cages exist in the RU, check the expansion cable connections between the cages, and fix if necessary. Reset the CPTE card in the RU using the RST button on the card's front panel. If this doesn't solve the problem, replace CPTE card. Is the red LED still on? Replace the ONTU card in the RU. March 2006 Result / Indication Perform No Replace the fiber optic connectors on the backplane. If problem persists, go to step 6. Yes No Go to step 8. Go to step 9. Yes Green LED flashing, red LEDs off Green LED on, Red ERR LED on Green LED on, Tx red LED on Green LED on, Rx LED on Problem not solved Go to step 2. Go to step 14. Problem not solved Go to step 12. Problem not solved Go to step 13. Problem not solved Contact Customer Support. Go to step 10. Go to step 13. Go to step 14. Go to step 11. Page 133 5. Fault Management Check / Action 14. At the RU, using an optical power meter, measure the optical power on the fiber optic cable connected between the RU's F-Tray (fiber optic splicing tray) Tx connector, and the Rx connector on the RU backplane. Push the Reset button on the RU's ONTU card. Does the attenuation meet the card's specified requirements? 15. At the RU, measure the optical power on the fiber optic cable connected between the RU's FTray (fiber optic splicing tray) Rx connector, and the Tx connector at the CU. Push the Reset button on the RU's ONTU card. Does the attenuation meet the card's specified requirements? Table 88. Result / Indication Perform No Contact Customer Support. Yes No Go to step 15. Replace the fiber optic connectors on the backplane. If problem persists, replace the fiber optic cables. Yes Contact Customer Support. No Communication - RU and CU ONTU (with backup ONTU cards) Relevant for the following Alarm IDs: 7, 42, 44, 48, 50 Check / Action 1. 2. 3. Page 134 Result / Indication Pull the ONTU card halfway out of its slot at both CU and RU sides. Perform the procedure for No Still not OK Communication - RU and CU ONTU on page 132. Is the problem solved? Perform the same procedure as in step 2 on the backup transmission cards. March 2006 Perform Go to step 2. Go to step 3. If each link operates OK on its own, replace the cards and test the links in the following order until the problematic link is identified: - CU Slot 1 - RU Slot 1 - CU Slot 2 - RU Slot 2 P/N 760-000731 Rev A BroadAccess Maintenance Guide Table 89. No Dial Tone - Group of Subscribers or the Entire Cage (two cards or more) Relevant for the following Alarm IDs: Not applicable - see Other Problems on page 94 Check / Action 1. 2. Does the group have dial tones? Is line allocation, indicated by the green LED or through the ClearAccess+/LCT, working normally? 3. Does ClearAccess+/LCT indicate many line mismatches or “Configuration Line Missing” alarms? 4. Check that the lines between the CU and RU are cross-connected. 5. 6. 7. 8. 9. 10. 11. P/N 760-000731 Rev A Result / Indication No No Go to step 2. Go to step 3. Yes Yes Go to step 5. Fix the problem. No Cross-connected Go to step 4. Go to step 5. Not crossconnected Using the ClearAccess+/LCT, cross-connect the lines between the CU and the RU. Fix the problem between the CU and the exchange. At the CU, for a random subscriber No in the group which is properly connected, check if there is a dial tone at the exchange distribution block. Was a dial tone detected? Yes Are the cables connecting the Yes exchange to the backplane at the CU (cables P1 to P15) properly connected? No Are the cables connecting the Still no dial tone subscribers to the backplane at the RU (cables P1 to P15) properly connected? Not connected Replace CPT card at the CU. Is Still no dial tone there a dial tone now? Replace transmission card at CU. Still no dial tone Is there a dial tone now? Replace CPTE card at the RU. Is Still no dial tone there a dial tone now? Replace transmission card at the Still no dial tone RU. March 2006 Perform Go to step 6. Go to step 7. Go to step 12. Go to step 8. Go to step 12. Go to step 9. Go to step 10. Go to step 11. Go to step 12. Page 135 5. Fault Management Check / Action 12. Secure all cable connections at CU/RU mentioned in steps 6 and 7. Table 90. Result / Indication Still no dial tone Perform Contact Customer Support. No Dial Tone - Regular Subscriber Relevant for the following Alarm IDs: Not applicable - see Other Problems on page 94 Note: At each step of the processes described here, check whether or not there is a dial tone. If there is no dial tone, follow the steps in the table. Check / Action 1. 2. 3. 4. 5. Check line allocation via the ClearAccess+/LCT and the green LED turned on in the corresponding card. Are indications normal? (check LEDs physically or use ClearAccess+/LCT cage view) Is there dial tone at the CU distribution block? Are the cables connecting the exchange to the backplane (cables P1 to P15) in the CU properly connected? Replace the service card at the CU side. Does the subscriber have a dial tone? Replace the service card at the RU side. Does the subscriber have a dial tone? Table 91. Result / Indication Perform Yes Go to step 2. No Go to step 5. No There is a problem between the CU and the exchange. Go to step 3. Secure cable connection. Yes Not connected Yes Still no dial tone Go to step 4. Go to step 5. Still no dial tone Check the subscriber cable at the RU side (cables P1 to P15). No Dialing - Group of Subscribers (two cards or more) Relevant for the following Alarm IDs: Not applicable - see Other Problems on page 94 Check / Action 1. Page 136 Can subscribers dial? Result / Indication No March 2006 Perform Go to step 2. P/N 760-000731 Rev A BroadAccess Maintenance Guide Check / Action 2. Connect a telephone to the distribution block at the CU and try dialing from there. Can you dial? 3. Reset the CPT card, using the RST button on the card's front panel. If the problem persists, replace the CPT card at the CU. Can subscribers dial now? Reset the CPTE card, using the RST button on the card's front panel. If the problem persists, replace the CPTE card at the RU. Replace the transmission card at CU. Can subscribers dial now? Replace the transmission card at the RU. Can subscribers dial now? 4. 5. 6. Table 92. Result / Indication Perform No Fix the problem between the CU and the exchange. Yes Still no subscriber dialing. Go to step 3. Go to step 4 Still no subscriber dialing. Go to step 5. No Go to step 6. Still no subscriber dialing. Replace the transmission card at the RU. No Intracalls Relevant for the following Alarm IDs: Not Applicable - see Other Problems on page 94 Check / Action P/N 760-000731 Rev A 1. Does ClearAccess+/LCT show that intracall is enabled? 2. Is failure partial or for all subscribers? 3. Reset the CPT card, using the RST button on the card's front panel. If the problem persists, replace the CPT card at the CU. 4. Reset the CPTE card, using the RST button on the card's front panel. If the problem persists, replace the CPTE card at the RU. March 2006 Result / Indication No Yes No intracalls for all subscribers Partial failure Still no intracalls Still no intracalls Perform Enable Intracalls using ClearAccess+/LCT. Go to step 2. Go to step 3. Go to step 4. Check for overattenuation of subscribers between the CU and the exchange. Contact Customer Support. Page 137 5. Fault Management Table 93. No Power Relevant for the following Alarm IDs: N/A Check / Action 1. Is power off in the entire system or in one of the voltages only? 2. Verify that the power switch of the PSRGx/PSDCx card is set to ON. Is the problem solved? Is the pointer of the backplane dipswitch 12 set as follows: Left - -60 V system Right - -48 V system 3. 4. 5. 6. 7. 8. Do the supply lines (-48/60 V) on the backplane have a minimum voltage and are they connected properly? Is the PSDCx/PSRGx card securely positioned in the cage? Replace PSDCx/PSRGx card. Is the problem solved? Probably, one of the cards in this cage is overloading the power supply. - Turn power off. - Remove all the cards (except the power cards). - Turn power on. Is there still a power failure on an individual voltage? Result / Indication Total failure Go to step 2. Partial failure Still no power Go to step 6. Go to step 3. Correct Go to step 4. Incorrect Correct the dipswitch position. Make sure the voltage entering the system meets the required specifications. Go to step 5. Not enough voltage Yes, enough voltage Yes, card is secure Still no power Go to step 6. Go to step 7. Go to step 8. No Yes Table 94. Perform Insert the cards one by one and verify which card is causing the power fault. Replace that card. Replace the cage. No Power at CU Relevant for the following Alarm IDs: Not applicable - see Other Problems on page 94 Check / Action 1. Page 138 Check red and black power cable connections. March 2006 Result / Indication Perform OK Go to step 3. Not OK Go to step 2. P/N 760-000731 Rev A BroadAccess Maintenance Guide Check / Action 2. Tighten connections or replace cable. 3. Check -48 V source from the operating company. 4. Make sure the power switch on the CU's power card is ON. 5. Replace the power supply. Table 95. Result / Indication Perform OK Problem is solved. Not OK OK Go to step 3. Problem is solved. Not OK OK Go to step 4. Problem is solved. Not OK OK Not OK Go to step 5. Problem is solved. Contact Customer Support. No Power at an RU Relevant for the following Alarm IDs: Not applicable - see Other Problems on page 94 Check / Action 1. Check the DC circuit breaker (load circuit breaker and battery circuit breaker). 2. Check the AC power source. 3. Check the mains circuit breaker. Result / Indication OK Problem is solved. Not OK OK Not OK OK Go to step 2. Go to step 3. Go to step 3. The problem is the external power source. Turn switch ON. Go to step 4. Go to step 5. Not OK 4. 5. P/N 760-000731 Rev A Charger has ON/OFF switch. Make sure that the charger switch in ON. 6. Set the load and batteries circuit breakers to OFF. Check the charger output. 7. Replace the charger. 8. Set the load and battery circuit breakers to ON. 9. RU has DC box and LVLD? 10. Check the LVLD box. March 2006 Perform No OK Not OK Problem is solved. Go to step 5. Go to step 6. OK Not OK OK Not OK OK Go to step 8. Go to step 7. Go to step 8. Contact Customer Support. Problem is solved. Not OK Yes No OK Not OK Go to step 9. Go to step 10. Go to step 12. Go to step 12. Go to step 11. Page 139 5. Fault Management Check / Action 11. Replace the LVLD box. 12. Check the connection of the red and black cables. 13. Make sure that the PSRGx series card switch is ON. 14. Replace the PSRGx series card. Table 96. Result / Indication Perform OK Not OK OK The problem is solved. Go to step 12. Go to step 13. Not OK Tighten connections or replace cable. Problem is solved. OK Not OK Still no power. Go to step 14. Contact Customer Support. No Power Feeding - Regular Subscriber Relevant for the following Alarm IDs: Not applicable - see Other Problems on page 94 Check / Action 1. 2. 3. 4. Does subscriber have power feeding on the lines? Is the proper service card installed? Is the cable connection to the RU OK? Replace the service card. Table 97. Result / Indication Perform No Go to step 2. No Replace the service card. Go to step 3. Go to step 4. Yes Yes No Power Feeding to a Group of Subscribers (two cards or more) Relevant for the following Alarm IDs: Not applicable - see Other Problems on page 94 Check / Action 1. 2. 3. 4. Page 140 Result / Indication Is group power feeding on? No Are subscribers connected to the No proper service card(s) at the RU? Yes Check power feeding to a subscriber by connecting a telephone to the distribution block close to the RU. Is there power feeding to the subscriber? Is there -48V power feeding at the -48VF (filtered) test point on the backplane? March 2006 No No feeding Perform Go to step 2. Connect subscribers to the card(s) at the RU. Check cables connecting subscribers from the exchange distribution block to the system (connectors P1 to P15). Go to step 4. Go to step 5. P/N 760-000731 Rev A BroadAccess Maintenance Guide Check / Action 5. Is there -48V power feeding at the input point? Result / Indication No feeding OK Table 98. Perform Check the batteries/power supply charger. Replace PSRGx series card. No Ringing - Group of Subscribers (two cards or more) Relevant for the following Alarm IDs: 6 Check / Action 1. 2. 3. 4. 5. 6. 7. 8. 9. 10. 11. P/N 760-000731 Rev A Do subscribers hear rings for incoming calls? Can subscribers dial? Result / Indication No Go to step 2. Yes No Go to step 3. Perform the following procedure: No Dialing Group of Subscribers (two cards or more) on page 136. Go to step 6. Does the ClearAccess+/LCT report Yes on ringer failure? No When the telephone should be No ringing, is the green LED on the POTS service card on? (check physically or use Yes ClearAccess+/LCT cage view) Connect a telephone to the No distribution block at the CU. Does the telephone ring? (skip this step if V5.x protocols are Yes used - instead, check if there are problems between the LI-4E1 card and the exchange) Replace PSRGx card at the RU. If Green LED on, more than one PSRGx is installed in still no ringing the cage, replace them both. Do subscribers hear rings now? Replace the service cards in the RU Green LED on, for the problematic lines. still no ringing Replace CPTE card at the RU. Do Green LED on, subscribers hear rings now? still no ringing Replace transmission card at the Green LED on, RU. Do subscribers hear rings now? still no ringing Replace CPT card at the CU. Do Still no ringing subscribers hear rings now? Replace transmission card at the Still no ringing CU. Do subscribers hear rings now? March 2006 Perform Go to step 4. Go to step 5. Go to step 6. Fix the problem between the CU and the exchange. Go to step 6. Go to step 7. Go to step 8. Go to step 9. Go to step 10. Go to step 11. Contact Customer Support. Page 141 5. Fault Management Table 99. No Service DAT64-CO Subscriber Relevant for the following Alarm IDs: Not Applicable - see Other Problems on page 94 Check / Action 1. 2. 3. 4. 5. 6. 7. Page 142 Check card allocation via ClearAccess+/LCT and whether green LEDs are ON. Check that yellow LED status, for the specific channel of the DAT64CO card is ON (check LEDs physically or use ClearAccess+/LCT cage view). Check the configuration of the DAT64-CO card at the CU (jumpers). In case of automatic cross-connect mode, check that DAT64-CO card is in the same slot in both the CU and the RU. In the case of manual crossconnect mode, make sure that the DAT64-CO channel at the RU is cross-connected to the DAT64CO channel at the RU. Check that the DAT64-CO card jumper is correctly configured at the RU. Check the yellow LED status for the specific channel. Replace the DAT64-CO card at the CU. Has service been established? Replace the DAT64-CO card at the RU. Has service been established? Check the connections at the CU or connect a modem to the CU. Does it work? March 2006 Result / Indication Perform LEDs ON Go to step 7. LEDs OFF Go to step 2. Not same slot (manual mode)/ channel (automatic mode) Move DAT64-CO card so that position is the same at both CU and RU (automatic mode) Same slot (manual mode). Yes Correct the crossconnection of channels. Go to step 4. LED is ON Go to step 7. LED is OFF Still no service Go to step 5. Go to step 6. Still no service Go to step 7. Does not work Problem between the CU and the exchange. Works Check the cable connection at the RU side. P/N 760-000731 Rev A BroadAccess Maintenance Guide Table 100. No Service - ISDN Subscriber (ISDNE Card) Relevant for the following Alarm IDs: Not Applicable - see Other Problems on page 94 Check / Action 1. 2. 3. 4. 5. 6. 7. Do regular subscribers have service? Is the red LED on or green LED off on the ISDNE card? (check physically or use ClearAccess+/LCT cage view). Replace the ISDNE card at one side. Was the problem solved? Make a call from the subscriber that doesn't have service. Does the yellow LED flash? Check connection to the distribution block at the RU side and fix if necessary. Check connection to the distribution block at the CU side and fix if necessary. Connect the NT directly to the exchange. Does it work? Result / Indication Yes Go to step 2. No Yes The problem is in the system, and not the ISDNE cards. Fix the service to regular subscribers first. Go to step 3. No Go to step 4. Problem not solved Yes Replace the ISDNE card at the other side. Go to step 6. No Problem not solved Go to step 5. Go to step 3. Problem not solved Go to step 7. No Exchange problem there is no problem in the BroadAccess system. Go to step 3. Yes P/N 760-000731 Rev A March 2006 Perform Page 143 5. Fault Management Table 101. No Service - ISDN Subscriber (ISDNE or 4B3T Card) Relevant for the following Alarm IDs: Not Applicable - see Other Problems on page 94 Note: 1. Yellow LED indications on ISDNE card (CU or RU): LED is on U-interface is active 2. A LED flashing on the 4B3T card can mean that either the CU is not connected to the exchange, or that there is a short circuit between A and B at the RU. Check / Action 1. 2. 3. 4. 5. 6. 7. 8. Page 144 Do regular subscribers have service? Result / Indication Yes Go to step 2. No The problem is in the system, and not the ISDNE/4B3T cards. Fix the service to regular subscribers first. Go to step 5. Is ISDNE card red FAIL LED on, Yes and green OK LED off? or Is 4B3T card red UERR LED on, and green ACT LED off? (check physically or use No ClearAccess+/LCT cage view) Does the ClearAccess+/LCT show No that communication has been established between the CU and RU? Yes Replace ISDNE/4B3T card at one Problem not side (CU or RU). Do the solved. subscribers have service? Does the ClearAccess+/LCT report VF failure Loop or VF failure? Loop failure Perform a VF test. VF Test failure Replace ISDNE/4B3T card. Problem not solved. Check the wires between the RU Red LED on and the subscribers to see where ISDN card the problem is, and fix the wires if necessary. Is the red LED still on? March 2006 Perform Go to step 3. Fix the problem so that communication is restored. Go to step 4. Replace ISDN card at the other side. Go to step 6. Go to step 8. Go to step 7. Go to step 8. Contact Customer Support. P/N 760-000731 Rev A BroadAccess Maintenance Guide Table 102. No Service - LLSI Channel Relevant for the following Alarm IDs: Not Applicable - see Other Problems on page 94 Check / Action 1. 2. 3. 4. 5. 6. 7. 8. 9. 10. P/N 760-000731 Rev A Check the card allocation via the ClearAccess+/LCT and that the green LEDs are turned on in LLSI CU and RU cards. Are green LEDs turned on? (check physically or use ClearAccess+/LCT cage view) Replace LLSI card at the CU. Replace the LLSI card at the RU. In case of manual cross-connect mode, make sure that the LLSI channel at the RU is connected to the LLSI channel at the CU. In case of automatic crossconnect mode, make sure that the LLSI card is located in matching CU and RU slots. Is the card in matching slots/cross-connected correctly? Is the LLSI card jumper at the CU side configured correctly for operation at the CU side? Is the LLSI jumper at the RU side configured correctly for operation at the RU side? Is the card configured for 2W or 4W operation? Verify that LLSI cards at the CU and RU have 2W configuration. Verify that LLSI cards at the CU and RU have 4W configuration. Connect a modem at the CU side. Does the modem work properly? March 2006 Result / Indication Perform On Go to step 4. Off Go to step 2. Still no service Still no service Not same slot (when using manual mode) Go to step 3. Go to step 4. Move LLSI card so that position is the same at both CU and RU. Yes Yes Go to step 5. Go to step 6. Yes Go to step 7. 2W Go to step 8. 4W Configured for 2W Configured for 4W Modem does not work. Yes; works at CU Go to step 9. Go to step 10. Go to step 10. Problem between the CU and the exchange. Check connection between the RU and the subscriber. Page 145 5. Fault Management Table 103. Power Limit Exceeded, Card Disabled Relevant for the following Alarm IDs: 214, 215 Check / Action 1. Result / Indication This alarm specifies the cards which have been disabled by the system due to insufficient power supply to the system (as indicated by alarm ID 213). This alarm will be displayed for each card that has been disabled. Perform Follow the instructions described in Power Threshold Exceeded on page 146 to solve the problem. Table 104. Power Threshold Exceeded Relevant for the following Alarm IDs: 213 Check / Action 1. Result / Indication Perform The alarm cleared Problem solved Do one of the following: - Replace the PSRG40 or PSDC40 card installed in the unit reporting the alarm with a PSRG-E or PSDC-E card - Reduce the number of service Alarm still on Contact Customer cards installed in the unit reporting Support. the alarm Table 105. PSTN DL Failure Relevant for the following Alarm IDs: 309 Check / Action 1. 2. Page 146 Check that the V5.2 Link ID is configured correctly in the ClearAccess+/LCT V5.2 Configuration window. Check that configuration parameters for the Link ID in the BroadAccess system match the Link ID parameters configured at the Local Exchange. Check the physical cable connections between the LI4E1/LI-16E1 card connectors (on the BroadAccess cage backplane) and the Local Exchange; check that the cables are intact. March 2006 Result / Indication Perform Configuration wrong Fix the configuration parameters as necessary. Configuration OK Go to step 2. Connections not OK Fix cables/cable connections. Connections OK Contact Customer Support. P/N 760-000731 Rev A BroadAccess Maintenance Guide Table 106. Read-Only Access to NEs using ClearAccess+ Client Relevant for the following Alarm IDs: N/A Check / Action 1. 2. Do you have the appropriate security authorization level to configure the NE? Is another ClearAccess+ user logged into the same NE? Result / Indication Yes Go to step 2. No Ask your system administrator to configure your User permissions to include the tasks you need to perform. See the section Security Management in the ClearAccess+ Installation and Administration Guide or ClearAccess+ online help system for more information. Wait until that User has logged out, or use the Force User Logout feature, if you are a Supervisor or have the required authorization privileges to do so. See the section Security Management in the ClearAccess+ Installation and Administration Guide or ClearAccess+ online help system for more information. Go to step 3. Yes No P/N 760-000731 Rev A March 2006 Perform Page 147 5. Fault Management Check / Action 3. Is an LCT User logged in to the NE? Result / Indication Yes Perform Wait until the LCT User has logged out, or force the disconnection of the LCT User, using the Force LCT Disconnection feature, if you have the required authorization privileges to do so. See the section Forcing LCT Disconnection in the ClearAccess+ Installation and Administration Guide or ClearAccess+ online help system for more information. Table 107. Remote Defect Indication (RDI) - STM1 ATM Interface Relevant for the following Alarm IDs: 167 Check / Action 1. Page 148 Check the physical STM1 connection from the Tx of the ATM-UNI card to the Rx of the ATM switch. Result / Indication Connections OK Go to step 2. Secure cable connections. If there is a problem, check the fiber optic cable connections. If the connections are OK, go to Step 3. Fix the alarms. If the problem persists, go to step 4. Go to step 4. 2. Check the fiber with an optical power meter. Problems with connections Problem with optical power 3. Check if there are alarms in the ATM network. Alarms exist in the network 4. Replace the fiber. 5. Replace the ATM-UNI card. 6. Contact Customer Support. March 2006 Perform No alarms in the network Problem not solved Problem not solved. Go to step 5. Go to step 6. P/N 760-000731 Rev A BroadAccess Maintenance Guide Table 108. Same Line Element Detected in More than One RU Relevant for the following Alarm IDs: 102 Check / Action 1. Check if a service card is installed in the same slot number in more than one RU cage. 2. Is automatic or manual crossconnect mode used? 3. Contact Customer Support. Result / Indication Perform Yes Go to step 2. No Automatic Go to step 3. Install the service cards in the correct RU slots, or change to manual cross-connect mode. If problem still exists, go to step 3. Go to step 3. Manual Table 109. SHDSL VC12 Interface Alarms Relevant for the following Alarm IDs: 171, 172, 173, 174, 175, 176, 177, 178 Check / Action 1. 2. Check for STM1 alarms. 3. Are alarms indicated on all VCs to a particular CU or RU? 4. Check VC cross-connect table in ClearAccess+/LCT for the local CU or RU. 5. P/N 760-000731 Rev A Check for STM4 alarms in ClearAccess+/LCT at all CUs and RUs on the fiber link/ring. Correct cross-connect table. March 2006 Result / Indication There is an STM4 alarm There is no STM4 alarm There is an STM1 alarm There is no STM1 alarm Yes No Cross-connect configuration is OK Cross-connect configuration is not OK The alarm is cleared The alarm is not cleared Perform Follow the procedure for STM4 Problem on page 153. Go to step 2. Follow the procedure for STM1 Problem on page 151. Go to step 3. Follow the procedure for STM1 Problem on page 151. Go to step 4. Go to step 6. Go to step 5. The problem is solved. Go to step 6. Page 149 5. Fault Management Check / Action 6. 7. Delete the VC and assign a different VC. Replace the LI-SHDSL series card for external links. Swap the STM4 series card for internal links if a backup exists. Replace the STM4 card. Result / Indication Perform The alarm is cleared The alarm is not cleared The alarm is cleared The problem is solved. The alarm is not cleared Contact Customer Support. Go to step 7. The problem is solved. Table 110. Software Version Control Mismatch Relevant for the following Alarm IDs: 180, 181, 182, 183, 184, 185, 186, 196, 276, 279, 284, 287, 324 1. Check / Action Result / Indication Perform Check the software version profile currently used by the system, using the ClearAccess+/LCT Software Download window (accessed from the NE Operation window) Software in card's active bank doesn't match software version profile If a compatible version is saved in the inactive bank, swap the bank controlling the card. If no compatible software version is saved on the card, download the correct version to the card and swap. Go to step 2. Software version of card's active bank is the same as the system version profile 2. Contact Customer Support. Table 111. STM1 ATM Interface Alarms Relevant for the following Alarm IDs: 163, 164, 165, 166, 167, 168, 169, 170, 260, 261 Check / Action 1. Page 150 Is the optical fiber connected properly to the ATM card? March 2006 Result / Indication Perform Yes Go to step 2. No Fix connection. P/N 760-000731 Rev A BroadAccess Maintenance Guide Check / Action 2. 3. Check the optical fiber between the ATM card and the ATM switch, using an optical power meter. Perform a loopback on the STM1, using ClearAccess+/LCT, in the ATM card's STM1-UNI configuration window. Result / Indication Problem with the cable No problem with the cable Passed loopback test Failed loopback test 4. In ClearAccess+/LCT's ATM card's configuration window, check that the parameters configured there match the parameters configured at the ATM switch (for example, SDH/SONET, scrambling). If SDH/SONET configuration is incompatible, a LOP alarm may also be reported by the system. If HEC configuration is incompatible, an LCD alarm may also be reported by the system. Perform Check that the fiber optical cable connectors are properly connected. If they are OK and there is still a problem with the cable, replace the cable. Go to step 3. Go to step 4. Configuration not correct Fix or replace the fiber optic cables or connections; remove the loop back. Fix the configuration either in the BroadAccess system (using ClearAccess+/LCT) or at the ATM switch. Configuration OK Contact Customer Support. Table 112. STM1 Problem Relevant for the following Alarm IDs: 56, 58, 60, 63, 66, 75, 78, 122, 169 Check / Action 1. Are STM4 alarms also reported in the system? Result / Indication Yes No P/N 760-000731 Rev A March 2006 Perform Fix STM4 problem first (see STM4 Problem on page 153). If the STM1 alarms do not clear, go to step 2. Go to step 2. Page 151 5. Fault Management 2. 3. 4. 5. 6. 7. 8. 9. Page 152 Check / Action Result / Indication Using ClearAccess+/LCT, check whether the problem in the STM4 series card is a near end alarm or a remote alarm. STM1 is reporting near end and remote alarms STM1 is reporting remote alarms only STM1 is reporting near end alarms only Go to the RU where the problem occurs. If the alarm is a remote alarm, note that the card reporting the alarm is not the card with the problem - it is the card that transmits to the card reporting the problem that is causing the alarm. On the backplane of the cage (CU or RU), physically set a fiber loop back by connecting the Tx and the Rx. Alternatively, use the management system to set a local loop back on the fiber link. Replace the fiber cable or remove the software loop back. Swap the STM4 card if a backup card exists, and then replace the failed STM4 card. Go to the unit transmitting to the unit reporting the problem, and replace the STM4 card there. Swap the CPT card. Perform Go to step 3. Go to step 7. Go to step 3. Go to step 4. The alarm cleared Go to step 5. Alarm still on Go to step 6. The alarm cleared Go to the unit transmitting to the unit reporting the problem, and replace the STM4 card there. The problem is solved. Alarm still on The alarm cleared Go to step 8. The problem is solved. Alarm still on The alarm cleared Alarm still on Go to step 8. Go to step 9. Contact Customer Support. Replace the standby CPT card. March 2006 P/N 760-000731 Rev A BroadAccess Maintenance Guide Table 113. STM4 Problem Relevant for the following Alarm IDs: 54, 55, 59, 62, 65, 77, 262 Check / Action 1. 2. 3. For all alarms except for LOS and Intermittent Facility alarms, check the Rx (Receive) optical power level of the card reporting the problem, using ClearAccess+/LCT Link Configuration window. Does the problem occur in a system installed on a multi-CU ring? Using ClearAccess+/LCT, check whether the problem in the STM4 series card is a near end alarm or a remote alarm. If the alarm is a remote alarm, note that the card reporting the alarm is not the card with the problem - it is the card that transmits to the card reporting the problem that is causing the alarm. Result / Indication LOS or Intermittent Facility alarm Check the fiber optic cables, the fiber optic cable connectors, etc., and fix if necessary. If problem persists, go to step 2. Optical power levels are lower than the card specifications Check the fiber optic cables, the fiber optic cable connectors, etc., and fix if necessary. If problem persists, go to step 2. Go to step 2. Optical power levels are OK. Yes No STM4 card is reporting near end and remote alarms STM4 card is reporting remote alarms only STM4 card is reporting near end alarms only P/N 760-000731 Rev A March 2006 Perform Check the numbering of the CUs and if necessary, renumber them with unique numbers, using dipswitches 9-10 on the system backplane, and reset the CPT card. If the problem persists, go to step 3. Go to step 3. Go to step 4. Go to step 7. Go to step 4. Page 153 5. Fault Management Check / Action 4. Physically set a fiber loop back to the location where the alarm was generated, by connecting the Tx and the Rx. 5. Fix or replace the fiber optic cables or connections; remove the loop back. 6. 7. Reset the STM4 card reporting the problem. If the problem is not solved, replace the card (swap it to backup mode first, if a backup STM4 card exists in the cage). Reset the STM4 card which transmits to the STM4 card reporting the problem. Result / Indication The alarm cleared Go to step 5. Alarm still on Alarm still on Go to step 6. Go to step 6. The alarm cleared Alarm still on The problem is solved. The alarm is cleared The problem is solved. (Remove the loop back). Replace the failed STM4 card. If the problem persists, go to step 8. Go to step 9. Alarm still on 8. If there is a backup CPT card in the CU, swap the CPT card. If there is no backup CPT card, reset the CPT card. The alarm is cleared Alarm still on 9. Perform Go to step 7. Contact Customer Support. Remove the loop back. Replace the failed CPT card (now on standby if there is a backup card). Table 114. STM4 Series Backup Card Failure Relevant for the following Alarm IDs: 53 Check / Action 1. 2. Page 154 Replace the backup card. Replace the active card. March 2006 Result / Indication Alarm clears. Alarm does not clear. Alarm clears. Alarm does not clear. Perform Go to step 2. Contact Customer Support. P/N 760-000731 Rev A BroadAccess Maintenance Guide Table 115. Temperature Alarm Relevant for the following Alarm IDs: 1, 2, 3, 4, 197, 200, 282, 285, 319, 325 Check / Action 1. Are the cage or roof fans operating? 2. Is the outdoor cabinet well ventilated? Result / Indication Yes Go to step 2. No Yes No Go to step 3. Replace the card which caused the alarm. Clean the filter to improve ventilation. Fix the wiring. Yes Replace the roof fans. No 3. Is the fan wiring connected correctly? Perform Table 116. Test Module Failed Relevant for the following Alarm IDs: 18 Check / Action 1. P/N 760-000731 Rev A Result / Indication Perform Reset the CPT card, using the RST button on the card's front panel. If the problem persists, replace the CPT card where the test module failed. March 2006 Page 155 5. Fault Management Table 117. Transmission Card Does Not Respond Relevant for the following Alarm IDs: 82, 83 Check / Action 1. Result / Indication Perform For ONTU cards, refer to the following procedures: No Communication - RU and CU ONTU on page 132 No Communication - RU and CU ONTU (with backup ONTU cards) on page 134 For LTM cards, refer to one of the following procedures, depending on your system configuration: No Communication - RU and CU E1 Long Haul (LTM card) on page 127 No Communication - RU and CU E1 Short Haul (LTM card) on page 128 For HDSL cards, refer to one of the following procedures, depending on your system configuration: No Communication - RU and CU HDSL - No Doublers on page 131 No Communication - RU and CU HDSL - 1 Doubler on page 130 Table 118. Unrecognized Card Relevant for the following Alarm IDs: 216, 217, 218, 313, 314, 315 Check / Action 1. Page 156 Result / Indication Perform The card causing the alarm is not a Alarm clears. card intended for use in BroadAccess systems. Remove the Alarm still on. card causing the alarm. Problem solved. March 2006 Contact Customer Support. P/N 760-000731 Rev A BroadAccess Maintenance Guide Table 119. Unsupported Card Relevant for the following Alarm IDs: 310, 311, 312 Check / Action 1. Result / Indication Perform The card causing the alarm is not Alarm clears. compatible with the system's software version. Remove the card Alarm still on. causing the alarm. Problem solved. Contact Customer Support. Table 120. V5 Cycling Problem Relevant for the following Alarm IDs: Not Applicable - see Other Problems on page 94 Check / Action 1. 2. Check the V5 Interface Status field in ClearAccess+/LCT V5.x Configuration window. Click the Refresh button to ensure that the information displayed is current. Check that the V5.x configuration at the CU and at the local exchange are the same. If they are not configured with the same parameters, fix at the CU or at the local exchange. Result / Indication Perform The problem still exists Go to step 2. Status is OK Reached Inactive or In Service state There is no problem. The problem is solved. Did not reach Inactive or In Service state Contact Customer Support. Table 121. V5 Out of Service Relevant for the following Alarm IDs: 31 Check / Action 1. Check the primary link. 2. Solve the primary link problem. Refer to the troubleshooting procedures for No Communication or Link Failure on page 120. Result / Indication Alarm on link No alarm on link V5 alarm cleared V5 alarm not cleared P/N 760-000731 Rev A March 2006 Perform Go to step 2. Go to step 3. The problem is solved. Go to step 3. Page 157 5. Fault Management Check / Action 3. 4. 5. In the ClearAccess+/LCT V5.1 or V5.2 Configuration window, click Shutdown Interface; then click Restart Interface. Check that the V5.x configuration is the same at the local exchange and in the CU. Check that the E1 link connections are defined consistently at the CU and at the local exchange. Result / Indication Perform V5 alarm cleared The problem is solved. V5 alarm not cleared Configuration not the same Go to step 4. Configuration OK V5 alarm cleared V5 alarm not cleared Fix configuration at either CU or local exchange. Go to step 5. The problem is solved. Contact Customer Support. Table 122. V5 Variant Error Relevant for the following Alarm IDs: 32 Check / Action Page 158 1. Check the V5.x configuration and compare it to ETSI standard requirements. Are requirements for V5.x met? 2. Is the V5.x configuration the same at the CU and at the local exchange? 3. Restart the V5.x interface. March 2006 Result / Indication Perform No Fix the V5.x configuration. Yes No Go to step 2. Fix the configuration either at the CU or at the local exchange. Go to step 3. The problem is solved. Yes The alarm is cleared and the interface enters the In Service state The alarm is not cleared or the interface does not enter the In Service state Contact Customer Support. P/N 760-000731 Rev A BroadAccess Maintenance Guide Table 123. VC-12 Alarm Relevant for the following Alarm IDs: 61, 64, 67, 76, 79, 80, 81, 116, 117, 118, 120, 123, 124, 125, 126, 179, 300, 301, 302, 303, 304, 305, 306, 307, 308 Check / Action 1. 2. Check for STM4 alarms in ClearAccess+/LCT at all CUs and RUs on the fiber link/ring. Check for STM1 alarms. 3. Are alarms indicated on all VCs to a particular CU or RU? 4. Check VC cross-connect table in ClearAccess+/LCT for the local CU or RU. 5. 6. 7. Correct cross-connect table. Delete the VC and assign a different VC. Replace the LI-4E1/LI-16E1 or LI-SHDSL series card for external links. Swap the STM4 series card for internal links if a backup exists. Replace the STM4 card. Result / Indication There is an STM4 alarm There is no STM4 alarm There is an STM1 alarm There is no STM1 alarm Yes No Cross-connect configuration is OK Cross-connect configuration is not OK The alarm is cleared The alarm is not cleared The alarm is cleared The alarm is not cleared The alarm is cleared The alarm is not cleared P/N 760-000731 Rev A March 2006 Perform Follow the procedure for STM4 Problem on page 153. Go to step 2. Follow the procedure for STM1 Problem on page 151. Go to step 3. Follow the procedure for STM1 Problem on page 151. Go to step 4. Go to step 6. Go to step 5. The problem is solved. Go to step 6. The problem is solved. Go to step 7. The problem is solved. Contact Customer Support. Page 159 5. Fault Management Table 124. VC TIM Alarm Relevant for the following Alarm IDs: 74 Check / Action 1. Is the CU or RU operational and is the VC configured properly? Result / Indication Perform No Fix the problem. Yes Contact Customer Support. Table 125. VF Failure Relevant for the following Alarm IDs: 84, 85, 86, 87 Check / Action 1. Does ClearAccess+/LCT indicate failure at one card or all cards at the RU? 2. Reset the CPTE card, using the RST button on the card's front panel. If the problem persists, replace the CPTE card at the RU. 3. 4. 5. Rerun the test using ClearAccess+/LCT. Disconnect the lines. Rerun the test using ClearAccess+/LCT. Result / Indication All Go to step 2. One Alarm clears Go to step 3. The problem is solved. Alarm does not clear Alarm clears Go to step 3. Alarm does not clear Go to step 4. Alarm clears Alarm does not clear 6. 7. 8. 9. Page 160 Replace the service card. Check the lines. Swap the CPT card. Move the failed line to another port on the card. March 2006 Perform Problem on all lines Problem on one line The problem is solved. Go to step 5. Go to step 7. Go to step 6. The problem is solved. Go to step 8. Go to step 9. The problem is solved. The problem is solved. P/N 760-000731 Rev A BroadAccess Maintenance Guide Table 126. WDM Problem Relevant for the following Alarm IDs: 270, 271, 272, 273 Check / Action 1. 2. Using ClearAccess+/LCT, check whether the problem is in the WDM series card is a near end alarm or a far end alarm. If the alarm is a far end alarm, note that the card reporting the alarm is not the card with the problem - it is the card that transmits to the card reporting the problem that is causing the alarm. 3. Physically set a fiber loop back to the location where the alarm was generated, by connecting the Tx and the Rx. 4. Fix or replace the fiber optic cables or connections; remove the loop back. 5. P/N 760-000731 Rev A Does the problem occur in a system installed on a multi-CU ring? Reset the WDM card reporting the problem. If the problem is not solved, replace the card. March 2006 Result / Indication Yes No WDM card is reporting near end and far end alarms WDM card is reporting remote alarms only WDM card is reporting near end alarms only The alarm cleared Perform Check the numbering of the CUs and if necessary, renumber them with unique numbers, using dipswitches 9-10 on the system backplane, and reset the CPT card. If the problem persists, go to step 2. Go to step 2. Go to step 3. Go to step 6. Go to step 3. Go to step 4. Alarm still on Alarm still on Go to step 5. Go to step 5. The alarm cleared Alarm still on The problem is solved. Go to step 6. Page 161 5. Fault Management Check / Action 6. Reset the WDM card which transmits to the WDM card reporting the problem. Result / Indication The alarm is cleared Alarm still on 7. If there is a backup CPT card in the CU, swap the CPT card. If there is no backup CPT card, reset the CPT card. The alarm is cleared Alarm still on 8. Perform The problem is solved. (Remove the loop back). Replace the failed WDM card. If the problem persists, go to step 7. Go to step 8. Contact Customer Support. Remove the loop back. Replace the failed CPT card (now on standby if there is a backup card). Table 127. xDSL LCD at Near End Relevant for the following Alarm IDs: 135 Check / Action 1. 3. If the alarm occurs on an LI-ADSL4P card, check that the E1 links between the LI-ADSL4P card and the LI-4E1 card are configured correctly. Using ClearAccess+/LCT, disable and then enable the line. Replace the LI-ADSL series card. 4. Replace the CPE. 5. Check that the cables and cable connections between the RU and the subscriber CPE are OK. 6. Using the ADSL port's Configuration window in ClearAccess+/LCT, check if the upstream SNR margin is above 6 dB, and if it is not, try to reduce the upstream rate or change the port's configuration profile to Adaptive at Start-Up. Contact Customer Support. 2. 7. Page 162 March 2006 Result / Indication Perform Not using an LI4ADSL4P card, or configuration is OK Go to step 2. Problem not solved Problem not solved Problem not solved Not OK Go to step 3. Cables OK Problem not solved Go to step 4. Go to step 5. Fix the cables. If the problem still exists, go to step 6. Go to step 6. Go to step 7. P/N 760-000731 Rev A BroadAccess Maintenance Guide Table 128. xDSL LCD at Near End - SHDSL Line Relevant for the following Alarm IDs: 193 Check / Action 1. 4. Using ClearAccess+/LCT, disable and then enable the line. Replace the LI-SHDSL series card. Using the port's Configuration window, Endpoint Maintenance tab (in ClearAccess+/LCT, NE Operation window), check the upstream SNR margin. If it's too high, check that the cables and cable connections are OK, and fix if necessary. Reduce the line rate. 5. Replace the CPE. 6. Contact Customer Support. 2. 3. Result / Indication Perform Problem not solved Problem not solved Problem not solved Go to step 2. Problem not solved Problem not solved Go to step 5. Go to step 3. Go to step 4. Go to step 6. Table 129. xDSL LCD at Far End - ADSL Line Relevant for the following Alarm IDs: 136 Check / Action 1. 3. If the alarm occurs on an LI-ADSL4P card, check that the E1 links between the LI-ADSL4P card and the LI-4E1 card are configured correctly. Using ClearAccess+/LCT, disable and then enable the line. Replace the LI-ADSL series card. 4. Replace the CPE. 5. Check that the cables and cable connections between the RU and the subscriber CPE are OK. 2. Result / Indication Not using an LI4ADSL4P card, or configuration is OK Go to step 2. Problem not solved Problem not solved Problem not solved Not OK Go to step 3. Cables OK P/N 760-000731 Rev A March 2006 Perform Go to step 4. Go to step 5. Fix the cables. If the problem still exists, go to step 6. Go to step 6. Page 163 5. Fault Management Check / Action 6. 7. Result / Indication Problem not Using the ADSL port's solved Configuration window in ClearAccess+/LCT, check if the downstream SNR margin is above 6 dB, and if it is not, try to reduce the downstream rate or change the port's configuration profile to Adaptive at Start-Up. Contact Customer Support. Perform Go to step 7. Table 130. xDSL LCD at Far End - SHDSL Line Relevant for the following Alarm IDs: 194 Check / Action 1. 2. 3. 4. 5. 6. Result / Indication Using ClearAccess+/LCT, disable Problem not and then enable the line. solved Replace the LI-SHDSL series card. Problem not solved Problem not Using the port's Configuration window, Endpoint Maintenance solved tab (in ClearAccess+/LCT, NE Operation window), check the downstream SNR margin. If it's too high, check that the cables and cable connections are OK, and fix if necessary. Reduce the line rate. Problem not solved Replace the CPE. Problem not solved Contact Customer Support. Perform Go to step 2. Go to step 3. Go to step 4. Go to step 5. Go to step 6. 5.17. Line Testing Line testing is an essential task performed by the BroadAccess system. Comprehensive line tests let you identify line faults quickly from a local or remote location and direct technicians to the fault source. Subscriber line tests can be performed on a specified range of lines. Test types include AC, DC, Leakage, Capacitance, Voice Frequency and Noise tests. The complete set of tests takes approximately 20 seconds per line. You can modify the thresholds used to determine pass and fail results for the line tests. For more information, see Setting Line Test Thresholds on page 172. Page 164 March 2006 P/N 760-000731 Rev A BroadAccess Maintenance Guide While the line tests are being performed, the results are logged. Results of current tests can be viewed in the bottom pane of this window and history results can be viewed in the History Test Results window (for more information, see Viewing Line Test History) on page 169. This window displays only the results of the most recently conducted line tests. Previous results of tests conducted on the same lines are overwritten. Note: You can gain access to line testing for a particular line directly from the phone book (Customer Phones window). Locate the port in the Customer Phones window, click the Go to Port button, and select the Line Test option. For more information about the Customer Phones window, see Finding Subscriber Ports. on page 20 To perform line tests and to view line test results: 1. Point to a BroadAccess NE and right-click. The Shortcut Menu is displayed. 2. Select the NE Operation option. The NE Operation window is displayed. 3. From the Menu Bar select the Fault option, then the Tests option and then the Line Tests option. The Line Tests window is displayed. 4. Click the Choose Port button and select a line or the range of lines to be tested in the Choose Line Ports dialog box. For more information, see Selecting a Line or Lines to Perform Tests On on page 169. 5. Select the test types that you want to perform on the lines. 6. If you are testing more than one line, select an option from the Busy Lines box. 7. Click the Test button. (If you are only testing one line, and it is busy, the system will ask you if you want to force the test.) The current test results are displayed in the window. Any results from previously run tests are overwritten. 8. To stop the test while testing across a range of lines click the Stop button. Line Test results are displayed in the bottom pane of the Line Test window. P/N 760-000731 Rev A March 2006 Page 165 5. Fault Management Figure 27. Line Tests Window Table 131. Line Test Window Settings Screen Element Start Test button Stop Test button Test Types box Metallic Tests box AC DC Noise Leakage Capacitance All tests Page 166 Options Description Default Starts testing the lines according to the parameters displayed in this window Stops the line tests currently being performed Tests for a foreign AC voltage Tests for a foreign DC voltage Tests for noise on the lines Tests for Leakage on the Subscriber Line Provides a measurement of the capacitance. This feature allows you to identify free lines. The type of test performed can be individually selected, or all tests (except VF) can be performed by checking the All Test option March 2006 P/N 760-000731 Rev A BroadAccess Maintenance Guide Screen Element Options VF Tests box VF (Voice Frequency) Choose Port button Busy Lines box Line Test Result pane Port P/N 760-000731 Rev A Skip Force Test Description Default Performs VF test. This test is performed by sending a signal of a known frequency. The reflected signal is then monitored to verify the integrity of the voice path Opens a secondary window which lets you select the ports to be tested. For instructions on how to select lines, see Selecting a Line or Lines to Perform Tests On on page 169. Skip - skips tests on lines that are currently being used Force Test - disconnects lines currently being used and performs tests on them Displays the number of the line tested (physical location according to RU number, cage:slot:port). March 2006 Page 167 5. Fault Management Screen Element Result Options line is not properly installed (mismatched) Description Default Displays the result of a line test line is not installed test timeout illegal line ID test equipment is busy test equipment not installed test equipment failed line type not allowed for testing previous test failed pass N/A busy fail at CU fail at RU Test Type AB AGround BGround Time Page 168 Displays the test type. For example, AC, DC, VF etc. Displays values measured between wires A and B Displays values measured between wires A to GND Displays values measured between wires B to GND Displays the date and time that the test was performed March 2006 P/N 760-000731 Rev A BroadAccess Maintenance Guide 5.17.1. Viewing Line Test History In the Line Test History window, you view results of tests which you have performed using the Line Tests window. Note: When LCT is used, only the Line Test results for Line Tests that have been performed during the current LCT session are displayed. To view line test history results: 1. Point to a BroadAccess NE and right-click. The Shortcut Menu is displayed. 2. Select the NE Operation option. The NE Operation window is displayed. 3. From the Menu Bar select the Fault option, then the Tests option, and then the History Results option. The History Test Results window is displayed. 4. Click the Refresh button to update test result information. 5. To print a report, click the Report button. For a description about information displayed in each of the columns of this window, see the table Line Test Window Settings on page 166. 5.17.2. Selecting a Line or Lines to Perform Tests On To select a range of lines or a line to perform line tests on: 1. Click the Choose Port button in the Line Tests window (see Line Testing on page 164 for more information). The Choose Line Ports dialog box is displayed. 2. Click on an RU. A list of slots is displayed. 3. Click on a slot. A list of ports is displayed. 4. Do one of the following: P/N 760-000731 Rev A Select the From -> To option and enter a range of port numbers in the Start Port and End Port boxes, and click the Apply button. Select the Selected option and then select checkboxes corresponding to the ports that you want to test, and click the Apply button. March 2006 Page 169 5. Fault Management Figure 28. Line Tests Window - Choose Line Ports Dialog Box 5.17.3. Performing External Line Tests The external line test feature lets you connect external test equipment to a subscriber line. Note: On a system with distribution blocks: connect line testing equipment to PHYS-TIP and PHYS-RING connectors, as shown on the sticker on the inside of the MDF compartment door. On a system with open cables: locate the white-brown/white pair of wires from the P17 alarm/clock cable; connect these wires to the line testing equipment. The line is automatically disconnected by the system after a period of five minutes. To perform an external line test: Page 170 1. Point to a BroadAccess NE and right-click. The Shortcut Menu is displayed. 2. Select the NE Operation option. The NE Operation window is displayed. March 2006 P/N 760-000731 Rev A BroadAccess Maintenance Guide 3. From the Menu Bar select the Fault option, then the Tests option, and then the External Line Test option. The External Line Tests dialog box is displayed. 4. Click on an RU/CU. A list of slots is displayed. 5. Click on a slot. A list of ports is displayed. 6. Select a port. The circle icon becomes a hand button. 7. Select the Connect option to connect the line to the external test port. 8. Click the OK button. 9. To disconnect the line, select the Disconnect option and click the OK button. 5.17.4. Performing Background Line Tests The purpose of this operation is to run line tests on all the lines independently by the system, without supervision from the ClearAccess+ or BroadAccess LCT application. When a line fails a test, a minor alarm is generated and is displayed in the Current Alarms window. If a line is being used by a subscriber during the test, the line is skipped and will not be tested. To initiate background line testing: 1. Point to a BroadAccess NE and right-click. The Shortcut Menu is displayed. 2. Select the NE Operation option. The NE Operation window is displayed. 3. From the Menu Bar select the Fault option, then the Tests option, and then the Background Line Test option. The Background Line Test dialog box is displayed. 4. Select the test options required. Available selections are VF test and Metallic Tests. 5. Click the OK button. The Background Line Tests are performed. Figure 29. Background Line Tests Dialog Box P/N 760-000731 Rev A March 2006 Page 171 5. Fault Management 5.17.5. Setting Line Test Thresholds The Administrator can define the parameters used to determine a pass or fail result during line testing. Say, for example, the AC voltage parameter is set to 5 Volts. If the voltage measured on a selected line is more than five volts, ClearAccess+/LCT will report that the line failed the AC test. The BroadAccess system has default values for the test thresholds. If you decide to change the settings, you need to click the Set button to override the previously entered settings. You can revert all test thresholds to their default values by clicking the Default button. To change the line test thresholds: 1. Point to a BroadAccess NE and right-click. The Shortcut Menu is displayed. 2. Select the NE Operation option. The NE Configuration window is displayed. 3. From the Menu Bar select the Fault option, then the Tests option, and then the Line Test Thresholds option. The Line Test Thresholds dialog box is displayed. 4. Set the parameters to the required levels. 5. Click the Set button to save your changes. Figure 30. Line Test Thresholds Dialog Box Page 172 March 2006 P/N 760-000731 Rev A BroadAccess Maintenance Guide Table 132. Line Test Thresholds Dialog Box Settings Screen Element AC DC Leakage Capacitance Parameters Noise Set button Default button Refresh button Options Description Default Lines with foreign AC above this value will fail the AC test Lines with foreign DC above this value will fail the DC test Lines with leakage values below this value will fail the Leakage test Three capacitance parameters are used to determine capacitance conditions. See Capacitance Parameters on page 173 for more details. Lines with noise levels above this value will fail the Noise test Sets test thresholds values Resets the test thresholds to their default values Refreshes the information displayed in the window 5.17.5.1. Capacitance Parameters There are two capacitance parameters used to produce the capacitance test results. You set these parameters in the Line Test Thresholds dialog box. When line tests are performed, one of the following Capacitance test results can be provided by the system: • Pass—a telephone set capacitance was detected • Fail—capacitance was out of range • Free—no capacitance was detected at all; no telephone set was detected The results are calculated by using the following rules: P/N 760-000731 Rev A March 2006 Page 173 5. Fault Management Where: AB = Capacitance between wires a and b AGround = Capacitance between wire a and ground BGround = Capacitance between wire b and ground Pass The Capacitance measurement must fall within the following range to produce a Pass result: AB > Parameter 1 in the Line Test Thresholds dialog box, AND (the lower measurement of AB-AGround and AB-BGround) > Parameter 2. Fail The Capacitance measurement must be higher or lower than the range specified for a Pass result. Free No capacitance is detected whatsoever Note: Parameter 3 is not currently used by the system. 5.17.6. Performing an Alarm Simulation The BroadAccess system lets you perform an alarm simulation, in order to check the functionality of the critical and major alarm mechanism. The critical or major alarm mechanism are activated and then listed in the current alarm list and in the Alarm History window, under the System category, and with the Description "Alarm Test". After one minute, the system will automatically clear the alarm activated for this testing purpose. To perform an alarm simulation: Page 174 1. Point to a BroadAccess NE and right-click. The Shortcut Menu is displayed. 2. Select the NE Operation option. The NE Operation window is displayed. 3. From the Menu Bar select the Fault option, then the Tests option, and then the Alarm Simulation option. The Alarm Simulation window is displayed. 4. Select an alarm severity level from the Alarm Severity list. 5. Click the Apply button. The system activates the alarm and closes the window. March 2006 P/N 760-000731 Rev A BroadAccess Maintenance Guide Figure 31. Alarm Simulation Window 5.18. External Alarm Settings You can assign names to the external alarms connected to your system. When these alarms are activated, the names assigned to the external alarms appear in the External Alarm column of the ClearAccess+ or LCT Active Alarms or History Alarms display. This feature can be used to assign names to external alarms connected to modules such as external SDH equipment. To view, add or modify External Alarm settings: 1. Point to a BroadAccess NE and right-click. The Shortcut Menu is displayed. 2. Select the NE Operation option. The NE Operation window is displayed. 3. From the Menu Bar select the Fault option, then the External Alarms Settings option. The External Alarm Settings window appears, displaying the names currently assigned to the external alarms for the corresponding unit. 4. Select a number/name from the Alarm List and click the Modify button. The Enter Name dialog box appears. 5. Enter a name for an external alarm and click the OK button. 6. To save the external alarm description to the alarm list click the Write All button. 7. To edit a name assigned to an external alarm, select the alarm name in the Alarm List, click the Modify button, edit the text and click the Write All button to accept the changes. The new name now appears in the External Alarm Settings window. P/N 760-000731 Rev A March 2006 Page 175 5. Fault Management Figure 32. External Alarm Settings Window Table 133. External Alarm Settings Window Settings Screen Element Alarm List Refresh button Write All button Modify button Status box Page 176 Options Up to 16 characters Description Default Lists the eight external alarms supported by the system. The first three alarms are preset in the system and cannot be modified. These alarms are assigned to: PSBC1\2 (Power Supply Battery Charger), LVLD (Low Voltage Level Detector). When external alarms are generated, these alarm strings are displayed in the ClearAccess+ or LCT alarm display, in the External Alarm column. Refreshes the Alarm List display. Saves changed made to the items in the window Lets you modify the names assigned to each of the external alarms Displays the current status of the selected external alarm March 2006 P/N 760-000731 Rev A BroadAccess Maintenance Guide 5.19. Loopback Tests You can perform loopback tests on various links, network interfaces and services, using ClearAccess+ or LCT. For more information, refer to information regarding configuration of the relevant link, network interface or service in the BroadAccess Configuration Guide. P/N 760-000731 Rev A March 2006 Page 177 BroadAccess Maintenance Guide 6. Performance Management The BroadAccess system supplies Performance Monitoring information for ATM and IP network interfaces, SDH, PDH and HDSL transmission, as well as for ADSL, G.SHDSL and Ethernet service interfaces. The ClearAccess+ operator can access current performance data for each NE, or schedule periodic collection of performance monitoring information to create a database of historical information. The information is collected according to userselected parameters and ports, stored in the system database, and can be exported to various types of files for further processing by external applications. A summary of the Performance Monitoring counters supported by the system is provided in Summary of Performance Monitoring Counters on page 179. In order to optimize traffic patterns, ClearAccess+ provides statistics on the volume of data conveyed, including the total number of calls, the sum of holding times and the sum of unsuccessful calls due to lack of resources. The results of traffic measurements form the basis for planning network extensions and help detect capacity bottlenecks. 6.1. Note: Performance Monitoring database features are not supported by the LCT application. Note: You can right-click an appropriate port in Configuration Tree and choose the Performance Monitoring option to directly access performance information for that port. Summary of Performance Monitoring Counters ClearAccess+ displays detailed Performance Monitoring information according to the parameters listed below. 6.1.1. SDH Performance Monitoring The SDH Performance Monitoring parameters listed below comply with ITU-G.783. For more information about viewing SDH Performance Monitoring statistics, see Viewing SDH Link Performance on page 217. At STM1 level, you can view TDM or ATM-UNI statistics. The information can be viewed for the following time frames: • Day • Quarter hour P/N 760-000731 Rev A March 2006 Page 179 6. Performance Management Table 134. SDH Performance Monitoring Parameter Meaning ES (Error Seconds) Number of seconds in the given time period when at least one error block occurred (displayed in HH:MM:SS format) SES (Severely errored Number of seconds in the seconds) given time period when there were severe bit errors, when BER >10-3 (displayed in HH:MM:SS format) CVs (Coding Number of errors within SDH violations) frame UAS (Unavailable Number of seconds following seconds) 10 consecutive SES SEF (Severely Errored Number of seconds in the Frame Seconds) given time period when there was severe loss of frame PPJC (Positive Pointer Number of times there was a Justification Count) positive pointer justification NPJC (Negative Pointer No. of times there was a Justification Count) negative pointer justification Total Cells Rx Number of received cells Total Cells Tx Number of transmitted cells HEC Errors (Header Number of cells with HEC Error Control) errors OCD Events (Out of Number. of events in which Cell Delineation) cell delineation was given. 6.1.2. Levels Supported STM-4, STM-1 TDM, STM-1 ATM, VC-12 STM-4, STM-1 TDM, STM-1 ATM, VC-12 STM-4, STM-1 TDM, STM-1 ATM, VC-12 STM-4, STM-1 TDM, STM-1 ATM, VC-12 STM-4 STM-1 TDM, STM-1 ATM, VC-12 STM-1 TDM, STM-1 ATM, VC-12 STM-1 ATM STM-1 ATM STM-1 ATM STM-1 ATM PDH Performance Monitoring The PDH Performance Monitoring parameters listed below comply with ITUG.826. For more information about viewing PDH Performance Monitoring statistics, see Viewing PDH Link Performance on page 221. The information can be viewed for the following time frames: • Day • Hour • Quarter hour Table 135. PDH Performance Monitoring Parameter Meaning BEBs (Background Error Blocks) ES (Error Seconds) Page 180 Number of errored blocks Number of seconds in the given time period when at least one error block occurred (displayed in HH:MM:SS format) March 2006 P/N 760-000731 Rev A BroadAccess Maintenance Guide Parameter Meaning SES (Severely errored seconds) EFSs (Error Free Seconds) DMs (Degraded Minutes) UT (Unavailable Time.) 6.1.3. Number of seconds in the given time period when there were severe bit errors, when BER >10-3 (displayed in HH:MM:SS format) Number of seconds that were error free (displayed in HH:MM:SS format) Number. of minutes with a BER > 10-6 Number of seconds following 10 consecutive SES HDSL Performance Monitoring The HDSL parameters listed below comply with ITU-G.826. For more information about viewing HDSL Performance Monitoring statistics, see Viewing HDSL Link Performance on page 224. The HDSL Performance Monitoring information can be viewed for the following time frames: • Day • Hour • Quarter hour Table 136. HDSL Performance Monitoring Parameter Meaning BEBs (Background Error Blocks) ES (Error Seconds) SES (Severely Errored Seconds) EFSs (Error Free Seconds) DMs (Degraded Minutes) UT (Unavailable Time) 6.1.4. Number of errored blocks Number of seconds in the given time period when at least one error block occurred (displayed in HH:MM:SS format) Number. of seconds in the given time period when there were severe bit errors, when BER >10-3 (displayed in HH:MM:SS format) Number of seconds that were error free (displayed in HH:MM:SS format) Number. of minutes with a BER > 10-6 Number of seconds following 10 consecutive SES IP Uplink Performance Monitoring The IP Uplink parameters listed below (ATM Connection, Uplink and Bridge Port) comply with RFC 1757 and RFC 2674. For more information about viewing IP Uplink Performance Monitoring statistics, see Viewing ATM, Uplink and Bridge Port Statistics, and Learned MACs for the IP-UL-x Card on page 203. P/N 760-000731 Rev A March 2006 Page 181 6. Performance Management 6.1.4.1. IP Uplink ATM Connection Performance Monitoring Table 137. IP Uplink ATM Connection Performance Monitoring Parameter Rx Err SLC Rx Err Parity Rx Err Addr Mismatch Rx Cells Rx Last Unknown Addr Rx CLP1 Cells Rx GFC Cells Tx Cells Tx CLP1 Cells Tx EFCI Cells Rx OAM Cells Rx RM Cells Tx OAM Cells Tx RM Cells Rx EFCI Cells Rx CLP0 Cells Tx CLP0 Cells Meaning Number of Soft Logic Control errors received Number of parity errors received Number of Address Mismatch errors received Number of cells received Number of Last Unknown Address messages received Number of Cell Loss Priority 1 cells received Number of Generic Flow Control cells received Number of cells transmitted Number of Cell Loss Priority 1 cells transmitted Number of Explicit Forward Congestion Indication cells transmitted Number of Operation, Administration and Maintenance cells received Number of Resource Management cells received Number of Operation, Administration and Maintenance cells transmitted Number of Resource Management cells transmitted Number of Explicit Forward Congestion Indication cells received Number of Cell Loss Priority 0 cells received Number of Cell Loss Priority 0 cells transmitted 6.1.4.2. IP Uplink Performance Monitoring Table 138. IP Uplink Performance Monitoring Parameter TxRx Frames 64 TxRx Frames 127 TxRx Frames 255 TxRx Frames 511 TxRx Frames 1023 TxRx Frames 1518 TxRx Frames 1522 Rx Bytes Rx Packets Rx Err FCS Rx Multicast Rx Broadcast Rx MAC Control Page 182 Meaning Number of frames that are 64 octects long Number of frames that are 127 octects long Number of frames that are 255 octects long Number of frames that are 511 octects long Number of frames that are 1023 octects long Number of frames that are 1518 octects long Number of frames that are 1522 octects long Number of bytes received Number of packets received, including bad packets, broadcast and multicast packets Number of Frame Check Sequence errors received Number of good packets received that were directed to the multicast address Number of good packets received that were directed to the broadcast address Number of Media Access Control Control packets received March 2006 P/N 760-000731 Rev A BroadAccess Maintenance Guide Parameter Meaning Rx MAC Pause Rx MAC Unknown Number of Media Access Control Pause packets received Number of Media Access Control Unknown packets received Rx Err Alignment Number of alignment errors received Rx Err Length Number of length errors received Rx Err Code Number of code errors received Rx False Carrier Number of false carrier events received Rx Undersize Number of undersize packets received (less than 64 octets long, but otherwise well-formed) Rx Oversize Number of oversize packets received (longer than 1518 octets long, but otherwise well-formed) Rx Fragments Number of packets received that were less than 64 octets in length (excluding framing bits but including FCS octets) and had either a bad Frame Check Sequence (FCS) with an integral number of octets (FCS Error), or a bad FCS with a non-integral number of octets (Alignment Error) Rx Jabber Number of packets received that were longer than 1518 octets (excluding framing bits, but including FCS octets), and had either a bad Frame Check Sequence (FCS) with an integral number of octets (FCS Error) or a bad FCS with a non-integral number of octets (Alignment Error). Rx Dropped Number of times that packets were dropped by the statistics probe on the Rx channel Tx Bytes Number of bytes transmitted Tx Packets Number of packets transmitted, including bad packets, broadcast and multicast packets Tx Multicast Number of good packets transmitted that were directed to the multicast address Tx Broadcast Number of good packets transmitted that were directed to the broadcast address Tx MAC Pause Number of Media Access Control Pause packets transmitted Tx Defer Number of deferred packets transmitted Tx Excess Defer Number of excessive deferred packets transmitted Tx Single Collision Estimated number of single collision packets on this Tx Ethernet segment Tx Multi Collision Estimated number of multi collision packets on this Tx Ethernet segment Tx Late Collision Estimated number of late collision packets on this Tx Ethernet segment Tx Excess Collision Estimated number of excessive collision packets transmitted on this Tx Ethernet segment Tx No Collision Estimated number of no-collision packets transmitted on this Tx Ethernet segment Tx MAC Pause Honored Number of Media Access Control Pause Honored packets transmitted Tx Dropped Number of times that packets were dropped by the statistics probe on the Tx channel P/N 760-000731 Rev A March 2006 Page 183 6. Performance Management Parameter Tx Jabber Tx Err FCS Tx Control Tx Undersize Tx Oversize Tx Fragments Rx Host Frames Rx IW Frames Rx Err Host Full Rx Err FBP Underrun Rx Err Nonvalid MAC Rx Err MRU Rx Err SDU Rx Err Underrun Rx Err Overrun Tx Frames Meaning Number of packets transmitted that were longer than 1518 octets (excluding framing bits, but including FCS octets), and had either a bad Frame Check Sequence (FCS) with an integral number of octets (FCS Error) or a bad FCS with a non-integral number of octets (Alignment Error). Number of Frame Check Sequence errors transmitted Number of control packets transmitted Number of undersize packets transmitted (less than 64 octets long, but otherwise well-formed) Number of oversize packets transmitted (longer than 1518 octets long, but otherwise well-formed) Number of packets transmitted that were less than 64 octets in length (excluding framing bits but including FCS octets) and had either a bad Frame Check Sequence (FCS) with an integral number of octets (FCS Error), or a bad FCS with a non-integral number of octets (Alignment Error) Number of host frames received Number of Inter-Working frames received Number of host full errors received Number of FBP underrun errors received Number of non-valid Media Access Control errors received Number of Maximum Receive Unit errors received Number of Service Data Unit errors received Number of underrun errors received Number of overrun errors received Number of frames transmitted 6.1.4.3. IP Uplink Bridge Port Performance Monitoring Table 139. IP Uplink Bridge Port Performance Monitoring Parameter In Octets In Ucast Pkts In NUcast Pkts In Discards In Errs In Unknown Protos In Multicast Pkts In Broadcast Pkts Out Octets Out Ucast Pkts Out NUcast Pkts Out Discards Out Errors Page 184 Meaning Number of incoming octets Number of incoming Unicast packets Number of incoming Non-Unicast packets Number of incoming packets without errors that were discarded Number of incoming errors Number of incoming unknown protocols Number of incoming multicast packets Number of incoming broadcast packets Number of outgoing octets Number of outgoing Unicast packets Number of outgoing Non-Unicast packets Number of outgoing packets without errors that were discarded Number of outgoing errors March 2006 P/N 760-000731 Rev A BroadAccess Maintenance Guide Parameter Out Multicast Pkts Out Broadcast Pkts 6.1.5. Meaning Number of outgoing multicast packets Number of outgoing broadcast packets ATM Connection Performance Monitoring The ATM Performance Monitoring parameters below comply with ITU-751. For more information about viewing ATM Performance Monitoring statistics, see Viewing ATM Performance on page 209. The ATM Performance Monitoring information can be viewed for the following time frames: • Day • Quarter hour Table 140. ATM Connection Performance Monitoring Parameter Levels Supported Total Cells Rx Total Cells Tx Policing CLP0 Cells Discard Number of received cells Number of transmitted cells Number of cells marked as CLP0 (Cell Loss Priority 0) and dropped as a result of policing Policing CLP0 & CLP1 Number of cells marked as CLP0 or CLP1 Cells Discard (Cell Loss Priority 1) and dropped as a result of policing Policing CLP0 Cells Number of CLP0 cells modified to CLP1 Tagged as a result of policing Buffer Management Number of cells dropped as a result of Cells Discard buffer overflow 6.1.6. System Component ATU-C ATU-C ATU-R ATU-R ATU-R ATU-R ATM UNI Performance Monitoring The ATM Performance Monitoring parameters below comply with ITU-783. For more information about viewing ATM UNI Performance Monitoring statistics, see Viewing ATM Performance on page 209. The ATM Performance Monitoring information can be viewed for the following time frames: • Day • Quarter hour P/N 760-000731 Rev A March 2006 Page 185 6. Performance Management Table 141. ATM-UNI Performance Monitoring Parameter Meaning ES (Error Seconds) Number of seconds in the given time period when at least one error block occurred (displayed in HH:MM:SS format) SES (Severely errored seconds) Number of seconds in the given time period when there were severe bit errors, when BER >10-3 (displayed in HH:MM:SS format) CVs (Coding violations) Number of errors within SDH frame UAS (Unavailable seconds) Number of seconds following 10 consecutive SES SEF (Severely Errored Frame Number of seconds in the given time period when Seconds) there was severe loss of frame PPJC (Positive Pointer Justification Number of times there was a positive pointer Count) justification NPJC (Negative Pointer Justification Number of times there was a negative pointer Count) justification Total Cells Rx Number of received cells Total Cells Tx Number of transmitted cells HEC Errors (Header Error Control) Number of cells with HEC errors OCD Events (Out of Cell Number of events in which cell delineation was Delineation) given. 6.1.7. ADSL Performance Monitoring The ADSL Performance Monitoring parameters listed below comply with IETF-RFC-2662. For more information about viewing ADSL Performance Monitoring statistics, see Viewing ADSL Performance on page 192. The information can be displayed for the following time frames: • Day • Quarter hour Table 142. ADSL Performance Monitoring Parameter LOF (Loss of Frame) LOS (Loss of signal) ES (Error seconds) Page 186 Meaning Number of seconds/events in which loss of frame occurred Number of seconds/events in which loss of signal occurred Number of seconds in the given time period when at least one error block occurred (displayed in HH:MM:SS format) March 2006 Levels Supported System Components Physical layer ATU-C, ATU-R Physical layer ATU-C, ATU-R Physical layer ATU-C, ATU-R P/N 760-000731 Rev A BroadAccess Maintenance Guide Parameter SES (Severely errored seconds) UAS (Unavailable seconds) LPR (Loss of Power) Inits Received Cells Transmitted Cells HEC Errors (Header Error Control) OCD Events (Out of Cell Delineation) Received Blocks Transmitted Blocks Corrected Blocks Uncorrected Blocks Valid 6.1.8. Meaning Number of seconds in the given time period when there were severe bit errors, when BER >10-3 (displayed in HH:MM:SS format) Number of seconds following 10 consecutive SES Number of seconds/events in which loss of power occurred Count of line attempts since reset Number of cells which arrived at the destination point Number of cells that left the departure point Number of cells with HEC errors Number of events in which cell delineation was given. Number of blocks transmitted from ATU-R to ATU-C Levels Supported System Components Physical layer ATU-C, ATU-R Physical layer ATU-C, ATU-R Physical layer ATU-C, ATU-R Physical layer ATU-C TC layer ATU-C, ATU-R TC layer ATU-C, ATU-R TC layer ATU-C TC layer ATU-C Physical layer, Fast Channel, Interleave Channel Number of blocks Physical layer, transmitted from ATU-C to Fast Channel, ATU-R Interleave Channel Number of blocks received Physical layer, with errors that were Fast Channel, corrected Interleave Channel Number of blocks received Physical layer, with errors that were not Fast Channel, corrected Interleave Channel Absence of errors in the entire interval ATU-C ATU-C ATU-C, ATU-R ATU-C, ATU-R - G.SHDSL Performance Monitoring The G.SHDSL Performance Monitoring parameters listed below comply with ITU-991.2. For more information about viewing G.SHDSL Performance Monitoring statistics, see Viewing G.SHDSL Performance on page 200. The information can be displayed for the following time frames: P/N 760-000731 Rev A March 2006 Page 187 6. Performance Management • Day • Quarter hour Table 143. G.SHDSL Performance Monitoring Parameter Meaning Levels Supported ES (Error seconds) Number of seconds in the given time period when at least one CRC anomaly occurred (displayed in HH:MM:SS format) SES (Severely errored Number of seconds in seconds) which at least 50 CRC anomalies or one or more LOSW defects are declared. CRC (Cyclical Occurrence of a Cyclical Redundancy Check) Redundancy Check anomaly LOSW (Loss of Sync Occurrence of a Loss of Word Failure) Sync Defect (when at least three consecutive received frames contain one or more errors in the framing bits) UAS (Unavailable Number of seconds seconds) following 10 consecutive SES HVC (Header error Number of cells with HEC control Violation errors Count) Rx cells Number of received cells Tx cells Number of transmitted cells OCD Events (Out of Number of events in which Cell Delineation) cell delineation was given. 6.1.9. System Components Physical layer STU-C Physical layer STU-C Physical layer STU-C Physical layer STU-C Physical layer STU-C ATM TC layer STU-C ATM TC layer STU-C ATM TC layer STU-C ATM TC layer STU-C Ethernet Service Performance Monitoring The Ethernet Service Performance Monitoring parameters listed below comply with RFC 1757 (RMON). For more information about viewing Ethernet Service Performance Monitoring statistics, see Viewing Ethernet Service Performance Monitoring on page 230. Table 144. Ethernet Service Performance Monitoring Parameter Total Bytes Total Frames Good Frames Bad Frames Page 188 Type Received Received Received Received March 2006 Meaning Total number of bytes received Total number of frames received Total number of valid frames received Total number of frames received of invalid size P/N 760-000731 Rev A BroadAccess Maintenance Guide Parameter Frames dropped for congestion Frames dropped for CRC errors Total Bytes Total Frames Frame Transmission Errors 6.2. Type Received Received Transmitted Transmitted Transmitted Meaning Total number of valid received frames dropped due to congestion Total number of received frames dropped due to CRC errors Total number of bytes transmitted Total number of frames transmitted Total number of frame transmission failures due to collision or internal problems Setting Up a Database of Performance Monitoring Statistics ClearAccess+ allows you to set up a database for storage of performance monitoring statistics collected by the system. This feature is useful if you want to collect statistics over an extended period, because the amount of time that statistics are stored in the BroadAccess system is limited, and old statistics are continually being overwritten by newer ones. In order to save statistics for a certain port or interface, you have to enable polling, or collection of statistics, for that port or interface in the PM database. Collection of statistics for a particular port or interface is done for each time frame (e.g. quarter hour intervals, daily intervals) or for subsets of certain technologies (for example, for SDH VC levels, statistics can be collected for STM4, STM1 or VC12). Therefore, when configuring statistic collection, you must ensure that you open the corresponding table and tab for which you want to collect statistics, and then enable statistic collection from that window. If you have configured the system to save statistics for a particular port or interface, you will be able to view them in the corresponding performance monitoring window by choosing the Data Source Oracle DB option. Note: LCT does not support this feature. Only the most recent performance monitoring statistics saved in the Network Element can be viewed. To configure the database to save PM statistics for ports or interfaces: 1. Open the performance statistics window for the port or interface for which you want to save statistics. 2. Click on the tab corresponding to the time frame or technology type for which you want to save statistics. 3. Click the Collection button. The PM Collection Settings dialog box is displayed. 4. Click the Append/Edit Current button. P/N 760-000731 Rev A March 2006 Page 189 6. Performance Management 5. Adjust the start and end times by clicking in the Start Time and End Time cells in the row you are editing. 6. Click the Apply button. To cancel PM statistics collection for ports or interfaces: 1. Open the performance statistics window for the port or interface for which you want to save statistics. 2. Click on the tab corresponding to the time frame or technology type for which you want to save statistics. 3. Click the Collection button. The PM Collection Settings dialog box is displayed. 4. Do one of the following: 5. To delete one row, select the row and click the Delete button To delete all the rows, click the Delete All button Click the Apply button. Figure 33. PM Collection Settings Dialog Box Table 145. PM Archive Settings Dialog Box Settings Screen Element All Active Pollings table Page 190 Options Description Default Displays a list of the ports or interfaces (according to port location) for which statistics are being collected in the database March 2006 P/N 760-000731 Rev A BroadAccess Maintenance Guide Screen Element Append/Edit Current button Delete button Apply button Cancel button Delete All button PM Group Location Start Time End Time Actual Start Time Actual End Time Current Port/Interface 6.3. Options Description Default Includes the port or interface you are currently working with in the data collection process, and lets you modify the start and end time for data collection Deletes the row selected in the table and stops collection of statistics for the corresponding port or interface Applies the changes you made in this dialog box Cancels the changes you made in this dialog box Deletes all the rows in the table and stops collection of statistics for the corresponding ports or interfaces Displays the name of the ports or interfaces for which PM statistics are already being collected Displays the location of the ports or interfaces for which PM statistics are already being collected Lets you set the time that the system should start statistics collection for the corresponding PM group Lets you set the time that the system should stop statistics collection for the corresponding PM group Displays the time that the system actually started collecting statistics for the corresponding PM group Displays the time that the system actually stopped collecting statistics for the corresponding PM group Displays the location of the port or interface for which you can enable or disable collection of statistics Viewing Performance Monitoring Statistics You can view Performance Monitoring statistics for the following: P/N 760-000731 Rev A March 2006 Page 191 6. Performance Management 6.3.1. • ADSL • G.SHDSL • IP Uplink • ATM • SDH links • PDH links • PCM E1 links • HDSL links • Ethernet service Viewing ADSL Performance You can view performance monitoring statistics for each of the LI-ADSL8/ LI-ADSL16 series card ports in the BroadAccess system for the following items: • Physical • Fast Channel • Interleave Channel • TC Layer For each item, you can view the statistics that have been collected for the following time intervals: • Current 15 minutes—statistics collected so far during the current 15 minute interval • Current day—statistics collected so far today • Interval—statistics collected during previous 15 minute intervals. Statistics are displayed for the last 32 intervals, which provides statistics in total for the last 8 hours. • Previous day—statistics collected during the previous day • Total—a total of the statistics collected since the card was initialized The ADSL Performance window is accessed using the Performance button in the ADSL Configuration window. 6.3.1.1. Physical You can view ADSL physical performance statistics for each port, using the ADSL Performance window, Physical tab. To view physical performance statistics: Page 192 1. Point to a BroadAccess NE and right-click. The Shortcut Menu is displayed. 2. Select NE Operation. The NE Operation window is displayed. March 2006 P/N 760-000731 Rev A BroadAccess Maintenance Guide 3. In the configuration tree, expand the corresponding RU unit's child nodes. A list of cages is displayed. 4. Expand the corresponding cage's child nodes. A list of the cards that are installed in that cage are displayed. 5. Expand the corresponding ADSL card's child nodes. A list of ports is displayed. 6. Double-click on the port you require. The ADSL Configuration window is displayed. 7. Click the Performance icon. The ADSL Performance window is displayed. 8. Click the Physical tab. 9. Toggle between the various time intervals for which you want to view statistics by clicking the corresponding buttons on the Physical tab. Figure 34. ADSL Performance Dialog Box, Physical Tab, Interval Tab Table 146. ADSL Performance Window, Physical Tab Settings Screen Element Options Refresh button Data-Source NetworkElement Oracle DB P/N 760-000731 Rev A Description Refreshes the data displayed on this tab Lets you view statistics live from the BroadAccess system (Network Element), or from the Oracle database March 2006 Default Network Element Page 193 6. Performance Management Screen Element Options Collection button Default Opens the PM Archive Settings dialog box, where you can enable archiving of the statistics collected for this port in the Oracle database. For more information, see Setting Up a Database of Performance Monitoring Statistics on page 189. Displays the next set of rows of statistics saved in the database Displays the on-board date currently configured in the NE Displays the amount of time that has passed so far during this interval (appears on Current 15 Minute or Current Day tabs only) Displays the total amount of time when statistics were actually collected (appears only on the Previous Day tab) ADSL transceiver unit located at the subscriber's premises (CPE) ADSL transceiver unit located on the ADSL card Lets you print a report of the statistics displayed in the window. You can also do a print preview, set up page parameters and use the Report Designer feature to format the report before printing. Lets you export the statistics to a file. The following file formats are available: TXT, XML, HTML and Excel. Displays the date and the time at which the system finished collecting statistics for the corresponding interval (appears on Current 15 Minutes and Interval tabs only) More Rows button System Date Elapsed Time Monitor Time ATU-R ATU-C Report button Export button End Time Page 194 Description March 2006 P/N 760-000731 Rev A BroadAccess Maintenance Guide Screen Element Options LOFs LOSs LPRs ES SES UAS Inits Valid Note: Yes No Description Default Displays the number seconds when Loss of Frame errors occurred Displays the number of seconds when Loss of Signal errors occurred Displays the number of seconds when Loss of Power errors occurred Displays the number of seconds in the time period when at least one error block occurred Displays the number seconds in the time period when there were severe bit errors Displays the number of Unavailable Seconds that occurred (the number of seconds following 10 consecutive SES) Displays the number of line initialization attempts since reset Indicates whether or not the statistics collected for the corresponding interval are reliable: Yes - reliable; No - Invalid For more information about the time intervals for which statistics are collected, see Viewing ADSL Performance Statistics on page 192. 6.3.1.2. Fast and Interleave Channels You can view ADSL Fast Channel and Interleave Channel performance statistics for each port, using the ADSL Performance window, Channel Fast or Channel Interleave tabs. The statistics are collected according to the line latency type configured for the line (Fast or Interleaved), and displayed in the corresponding tab of the ADSL Performance window. On the tab that is not in use, zero is displayed in all the fields. To view Fast Channel or Interleave Channel performance statistics: 1. Point to a BroadAccess NE and right-click. The Shortcut Menu is displayed. 2. Select NE Operation. The NE Operation window is displayed. 3. In the configuration tree, expand the corresponding RU unit's child nodes. A list of cages is displayed. P/N 760-000731 Rev A March 2006 Page 195 6. Performance Management 4. Expand the corresponding cage's child nodes. A list of the cards that are installed in that cage are displayed. 5. Expand the corresponding ADSL card's child nodes. A list of ports is displayed. 6. Double-click on the port you require. The ADSL Configuration window is displayed. 7. Click the Performance icon. The ADSL Performance window is displayed. 8. Click either the Channel Fast or Channel Interleave tab, as required. 9. Toggle between the time intervals for which you want to view statistics by clicking the corresponding buttons on the Channel Fast or Channel Interleave tab. Figure 35. ADSL Performance Dialog Box, Channel Fast Tab, Interval Tab Table 147. ADSL Performance Window, Channel Fast Tab and Channel Interleave Tab Settings Screen Element Options Refresh button Data Source NetworkElement Oracle DB Page 196 March 2006 Description Refreshes the data displayed on this tab Lets you view statistics live from the BroadAccess system (Network Element), or from the Oracle database Default Network Element P/N 760-000731 Rev A BroadAccess Maintenance Guide Screen Element Collection button More Rows button System Date and Time Elapsed Time Monitor Time ATU-R ATU-C Report button Export button End Time P/N 760-000731 Rev A Options Description Default Opens the PM Archive Settings dialog box, where you can enable archiving of the statistics collected for this port in the Oracle database. For more information, see Setting Up a Database of Performance Monitoring Statistics on page 189. Displays the next set of rows of statistics saved in the database Displays the on-board date and time currently configured in the NE Displays the amount of time that has passed so far during this interval (appears on Current 15 Minute or Current Day tabs only) Displays the total amount of time when statistics were actually collected (appears only on the Previous Day tab) ADSL transceiver unit located at the subscriber's premises (CPE) ADSL transceiver unit located on the ADSL card Lets you print a report of the statistics displayed in the window. You can also do a print preview, set up page parameters and use the Report Designer feature to format the report before printing. Lets you export the statistics to a file. The following file formats are available: TXT, XML, HTML and Excel. Displays the date and the time at which the system finished collecting statistics for the corresponding interval (appears on Current 15 Minutes and Interval tabs only) March 2006 Page 197 6. Performance Management Screen Element Options Received Blocks Corrected Blocks Uncorrected Blocks Note: Default Displays the number of blocks received by the ATU-C from the ATU-R Displays the number of blocks transmitted by the ATU-C to the ATU-R Displays the number of blocks received with errors which were corrected Displays the number of blocks received which were not corrected Indicates whether or not the statistics collected for the corresponding interval are reliable: Yes - reliable; No - Invalid Transmitted Blocks Valid Description Yes No For more information about the time intervals for which statistics are collected, see Viewing ADSL Performance Statistics on page 192. 6.3.1.3. TC Layer You can view ADSL TC Layer performance statistics for each port, using the ADSL Performance window, TC Layer tab. To view physical performance statistics: Page 198 1. Point to a BroadAccess NE and right-click. The Shortcut Menu is displayed. 2. Select NE Operation. The NE Operation window is displayed. 3. In the configuration tree, expand the corresponding RU unit's child nodes. A list of cages is displayed. 4. Expand the corresponding cage's child nodes. A list of the cards that are installed in that cage are displayed. 5. Expand the corresponding ADSL card's child nodes. A list of ports is displayed. 6. Double-click on the port you require. The ADSL Configuration window is displayed. 7. Click the Performance icon. The ADSL Performance window is displayed. 8. Click the TC Layer tab. 9. Toggle between the time intervals for which you want to view statistics by clicking the corresponding buttons on the TC Layer tab. March 2006 P/N 760-000731 Rev A BroadAccess Maintenance Guide Figure 36. ADSL Performance Dialog Box, TC Layer Tab, Interval Tab Table 148. ADSL Performance Window, TC Layer Tab Settings Screen Element Options Refresh button Data-Source NetworkElement Oracle DB Collection button More Rows button System Date and Time Elapsed Time P/N 760-000731 Rev A Description Refreshes the data displayed on this tab Lets you view statistics live from the BroadAccess system (Network Element), or from the Oracle database Opens the PM Archive Settings dialog box, where you can enable archiving of the statistics collected for this link in the Oracle database. For more information, see Setting Up a Database of Performance Monitoring Statistics on page 189. Displays the next set of rows of statistics saved in the database Displays the on-board date and time currently configured in the NE Displays the amount of time that has passed so far during this interval (appears on Current 15 Minute or Current Day tabs only) March 2006 Default Network Element Page 199 6. Performance Management Screen Element Options Monitor Time Fast Report button Export button Start Time Received Cells Transmitted Cells OCD Events HEC Errors 6.3.2. Default Displays the total amount of time when statistics were actually collected (appears only on the Previous Day tab) Displays Interleave channel statistics for the port Displays Fast channel statistics for the port Lets you print a report of the statistics displayed in the window. You can also do a print preview, set up page parameters and use the Report Designer feature to format the report before printing. Lets you export the statistics to a file. The following file formats are available: TXT, XML, HTML and Excel. Displays the date and the time at which the system started collecting statistics for the corresponding interval (appears on 15 Minutes and Interval tabs only) Displays the number of cells received from the network Displays the number of cells transmitted towards the network Displays the number of Out of Cell Delineation Events detected during the interval Displays the number of Header Error Control errors detected during the interval Interleave Note: Description For more information about the time intervals for which statistics are collected, see Viewing ADSL Performance Statistics on page 192. Viewing G.SHDSL Performance You can view performance monitoring statistics for LI-SHDSL series card ports for the XTU-C physical layer for 15 minute intervals and 24 hour intervals. A total count of performance monitoring statistics for each port can also be viewed. Page 200 March 2006 P/N 760-000731 Rev A BroadAccess Maintenance Guide For each item, you can view the statistics that have been collected for the following time intervals: • Hour Quarters—statistics collected so far during the current 15 minute interval • Days—statistics collected so far today • Total—a total of the statistics collected since the card was initialized To view performance monitoring statistics for LI-SHDSL series cards ports: 1. Point to a BroadAccess NE and right-click. The Shortcut Menu is displayed. 2. Select NE Operation. The NE Operation window is displayed. 3. In the configuration tree, expand the corresponding RU unit's child nodes. A list of cages is displayed. 4. Expand the corresponding cage's child nodes. A list of the cards that are installed in that cage are displayed. 5. Expand the corresponding LI-SHDSL card's child nodes. A list of ports is displayed. 6. Double-click on the port you require. The SHDSL Configuration window is displayed. 7. Click the Performance icon. The SHDSL Performance window is displayed. 8. Toggle between the various time intervals for which you want to view statistics by clicking the corresponding tabs on the Physical tab. P/N 760-000731 Rev A March 2006 Page 201 6. Performance Management Figure 37. SHDSL Performance Monitoring Window Table 149. SHDSL Performance Window Settings Screen Element Option Refresh button Default Refreshes the data displayed in this window Displays a glossary of performance monitoring acronyms and terms Displays the amount of time that has passed so far during this interval (relevant for Quarter Hours and Days tabs) Displays the on-board date and time currently configured in the NE Displays the date that the statistics were collected Displays the time at which the system finished collecting statistics for the corresponding interval Abbreviations button Elapsed Time System Time Date End Time Page 202 Description March 2006 P/N 760-000731 Rev A BroadAccess Maintenance Guide Screen Element Option ES CRC Anomalies UAS LOSWS Inits 6.3.3. Default Displays the number of seconds in the time period when at least one error block occurred Displays the number seconds in the time period when there were severe bit errors Displays the number of times a Cyclical Redundancy Check anomaly occurred Displays the number of Unavailable Seconds that occurred (the number of seconds following 10 consecutive SES) Displays the number of seconds when a Loss of Sync Defect (when at least three consecutive received frames contain one or more errors in the framing bits) occurred Displays the number of line initialization attempts since reset Indicates whether or not the statistics collected for the corresponding interval are reliable: Yes - reliable; No - Invalid SES Valid Description Yes No Viewing ATM, Uplink and Bridge Port Statistics, and Learned MACs for the IP-UL-x Card You can view ATM, uplink and bridge port statistics, and learned MACs, using the IP Uplink window. To access the IP Uplink window: 1. Point to a BroadAccess NE and right-click. The Shortcut Menu is displayed. 2. Select the NE Operation option. The NE Operation window is displayed. 3. In the configuration tree, right-click the IP-UL-x card and select the Launch Card Manager option. A login dialog box is displayed. 4. Type the following password (case sensitive): Teledata. Click the OK button. The window that is displayed displays configuration information in the upper part, and active alarms for the card in the lower part. P/N 760-000731 Rev A March 2006 Page 203 6. Performance Management To view ATM statistics from the IP uplink: 1. Open the IP Uplink window, as explained in "To access the IP Uplink window", above. 2. On the IP Uplink window's menu bar, select the Statistics option, and then the ATM option. To view Uplink statistics from the IP uplink: 1. Open the IP Uplink window, as explained in "To access the IP Uplink window", above. 2. On the IP Uplink window's menu bar, select the Statistics option, and then the Uplink option. To view ATM or Ethernet bridge port statistics: 1. Open the IP Uplink window, as explained in "To access the IP Uplink window", above. 2. In the ATM VCL Bridge Port table, or Ethernet Bridge Port table, right click on the row corresponding to the required Bridge Port, and select the Port Statistics option. To view Learned MACs for a bridge port: Page 204 1. Open the IP Uplink window, as explained in "To access the IP Uplink window", above. 2. In the ATM VCL Bridge Port table, or Ethernet Bridge Port table, right click on the row corresponding to the required Bridge Port, and select the Learned MACs option. March 2006 P/N 760-000731 Rev A BroadAccess Maintenance Guide Figure 38. IP Uplink Window - ATM Statistics Table 150. IP Uplink Window - ATM Statistics Screen Element Counter Value Start button Stop button Reset button P/N 760-000731 Rev A Options Description Default Displays the counters for See Summary of which ATM statistics are Performance collected Monitoring Counters on page 179, IP Uplink ATM Connection Performance Monitoring for a list of the counters Displays the statistics collected for each of the counters Starts counting ATM statistics Stops counting ATM statistics. You may want to stop counting while the window is open, to conserve system resources. Resets the counters in this window March 2006 Page 205 6. Performance Management Screen Element Options Close button Description Default Closes the window Figure 39. IP Uplink Window - Uplink Statistics Table 151. IP Uplink Window - Uplink Statistics Screen Element Counter Value Start button Page 206 Options Description Default See Summary of Displays the counters for which Ethernet statistics are Performance collected Monitoring Counters on page 179, IP Uplink Performance Monitoring for a list of the counters Displays the statistics collected for each of the counters Starts counting Ethernet statistics March 2006 P/N 760-000731 Rev A BroadAccess Maintenance Guide Screen Element Stop button Reset button Close button Options Description Default Stops counting Ethernet statistics. You may want to stop counting while the window is open, to conserve system resources Resets the counters in this window Closes the window Figure 40. IP Uplink Window - Bridge Port Statistics Index P/N 760-000731 Rev A March 2006 Page 207 6. Performance Management Table 152. IP Uplink Window - Bridge Port Statistics Index Screen Element Counter Value Start button Stop button Reset button Close button Options Description See Summary of Performance Monitoring Counters on page 179, IP Uplink Bridge Port Performance Monitoring for a list of the counters Displays the counters for which statistics are collected for the Index 1536 bridge port. This is the Fast Ethernet bridge port. Default Displays the statistics collected for each of the counters Starts the counting Bridge Port Statistics Stops counting Bridge Port statistics. You may want to stop counting while the window is open, to conserve system resources. Resets the counters in this window Closes the window Figure 41. IP Uplink Window - MACs Learned Page 208 March 2006 P/N 760-000731 Rev A BroadAccess Maintenance Guide Table 153. IP Uplink Window - MACs Learned Screen Element Options VLAN MAC Index Start button Stop button Close button 6.3.4. Description Default Displays the VLAN (Virtual Local Area Network) number Displays the MAC (Mediaspecific Access Control) address corresponding to the VLAN Displays the Index number of the Bridge Port corresponding to the learned MAC Starts learning MACs Stops learning MACs. You may want to stop learning MACs while the window is open, to conserve system resources. Closes the window Viewing ATM Performance The system provides ATM performance monitoring statistics for the following: • Performance of individual ATM cross-connections—the performance statistics for ATM cross-connections allow you to monitor the operation of specific cross-connections in the system. For more information about viewing these statistics, see Viewing ATM Cross-Connect Performance on page 210. • ATM performance at xDSL port level—performance statistics are measured on the xDSL ports connected to the subscribers. For more information, see Viewing ADSL Performance on page 192, or Viewing G.SHDSL Performance on page 200. • ATM performance at STM1 level, per CU/RU unit—performance statistics are measured on the STM4 cards in each of the units on the SDH ring. This provides a diagnostic tool for detecting problems in a particular segment of the SDH ring. For more information about viewing these statistics, see Viewing SDH Link Performance on page 217. • ATM performance on the link between the ATM card and the ATM network—performance statistics are collected from the ATM uplink, which provide a diagnostic tool for detecting problems on the uplink between the system and the network. For more information, see Viewing STM1-ATM Performance on the ATM Uplink to the Network on page 214. P/N 760-000731 Rev A March 2006 Page 209 6. Performance Management 6.3.4.1. Viewing ATM Cross-Connect Performance You can view performance monitoring statistics for ATM individual crossconnections using the ATM Cross-Connect Performance Monitoring window. Statistics are collected for the following time frames: • Current Quarter—statistics collected so far in the current 15 minute interval • Current Day—statistics collected so far today • Interval Quarter—statistics collected for previous 15 minute intervals. Statistics are displayed for the last two intervals. • Interval Day—statistics collected for previous day (24 hour interval) The statistics that are collected provide you with information about the number of cells received and transmitted at the Network End and the User End, and traffic policing, for a specific cross-connection. To view ATM Cross-Connect performance monitoring statistics: Page 210 1. Point to a BroadAccess NE and right-click. The Shortcut Menu is displayed. 2. Select the NE Operation option. The NE Operation window is displayed. 3. Click the Broadband Cross-Connect button. The Broadband Cross-Connect window is displayed. 4. Select a cross-connection (a row) in the table. 5. Click the Performance button. The ATM Cross-Connect Performance Monitoring window is displayed, displaying statistics for the current 15 minute interval (Current Quarter). 6. To view statistics for different time frames, click the Current Day, Interval Quarter or Interval Day buttons. March 2006 P/N 760-000731 Rev A BroadAccess Maintenance Guide Figure 42. ATM Cross-Connect Performance Monitoring Window Table 154. ATM Cross-Connect Performance Monitoring Window Settings Screen Element Options Refresh button Report button Export button Data Source box Network Element Oracle DB More Rows button P/N 760-000731 Rev A Description Refreshes the data displayed in the window Lets you print a report of the statistics displayed in the window. You can also do a print preview, set up page parameters and use the Report Designer feature to format the report before printing. Lets you export the statistics to a file. The following file formats are available: TXT, XML, HTML and Excel. Lets you view statistics live from the BroadAccess system (Network Element option) or statistics saved in the Oracle database (Oracle DB) Displays the next set of rows of statistics saved in the database March 2006 Default Network Element Page 211 6. Performance Management Screen Element Options Collection button Default Displays the PM Archive Settings dialog box, where you can enable archiving of the statistics collected for cross-connections in the Oracle database. For more information, see Setting Up a Database of Performance Monitoring Statistics on page 189. Displays statistics collected so far during the current 15 minute interval Displays statistics collected so far today Displays statistics collected for previous 15 minute intervals Displays statistics collected for previous days Displays the current date and time at the BroadAccess system Displays the amount of time that has elapsed during the current 15 minute or 24 hour interval, at both Network and User End sides (visible only for Current Quarter and Current Day statistics). Displays the VPI number for the cross-connection at the network side. Displays the VCI number for the cross-connection at the network side Displays the location of the RU port to which the crossconnection is assigned. Displays the VPI number for the cross-connection at the user side Displays the VCI number for the cross-connection at the user side Displays the time at which the system stopped collecting statistics for the interval (visible only for Interval Quarter and Interval Day statistics) Current Quarter button Current Day button Interval Quarter button Interval Day button System Date Network Elapsed Time; User Elapsed Time Network VPI Network VCI Port User VPI User VCI End Time Page 212 Description March 2006 P/N 760-000731 Rev A BroadAccess Maintenance Guide Screen Element Options Network End Total Cells Rx Total Cells Tx Valid Yes No User End Total Cells Rx Total Cells Tx Policing CLP0 Cells Discard Policing CLP0+CLP1 Cells Discard Policing CLP0 Cells Tagged Buffer Management Cells Discard Valid P/N 760-000731 Rev A Yes No Description Default Displays the total number of cells that have been received at the network end for the given time frame Displays the total number of cells that have been transmitted by the network end for the given time frame Indicates whether or not the statistics collected for the corresponding interval are reliable: Yes - reliable; No - Invalid (visible only for Interval Quarter and Interval Day statistics) Displays the total number of cells received at the user end Displays the total number of cells transmitted by the user end Displays the number of CLP0 (Cell Loss Priority 0) cells that were discarded due to policing Displays the number of CLP0 (Cell Loss Priority 0) and CLP1 (Cell Loss Priority 1) cells that were discarded due to policing Displays the number of CLP0 cells that were modified to CLP1 due to policing Displays the number of cells that were discarded when the buffer threshold was exceeded Indicates whether or not the statistics collected for the corresponding interval are reliable: Yes - reliable; No - Invalid (visible only for Interval Quarter and Interval Day statistics) March 2006 Page 213 6. Performance Management 6.3.4.2. Viewing STM1-ATM Performance in the SDH Ring ATM performance statistics at STM-1 level are measured on the STM4 cards in each of the units on the SDH ring. This provides a diagnostic tool for detecting problems in a particular segment of the SDH ring. For more information about viewing these statistics, see Viewing SDH Link Performance on page 217. 6.3.4.3. Viewing STM1-ATM Performance on the ATM Uplink to the Network ATM performance statistics on the link between the ATM card and the ATM network are collected from the ATM uplink, which provide a diagnostic tool for detecting problems on the uplink between the system and the network. You can view the statistics that have been collected for the following time intervals: • Hour Quarters—statistics collected so far during the current 15 minute interval • Days—statistics collected so far today To view STM1-ATM uplink performance statistics: Page 214 1. Point to a BroadAccess NE and right-click. The Shortcut Menu is displayed. 2. Select the NE Operation option. The NE Operation window is displayed. 3. In the configuration tree, expand the corresponding unit's child nodes to locate the ATM uplink card (CU for ATM-UNI series or SSU\RU for ATM-UL series cards). A list of cages is displayed. 4. Expand the corresponding cage's child nodes. A list of the cards that are installed in that cage is displayed. 5. Expand the ATM uplink card's child nodes. A port node is displayed. March 2006 P/N 760-000731 Rev A BroadAccess Maintenance Guide 6. Double-click on the port. The ATM UNI Properties window appears. Click the Performance Monitoring button on this window. The STM1-ATM Performance Monitoring window is displayed. Figure 43. STM1-ATM Performance Monitoring Window Table 155. STM1-ATM Performance Monitoring Statistics Screen Element Refresh button Report button Export button Data-Source P/N 760-000731 Rev A Options Description Default Refreshes the information displayed in the window Lets you print a report of the statistics displayed in the window. You can also do a print preview, set up page parameters and use the Report Designer feature to format the report before printing. Lets you export the statistics to a file. The following file formats are available: TXT, XML, HTML and Excel. Network Element Lets you view statistics live from Network Element Oracle DB the BroadAccess system (Network Element), or from the Oracle database March 2006 Page 215 6. Performance Management Screen Element Collection button Reset Counters button Abbreviation button Hour-Quarters tab Days tab Date Monitor Time End Time ESs SESs CVs UASs PPJCs NPJCs Page 216 Options Description Default Opens the PM Archive Settings dialog box, where you can enable archiving of the statistics collected for the ATM-UNI port in the Oracle database. For more information, see Setting Up a Database of Performance Monitoring Statistics on page 189. Resets the counters in the window Opens a glossary of terms for the abbreviations used in this window Displays the statistics collected for 15 minute intervals Displays the statistics collected for 24 hour intervals Displays the date on which the statistics were collected Displays the total amount of time when statistics were actually collected (appears only on the Days tab) Displays the time at which the system finished collecting statistics for the corresponding interval (appears on HourQuarters tab only) Displays the number of seconds in the time period when at least one error block occurred Displays the number seconds in the time period when there were severe bit errors Displays the number of code violations that were detected during the interval within the STM1 frame Displays the number of seconds following 10 consecutive SES. Displays the number of times there was a positive pointer justification (STM-1 and VC-12 only) Displays the number of time there was a negative pointer justification (STM-1 and VC-12 only) March 2006 P/N 760-000731 Rev A BroadAccess Maintenance Guide Screen Element Options SEFs TX Cells OCD Events HEC Errors 6.3.5. Default Displays the number of seconds in the given time period when there was severe loss of frame Displays the number of cells received from the network Displays the number of cells transmitted towards the network Displays the number of Out of Cell Delineation Events detected during the interval Displays the number of Header Error Control errors detected during the interval Indicates whether or not the statistics collected for the corresponding interval are reliable: Yes - reliable; No - Invalid RX Cells Valid Description Yes No Viewing SDH Link Performance The SDH Performance tab of the Link Configuration window displays detailed information about STM-4, STM-1 and VC-12s levels' performance for a transmission card installed in the system. At STM-1 level, you can view performance monitoring statistics for either TDM or ATM traffic being transmitted over the SDH ring. You can set the system to archive PM reports for particular interfaces in the Oracle database for future reference, and you can view statistics live from the BroadAccess system, or from the database. You can also export the statistics to a file or print a report. To view link and card current performance: 1. Point to a BroadAccess NE and right-click. The Shortcut Menu is displayed. 2. Select NE Operation. The NE Operation window is displayed. 3. Click the Links button on the toolbar. The Link Configuration window is displayed. 4. Click the More Details button. The SDH Performance tab is displayed. 5. Select the source from which you want to view statistics from the DataSource box. 6. Click the STM-4, STM-1 and VC-12 tabs to view performance of a link card at each of the levels. When viewing STM-1 performance, you can toggle between TDM and ATM statistics by selecting the corresponding radio button on the STM-1 tab. P/N 760-000731 Rev A March 2006 Page 217 6. Performance Management 7. You can do one or more of the following: To print a report of the statistics displayed in the window, click the Report button. To export the statistics to file, click the Export button. To enable archiving of the statistics for the link, click the Collection button. In the PM Archive Settings dialog box, select the Polling on Current Port/Interface is Active checkbox. Figure 44. SDH Link Configuration Window - SDH Performance Tab, VC-12 Statistics Figure 45. SDH Link Configuration Window - SDH Performance Tab, STM-1 ATM Statistics Table 156. SDH Performance Tabs Settings Screen Element Data-Source Page 218 Options Description Default Network Element Network-Element Lets you view statistics live from the BroadAccess system Oracle DB (Network Element), or from the Oracle database. March 2006 P/N 760-000731 Rev A BroadAccess Maintenance Guide Screen Element More Rows button Report button Export button Collection button Abbreviations button Hour-Quarters tab Daily tab STM4 tab STM1 tab P/N 760-000731 Rev A Options Description Default Displays the next set of rows of statistics saved in the database Lets you print a report of the statistics displayed in the window. You can also do a print preview, set up page parameters and use the Report Designer feature to format the report before printing. Lets you export the statistics to a file. The following file formats are available: TXT, XML, HTML and Excel. Opens the PM Archive Settings dialog box, where you can enable archiving of the statistics collected for this link in the Oracle database. For more information, see Setting Up a Database of Performance Monitoring Statistics on page 189. Opens a glossary of terms for the abbreviations used in this window Displays the statistics collected for 15 minute intervals. Displays the statistics collected for 24 hour intervals Displays statistics collected for all transmission supported by the card Displays statistics for each STM1 supported by the card. You can view STM1 TDM or ATM-UNI statistics for traffic being transmitted on the SDH ring. Select the TDM or ATM radio button to display the information for the corresponding traffic type. The ATM statistics displayed here refer to the ATM traffic passing through the SDH card in the unit for which you are currently viewing statistics. March 2006 Page 219 6. Performance Management Screen Element VC-12 tab Select Link box (VC-12 tab only) Date End Time ESs SESs CV UASs PPJCs NPJCs Rx Cells Page 220 Options Description Default Displays a breakdown of the VC3s, VC2s and VC12s assigned to each STM1 link, and displays the statistics collected for the VC-12 level. Lets you select the link (active or backup) for which you want to view breakdown of VC3s, VC2s and VC12s. Displays the date on which the statistics were collected Displays the time at the end of the interval for which the statistics were collected. If the time interval is incomplete (the top row of the table), the current time will be displayed. Errored Seconds—the number of seconds in the given time period when at least one error block occurred (displayed in HH:MM:SS format) Severely Errored Seconds— the number of seconds in the given time period when there were severe bit errors: in which the BER > 103 (displayed in HH:MM:SS format) or a major alarm on link Code Violation—the number of code violations that were detected during the interval within the SDH frame Unavailable Seconds—the number of seconds following 10 consecutive SES. Positive Pointer Justification Count—the number of times there was a positive pointer justification (STM-1 and VC12 only) Negative Pointer Justification Count—the number of time there was a negative pointer justification (STM-1 and VC12 only) Displays the number of cells received from the network March 2006 P/N 760-000731 Rev A BroadAccess Maintenance Guide Screen Element Options Tx Cells Default Displays the number of cells transmitted towards the network Displays the number of Out of Cell Delineation Events detected during the interval Displays the number of Header Error Control errors detected during the interval OCD Events HEC Errors 6.3.6. Description Viewing PDH Link Performance You can select a link from the Links window and view detailed information about its performance. You can view information in three time ranges: for statistics collected for 15 minute intervals, for statistics collected per hours, or data collected on a daily basis. You can also view a current BER (Bit Error Rate) reading. You can set the system to archive PM reports for particular interfaces in the Oracle database for future reference, and you can view statistics live from the BroadAccess system, or from the database. You can also export the statistics to a file or print a report. To view PDH link performance: 1. Point to a BroadAccess NE and right-click. The Shortcut Menu is displayed. 2. Select the NE Operation option. The NE Operation window is displayed. 3. In the configuration tree, select an RU or CU unit. A list of cages is displayed. 4. Select a cage (if there are two cages, select the first one). A list of cards that are installed in the cage is displayed. 5. Click on a PDH (ONTU) card. A list of links that are supported by the card is displayed. 6. Select a link. 7. Click the More Details button. The Optical Properties pane is displayed. 8. Click the Performance tab. Click the various tabs to view the time period you require. 9. To view statistics from the Oracle database, select the Oracle DB option from the Data Source box. 10. You can do one or more of the following: P/N 760-000731 Rev A To print a report of the statistics displayed in the window, click the Report button. To export the statistics to file, click the Export button. March 2006 Page 221 6. Performance Management To enable archiving of the statistics for the link, click the Collection button. In the PM Archive Settings dialog box, select the Polling on Current Port/Interface is Active checkbox. Figure 46. PDH, PCM E1 and HDSL Link Configuration Window Performance Tab Table 157. PDH, PCM E1 and HDSL link Performance Tab Settings Screen Element Data Source box Options Network Element Oracle DB More Rows button Report button Export button Collection button Page 222 March 2006 Description Lets you display statistics live from the BroadAccess system (Network Element) or from the Oracle database (Oracle DB) Displays the next set of rows of statistics saved in the database Lets you print a report of the statistics displayed in the window. You can also do a print preview, set up page parameters and use the Report Designer feature to format the report before printing. Lets you export the statistics to a file. The following file formats are available: TXT, XML, HTML and Excel. Opens the PM Archive Settings dialog box, where you can enable archiving of the statistics collected for this link in the Oracle database. For more information, see Setting Up a Database of Performance Monitoring Statistics on page 189. Default Network Element P/N 760-000731 Rev A BroadAccess Maintenance Guide Screen Element BER Hour - Quarters Hours Days BEB ES SES EFS DM UT 6.3.7. Options Description Default Displays a current reading of BER (Bit Error Rate) Displays information collected in 15 minute intervals during the last hour Displays information collected over the last 24 hours at hourly intervals Displays information collected daily over the last 7 days Background Error Blocks— the number of errored blocks that occurred Errored Seconds—the number of seconds in the given time period when at least one error block occurred (displayed in HH:MM:SS format). Severely Errored Seconds— the number of seconds in the given time period when there were severe bit errors: BER > 10-3(displayed in HH:MM:SS format). Error Free Seconds—the number of seconds in the given time period that were error free (displayed in HH:MM:SS format). Degraded Minutes—the total number of minute intervals with a BER worse than 1 •10-6. Unavailable Time—number of seconds with more than 10 consecutive SES. Viewing PCM E1 Link Performance You can select a link from the Links window and view detailed information about its performance. You can view information in three time ranges: for statistics collected for 15 minute intervals, for statistics collected per hours, or data collected on a daily basis. You can also view a current BER (Bit Error Rate) reading. You can set the system to archive PM reports for particular interfaces in the Oracle database for future reference, and you can view statistics live from the BroadAccess system, or from the database. You can also export the statistics to a file or print a report. P/N 760-000731 Rev A March 2006 Page 223 6. Performance Management To view PCM link performance: 1. Point to a BroadAccess NE and right-click. The Shortcut Menu is displayed. 2. Select the NE Operation option. The NE Operation window is displayed. 3. In the configuration tree, select an RU or CU unit. A list of cages is displayed. 4. Select a cage. A list of cards that are installed in the cage is displayed. 5. Click on an PCM E1 (LTM) card. A list of links that belong to that particular card is displayed. 6. Select a link. 7. Click the More Details button. Click the various tabs to view the time period you require. 8. To view statistics from the Oracle database, select the Oracle DB option from the Data Source box. 9. You can do one or more of the following: To print a report of the statistics displayed in the window, click the Report button. To export the statistics to file, click the Export button. To enable archiving of the statistics for the link, click the Collection button. In the PM Archive Settings dialog box, select the Polling on Current Port/Interface is Active checkbox. For more information about the performance monitoring statistics displayed in the window, see the table PDH, PCM E1 and HDSL links Performance Tab Settings on page 222. 6.3.8. Viewing HDSL Link Performance You can select an HDSL link from the Links window and view detailed information about its performance. You can view information in five time ranges: Page 224 • Data collected during the last hour in 15 minute intervals • Data collected over the last 24 hours at hourly intervals • Data collected daily over the last 7 days • Data collected in 15 minute intervals about HDSL spans • Data collected once daily over the last 7 days about HDSL spans March 2006 P/N 760-000731 Rev A BroadAccess Maintenance Guide You can set the system to archive PM reports for particular interfaces in the Oracle database for future reference, and you can view statistics live from the BroadAccess system, or from the database. You can also export the statistics to a file or print a report. In addition, you can also view a current BER (Bit Error Rate) reading. To view HDSL link performance: 1. Point to a BroadAccess NE and right-click. The Shortcut Menu is displayed. 2. Select the NE Operation option. The NE Operation window is displayed. 3. In the configuration tree, select an RU or CU unit. A list of cages is displayed. 4. Select a cage. A list of cards that are installed in the cage is displayed. 5. Click on an HDSL card. A list of links that are supported by the card is displayed. 6. Select a link. 7. Click the More Details button and then the Performance tab. Click the various tabs to view the time period you require. 8. To view statistics from the Oracle database, select the Oracle DB option from the Data Source box. 9. You can do one or more of the following: To print a report of the statistics displayed in the window, click the Report button. To export the statistics to file, click the Export button. To enable archiving of the statistics for the link, click the Collection button. In the PM Archive Settings dialog box, select the Polling on Current Port/Interface is Active checkbox. For more information about the performance monitoring statistics displayed in the window, see the table PDH, PCM E1 and HDSL links Performance Tab Settings on page 222. 6.3.8.1. Viewing HDSL Span Performance You can view performance information about HDSL spans. You can view information in two time ranges: • Quarter Hours—displays information about HDSL spans, collected in 15 minute intervals • Days—displays information about HDSL spans, collected once daily P/N 760-000731 Rev A March 2006 Page 225 6. Performance Management To view HDSL span performance: 1. Point to a BroadAccess NE and right-click. The Shortcut Menu is displayed. 2. Select the NE Operation option. The NE Operation window is displayed. 3. In the configuration tree, select an RU or CU unit. A list of cages is displayed. 4. Select a cage. A list of cards that are installed in the cage is displayed. 5. Click on an HDSL card. A list of links that belong to that card is displayed. 6. Select the link for which you want to view performance monitoring statistics. 7. Click the More Details button, and then the Performance tab. 8. Click the HDSL hour quarters tab to view data collected in 15 minute intervals or the HDSL Daily tab to view data collected once daily. 9. You can do one or more of the following: To print a report of the statistics displayed in the window, click the Report button. To export the statistics to file, click the Export button. To enable archiving of the statistics for the link, click the Collection button. In the PM Archive Settings dialog box, select the Polling on Current Port/Interface is Active checkbox. Figure 47. HDSL Link Configuration Window - HDSL Quarter Hour Span Performance Tab Page 226 March 2006 P/N 760-000731 Rev A BroadAccess Maintenance Guide Table 158. HDSL Quarter Hour Span Performance Tab Settings Screen Element Options BER Data Source Network Element Oracle DB Report button Export button Collection button Abbreviations Button Time P/N 760-000731 Rev A Description Displays current bit error rate reading Lets you display statistics live from the BroadAccess system (Network Element) or from the Oracle database (Oracle DB) Lets you print a report of the statistics displayed in the window. You can also do a print preview, set up page parameters and use the Report Designer feature to format the report before printing. Lets you export the statistics to a file. The following file formats are available: TXT, XML, HTML and Excel. Opens the PM Archive Settings dialog box, where you can enable archiving of the statistics collected for this link in the Oracle database. For more information, see Setting Up a Database of Performance Monitoring Statistics on page 189. Lists abbreviations used in this view Displays data collected for the next 15 minute interval Displays data collected for all intervals over 24 hours Displays data collected for the previous 15 minute interval. Displays data collected for all previous intervals over 24 hours The data are collected in time frames of 15 minutes. The time displayed in this field is the start of the 15 minute time frame when the data displayed was collected. March 2006 Default Network Element Page 227 6. Performance Management Screen Element Options Loop A/Loop B Description Default Each HDSL E1 link is divided into 2 channels: Loop A and Loop B. Check this window to see the performance of each loop. Errored Seconds - the number of seconds in the time frame when at least one error block occurred. Unavailable Seconds - the number of seconds in the time frame when no service was available on this span. Card installed in a CU on an HDSL span Doubler 1 on an HDSL span Doubler 2 on an HDSL span Card installed in a RU on an HDSL span ES UAS Master Doubler 1 Doubler 2 Slave Figure 48. HDSL Link Configuration Window - HDSL Daily Span Performance Tab Table 159. HDSL Daily Span Performance Tab Settings Screen Element BER Data Source Page 228 Options Description Default Displays current bit error rate reading Network Element Lets you display statistics live from the BroadAccess system Oracle DB (Network Element) or from the Oracle database (Oracle DB) March 2006 P/N 760-000731 Rev A BroadAccess Maintenance Guide Screen Element Report button Export button Collection button Abbreviations button Date Loop A/Loop B ES UAS Master Doubler 1 Doubler 2 Slave P/N 760-000731 Rev A Options Description Default Lets you print a report of the statistics displayed in the window. You can also do a print preview, set up page parameters and use the Report Designer feature to format the report before printing. Lets you export the statistics to a file. The following file formats are available: TXT, XML, HTML and Excel. Opens the PM Archive Settings dialog box, where you can enable archiving of the statistics collected for this link in the Oracle database. For more information, see Setting Up a Database of Performance Monitoring Statistics on page 189. Lists abbreviations used in this window Displays the date on which the data was collected. To select a date, click the Select Day button, and choose a date from the calendar. Each HDSL E1 link is divided into 2 channels: Loop A and Loop B. Check this window to see the performance of each loop. Errored Seconds - the number of seconds in the time frame when at least one error block occurred. Unavailable Seconds - the number of seconds in the time frame when no service was available on this span. Card installed in a CU on an HDSL span Doubler 1 on an HDSL span Doubler 2 on an HDSL span Card installed in an RU on an HDSL span March 2006 Page 229 6. Performance Management 6.3.9. Viewing Ethernet Service Performance Monitoring You can view performance monitoring statistics for each Ethernet Service port in the system, using the Ethernet Card Performance Monitoring window. To view Ethernet Service performance statistics: 1. Point to a BroadAccess NE and right-click. The Shortcut Menu is displayed. 2. Select NE Operation. The NE Operation window is displayed. 3. In the configuration tree, expand the corresponding RU unit's child nodes. A list of cages is displayed. 4. Expand the corresponding cage's child nodes. A list of the cards that are installed in that cage are displayed. 5. Expand the corresponding LI-ETH-x card's child nodes. A list of ports is displayed. 6. Right-click on the port you require, and select the Configure Port option. The Ethernet Card Configuration: Port window is displayed. 7. Click the Performance icon. The Ethernet Card Performance Monitoring window is displayed. Figure 49. Ethernet Card Performance Monitoring: Port Window Page 230 March 2006 P/N 760-000731 Rev A BroadAccess Maintenance Guide Table 160. Ethernet Service Performance Monitoring Settings Screen Element Refresh button Reset Counters button Received Frames Frames dropped for congestions Good Frames Frames Dropped for CRC Errors Bad Frames Bytes Received Transmitted Frames Frames Failures Bytes 6.4. Options Description Default Refreshes the information displayed in the window Resets the counters in the window to zero Displays the total number of frames received Displays the total number of received frames dropped due to congestion Displays the total number of valid frames received Displays the total number of frames dropped due to CRC errors Displays the total number of frames received of invalid size Displays the total number of bytes received Displays the total number of frames transmitted Displays the total number of frame transmission failures due to collision or internal problems Displays the total number of bytes transmitted Setting up Threshold Crossing Alerts You can set up a log of Threshold Crossing Alerts, which lists all the occurrences where performance statistic thresholds configured for the system were crossed. You can configure threshold crossing alerts for one or more ADSL and SHDSL ports in an NE. These thresholds are configured at an NE level, from the NE Operation window. You can access configuration parameters for Threshold Crossing Alerts from the port configuration window of a particular port, or by using the Performance|Threshold Crossing Alert menu option in the NE Operation window. For more information about configuring ADSL Threshold Crossing Alerts, see Threshold Crossing Alert Profiles (ADSL) in the BroadAccess Configuration Guide. For more information about configuring SHDSL Threshold Crossing Alerts, see Threshold Crossing Alert Profiles (SHDSL) in the BroadAccess Configuration Guide. P/N 760-000731 Rev A March 2006 Page 231 6. Performance Management You view the Threshold Crossing Alert log by clicking the Threshold Crossing Alert button on the ClearAccess+/LCT main window's toolbar. For more information about viewing the Threshold Crossing Alert log, see the ClearAccess+ or LCT Installation and Administration Guide. 6.5. Viewing Traffic Reports The following types of traffic reports can be generated for all or for a range of installed lines: 6.5.1. • Currently Active Lines • Daily Usage • Current Traffic • Peak Hour • Hour of Interest Current Active Lines The Current Active Lines window lets you view all the currently non-idle lines in the system. Each line which is listed is presented along with the time slot, card type, line type and duration of the current allocation. To view the lines that are currently active: Page 232 1. Point to a BroadAccess NE and right-click. The Shortcut Menu is displayed. 2. Select the NE Operation option. The NE Operation window is displayed. 3. From the Menu Bar select the Performance option, then the Traffic option, then the NE Current Active Lines option. The Currently Active Lines window is displayed. 4. To print a report of the lines that are currently active, click the Report button. March 2006 P/N 760-000731 Rev A BroadAccess Maintenance Guide Figure 50. Currently Active Lines Window Table 161. Currently Active Lines Window Settings Screen Element Time Slot Card Type Line Type Duration Refresh button Report button P/N 760-000731 Rev A Options Description Default The ID of the line that is active. The ID consists of the following components: RU #, cage:card:port Displays the line type (for example, POTS, ISDN, etc.) Displays the type of the card The duration of the current allocation (using a 10 second resolution) Refreshes current information displayed in the window Lets you print a report about the lines that are currently active March 2006 Page 233 6. Performance Management 6.5.2. Daily Usage You can view the accumulative daily usage of a unit per hour, using the Unit Daily Usage window. The hours are presented according to a 24 Hour clock. To view daily usage: 1. Point to a BroadAccess NE and right-click. The Shortcut Menu is displayed. 2. Select the NE Operation option. The NE Operation window is displayed. 3. On the Configuration Tree select an RU or CU. The unit icon becomes a hand icon. 4. From the Menu Bar select the Performance option, then the Traffic option, then the Unit Daily Usage option. The Unit Daily Usage window of the unit you selected is displayed. 5. From the drop down list box in the Unit Daily Usage window, select the day for which you require usage information. The day you select is relative to the date that appears in the Date box. Figure 51. Unit Daily Usage Dialog Box Page 234 March 2006 P/N 760-000731 Rev A BroadAccess Maintenance Guide Table 162. Unit Daily Usage Dialog Box Settings Screen Element Options Date Default The date for which usage information is presented The hour for which usage information is presented The accumulated amount of hours all subscribers at the selected unit were active Refreshes current information displayed in the window Hour Usage Refresh button 6.5.3. Description Current Traffic This management system enables you to view the current traffic in the CU or RUs. The required CU or RU can be selected from the Configuration Tree. To view the current traffic report: 1. Point to a BroadAccess NE and right-click. The Shortcut Menu is displayed. 2. Select the NE Operation option. The NE Operation window is displayed. 3. On the Configuration Tree select a RU or CU. The unit icon becomes a hand icon. 4. From the Menu Bar select the Performance option, then the Traffic option, then the Unit Current Traffic option. The Current Traffic window of the unit you selected is displayed. P/N 760-000731 Rev A March 2006 Page 235 6. Performance Management Figure 52. Unit Current Traffic Table 163. Unit Current Traffic Window Settings Screen Element Number of Time Slots in use Outgoing Incoming Internal Calls Page 236 Options Description Default Displays the number of time slots in use The number of time slots used to service outgoing allocations The number of time slots used to service incoming calls The number of time slots saved by internal calls (twice the number of internal calls). To display information about internal calls you must first select the Intra-call check box in the System Settings window. For more information, see Setting System Settings in the BroadAccess Configuration Guide. March 2006 P/N 760-000731 Rev A BroadAccess Maintenance Guide Screen Element Service State Options OK Description Default Displays the state of the service ATB (All Trunks Busy) Report for Last N Minutes Presents traffic information for the last N minutes, where N is typically between 45 and 59 minutes The maximum number of time slots used simultaneously in this period Accumulative time usage (in hours) in the unit, grouped according to outgoing allocations, incoming calls, and internal calls Number of outgoing allocations, incoming allocations, and internal call allocations Number of calls that did not go through (were blocked) due to ATB state Refreshes current information displayed in the window Max. TS Used Usage Peg Count Blocked Refresh button 6.5.4. Peak Hour Report You can display traffic information for the daily peak hour, in the Peak Hour Report window. To view the peak hour report: 1. Point to a BroadAccess NE and right-click. The Shortcut Menu is displayed. 2. Select the NE Operation option. The NE Operation window is displayed. 3. On the Configuration Tree select a RU or CU. The unit icon becomes a hand icon. 4. From the Menu Bar select the Performance option, then the Traffic option, then the Unit Peak Hour Traffic option. The Peak Hour Report window of the unit you selected is displayed. 5. From the drop down list box in the Peak Hour Report window select the day for which the peak hour report you require. The day you select is relative to the date that appears in the Start Hour box. P/N 760-000731 Rev A March 2006 Page 237 6. Performance Management Figure 53. Unit Peak Hour Report Table 164. Peak Hour Report Window Settings Screen Element Start Hour Max. TS used Usage Peg Count Blocked Refresh button 6.5.5. Options Description Default The time at which the peak hour starts The maximum number of time slots used in this period Accumulative time usage (in hours) of time slots in the unit, grouped according to outgoing allocations, incoming calls, and internal calls Number of outgoing 0 allocations, incoming allocations, and internal call allocations Number of calls that did not go 0 through (were blocked) due to ATB state Refreshes current information displayed in the window Hour of Interest Report You can determine a specific 60 minute period during which you would like to collect traffic data. This is useful when you want to sample a specific time period. The unit to which the report applies may be selected from the Configuration Tree. Page 238 March 2006 P/N 760-000731 Rev A BroadAccess Maintenance Guide In order to view the specific hour, the Hour of Interest must be predefined from the Set Hour of Interest dialog box (see Setting Hour of Interest on page 240for more information). To view the hour of interest report dialog box: 1. Point to a BroadAccess NE and right-click. The Shortcut Menu is displayed. 2. Select the NE Operation option. The NE Operation window is displayed. 3. On the Configuration Tree, select a RU or CU. The unit icon becomes a hand icon. 4. From the Menu Bar select the Performance option, then the Traffic option, then the Unit Hour of Interest Traffic option and then the Unit Hour of Interest Report option. The Hour of Interest Report window for the unit you selected is displayed. 5. From the drop down list box in the Hour of Interest Report window select the day for which the hour of interest report you require. The day you select is relative to the date that appears in the Hour of Interest box. Figure 54. Hour of Interest Report Dialog Box Table 165. Hour of Interest Report Dialog Box Settings Screen Element Hour of Interest Max. TS used P/N 760-000731 Rev A Options Description Default The time at which the hour of interest begins. The maximum number of time slots used in this period March 2006 Page 239 6. Performance Management Screen Element Options Usage Description Default Accumulative time usage (in hours) of time slots in the unit, grouped according to outgoing allocations, incoming calls, and internal calls Number of outgoing allocations, incoming allocations, and internal call allocations. Number of calls that did not go through (were blocked) due to ATB state Refreshes current information displayed in the window Peg Count Blocked Refresh button 6.5.5.1. Setting Hour of Interest To set hour of interest: 1. Point to a BroadAccess NE and right-click. The Shortcut Menu is displayed. 2. Select the NE Operation option. The NE Operation window is displayed. 3. From the Menu Bar select the Performance option, then the Traffic option, then the Unit Hour of Interest Traffic option. The Set Hour of Interest dialog box is displayed. 4. Enter the hour at which the hour of interest begins (a number between 0 and 23) and the minute at which the hour of interest begins. 5. Click the Apply button. The new hour of interest is set. Figure 55. Set Hour of Interest Dialog Box Table 166. Set Hour of Interest Dialog Box Settings Screen Element Hour Minute Page 240 Options Description Default The hour at which the hour of interest begins. Enter a number between 0 and 23 The minute at which the hour of interest begins March 2006 P/N 760-000731 Rev A BroadAccess Maintenance Guide Screen Element Refresh button Apply button P/N 760-000731 Rev A Options Description Default Refreshes current information displayed in the window Sets the new hour of interest March 2006 Page 241 BroadAccess Maintenance Guide 7. Glossary of Terms ADSL Asymmetrical Digital Subscriber Line ATM Asynchronous Transfer Mode ATU-C ADSL Transceiver Unit located on the ADSL card installed in the BroadAccess system ATU-R ADSL Transceiver Unit in the ADSL modem located at the subscriber's premises BER Bit Error Rate BRI Basic Rate Interface CAC Connection Admission Control CDVT Cell Delay Variation Tolerance CPE Customer Premises Equipment - the equipment which connects between the xDSL line and the subscriber's computer at the subscriber's premises CU Central Unit EMS Element Management System GUI Graphical User Interface HEC Header Error Control P/N 760-000731 Rev A March 2006 Page 243 7. Glossary of Terms Invalid The Performance Monitoring results collected are not reliable for the given period. Results might be invalid, for example, if there was an interruption to the collection of statistics during that time period. IP Internet Protocol ISDN Integrated Services Digital Network LAN Local Area Network LCT Local Craft Terminal LE Local Exchange NE Network Element NGN Next Generation Networks OAM Operations, Administration and Maintenance PC Personal Computer PCR Peak Cell Rate in cells/sec RU Remote Unit Rx Receive SCR Sustainable Cell Rate Page 244 March 2006 P/N 760-000731 Rev A BroadAccess Maintenance Guide SDH Synchronous Digital Hierarchy SHDSL Symmetric High-bit rate Digital Subscriber Line SNR Signal-to-Noise Ratio TC Layer Transmission Convergence Layer, a sub-layer of the ATM Physical Layer TD Traffic Descriptor Tx Transmit UBR Undefined Bit Rate UNI User Network Interface Valid The Performance Monitoring results collected are reliable for the given period. Results might be invalid, for example, if there was an interruption to the collection of statistics during that time period. VC12 Virtual Container Level 12 VCC Virtual Channel Connection VCI Virtual Channel Identifier VCL Virtual Channel Link VF Voice Frequency P/N 760-000731 Rev A March 2006 Page 245 7. Glossary of Terms VPC Virtual Path Connection VPI Virtual Path Identifier Page 246 March 2006 P/N 760-000731 Rev A BroadAccess Maintenance Guide 8. Index A Acknowledging Alarms • 47 Alarm Acknowledging and Deacknowledging • 47 Active Alarms • 40 Alarm Color Codes and Symbols • 39 Alarm History • 48 Archive • 48 Audible Notification • 37 Audible Notification Sound, Modifying • 38 Filtering and Sorting the Alarm Display • 43 Hiding Columns in Tables • 27 List of Alarms • 66 Printing Alarm Reports • 51 Saving Alarm Reports • 51 Searching for Text in Alarm Display • 45 Severity Levels, Editing • 52 Simulation • 174 Troubleshooting Procedures • 96 Unhiding Columns in Tables • 27 ATM Performance, Cross-Connections • 210 Performance, STM1-ATM on ATM Uplink • 214 Performance, STM1-ATM over SDH • 214 B Bridge Port Statistics • 203 P/N 760-000731 Rev A March 2006 Page 247 8. Index C Capacitance Parameters • 173 Tests • 164 Commands • 15 Configuration Log • 58 Printing Reports • 63 Saving to File • 63 Searching for Text • 62 Configuration Tree • 12 Conventions and Terminology • 2 D Deacknowledging Alarms • 47 E Entering Free Text for Alarms • 47 Ethernet Service Ethernet Service Performance • 230 Event Log • 56 External Alarm Settings • 175 F Fault Management • 37 Acknowledging Alarms • 47 Active Alarms • 40 Alarm Archive • 48 Alarm Color Codes and Symbols • 39 Alarm History • 48 Alarm Messages • 66 Alarm Simulation • 174 Page 248 March 2006 P/N 760-000731 Rev A BroadAccess Maintenance Guide Alarms and Indicators • 64 Audible Notification • 37 Audible Notification Sound, Modifying • 38 Background Line Tests • 171 Deacknowledging Alarms • 47 Entering Free Text for Alarms • 47 Event Log • 56 External Alarm Settings • 175 External Line Tests • 170 Filtering and Sorting the Alarm Display • 43 Hiding Columns in Tables • 27 LEDs • 64 Line Test History • 169 Line Test Thresholds • 172 Line Testing • 164 Printing Alarm Reports • 51 Problems not Reported by Alarms • 94 Saving Alarm Reports • 51 Searching for Text in Alarm Display • 45 Severity Levels, Editing • 52 Troubleshooting Methodology • 65 Troubleshooting Procedures • 96 Unhiding Columns in Tables • 27 H HDSL Link HDSL Link Performance • 224 Hiding Columns in Tables • 27 P/N 760-000731 Rev A March 2006 Page 249 8. Index I IP Uplink Performance • 203 L Learned MACs • 203 LEDs • 64 Line Tests Background Line Tests • 171 Capacitance Parameters • 173 Capacitance Tests • 164 External Line Tests • 170 Line Test History • 169 Line Test Thresholds • 172 Metallic Tests • 164 Voice Frequency Tests • 164 Loopbacks • 177 M Metallic Tests • 164 P PCM E1 Link Link Performance • 223 PDH Link Link Performance • 221 Performance ADSL • 192 ATM Cross-Connect • 209 ATM-UNI Performance (ATM Uplink) • 214 ATM-UNI Performance (SDH Ring) • 217 Database • 189 Page 250 March 2006 P/N 760-000731 Rev A BroadAccess Maintenance Guide Ethernet Service Performance • 230 HDSL Link • 224 HDSL Span • 225 IP Uplink • 203 PCM E1 • 223 PDH • 221 SDH • 217 STM1-ATM on ATM Uplink • 214 STM1-ATM over SDH • 214 Summary of Available Counters • 179 Phone Book Finding Ports • 20 Ports Locating Using Phone Book • 20 R Reports • 26 ADSL Performance, Fast/Interleave • 196 ADSL Performance, Physical • 193 ADSL Performance, TC layer • 199 Alarms, Printing • 51 Alarms, Saving • 51 ATM Performance • 210 Configuration Log • 63 Creating • 26 Current Traffic • 235 Events • 56 Hour of Interest • 238 Line Tests • 164 P/N 760-000731 Rev A March 2006 Page 251 8. Index Peak Hour • 237 Phone Book • 20 SDH • 217 Restoring Columns in Tables • 27 S SDH Link SDH Link and Card Performance • 217 Severity Levels, Editing • 52 Shortcut Menus • 20 Simulation, Alarm • 174 Statistics • 179 System Overview • 7 T Telephone Number • 20 Terminology and Conventions • 2 Threshold Crossing Alerts • 231 Troubleshooting Methodology • 65 Procedures • 96 U Unhiding Columns in Tables • 27 User Interface • 11 Configuration Tree • 12 Creating Reports • 26 Finding Ports using the Phone Book • 20 Hiding Columns in Tables • 27 Restoring Columns in Tables • 27 Shortcut Menus • 20 Page 252 March 2006 P/N 760-000731 Rev A BroadAccess Maintenance Guide Work Area • 13 V Voice Frequency Tests • 164 W Work Area • 13 P/N 760-000731 Rev A March 2006 Page 253