1
6. Performance Management
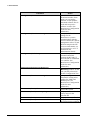
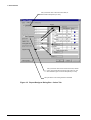
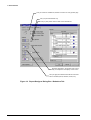
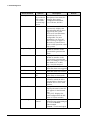
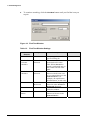
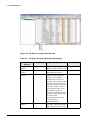
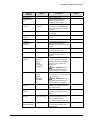
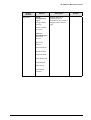
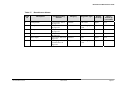
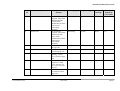
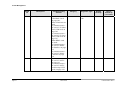
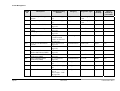
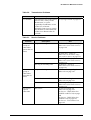
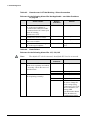
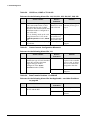
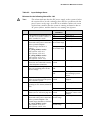
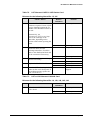
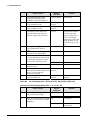
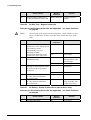
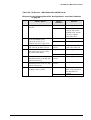
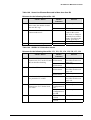
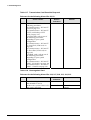
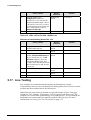
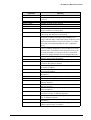
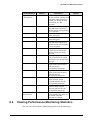
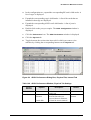
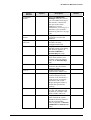
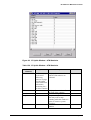
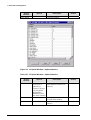
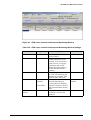
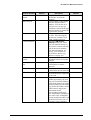
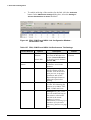
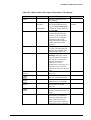
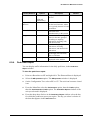
Screen
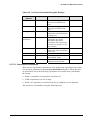
Element
Options
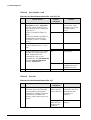
Collection
button
Default
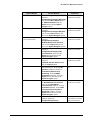
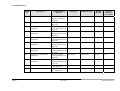
Opens the PM Archive
Settings dialog box, where
you can enable archiving of
the statistics collected for
this port in the Oracle
database. For more
information, see Setting Up a
Database of Performance
Monitoring Statistics on page
189.
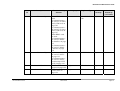
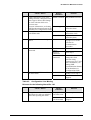
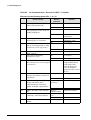
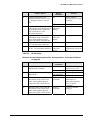
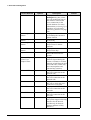
Displays the next set of rows
of statistics saved in the
database
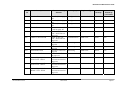
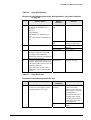
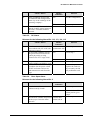
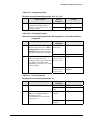
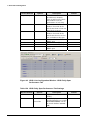
Displays the on-board date
currently configured in the
NE
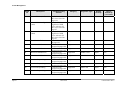
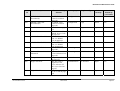
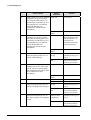
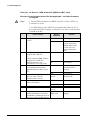
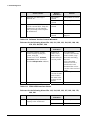
Displays the amount of time
that has passed so far during
this interval (appears on
Current 15 Minute or
Current Day tabs only)
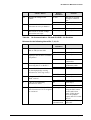
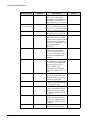
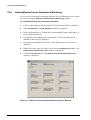
Displays the total amount of
time when statistics were
actually collected (appears
only on the Previous Day
tab)
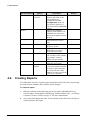
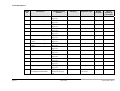
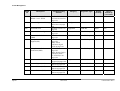
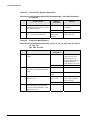
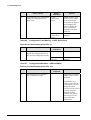
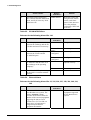
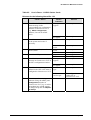
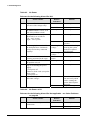
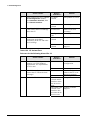
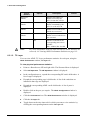
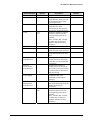
ADSL transceiver unit
located at the subscriber's
premises (CPE)
ADSL transceiver unit
located on the ADSL card
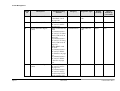
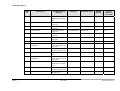
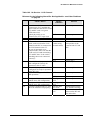
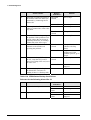
Lets you print a report of the
statistics displayed in the
window. You can also do a
print preview, set up page
parameters and use the
Report Designer feature to
format the report before
printing.
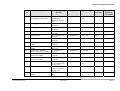
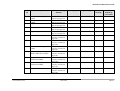
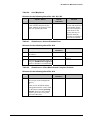
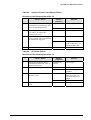
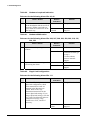
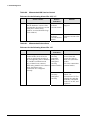
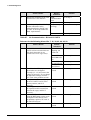
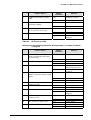
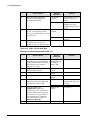
Lets you export the statistics
to a file. The following file
formats are available: TXT,
XML, HTML and Excel.
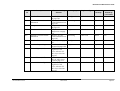
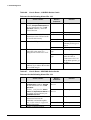
Displays the date and the
time at which the system
finished collecting statistics
for the corresponding
interval (appears on Current
15 Minutes and Interval tabs
only)
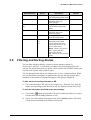
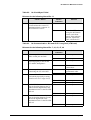
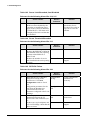
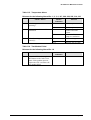
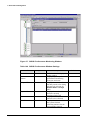
More Rows
button
System Date
Elapsed Time
Monitor Time
ATU-R
ATU-C
Report button
Export button
End Time
Page 194
Description
March 2006
P/N 760-000731 Rev A