1
PROGRAMMABLE PANEL
DOT RECORDER
KE8 TYPE
SERVICE MANUAL
February, 2008
CONTENTS:
Page No
1. APPLICATION ................................................................................................................................................................. 3
2. RECORDER PROPERTIES ............................................................................................................................................. 3
3. BASIC REQUIREMENTS, OPERATIONAL SAFETY...................................................................................................... 3
4. TECHNICAL SPECIFICATIONS ...................................................................................................................................... 4
5. CONSTRUCTION............................................................................................................................................................. 8
5.1 RECORDER CONSTRUCTION .................................................................................................................................... 8
6. INSTALLATION ......................................................................................................................................................... 10
6.1 RECORDER FITTING IN THE PANEL ........................................................................................................................ 10
6.2 CONNECTION TO THE TERMINAL PLATE ............................................................................................................... 11
7. RECORDER SERVICING .............................................................................................................................................. 13
7.1 DESCRIPTION OF THE READ-OUT FIELD AND KEYBOARD .................................................................................. 13
7.2 FUNCTIONS OF KEYBOARD KEYS IN WORKING MODES...................................................................................... 14
7.3. FUNCTIONS OF DIGITAL DISPLAY FIELDS............................................................................................................. 16
8. PUTTING THE RECORDER INTO OPERATION .......................................................................................................... 18
8.1 STATE RESETTING ................................................................................................................................................... 18
8.2 SELECTION AND REVIEW OF THE PARAMETER GROUP...................................................................................... 18
8.3 PROGRAMMING ........................................................................................................................................................ 21
8.4 RECORDING AND INDICATION OF MEASURED QUANTITIES ............................................................................... 21
8.5 PROGRAMMING OF THE RECORDER CHART LENGTH......................................................................................... 23
9. RECORDER PARAMETERS ......................................................................................................................................... 23
9.1 SET OF PROGRAMMABLE RECORDER PARAMETERS ......................................................................................... 23
9.2 GENERAL PRINCIPLES OF REVIEWING AND PARAMETER PROGRAMMING ..................................................... 24
9.3 DESCRIPTION OF SYSTEMIC PARAMETERS (S).................................................................................................... 28
9.4 DESCRIPTION OF MEASURING PARAMETERS (P) ................................................................................................ 30
9.5 DESCRIPTION OF ALARM PARAMETERS (A).......................................................................................................... 35
9.6 RECORDER SETUPS (C) ........................................................................................................................................... 38
10. REPLACEMENT OF THE RECORDING CHART........................................................................................................ 40
11. REPLACEMENT OF THE PRINTING HEAD ............................................................................................................... 41
12. LUBRICATION ............................................................................................................................................................. 42
13. DESCRIPTIONS ON THE RECORDER CHART ......................................................................................................... 42
13.1 DESCRIPTIONS IN THE PARAMETER PROGRAMMING MODE............................................................................ 42
13.2 DESCRIPTIONS IN THE PARAMETER PRINTING MODE ...................................................................................... 42
13.3 DESCRIPTIONS IN THE PROTOCOL PRINTING MODE......................................................................................... 46
13.4 DESCRIPTIONS IN RECORDING MODES .............................................................................................................. 47
13.4.1. GENERAL PRINCIPLES OF DIAGRAM RECORDING ................................................................................... 47
13.4.2. GENERAL PRINCIPLES OF CHART DESCRIPTION AND DIAGRAM READ-OUT ....................................... 47
13.4.3. EXAMPLARY CHART DESCRIPTION IN THE ALL CHANNEL RECORDING MODE.................................... 48
13.5 CHART DESCRIPTION WHEN PRINTING 24 HOURS’ REPORTS ......................................................................... 53
13.6 ARCHIVAL DESCRIPTION OF THE CHART, PRINTING OF ANALOGUE SCALES................................................ 54
13.7 CHART DESCRIPTION WHEN PROGRAMMING RECORDER PARAMETERS ..................................................... 55
13.8 CHART DESCRIPTION WHEN RECORDING WITH THE BUFFER
CONTENTS REPRODUCTION................................................................................................................................. 55
14. DESCRIPTION OF THE REMOTE CONTROL............................................................................................................ 56
14.1. DESCRIPTION OF BINARY FUNCTIONS OF CONTROL SIGNALS....................................................................... 56
14.2. EXEMPLARY CHART DESCRIPTIONS WHEN CONTROLLING BY BINARY SIGNALS........................................ 57
15. STATEMENT OF RECORDER MESSAGES ............................................................................................................... 60
16. PRODUCER’S STANDARD SETUPS ......................................................................................................................... 61
17. TESTS .......................................................................................................................................................................... 62
18. RECORDER INSTALLATION ...................................................................................................................................... 64
19. GENERAL PRECAUTIONS IN THE SCOPE OF THE PROTECTION AGAINST
ELECTROSTATIC DISCHARGES (ESD) .................................................................................................................... 65
20. RECORDER CO-OPERATION WITH A COMPUTER ................................................................................................. 65
21. CONNECTION OF DEVICES....................................................................................................................................... 65
22. EXPLOITATION CONSIDERATIONS.......................................................................................................................... 67
23. TABLE OF ASCII CHARACTERS IN THE HEXADECIMAL NOTATION.................................................................... 68
24. EXECUTION CODES ................................................................................................................................................... 69
25. MAINTENANCE AND GUARANTEE ........................................................................................................................... 70
2
1. APPLICATION
The KE8 recorder is intended to be used for dot recording of voltage, current, temperature and resistance change runs
from six measuring points. It can directly co-operate with voltage and current sources, thermocouples (TC), resistance
thermometers (RTD), potentiometric and resistance transmitters.
The KE8 recorder is adapted to communicate with a host computer and can be a part of measuring or control systems.
Its mechanical construction enables the assembly in control panels of a small building depth and ensures and optimal
use of the instrument panel front.
2. RECORDER PROPERTIES
•
•
•
•
•
•
•
•
•
•
•
•
•
•
•
•
•
scale with a digital read-out field and with a keyboard,
programmable parameters of measurement and recording,
multicolour graph printout and chart descriptions,
linearization of sensor characteristics,
printout of the measurement protocol and recorder parameters on the chart,
sensor break signalling with the message recorded on the chart,
alarm exceeding states signalled by relay contacts and recording on the chart,
signalling of the sensor burnout or the recorder chart end by one of the alarm relay,
detection of the chart end with the automatic description of the chart for archiving,
printout cycle control and chart feed control by external binary signals,
RS-232C or RS-485 standard interface co-operation with the host computer,
MODBUS or LUMBUS transmission protocol,
recording of measurement results in optional values proportionally to the measured quantity and description of these
values ( when the protocol or the passport is printed out ) in physical units as per the customer’s order,
measurement data information storage (buffering) during the time of the recording mode switching off for the
realization of recorder handling operations,
copying of measuring parameter setups between channels,
printout of 24 hours’ reports on the chart,
12 alarm relays assigned to optional channels.
3. BASIC REQUIREMENTS, OPERATIONAL SAFETY
KE8 recorders are destined to be mounted into panels or cubicles.
In the scope of operational safety they are in conformity with the IEC 1010 -1+A1:1996 standard requirements.
Remarks concerning the operator safety:
▪ The installation and meter connection should be operated by qualified personnel.
▪ One must take into consideration all accessible protection requirements.
▪ Before switching the recorder on, one must check the correctness of the network lead connection .
▪ In case of the protection terminal connection with a separate lead, one must remember to
connect it before the connection of network leads.
▪ Do not connect the recorder to the network through an autotransformer.
▪ Before taking the recorder housing out, one must turn the supply off.
▪ The removal of the recorder housing during the guarantee period may cause its cancellation.
Accessories:
We deliver with the meter following accessories:
1. Ferrite core ZCAT 2035-0930A (TKD) *)
2. Assembly chucks
3. Current clamps
4. Door keys
5. Bottle with oil
6. Service manual of KE8 recorder
7. Service manual of the MODBUS transmission protocol
8. Guarantee card
1 pc
2 pcs
6 pcs
2 pcs
1 pc
1 pc
1 pc
*) see – Recorder installation.
3
4. TECHNICAL SPECIFICATIONS
•
•
•
•
•
•
recording width
number of measuring points
recording
printing head durability
measuring ranges
recording time of measurement results
from 6 measuring points
100 mm
6 (electrically separated each other up to 100V d.c.)
dot, exchangeable printing head with, six colours
750,000 dots/ colour
see table 1
4...240 sec and for 0 setting the recording time is
proportional to the number of switched on
measuring channels x 1 sec .
0 or 5, 10, 20, 30, 40, 60, 120, 240,
300, 600 mm/hour
0.5
0.05 %
• advance of the recording chart
• accuracy class
• chart advance accuracy error
• additional error of the thermocouple automatic
cold junction compensation
• input resistance for current ranges
• recording chart
max. 1°C
100 Ω ± 0.05 %
roll chart 32 m. long or
Z-fold chart 16 m. long, acc. DIN 16230
0.21 mm
12, optionally assigned to channels
(normally open)
• resolution of the carriage movement
• number of alarm relays
• load capacity of alarm relays:
- for resistive load
- for inductive load
• binary input control
• communication interfaces
• data transmission protocol
• operating temperature range
• duration of the preliminary heating
• data storage
•
•
•
•
•
•
•
•
•
a.c.max 125 V a.c., 0.5 A, d.c. max 30 V a.c., 0.5 A
a.c./d.c. max 30 V, 0.5 A
inputs short-circuited or opened at the TTL level
RS-232C or RS-485
MODBUS
0...23...50°C
0.5 h
RAM memory with battery support for a
period of minimum 4 years
1.5...30 h
90...230...253 V
45...50...65 Hz
15 VA (22 VA when recording)
IP65, acc. EN 60529:2003
IP00, acc. EN 60529:2003
144 x 144 mm
260 mm
4.3 kg
`
data buffer capacity
supply voltage
supply voltage frequency
power consumption
housing protection degree
terminal protection degree
frontal frame dimensions
depth behind panel face
weight
• electromagnetic compatibility:
- immunity requirements against disturbances
- additional error
- emission requirements
EN 61000-6-2:2003
≤1%
EN 61000-6-4:2004
• requirements and tests
acc. ZN-99/LUMEL S.A./ KE8/445
4
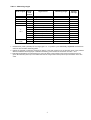
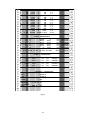
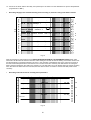
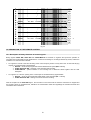
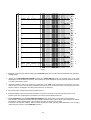
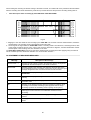
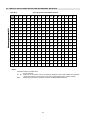
Table 1 - Measuring ranges
Kind of signal
Range
code
number
1
mV
mA
Ω
2
01
02
03
3
voltage
current
Potentiometric transmitter
Ω
04
Resistive transmitter
0...2000
60 Ω
05
R ( PtRh13 - Pt )
0...1760
540 °C
06
S
( PtRh10 - Pt )
0...1800
570 °C
07
B ( PtRh30 - PtRh6 )
400...1820
1000 °C
08
K ( NiCr - NiAl )
- 200...1370
130 °C
09
J
( Fe - CuNi )
-200...1200
100 °C
10
T
( Cu- CuNi )
-200...400
110 °C
0...1400
110 °C
°C
/ TC /
°C
/ RTD /
Signal source
Measuring ranges
Minimal
subrange
4
- 9999...0...9999
- 20...0...20
0...2000
5
5 mV
1 mA
50 Ω
11
Ni - Ni Mo
12
Pt 100
- 200...850
50 °C
13
Ni 100
- 60...180
50 °C
1. Measurement points (channels) for the range types: 01...13 (column 2) are electrically separated between them
and from other recorder measuring points.
2. Neither the potential of measuring terminals in relation to the earth reference nor the absolute value of the potential
difference between terminal groups of individual measuring points should not exceed the rms value = 50 V.
3. Metrological parameters are guaranteed if any of the two limits of the measuring sub-range programmed from the
given value interval (column 4) is not smaller than the sub-range minimal value (column 5) in the relation to the zero
value.
5
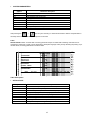
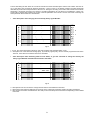
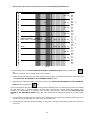
Table 2 – Reference conditions
Item.
Influencing quantity or
influencing factor
Value, range or
reference conditions
Tolerance of the reference value
2
3
4
23 °C
± 2 °C
25...85 %
-
Vertical
±5°
1
1
Ambient temperature
2
Air relative humidity
3
Work position
4
External magnetic field
Lack
Constant magnetic field = 40 A/m.
or alternating at frequency up to
65 Hz and optional direction.
5
External electrical field
Lack
1 kV/m., at frequency from zero to
65 Hz and optional direction.
6
Network
supply
a.c. voltage
230 Va.c.
or 24Vd.c./a.c.
± 2%
Frequency
0/45...65 Hz
-
Zero
< 0.05
Harmonic content
factor
7
Noisy signals
8
Preliminary heating time
9
10
11
12
amplitude
Vibrations
frequency
Co-operating resistance thermometers
Co-operating thermocouples
Recording chart and printing
head
Zero
1% of the given value in the
table 3, item 5 and 6, column 3
0.5
-
Zero
Zero
0.1 mm
25 Hz
Acc. EN 60751+A2: 1997
Acc. EN 60584-1: 1997
Paper roll chart 32 m. and fanfold chart 16 m. long, acc.DIN 16230
Printing head type D33007A-66X-01 of DIA NIELSEN
NOTICE:
After using a recording chart from a new delivery, one must pay attention to the calibration point covering accuracy of the
beginning and the range end, printed on the chart after starting the recorder, with the appropriate lines of the recording
chart. In case of discrepancy exceeding 0.2 mm, it is recommended to execute the calibration of the range acc. the point
9.6 (parameters C8 and C9).
6
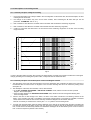
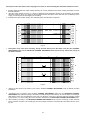
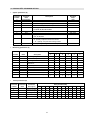
Table 3 – Rated operating conditions and additional errors1)
Item
1
1
2
2
Ambient temperature
Supply voltage
3
External magnetic field
4
5
6
Value, range or
reference conditions
Number
of the range
type
4
01...13
01...13
Measurement additional errors or attenuation
0...400 A/m
0...1 kΩ
0...50 Ω / lead 2)
0...100 Ω
0...50 Ω / lead 2)
01...13
01
02
03, 04
05...11
12, 13
0.1 % × range
< 50 µV / 1 kΩ
< 0.05 Ω
< 5.0 µV / 100 Ω
< 0.2 °C
Up to 2.5 x max value in the
programmed range
For a measured voltage above 5 V it
diminishes to the value x 1.2, at 10 V
01...13
≥ 60 dB
01...13
≥ 90 dB
Influencing quantity or
influencing factor
3
0...23...50°C
90...230...253 V
or 18...24...30 Vd.c./a.c
Resistance of the external
measuring circuits
Interferences by the serial
component:
50 and 100 Hz for
a 50 Hz supply network
60 and 120 Hz for
a 50Hz supply network
Interferences by the parallel component of the d.c.
and a.c. voltage:
50 and 100 Hz for a
50 Hz supply network
60 and 120 Hz for a
60 Hz supply network
100 V a.c. voltage
5
0.2% / 10°C
0.2 % × range
100 V d.c. voltage
1. Other operating conditions acc. the table 2
2. Resistances at least of two leads connecting the sensor to the measuring terminals №2 and №3or with appropriate
terminals for other measuring points should be equal. The resistance difference of these leads will cause a proportional displacement of the measuring range in relation to the recording chart line.
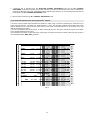
Table 4 – Values of testing voltages and insulation resistance.
Rms value of the test
voltage (kV)
2
Insulation resistance
MΩ
3
Measuring circuits and the housing
0.5 d.c.
40
Supply circuit and the housing
2.1 d.c.
100
Measuring circuits and the supply circuit
1.5 a.c.
100
Binary inputs and the housing
0.5 d.c.
40
Alarm circuits and the housing
1.5 a.c.
100
Ends of current circuits and the housing
0.5 d.c.
40
Kinds of electric circuit
1
7
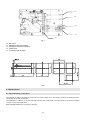
5.CONSTRUCTION
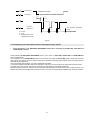
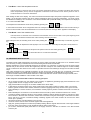
5.1. Recorder construction
The recorder housing (1) is made of a steel sheet and it is closed from the front by a door with a lock (2).
1
4
3
2
Fig.1
1.
2.
3.
4.
housing
door
chart rewinder
read-out field and keyboard
15
10
13
5
12
14
6
7
8
Fig.2
5. terminals of measuring signals
6. terminals of alarms
7. terminals of the network supply
8. terminals of the remote control
9. socket of the RS-232C or RS-485 interface
10. terminal plate
12. cover
13. stanchions
14. functional earth terminals
15. catches
8
9
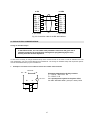
Catches (15) are situated on the housing walls and serve to fix the recorder in the panel by means of screw
holders entering into the composition of recorder accessories.
19
20
18
16
Fig.3
16.
17.
18.
19.
20.
set screw
printing head
power switch
sensor of the chart end
audible signal
4
2
17
3
Fig.4
9
27
28
29
30
26
Fig. 5
26.
27.
28.
29.
30.
bus circuit
package of the input system
package of execution systems
power pack
microcomputer package
Fig.6
6. INSTALLATION
6.1. Recorder fitting in the panel
The recorder is fixed to the panel by means of two screw holders put in the housing catches and entering into the
composition of recorder accessories.
The distribution of catches on the four housing walls and the construction of the door allow to fix several recorders
“in touch” on the front of the panel.
Basic assembly dimensions are shown on the Fig.6.
10
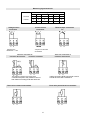
6.2. Connection to the terminal plate
NOTICE:
The recorder must be
earthed or zeroed
EXTERNAL CONTROL, SUPPLY
Kind
of control
Terminal
number
Terminal marking
External
(remote)
control of
binary signals
at the TTL
32
Mass
33
INT-EXT, switching of the chart
advance
Level or by
shortcircuiting and
opening the
inputs
34
START-IMPULS Release of single
recorder
measuring cycles
START -STOP Switching on/of
the chart advance
Phase conductor / + d.c. suplly
Neutral conductor / - d.c. suplly
Network
supply
Fig.7
11
35
L
N
Ground wire
Measuring signal terminals
Measuring channels
1
2
3
4
5
6
Terminal
1
4
7
10
13
16
number
2
5
8
11
14
17
3
6
9
12
15
18
Voltage source
connection
Signal source
Resistance < 1 kΩ
Current source
connection
Thermocouple connection
TC
Jumper from recorder
accessories
Two-wire connection of
resistance thermometer
resistance transmitter
Three-wire connection of
resistance thermometer
Leads connecting RTD to terminals 2 and 3
should have the same resistance.
The balancing resistance R should have
a resistance equal to the resistance sum of
both leads connecting RTD with terminals.
Three-wire resistance transmitter
Three-wire potentiometric transmitter
12
Alarm terminals
Relay Nr
1
2
3
4
5
6
7
8
9
10
11
12
Common terminal
Terminal Nr
19
20
21
22
23
24
25
26
27
28
29
30
Nr 31
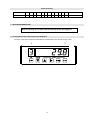
7. RECORDING SERVICING
Before removing the recorder from the housing switch the supply off
7.1. Description of the read-out field and keyboard
Functions of the read-out field and individual keys are depended on the recorder working mode..
1
7
13
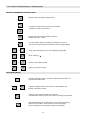
7.2. Functions of keyboard keys in working modes
MODE OF PARAMETER INTRODUCTION
- change of the active (flashing) display field
- change of the digit value( ± ), change of the symbol,
parameter number or test number
ENTER
STOP
- acceptance of the mode, parameter, parameter
number, digit value or setup
- end of the edition without changing the parameter and return to
the previous mode and further to the state of the recording stoppage
SHIFT
+
- setup of the decimal point on the active (flashing) display field
SHIFT
+
- setup of the sign “ “
SHIFT
+
- printout of the parameter setup
SHIFT
+
ENTER
- copying of the channel setup
RECORDING MODE
- recording stoppage with the connection of data buffering and return to
STOP
to
SHIFT
+
the parameter review mode
STOP
- recording stoppage with the disconnection of data buffering and
erasing of the buffer contents
- switching of the channel number with indications
of measurement results of the chosen channel, recording of all channels.
- sequential switching into the indication of the measurement printing
period and current feed , astronomical time, date, chart length
- exit to the indication of measurement results of all channels.
14
SHIFT
+
- printout of parameters from all channels
- protocol printout of the current measurements in channels or in
SHIFT
SHIFT
SHIFT
+
working mode indicating measurement results in the chosen
channel, printout of the current measurement result in this channel,
without a printout description
+
+
- printout of the recorder setup table
ENTER
- stoppage of the protocol and parameter printout and return to the
current recording mode
- printout of the chart archival description
RECORDING HANG-UP STATE ( MODE OF SELECTION AND REVIEW OF THE PARAMETER GROUP
- transition to data recording without clearing the buffer contents
SHIFT
+
- transition to data recording with clearing the buffer contents
- selection of the parameter group:
ENTER
- transition to the parameter edition
15
S - systemic parameter
P - measuring parameter
A - alarm parameter
C - setups
t - autotests
• Servicing of the memory buffer
SHIFT
+
- transition to the buffer servicing
- display of information about the oldest accessible data (hour, minute) memorized in
the memory buffer
- change of the minute value
SHIFT
+
SHIFT
+
- change of the hour value
- transition to the recording with printing of selected data from the
buffer, from the set time value
STOP
NOTICE:
- transition to the selection mode and review mode of the parameter group
• Each pressure of a single active key in the current mode and recorder working state is confirmed by
•
a short sound.
When realising functions requiring the use of two active keys in the current mode and working state, one
must as first press the key with the symbol placed at the left side of the sign “+”, and next the second
key, do not releasing the previous key.
7.3 FUNCTIONS OF DIGITAL DISPLAY FIELDS
• CH (first display field )
- displays the parameter group symbol (S, P, A, C, t )
or the parameter number
- displays the currently measured number or edited measuring
point (channel)
- a continuous lighting of the dot informs about the storage
or data emission from the buffer
- the flashing of the dot signals the exceeding of the buffer capacity
16
▪ ALARM ( 2 nd display field ) shows:
- exceeding of the measuring range upper limit
- exceeding of the measuring range lower limit
- exceeding of the programmed first
lower alarm value
- exceeding of the programmed next lower
alarm values
- exceeding of the programmed first upper alarm value
- exceeding of the programmed next upper alarm values
NOTICE: At a simultaneously exceeding of the measuring range and alarm value, only the exceeding of the measuring
range is signalled.
- Break of the measuring sensor
- Error in the temperature measurement of the terminal
or the measurement of the resistance sensor current .
The display of the dot switches off the display of the
programmed alarm value exceeding symbol.
When reviewing and introducing parameters:
- successive parameter number in the selected group
• VALUE ( character and four digits of the display field № 3...7 ) shows the character and the value of the measured
quantity on the given measuring point (channel) in units assigned by the user. The character “ “ is discriminated in
favour . The character is not displayed for a positive value.
17
8. PUTTING THE RECORDER INTO OPERATION
•
•
•
•
•
Open the recorder door
Remove the wedges protecting the chart rewinder
Take out the chart rewinder
Switch the supply voltage on
Insert the chart rewinder
After switching the supply on, the recorder enters in the working state in which it was before the switching off
( programming or recording ). With an efficient battery, parameters which were programmed before its switching off are
memorized in the recorder memory.
The transit graph between individual recorder working modes are shown on the algorythm, page 21
When there is a lack of rewinder, the recorder after switching the supply on, transits to the SELECTION AND REVIEW
PARAMETER GROUP mode.
After the occurrence of eventual disturbances in the work or some incidental parameter misregistrations in the recorder
memory, one must carry out the STATE RESETTING.
8.1. State resetting
The STATE RESETTING restores the operation efficiency to the recorder.
Parameters programmed by the user (except the time and date, the state of which remains without changes) are lost and
in their places, individual standard parameters programmed by the manufacturer from the EPROM memory are moved.
SHIFT
STOP keys when
The execution of the STATE RESETTING consists on holding the pressure state of
+
switching the recorder on.
After the execution of the STATE RESETTING the recorder remains in the SELECTION AND REVIEW OF THE
PARAMETER GROUP with the entry buffer switched off.
8.2. Selection and review of the parameter group
The recorder stores the data in the entry buffer
The flashing symbol of the systemic parameter S is displayed on the field № 1.
The printing head moves to the middle of the chart. In this working state, one can carry out operations concerning the
recorder servicing, defined by the functions of keyboard keys.
The buffer work is signalled by a continuous lighting of the dot on the display field № 1, according the description of readout field functions (p. 7.1 ). After the buffer capacity exceeding, signalled by the dot flashing on the field № 1
( p. 7.3 ), follows the record locking of writing new data in the buffer up to the time of printing its contents on the chart or
transiting to the recording with clearing the buffer memory ( p.7.2 ).
18
The pressure of the
“bu”
SHIFT
+
keys causes the transition to the memory buffer handling. The message
is displayed on the read-out field and the time corresponding to the oldest accessible data memorized in the buffer .
By means of the
SHIFT
+
+
or
key one can change the minute value and by
SHIFT
+
or
keys, the hour value corresponding to other data memorized in the buffer
The pressure of the
STOP
key causes the exit from the memory buffer servicing.
After a pressure of the
key the chart feed moves ca 10 mm and parameters of the record starting are
described.
Data stored in the buffer, from the data corresponding to the set time value are printed at the maximal speed.
After the emission of data from the buffer, the recording mode is going on (p. 13.8).
By pressing the
ENTER key one can transit to review parameters from the chosen systemic parameter
group (S), measuring (P), alarm (A) or recorder setups (C) without the change of setups and checking of the knowledge
of the “Opening word” (p.9.2), by means of the
group (S):
or
key, e.g. the date in the systemic parameter
The acceptance of the chosen parameter from the given group by pressing the
to the programming mode.
19
ENTER key causes the recorder transit
SUPPLY SWITCHING ON
NO
IS THE STATE RESET ?
Which was the recorder working mode before the supply
switching on ?
YES
Writing of standard parameters in the memory
RECORDING PROGRAMMING / STOPPAGE
SELECTION AND REVIEW OF THE PARAMETER GROUP
mode S / P / C /A / t
(Recording stoppage state)
PROGRAMMING
RECORDING
STOP
YES
YES
Is there a rewinder?
Is it the first entry?
NO
Checking of the opening word
Transit to the previous working mode
Recording mode of all channels or the
selected channel
WRONG
Mode of the released recording
NO
GOOD
PROGRAMMING OF PARAMETERS
- programming of measuring
parameters (P)
- programming of systemic
parameters (S)
- programming of alarms (A)
- programming of setups ( C )
t – test choice
20
8.3. Programming
The programming of the parameter is preceded by the checking of the “Opening word” (p. 9.2)
When trying to introduce the wrong opening word, the recorder returns to the SELECTION AND REVIEW OF THE
PARAMETER GROUP mode.
If it is not given differently in the order, the word is set on the value 0000, allowing to a free access to programming, and
at the same time it is possible to programme an “Opening word” of another value settled by the user (p.9.3,
parameter № 0 ( S0 ).
Instead to programme parameters in the recorder, the user can give them in the order. Parameters included
in the order are written in the EPROM memory and become standard parameters for the given recorder.
.
By pressing the
STOP
key one can return to the SELECTION AND REVIEW OF THE PARAMETER
GROUP mode without a renewed giving of the “Opening word”.
The pressing of the
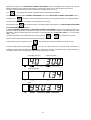
8.4. Recording
key initiates the recording without the reset of the buffer contents.
- and indication of measuring quantities
Channel number
Measured value in the channel
If the stored data in the buffer are not important, one can run the recording without clearing the buffer
contents by pressing
STOP
+
keys.
NOTICE:
After detecting the absence of the chart in the rewinder or a lack of rewinder, the recorder is switched off, however
measurements and indications will be realised.
When continuing the recording, the chart feed is switched on up to ca 10 mm (in order to tighten it ) and parameters
starting the recorder are described. For each channel, calibration points of the beginning and the end of the range,
memorised as the result of the lately carried out calibration (p.9.6), are printed.
Data stored in the entry buffer in the SELECTION AND REVIEW OF THE PARAMETER GROUP mode ( or stored e.g.
as the result of a recording break ) are printed on the chart at a maximal speed, after starting the printout of parameters
from the keyboard, immediately after the cessation of the reason which caused the storage of data in the buffer
After the transition to the recording, the mode which was realised before the SELECTION AND REVIEW OF THE
PARAMETER GROUP mode is going on:
•
RELEASED RECORDING mode
- on condition of the presence of an active
control signal state STOP BIN on remote
control terminals ( p.15 ).
•
ALL CHANNEL RECORDING mode
- with the indication of all channels.
•
SELECTED CHANNEL RECORDING mode
- the working state is distinguished by the
flashing of the chosen measuring channel number.
21
Measurement results in the SELECTED CHANNEL RECORDING mode are displayed and recorded only from the
selected measuring channel, others channels are monitoring from time to time to verify the presence of alarms.
The alarm state from monitored channels is written in the recording chart ( p.13.4.2 ).
The
key switches the number of indicated and recorded measuring channel.
The transition between the ALL CHANNEL RECORDING mode and the SELECTED CHANNEL RECORDING mode is
realised by the
ENTER
key at the moment when appears the number of the required channel on the display field №1.
The return to the previous mode requires a renewed pressure of this key.
The pressing of the STOP
key causes the break of recording modes and transition to the SELECTION AND REVIEW
OF THE PARAMETER GROUP mode.
In the ALL CHANNEL RECORDING and SELECTED CHANNEL RECORDING modes one can activate the printout of
parameter tables programmed in channels, the protocol of current measurement results in channels (channel), alarm
parameters and the recording setup state on the chart , if the parameter C6 in the Recorder setups ( C ) is on the state
“ON” ( p. 9.6 ).
The printout of tables can be interrupted in any time by pressing SHIFT + ENTER keys, after that, the recorder
transits to the recorder mode from which the printout was set in motion.
In all recording modes , the pressure of the
key releases the archival description of the chart ( p.13.6 ).
In both recording modes, by pressing the
key one can switch functions of read-out fields successively to
indicate the measurement recording period, the current speed of the recording chart feed and chart length remaining to
recording ( after a previous programming of the nominal chart length in the roll):
Recording period ( s )
Feed rate ( mm/h )
Astronomical time:
Dates:
22
Chart length in metres [m]
The leaving of the display in the selected state over 10 sec. Causes an automatic return to the state of measurement
result indication.
In the ALL CHANNEL RECORDING mode the pressure of the
key switches the currently indicated
measuring channel to the next number, without breaking the recording. In this working state , the number of the indicated
channel flashes and the measurement result in the selected channel is displayed. The measurement results of all active
channels are recorded.
After pressing the
key a return to the recorder initial working state follows.
8.5. Programming of the chart length
The pressure of the
ENTER key , during the indication of the chart length, causes the transit to its programming.
The 32 meter chart length is displayed on the read-out field and the first digit of the displayed number flashes.
One must programme the real chart length acc. “General principles of review and parameter programming”
9. RECORDER PARAMETERS
9.1. Set of programmable recorder parameters
• Systemic parameters (S)
Symbol
Name
0
1
2
3
4
5
6
7
8
9
S0
S1
S2
S3
S4
S5
S6
S7
S8
S9
PASSWORD
ID
DATE
TIME
PERIOD
INT.
EXT.
DISPLAY
REPORTS
REPORT AT
Description
Opening password blocking access to param. change
Recorder identification number
Calendar date
Astronomical time
Writing period of measurement results for all channels
Nominal chart feed rate
Chart feed rate set by external signal
Display time of measurement result on read-out field
Quantity of daily reports
Starting time of agreed day for report printing
Point
See point 9.3.
Nr
• Alarm parameters ( A )
Symbol
Name
0
A0
CHAN.No
1
2
3
4
A1
A2
A3
A4
AL. ACT
AL. TYPE
ALARM
AL. HYS
Description
Assignment of a measuring channel number or event
signalling
Relay activity type, A-active or P-passive
Alarm type, L(min) or H (max)
Alarm value
Alarm histerezis
23
Point
See point 9.5
Nr
Measuring parameters ( P )
Nr
Symbol
Name
0
1
2
3
4
5
6
7
8
9
P0
P1
P2
P3
P4
P5
P6
P7
P8
P9
TYPE
ACT
CON
ACJC/CJ/LR
IN. MIN
IN. MAX
O. MIN
O. MAX
O. UNIT
OBJECT
Point
Description
Measuring range number
Activity state of channels A-active, P-passive
Conversion way of input signal
ACJC compensation / CJ / line resistance
Lower and upper input signal
Lower and upper limit of indicated value on the read-out field
See point 9.4.
•
Unit of the indicated quantity (up to 7 characters)
Description of the channel (up to 9 characters)
• Recorder setups ( C )
Symbol
Name
0
1
2
3
4
5
C0
C1
C2
C3
C4
C5
6
7
8
9
C6
C7
C8
C9
BAUD RATE
PROTOCOL
LANGUAGE
DESCRIPTION
MESSAGES
ALARM
SPEED
KEY ACT
ALARM PRINT
C. MIN
C. MAX
Point
Description
BAUD RATE for the RS-232 lub RS-485 link
Transmission protocol (LUMBUS or MODBUS, as per order)
Chart description language (English)
Chart current description – ON, OFF
Setup of full or shorted form of message printing
Alarm parameters of printing and chart feed
Activity of releasing keys to print tables with parameters
Selection of printing kind in alarm state - dot or dash
Recorder electrical calibration (printing head setups in relation to
the 0% or 100% line on the recording chart)
See point 9.6.
Nr
9.2 General principles of reviewing and parameter programming
The initial state to review a defined group of parameters is the flashing letter on the display field №1, S ( systemic
parameters ), P ( measuring parameters ), A ( alarm parameters ), C (recorder setups ) or t (tests, described in the
p.18 ), chosen after the transition to the work in SELECTION AND REVIEW OF THE PARAMETER GROUP mode
By pressing
or
key one can choose the parameter group and by pressing the
ENTER
key, transit
to review individual parameters.
The parameter number on the display № 2 and its value is indicated in the remaining part of the field.
One can change the number of the displayed parameter by pressing the
or
key
In this way one can review current values of individual parameters. The review does not require the knowledge of the
“Opening word”.
A pressure of the
STOP
key causes the return to the selection of the parameter group.
24
The pressure of the ENTER
key will cause the transit to the programming of the selected parameter.
The first entry into the parameter programming, after switching on the supply or after the exit from the
recording mode is protected by the ”Opening word “ and if its value is different from 0000 we must check its
knowledge.
The checking consists on introducing all positions of the assumptive Opening word on read-out fields and comparing
with the included value in the recorder memory, programmed by the producer acc. the order or settled by the user.
The following inscription appears on the read-out field
By pressing the
or
By pressing the
key setup the value of the first flashing digit of the word on the display field №4.
key transit to the second digit, etc. By means of the ENTER
key accept the setup value.
If the given word was correct, the recorder enter in the programming mode of the selected parameter. If not, the message “ incorrect opening word ” is printed on the chart and the programme returns to the SELECTION AND REVIEW
OF THE PARAMETER GROUP.
The opening word is one of the systemic parameter and one can change them, knowing it up to the present value.
The change of the “Opening word” is carried on the base of the selection to programming the parameter № 0 in the
group of systemic parameters, after introducing previously the correct opening word.
After pressing the ENTER
key, the first digit of the selected parameter value will flash ( or the group of digits )
The change of the value of this digit ( or the group of digits ) is carried on by pressing the
By pressing the
or
key
key one can transit to the change of the next digit value ( or the group of digits ).
A pressure of the
ENTER
key accepts and ends the programming of the selected parameter, a transit to the
programming of the consecutive parameter follows.
A pressure of the
STOP
key or the programming of the last parameter of the given group causes a return to the state
of parameter review.
When trying to programme the parameter, at a value lower or higher, comparing to the nominal parameter value interval,
the message “Err L” or “Err H” is displayed on the field.
Message about a setup error
After pressing
SHIFT
+
keys , a message about the error will be printed on the chart with the information
about the appearance reason.
The pressure of the ENTER key, when the setup is incorrect will cause the return to the parameter edition with the
STOP
automatic correction of the setup value on the nearest correct value. The pressure of the
key will cause the
exit from the edition without the parameter change.
The detailed procedure depends on the selected parameter group S, P, A or C which individual parameters are
programmed in:
25
Systemic parameters (S)
The review and programming of systemic parameters acc. “General principles of reviewing and parameter
programming” ( p.9.2 )
• Measuring parameters (P)
After pressing the
ENTER
key the flashing digit 1 will appear on the display field № 1, marking the number of the first
measuring channel.
One can change the channel number from 1 to 6 by pressing the
The pressure of the STOP
.
or
key.
key causes the return to parameter group selection
ENTER
After choosing the number of the required channel and pressing the
key, the number of the channel remains on
the display field № 1, however the flashing digit “0” appears on the field № 2, marking the number of the first measuring
parameter, the value of which is indicated on the remaining part of the read-out field.
Channel № Parameter №
Range №
STOP
The pressure of the
key will cause a return to the channel number selection.
The review and programming of individual measuring parameters acc. “General principles of reviewing and parameter programming” ( p. 9.2 ).
The programming end of the last parameter in the channel and its acceptation causes the transit to the parameter review
in the selected channel.
The pressure of the
STOP
key in the channel parameter review mode will cause the transit to the channel number
selection with the automatic verification of alarm value setups in relation to the programmed lower and higher indicated
value limit (P6 and P7 parameters ). If there is a setup conflict, the relay with the incorrectly programmed alarm value will
be setup as a passive one (P). The alarm value depending on the alarm type L or H, is automatically setup on the O. MIN
or O. MAX value.
Measuring parameters programmed for the defined channel can be copied into another selected channel.
Choose by means o the
SHIFT
of ENTER
or
key , the number of the in-coming channel ( 1...6 ). The pressure
keys will cause the lighting of the message “COPY” and the flashing of the copied channel
number
on the display field № 7. The number of the copied channel can be changed by means of the
The setup acceptance by the ENTER
ber
or
key.
key will cause the copying of measuring parameters from the channel, the num-
of which is displayed on the display field №7 into the channel with the number displayed on the field №1.
26
№ of the in-coming channel
№ of the copied channel
NOTICE:
The copying of channel parameters, if it is the first entry in parameter programming, is protected by the procedure of
checking the knowledge of the recorder “Opening word”, as above.
After the parameter copying operation the display remains in the selection mode of the channel number on the field
№ 1.
• Alarm parameters (A)
After pressing the ENTER
key, the flashing relay number appears on the display fields № 6 and 7.
The channel number, which the relay or the symbol of assigned event signalling function to the given relay is programmed in, is displayed on the field №1 (acc. p.9.5, parameter A).
Channel №
By pressing the
or
Relay №
key one can change the relay number from 1 to 12.
The channel number, which the relay or the symbol of the assigned event signalling function to the given relay is
programmed in, is displayed together with the relay number.
By pressing the
STOP
key one can return to the selection of the parameter group. After the acceptance of the chosen
relay number by pressing the ENTER
key, the relay number stops flashing and the flashing digit “0” appears on the
display field №2 designating the number of the first parameter from the group of alarm parameters.
Information related to the currently selected parameter number for the given relay appears on fields №3...7.
Channel № Parameter №
Set up channel №
Relay №
The review of alarm parameters for the relay and their programming acc. “ General principles of review and parameter programming” ( p. 9.2 )
The programming termination of the last parameter for the selected relay and its acceptance by pressing the
ENTER
will cause the transition to the state of review alarm parameters for this relay.
27
The programming termination of the last parameter in the group of alarm parameters and its acceptance by pressing
the ENTER .
• Calibration setups (C)
The review and programming of individual parameters acc. “General princiciples of review and parameter programming” ( p.9.2 ).
• Tests (t)
After accepting the parameter ( t ) by means of the
ENTER key, the flashing digit defining the first test number appears
instead of the parameter symbol. The test number is selected by pressing the
The selection is accepted by the ENTER
TESTINGS, p.17.
Each procedure ends after pressing the
lows.
or
key.
key, transiting to the test realisation . Individual tests are described in
STOP
, key, after that, a return to the selection of the parameter group fol-
9.3. Description of systemic parameters (S )
Systemic parameters are not related with recorder channels. For the change of parameters see “General principles of
introduction and parameter review “.
SHIFT +
Setups of individual parameters, besides the parameter № 0, can be printed by pressing
keys.
Parameter № 0 ( S0)
PASSWORD (Opening word)
Parameter format: 0000...9999.
The password 0000 which allows to a free access to the recorder parameter programming is set up by the manufacturer
(if the orderer does not give another value).
The setup of a different password value protects the introduced parameters into the recorder against erasing or change.
It is only possible to review or printing them. In the review or recorder systemic parameter printing, its value different from
0000 is not printed. Only the symbol ”????” is printed.
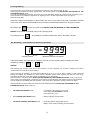
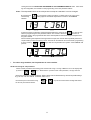
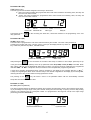
Parameter № 1 (S1)
ID (Identification number of the recorder)
Parameter format : 000...999
The number 000 is set up by the manufacturer or another number acc. the order. The ID number is used to identify
recording charts with the recorder and when communicating with a computer it represents the recorder address.
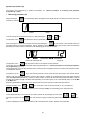
Parameter №
Identification № ( ID )
Parameter № 2 ( S2 )
DATE (Calendar date )
Format of the date insertion: year, month, day. When resetting the state, the current date is not cleared.
Parameter №3 (S3)
TIME (Astronomical time)
Format of time insertion: hours, minutes in the 24 hours’ system. When Resetting the state, the current time
is not cleared.
28
Parameter № 4 (S4)
PERIOD (printing period of the measurement result)
The value of this parameter defines the printing period of the measurement result on the recording chart from six
measuring channels.
This parameter can admit following values: 0 or 4, 6, 12, 24, 30, 60, 120, or 240 sec.
After the setup of the parameter value on 0, the printing period of the measurement result is proportional to the number
of currently connected active measuring channels:
PERIOD = number of connected channels x 1 sec.
Other measuring channels must be in the switched off state of the measurement and recording, id est, one must
programme the PO parameter on 00 *
* For this type of parameters the servicing of the C5 parameter is switched off (alarm speed)
Parameter № 5 (S5)
INT. (Nominal feed rate of the recording chart)
This parameter settles the chart feed rate when control terminals 32-33 (INT/EXT) are open.
The feed value can be selected from the row: 0 or 5, 10, 20, 60, 120, 240, 300, 600 mm/h.
For each selected feed value, different from 0, one can programme any optional dot period from the accessible ones.
When choosing, we should be guided by the criterion of the printout readability. The setup of the parameter on the “ 0”
means the printing and chart feed switching off.
Parameter № 6 (S6)
EXT. (Chart feed rate setup by an external signal).
This parameter settles the chart feed rate when control terminals 32-33 (INT/EXT) are short-circuited.
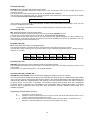
The feed value can be chosen from the row as in the table. To each chart feed value different from 0, a printing period is
assigned acc. the table:
5
mm/h
240 s
10
mm/h
120 s
20
mm/h
60 s
60
mm/h
30 s
120
mm/h
24 s
240
300
mm/h mm/h
12 s
12 s
600
mm/h
4s
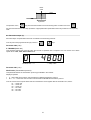
Parameter № 7 (S7)
DISPLAY (Exposure time of the measuring result on the read-out field)
This parameter value defines the exposure time of the measuring result in the succeeding measuring channel, on the
read-out field.
This parameter can admit following values: 1, 2, 4, 10, 20 or 40 sec.
Parameter № 8 (S8) and № 9 (S9)
REPORTS and 24 HOURS’ reports (Parameters settling the printout of 24 hours’ reports)
The 24 hours’ report includes actual values of all channels from each full hour or measurement mean values
in an one hour’ period, the maximal and minimal values in the channel described by their appearance time
and the mean value from measurements in the channel, in the time interval included in the report. During the
24 hours’ period, one can print 1...4 reports. The number of reports and the time which the conventional
24 hours’ period is counted from, are settled by the programming state of these parameters. A recorder
execution with a programme which data from each 30 minutes’ recorder operation are included in, is
available if ordered.
Programming of S8 parameter values on:
0
1 ... 4
- switches the 24 hours’ report off
- settles the number of printed reports in the 24 hours’ period, with actual measurement values of every
full hour in the time period included in the report.
1. ... 4. - settle the number of printed reports in a 24 hours’ period with mean values of measurements, for
the period of each individual hour, in the time interval included in the report.
29
Following numbers of the interval are programmed in the parameter S9:
00...23, describing a full hour which the conventional 24 hours’ period for the settlement of the report printout time will be
counted from. It is also the starting time of the first report printing. The report printout is automatically put in operation on
the base of the both parameter value.
The setup of the parameter S8 on the value 2 and parameter S9 on the value 13 means that during the 24
hours’ period counted from 13.00, two reports will be printed. The first at 13.00 and the second at 1.00.
The programming of the S6 parameter zero value (INT) switches the chart feed and current measurement
recording off, then only 24 hours’ reports are printed on the chart, acc. the state of S8 and S9 parameters.
After programming the parameter C7 (p.9.6) on OFF, 24 hours’ reports will be printed without channel
measurement results, from every full hour. As a standard, the parameter S8 is set up on the value 0. The printing of
24 hours’ reports is switched off.
NOTICE: The re-programming of one of the systemic parameter №2...5 in the recorder, having an influence on the
interpretation of written measurement results on the chart, after transiting from the recording hang-up state
into the recording mode will cause (P.13.1):
• the extension of the writing on the chart in the point corresponding to the time of the change introduction.
• the insertion of a current description line
• the transition into the recording acc. new setups.
9.4. Description of measuring parameters (P)
Measuring parameters are set up separately for each measuring channel. The parameter value changes acc. the point
General principles of introduction and parameter review”.
By means of
SHIFT
+
.
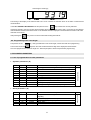
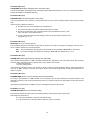
Parameter № 0 (P0)
TYPE (Number of the measuring range)
The programming and acceptance of the range number 00, means the measurement and recording switching off in the
given channel and the transition to the programming of the next parameter. The programming of the range from the
1...13 interval and the choice acceptance by pressing the
of the channel activity state
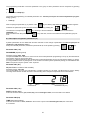
ENTER
Channel №, Parameter №
key will cause the transition to the programming
Range №
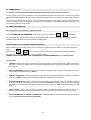
Parameter №1 (P1)
ACT (channel activity state)
Symbol choice:
•
A (Active channel) means that measurement results in the given channel will be recorded on the chart.
•
P (Passive channel) means that the value in the channel is measured but measurement results are not recorded on
the chart. Alarm relays assigned to this channel operate.
The exceeding of one of the programmed alarm value, when this alarm is programmed as active “A”, causes the
channel setup in the active state and recording of measurement results. If the P. ALARM parameter is switched on,
then the recording is carried on at the 600 mm/h chart feed rate and in a 4 seconds’ printing period, and lasts till the
moment of the alarm state retention.
30
Channel № Parameter №
The pressure of the
parameter.
ENTER
Channel activity
key will cause the setup acceptance and transition to the programming of the next
Parameter nr 2 (P2)
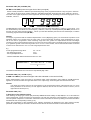
F. PT (Conversion way of the input signal)
The parameter defines the function of the signal conversion in the channel or the conversion of several channel
input signals into the value indicated on the display and recorded on the chart, in the selected measuring
channel. The described conversion function is the value of three consecutively programmed digits.
Parameter №
Conversion function (3 digits)
•
The first digit defines the kind of mathematical operation in the current channels:
0 - linear conversion of the signal
1 - extraction of roots
•
The second digit defines the kind of mathematical operation between measuring channels:
0 – without operations between measuring channels
1 – addition
2 – subtraction
3 – averaging
4 – multiplication
•
The third digit defines:
The in-coming channel number for the mathematical operation defined by the second parameter digit. The result of the operation between input values and the in-coming values of the given channel is printed and indicated in the in-coming channel, instead the measuring value in this channel after the conversion into the output
value acc. the programming state of the in-coming channel output parameters.
0
- without operations between measuring channels
1...6 - selected in-coming channel number
The programming of the conversion function for the channel № 1 and № 3 as “ 033 ” means that the input value measured in the channel №1 is printed without changes in this channel and the output value measured in the channel №3 is
averaged together with the measurement input value from the channel №1 and the result of this operation after the conversion into the output value from the programmed interval O. MIN.....O. MAX (variation interval of the conversion function) for the channel № 3, is printed and displayed in the channel №3. The programming of the radical conversion function in the channel means that the currently measured input value Ux corresponds to the value Uout, indicated on the
read-out field and printed on the chart.
It is recalculated acc. the formula:
Uout = (O. MAX – O. MIN ) x SQRT ((Ux – IN. MIN )/(IN. MAX – IP. MIN)) + O. MIN
Negative Ux values are treated as a “0” value.
31
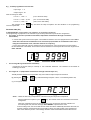
E.g. , for data programmed in the channel:
Input range
1...5
Output range 4...20
After recounting we obtain:
For Ux = 1, Uout = 4
(0 % of the chart width)
For Ux = 3, Uout = 15.312
(70.7 % of the chart width)
For Ux = 5, Uout = 20
(100 % of the chart width)
The pressure of the
of the next parameter.
ENTER
key will cause the setup acceptance and the transition to the programming
Parameter № 3 (P3)
CJ/LR (ACJC/CJ compensation, line resistance or transmitter resistance)
The programming way depends on the selected range number (Parameter PO) and sensor configuration:
• For ranges: 4, 12 and 13 (resistance transmitter, temperature measurement through a resistance
thermometer):
- in a three-wire system and two-wire system with a balance resistance one must programme the value “000.0”
Each other value will be considered as a line resistance (LR) and taken in consideration when calculating the measurement result , what will cause an error uprising.
- In a two-wire system with a known resistance of the connecting line, one must programme a value equal to
the total resistance of both leads. We introduce the line resistance as a fixed point value from the range interval
000.0...999.9 Ω.
•
For the range № 3 (potentiometric transmitter):
- programme the actual value (or nominal) of
a floating point value.
•
the transmitter resistance. The resistance is introduced as
For ranges 05...11 (temperature measurement through a thermocouple TC )
The P3 parameter defines the compensation way of the thermocouple cold junction reference.
By pressing the
or
key, settle the flashing inscription “ACJC” or the flashing letters “CJ”,
e.g. in the symbol “CJ23”.
ACJC – settles the self-acting compensation of the thermocouple cold junction temperature.
After the selection acceptance by the
configuration.
ENTER
key, the recorder check the correctness of the sensor
When the temperature sensor of the cold junction is not connected or there was a break in its
circuit during the work, then the message “ACJC BREAK” is printed on the chart.
In the recording mode, the current date and the event time will be additionally described. After that, the
recorder continues measurements and the recording, taking as a base the last correct temperature
value of the reference junction. The message about the sensor break will be renewed after each re-
32
cording start from the SELECTION AND REVIEW OF THE PARAMETER GROUP mode. After checking the configuration, the transition to the programming of the next parameter follows.
CJ23 – The temperature 23°C of the cold junction is setup as a standard. It can be changed.
By pressing the
successively
selection.
key, one passes to setup the values ( on basis given in the p 9.2) of the
flashing digits of the fiducial temperature or returns to the CJ/ACJC
Accept the carried out selection of the fiducial temperature by means of the ENTER key, then the transition for programming the next parameter follows. The recorder takes into
account an
allowance equal to the programmed value of the CJ temperature while measuring the temperature in
the given channel.
When measuring the temperature through a thermocouple, the recorder tests impulsively the thermocouple break by means of a testing current. This test can be switched off for all channels, programming
a dot by pressing
+
keys, after the compensation kind symbol of the CJ/ACJC cold
SHIFT
junction.
•
For other range numbers, the P3 parameter is not accessible.
NOTE concerning P3...P6 parameters.
Values of these parameters are floating-point numbers with a sign. The sign “minus” is set on the display №3
by means of
+
keys . When there is a positive value of the parameter , the sign does not
SHIFT
distinguish oneself and the field is blanked. Same values can be introduced by several equivalent ways.
E.g. +5 mV, one can write in as 5.000, 5.00, 5.0, 5.
The decimal point is introduced using
we want to place the dot flashes.
SHIFT
+
33
keys at the moment when the digit after which
Parameter №4 ( P4 ) and №5 ( P5 )
IN. MIN and IN. MAX ( lower and upper limit of the input signal)
Values of these parameters define the input measuring range of the programmed channel. They are given in characteristic units for the given range number (Table №1). Admissible parameter values are given in the Table №1, column 4.
The value of the upper range limit must be higher than the lower range limit, preserving the minimal range span acc. the
Table №1, column 5.
The P4 parameter can be programmed in the interval from the lower range limit (Table 1, column 4 ) up the range , up to
the value limited by the interval of its minimal span ( Table №1, column 5). The P5 parameter ( IN. MAX ) can be set in
the span from the upper range limit (Table 1, column 4) to the value limited by the interval of its minimal span, in relation
to the early programmed P4 value (IN. MIN ) .
NOTICE:
For ranges programmed with the unilateral displacement of zero (Magnifying glass), one must attach importance to the
additional relative error resulting from the lower value of the programmed measuring range (displacement of zero).
We do not need to programme a lower measuring range with a too greater zero displacement because advantages
resulting from the increased absolute read-out accuracy from the recording chart or the digital scale can be compensated
by a significant growth of the measuring relative error. For a 0.5 class recorder, the IEC 484 standard settles a maximal
increase of the absolute error on 0.2 % of the range displacement value.
E.g.
For the programmed range № 01
- the measuring range is
- the range displacement is
20 ... 24 mV
4 mV
20 mV
- maximal admissible relative measurement error acc. IEC:
Relative error =
0.2 × 20 + 0.5 × 4
= 1.5%
4
The relative measurement error can reach a comparatively high value
Parameter № 6 ( P6 ) and № 7 (P7 )
O. MIN and O.MAX ( the lower and higher value limit indicated on the read-out field ).
During measurements of the input value, a proportional output value expressed in units settled by the P8 parameter,
appears on the read-out field. The upper limit value of the output range must be higher than the lower limit value.
NOTICE:
The display and printing format of the result depend on the programmed position of the decimal point for one of
these parameters. If the accuracy of both digits are different, then the less accurate number is chosen ( less of
digits after the decimal point ).
Parameter № 8 ( P8 )
O.Unit (Unit of the indicated value)
After selecting the range type number (P0 parameter) O.Unit sets itself suitably on mV, mA, Ω, or °C. If this meets the
user’s requirements, it does not need to be programmed. The user can change the unit programming, for each channel a
new unit symbol composed of 7 characters. Consecutive ASCII characters are chosen by setting on the read-out field the
hexadecimal code corresponding to them (p. 22).
During the programming of this parameter group, following information are displayed on the field: Channel number,
parameter number being the successive character number and the set ASCII character in the hexadecimal code.
34
The acceptance of the set character by pressing the
ENTER
key will cause the transit to the programming of the next
unit character ( of the parameter). After the programming of the seventh character by means of the
ENTER key,
one accept the setup of the all unit symbols and the transit to the programming of the next parameter group
( information text ). For the unit symbol with a smaller number of characters, the setting and acceptance of “00” digits on
the read-out field ends the programming of this symbol and causes an immediate transit to the programming of the information text ( P9 parameter )
Channel number
Parameter number Character number
ASCII sign in the Hexadecimal code
The units of the indicated value ( e.g. kW, km, hour, etc.) are not displayed during the recording, however they are
printed in the measurement protocol.
Parameter № 9 ( P9)
OBJECT ( Information description of the channel )
The user can programme 9 alphanumeric characters for each channel, printed in the section OBJECT of the parameter
table. Consecutive characters are chosen by setting the ASCII character in the hexadecimal code on the read-out field
( p.22 )
The programming of the text and the display field description as for the P8 parameter. The setup and acceptance
of “00” digits by means of the
ENTER
key or the pressure of the
STOP
key will cause the transition to the pa-
rameter review in the channel.
NOTICE:
The reprogramming of measuring parameters having an influence on the interpretation of written measurement results on the chart, after the transition from the SELECTION AND REVIEW OF THE PARAMETER
GROUP into the recording mode, will cause:
• the date printing from the buffer acc. hitherto existing setups,
• extension of the recording on the chart at the moment when reprogramming the parameters,
• insertion of the message “Setup change” < date, time >,
• printing of data acc. new setups.
9.5. Description of alarm parameters ( A )
Alarm parameters are set up for each of the 12 accessible relays. The assignment of individual relays to measuring
channels is optional.
One can print setups of individual parameters by means of
SHIFT
+
keys.
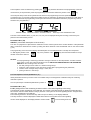
Parameter № 0 ( A0 )
P. NK ( Assignment of the measuring channel number or the event signalling to the relay )
The parameter number is displayed on the field № 2. The number of the selected relay is displayed on fields № 6 and
№ 7 and the channel number which this relay is placed in or the symbol of the event signalling function assigned to the
given relay, is displayed on the field № 1.
The measuring channel 1...6 which the relay will be set up in is flashing on the display field № 4.
The relay which the number is displayed on fields № 6 and № 7 or the symbol of the event signalling
function will be displayed on the display field № 4: sensor breaks
35
or the recording chart end
.
Channel № Parameter №
Setting channel №
Relay №
The setup of the measuring channel number 1...6 by means of the
or
key and the setup acceptance
ENTER
by means of the
key will cause the assignment of chosen relay to the measuring channel which the number
is set up on the display № 4. Then, a transition to the relay parameter programming follows and the selected measuring
channel number is displayed on the field № 1.
If the relay was previously assigned to another measuring channel than indicated on the field № 1, it is set up as passive
(P). If primarily, the relay was of L type ( H ), then the alarm value is set up on the lower ( higher ) programmed range
limit in the selected channel.
Other earlier set up parameters are not subject to change.
The setup of the measuring channel number 1...6 and the setup acceptance by means of the ENTER key will cause the
assignment of the chosen relay to the measuring channel which the number is setup on the display № 4. Then, the
transition to the relay parameter programming follows, and the selected measuring channel number is displayed on the
field № 1.
If the relay was previously assigned to another measuring channel than indicated on the field № 1, it is set up as passive
( P ). If primarily, the relay was on type L ( H ), then the alarm value is set up on the lower (higher) programmed range
limit in the selected channel. Other earlier set up parameters are not subject to change.
The setup of the sensor break symbol or the chart end symbol by means of the
or
key and the setup
acceptance by the ENTER key will cause the assignment of the sensor break signalling function (detected by
the KE8 recorder) or the chart end function to this relay.
The chosen relay function symbol is displayed on the display field № 1.
Parameter № 1 ( A1 )
ACT (Relay activity type )
This parameter can assume two meanings:
•
“ P “ – inactive alarm, the recorder does not react in case of an alarm state exceeding or a chosen event
occurrence .
•
“ A “ – active alarm, the recorder signals and records the exceeding of the alarm setup value or signals the
chosen event occurrence.
Channel №
Parameter №
Type of alarm activity
If the relay is placed in the measuring channel, a pressure of the
Relay №
ENTER
key, after choosing the type of alarm
activity, causes the transit to the programming of the next alarm relay parameter.
If the function of event signalling is assigned to the relay , the pressure of the
ENTER key , after choosing the type of
alarm activity, will cause the setup acceptance and the transition in the monitoring state of relay parameters
( parameters A2, A3, and A4 are inaccessible ).
36
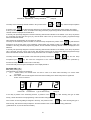
Parameter № 2 (A2)
TYPE (Alarm type)
The alarm type L or H should be assigned to each relay in the channel.
L – means, that after exceeding the programmed alarm level value towards the decreasing value, the relay will
short-circuit its make contacts.
H – means, that after exceeding the programmed alarm value towards the increasing value, the relay will
short-circuit its make contacts.
Channel №
The pressure of the
relay parameter.
Parameter №
Alarm type
Relay №
ENTER key after choosing the alarm time, causes the transition to the programming of the next
Parameter № 3 (A3)
ALARM (Alarm value)
The alarm value is programmed in units of the indicated value by the recorder. The value of this parameter is
a floating-point number with a sign. The sign “minus” is set up on the display field № 3 by means of
SHIFT
keys. When the parameter is positive, this field is blank.
Channel № Parameter №
After pressing the
+
Alarm value
ENTER key, the correctness of the alarm value setup in relation to other setups previously set up
in the given channel of relays (alarms) and to set up parameter values P5 (O. MIN) and P6 (O. MAX) is checked. Alarm
relay values of H type must be algebraically higher than for relays of L type and must be contained in the programmed
interval O. MAX ....O. MIN . If setups are correct, a transition to the next parameter programming will follow.
A setup error regarding programmed output values is signalled on the display by the message “Err H” or “Err L’’.
A setup error regarding the alarm value of another relay in the channel is signalled on the display by the message Err,
informing about the relay number which the setup generates a conflict.
The pressing of the
ENTER
key will cause a return to the parameter edition with the automatically corrected
setup value into the nearest correct value.
Parametr nr 4 (A4)
AL. HYS ( Alarm hysteresis )
The alarm hysteresis defines the difference between the increasing and decreasing value of the measured signal, defining in percentage the output range of the given channel causing the short-circuiting or opening of active relay working
contacts. The hysteresis value is a fixed-point number. It is programmed in the range 0.1...1.5 % of the output range
(measuring parameters P5 and P6 ).
Channel № Parameter №
Hysteresis value
37
Alarm
value
Hysteresis
The pressure of the,
ENTER
key will cause the transition into the monitoring state. An earlier use of the
STOP
key will cause the exit from the setup procedure of appropriate alarm parameters without any influence on their primary
state
9.6. Recorder setups (C)
Recorder setups are parameters which are not related to the measuring channels
One can print each programmed setup by means of
SHIFT
+
keys .
Parameter № 0 ( C0 )
P. TRANSM (Baud rate )
This parameter defines the baud rate when the recorder co-operates with a computer. One can choose one of these
speed values: 1200, 2400, 4800 or 9600 bauds.
Parameter №
setup value
Parameter № 1 ( C1 )
PROTOCOL (Transmission protocol)
This parameter defines the transmission protocol type installed in the recorder.
Displayed symbols:
•
•
L - means that the recorder is executed with the LUMBUS transmission protocol.
P < 1...6 > - means that the recorder is executed with the MODBUS transmission protocol.
One can choose and accept the ASCII and RTU transmission mode together with the information unit, where :
P1 –
P2 –
P3 –
P4 –
P5 –
P6 –
ASCII 7N2
ASCII 7E1
ASCII 701
RTU 8N2
RTU 8E1
RTU 801
38
Parameter № 2 (C2)
LANGUAGE (Description language of the recording chart)
This parameter defines the language which messages and description will be printed in. One can choose the description
English (the letter E on the display field № 7).
Parameter № 3 (C3)
DESCRIPTION (Current description of the chart)
The current description line is printed in such time intervals so that one of them is always visible in the recorder recording
field.
After the setup of parameter values on:
0 - the printing of the current description line is switched off,
1 - the current description line limited to the time description is printed,
2 - the full current description line is printed (recorder name, identification number, colour
code, chart feed, current date and time ),
3 - the full current description line and analogue scales are printed during the archival chart
description ( p. 13. 6 )
Parameter № 4 (C4)
MESSAGES (Form of message printing)
This parameter defines the information scope which is printed on the chart in the shape of messages, after the occurrence of events related to the recorder operation.
ON
OFF
- the event description printing (alarm, sensor break) and the message “Chart end” are switched on
- the event description printing and the message “ Chart end” are switched off. (p. 13. 6 ).
Parameter № 5 (C5)
ALARM PAR. (Alarm parameters of printing and chart feed)
After switching the parameter on “ON”, recording parameters are depended on the current alarm state. After reaching
the alarm state , programmed for any optional relay, we can settle in the recorder:
- the 600 mm chart feed,
- the 4 sec printing period.
After the decay of the alarm state in the recorder, a return to primary recorder parameters follows. When the parameter
is set up on “OFF”, after the occurrence of the alarm state in the recorder, programmed recording parameters are not
subject to change.
Parameter № 6 (C6)
PARAMETERS (activity of keys releasing the printing of tables)
The setup of the parameter on “ON” activates in the recording mode, the keys releasing the parameter printout of all
channels, the printout of the current measurement protocol in channel, the printout of setup tables and the chart archival
description.
After switching the parameter on “OFF”, the keys controlling these printouts are inactive.
Parameter nr 7 (C7)
ALARM RECORD (Record in the alarm state)
This parameter defines the printing way of measuring results in the channel during the alarm state.
After setting the parameter on:
P – a dot line is printed like in the work state without alarm,
L – in the duration area of the alarm state a dash line ( 2-point ) is printed.
39
Parameter № 8 (C8) and №9 (C9)
C. MIN and C. MAX (electrical calibration of the recorder)
This is a procedure, in which on the base of the calibration of the printing head end position on 0% and 100% lines of the
recording chart, information about the lower and upper recording limit positions are introduced into the recorder memory.
These positions correspond to lower and upper limits of measuring ranges for recorder channels.
Parameter number
Calibration setup
After choosing the C8 and C9 parameter, the printing head takes the appropriate position near the 0% or 100% chart
line, and the printing head end displacement is indicated (in mm) on the display field № 5...7, regarding the reference
point settled by the producer for the start ( 0% ) or end ( 100% ) of the chart graduation line.
Passing to the calibration setup programming, one can displace the printing head end by means of the
towards the increasing values and by means of the
0.21 mm, in the interval -5.0...0...5.0 mm.
By pressing the
SHIFT
+
key
key towards the decreasing values, with a jump of
keys one can print check points on the chart corresponding to the setup values.
After each printout, the chart shifts of one step.
We accept the set up value of calibration setups by pressing the ENTER key.
NOTICE:
The recorder is delivered with set calibration setups.
After any replacement of the recording chart, check if the printing head end positions, corresponding to the lower and
upper limits of the measuring range, cover the 0% and 100 % recording line width on the chart. Deviations no exceeding
0.2 mm are admissible.
When they are higher, one must carry out the electrical calibration of the recorder.
10. REPLACEMENT OF THE RECORDING CHART
The producer deliver the ordered recorder with a loaded roll chart.
31
32
34
28
36
Fig.8
28. Rewind roll
31. Roller with dogs
32. Cover
34. Guide
36. Side plates
40
When replacing the Z-fold chart one must:
•
•
•
•
•
•
deflect the guide (34) and pulling it, take the chart rewinder out from the recorder,
take the recorded chart out from the cassette,
open the unwinding cassette,
insert a new chart into the unwinding cassette, pull ca 10 cm of chart out and shut the cover (32),
put the chart with the perforation on the roller dogs (31) and shut the guide (34),
insert the chart rewinder into the recorder.
When replacing the roll chart one must:
•
•
•
•
•
•
•
•
deflect the guide (34) and pulling it, take the chart rewinder out from the recorder,
take the rewind roll (28) out together with the recorded chart,
take the flange (metallic) out from the rewind roll (28),
holding the chart, make several rotations of the second flange in the opposite direction towards the chart winding,
remove the chart from the roll,
insert a new chart into the unwinding cassette, pull ca 15 cm of chart out and shut the cover (32),
insert the chart end into the rewind roll slot and wind 2...3 reels,
put the chart with the perforation on the wheel dogs (34) and put the rewind roll (28) into the cassette with the pins
into the slots of side plates (36 ) and shut the guide (34).
11. REPLACEMENT OF THE PRINTING HEAD
The printing head applied in the KE8 recorder enables the printing of min. 750,000 dots in each of the six colours.
This number depends on the chart quality. Breaks in printing, decay of dots or a distinct diminution of their diameter,
testify about the ink using up of the given colour.
When replacing the printing head one must:
•
press the
•
•
deflect the read-out field with the keyboard (4),
take the used printing head out from the carriage and insert a new one.
STOP
key ( if the recorder operates)
41
42
17
4
S
S
S
Fig.9
17. Printing head
41. Carriage
42. Carriage guide
41
12. LUBRICATION
For lubrication use the oil RENOLIN MR30 (FUCHS Company) being in the recorder accessory set.
Every 6 months of the recorder exploitation, remove accumulated impurities with a clean cloth., next lubricate frictional
surfaces (indicated by the letter S on the Fig.9) in the chart rewinder and in the chart drive gear with a small quantity of
oil.
Every 3 months of the recorder exploitation, remove accumulated impurities on the carriage guide (42) with a clean cloth.
Put on the carriage guide a small quantity of oil (two drops) and distribute it, displacing the carriage several times, and
next wipe the guide from the oil excess.
13. CHART DESCRIPTION
13.1. Description in the parameter programming mode
In the PARAMETER PROGRAMMING mode (p.8), one can by means of
SHIFT
+
keys obtain
the value printout of each programmed or monitored parameter in the given format, on condition that the
rewinder will be placed in the recorder with a recording chart.
13.2. Description in the parameter printing mode (passport)
After transiting into the recording mode (p.8) one can obtain the parameter printout defining the recorder programming
state.
After pressing SHIFT
+
keys, the cyclic recording of measurement results is interrupted and following
parameters are printed on the recording chart in the shape of tables:
ALARMS, INPUT PARAMETERS, USER’S PARAMETERS, SYSTEM PARAMETERS and the SETUP STATE.
Printed tables:
•
ALARMS including: date about the parameter programming state of individual alarm relays together with their assignments to measuring channels. Data concerned the programmed relay to signal sensor breaks or the chart end
are not printed.
•
INPUT PARAMETERS including: data about input quantities measured by the recorder, the description of the measured quantity and the kind of sensor ( INPUT ).
•
USER’S PARAMETERS including: data about input signals and the additional information description programmed
by the user (OBJECT) relating to the measuring channel (max. 9 alphanumeric characters).
•
SYSTEM PARAMETERS including: general recorder parameters (no related with measuring channels) completed
by the name of the KE8 recorder type. For the S0 parameter (Password). Symbols “????” are printed on the chart
if a password of another value than 0000 is programmed in the recorder, or “0000” if the password has the value
0000.
•
SETUP STATE including: data concerning parameter setups no related with measuring channels such as the
interface type and kind of data exchange protocol, baud rate, format and chart description language, key activity.
•
INPUT PARAMETERS and USER’S PARAMETERS for individual channels are described in the colour of the given
channel. Only active channels are described !
42
Description of tables:
• ALARMS
Symbol
C
RELAY
ALARM
A L. TYPE
AL. ACT
AL. HYS
Parameter description
Number of the measuring channel
Relay number (1...12)
Alarm value in output units
Alarm type: L-minimum, H-maximum
Alarm activity: A-active, P-passive
Alarm hysteresis (0.1...1.5%)
• INPUT PARAMETERS
Symbol
C
ACT
TYPE
CJ/LR
IN. MIN
IN. MAX
O. UNIT
INPUT
Parameter description
Number of the measuring channel
Channel activity: A-active, P-passive
Range number
Type of the cold junction compensation (ACJC/CJ) or resistance
of leads, or transmitter resistance
Lower limit of the input signal
Upper limit of the input signal
Unit of the input signal
Measured value or kind of sensor
• USER’S PARAMETERS
Symbol
C
O. MIN
O. MAX
O. UNIT
CON
OBJECT
Parameter description
Number of the measuring channel
Lower limit of the indicated value in user’s units (O. UNIT)
Upper limit of the indicated value in user’s units (O. UNIT)
Unit of the indicated value given by the user
Function of signal conversion
Information description of the measuring channel
43
6
6
5
5
4
4
3
3
2
2
1
1
12
11
10
9
8
7
6
5
4
3
2
1
1002
-8998
3000
-7000
5000
-5000
7000
-3000
9000
-1000
9000
999
K
P.NR
ALARM
H
L
H
L
H
L
H
L
H
L
H
L
ALARMS
ON
ON
ON
ON
ON
ON
ON
ON
ON
ON
OFF
OFF
1.0
1.0
1.0
1.0
1.0
1.0
0.5
0.5
1.0
1.0
1.0
1.0
TYPE A.ACT
H.AL
INPUT PARAMETERS
6
5
4
3
2
1
A
A
A
A
A
A
K
ACT
01
01
01
01
01
01
-9998
-8000
-6000
-4000
-2000
-2
2
2000
4000
6000
8000
9998
mV
mV
mV
mV
mV
mV
TYPE CJ/RL IN.MIN IN.MAX
VOLTAGE
VOLTAGE
VOLTAGE
VOLTAGE
VOLTAGE
VOLTAGE
UNIT
USER’S PARAMETERS
6
5
4
3
2
1
K
-8998
-7000
-5000
-3000
-1000
999
1002
3000
5000
7000
9000
9000
O.MIN O.MAX
ID
EXT.
INT.
PERIOD
TIME
DATE
REPORTS
PASSWORD
REC.
mV
mV
mV
mV
mV
mV
000
000
000
000
000
000
O. UNIT F.PT
OBJECT
OBJECT
OBJEKT
OBJECT
OBJECT
OBJECT
OBJECT
SYSTEMIC PARAMETERS
999
120mm/h
30mm/h
240s
7:06
1999.12.04
3 OD 15:00
????
KE8 v.1.00
Fig.10
44
6
5
4
3
2
1
INPUT
•
SYSTEM PARAMETERS
Symbol
Parameter description
ID
EXT.
INT.
PERIOD
TIME
DATE
REPORTS
PASSWORD
RECORDER
After pressing the
Recorder identification number
External speed of the chart feed
Internal speed of the chard feed
Printing period of measurement results
Astronomical time
Date
24 hours’ reports
Opening Word (???? or 0000)
KE8 – recorder symbol
SHIFT
+
keys the cyclic recording of measurement results is broken and parameters in
the shape of the table SETUP STATE are printed on the chart.
Table:
SETUP STATE includes: recorder data concerning parameter setups no related with measuring channels such as:
transmission parameters, format of chart descriptions, description language activity of keys releasing the printing of parameter tables, recording parameters in the alarm state.
SETUP STATE
INTERFACE
BAUD RATE.
PROTOCOL
LANGUAGE
DESCRIPTION
MESSAGES
ALARM SPEED
ALARM RECORD
PARAMETERS
KE8
RS 232
9600
P1
P
2
ON
OFF
L
ON
ID.999
1999.12.11
Fig.11
Table description:
• SETUP STATE
Symbol
INTERFACE
BAUD RATE
PROTOCOL
LANGUAGE
DESCRIPTION
MESSAGES
ALARM SPEED
ALARM REC.
KEY ACT
Parameter description
Kind of interface as per order (RS-232 or RS-485)
Baud rate (transmission speed)
Transmission protocol (LUMBUS or MODBUS option)
Description language of the chart (English)
Setup of the current description line printing format
Information scope printed on the chart in shape of messages
Alarm recording parameters switched on or off
Recording line in the alarm state (1 or 2 dot lines)
Activity state of keys activating the table printout
45
10:28
13.3. Description in the protocol printing mode
In the “RECORDING” mode (p.8.4) one can print current measurement results and other selected parameters.
After pressing
SHIFT
m.
+
keys, the recording of measurement results is interrupted and the
MEASUREMENT
RESULT protocol is printed on the chart.
This protocol includes results of current measurements in channels or in the channel, the unit of the indicated quantity,
the value of the first exceeded alarm state in the channel with the alarm type description (L or H), and after exceeding
the measuring range limit, its value with the description of the exceeding direction ( MIN or MAX ).
When there is a sensor break, instead of parameters: VALUE, O.UNIT, RANGE.O, the message BREAK OF THE
SENSOR CIRCUIT is printed.
The description line is the integral part of the protocol, this line includes the date, the starting time of the printout and the
recorder identification number.
Parameters of individual channels in the protocol are described in the colour of the given channel.
Only active channels are described !
MEASUREMENT RESULTS
3
2
1
450.0
20.00
K
VALUE
KE8
mV
mA
mV
O.UNIT
9000MAX
RANGE.O
ID.999
30.00 L
8700 H
BOILER 3
BOILER 2
BOILER 1
ALARM.O
OBJECT
1999.12.03
Fig.12
Table description:
• MEASUREMENT RESULTS
Symbol
C
VALUE
O. UNIT
RANGE. O
ALARM. O
OBJECT
Parameter description
Number of the measuring channel
Current value of the measured quantity in user’s units (O. UNIT)
Unit of the indicated quantity given by the user
Limit value of the exceeded measuring range
Setup value of the exceeded 1 alarm state
Information text of the measuring channel
46
9:00_
13.4. Descriptions in recording modes
13.4.1. General principles of diagram recording
1 – the current description line is always visible in the recording field. It includes the date, the time description, the time
marking and the chart feed,
2 – the change of the notation way from dot into dash notation, after exceeding the H alarm limit (for the C7
parameter - ALARM REC. Set on “L” ),
3 – lack of notation in case when the recorded value in the alarm state exceeds the measuring range limit,
4 – lack of notation in case when the recorded value exceeds the lower measuring range limit,
5 – notation in case when the alarm limit is in line with the lower measuring range limit on the line of the recording
range lower limit.
•
•
•
•
•
•
•
•
5
•
•
•
•
•
•
•
_
_
_
_
•
_
•
_
•
2
•
_
•
_
•
_
•
•
••
•
•
•
3
•
•
4
•
_
•
•
•
•
•
•
•
•
_
_
INT.240 1999.12.11 21:12_
12
Fig.13
In case of the alarm state recording, after choosing the dash notation, the dash end counted in the direction of the signal
change generating the exceeding set up alarm value, corresponds with the measured value.
13.4.2. General principles of chart description creation and diagram read-out
1. The description of the time and feed included in the current description line constitutes the base for the read-out of
the defined value occurrence time on diagrams in the recorder recording field. One can switch the printing of this
description off.
2. The description of the time; time and date; or time, date and feed:
n in the ALL CHANNEL RECORDING or SELECTED CHANNEL mode, relates to the first dot of the printed
diagram after the description.
n each recording release in the RELEASED RECORDING mode, relates to the dots of diagrams following after
each recording release.
3.
When in the time of date storage in the buffer, an alarm occurs which cancels the non-alarming contents of the
buffer, or the recording start with a cancellation of the buffer contents follows, or the buffer is overfilled, in all these
cases, these events cause the loss of time continuity and data for diagrams in all recorder channels.
The loss of continuity is marked on the chart by the < = > symbol in each recording mode.
4. If events and messages which were not already delivered on the chart at the moment when the alarm cancelling the
non-alarming contents of the buffer occurs, then only the alarm occurrence time will be described and at the same
time, events will be simultaneously realized and described. Messages will be described by their actual occurrence
time in the next sequence ( without a time marker ).
47
5. In the RECORDING OF THE SELECTED CHANNEL mode, other channels are only monitored on the presence of
alarms every now and again. The value on the selected channel is recorded at the period equal to the programmed
dot time and after each dot-marking of this channel, the measurement and eventually the recording of the alarm state
for one of the consecutive active monitored channel follows.
6. The occurrence of an alarm in the monitored channel during the data storage in the buffer, in the RECORDING OF
THE SELECTED CHANNEL mode does not erase the non-alarming buffer contents.
7. The switching without the erasing of the buffer contents in the RECORDING OF THE SELECTED CHANNEL mode
or the return to the ALL SELECTED CHANNEL mode, during the delivery from the buffer to the chart follows only after the delivery of remembered data in the previous recording mode.
13.4.3. Exemplary chart description in the ALL CHANNEL RECORDING mode (after switching the recording on,
without the erasing of the buffer contents)
1 - Damage of the cold junction temperature sensors. Measurements and recordings on the channel with thermocouples
are still continuing taking into consideration the last correct cold junction temperature value.
2 - The current description line is moderately printed during the chart feed on the background of diagrams. One current
description line is always visible in the recording field of the recorder and defines the time base for the diagram readout through the time, feed and date printout.
3 - Break of the measuring sensor TC or RTD. After the description of the time and event name, the recorder breaks the
further diagram recording for this channel.
4 - Recording stoppage and transition into the SELECTION AND REVIEW OF THE PARAMETER GROUP mode.
The time, date and operation name are described. The recorder remembered data to be recorded on the chart, in the
buffer.
5 - Control recording of calibration points of the beginning (0%) and range end (100%), recorded after starting the recording in the SELECTION AND REVIEW OF THE PARAMETER GROUP mode.
6 - Starting the recording in the SELECTION AND REVIEW OF THE PARAMETER GROUP mode. The recorder
displaces the chart ca 10 mm, marks the calibration points of ranges and describes the status line including the time,
date and name of the realized operation, the chart feed, channel colour code and the recorder identification number.
Then, eventual messages /10/ and /11/ are described. If a chart replacement was carried out in the SELECTION
AND REVIEW OF THE PARAMETER GROUP mode, then all these operations and descriptions will be related to the
new chart.
7 - Starting the recording of data stored in the buffer in the SELECTION AND REVIEW OF THE PARAMETER GROUP
mode (recording in the unreal time). Data maintain the continuity and are described by the same time and date as before the recording suspension /4/ (and not by the time and date /6/, as above). Additionally, the existing till now feed is
also described because it was assumed in the description example, that in the SELECTION AND REVIEW OF THE
PARAMETER GROUP mode the chart feed value was reprogrammed on 120 mm/h and the data in the buffer are
stored and delivered on the chart at existing till now recording parameters (feed and dot time). If the feed has not
been changed, then this line does not include its description and the feed described on the line /6/ is current
(the same as in the line /2/).
48
•
•
–
•
•
AL H
–
•
•
•
•
13
1000 OBJECT 1
•
•
•
•
•
•
•
•
•
•
•
•
•
•
•
•
•
•
10
11
•
•
INT.120
•
•
•
•
•
•
INT.60
I•
•
•
•
•
•
•
•
9
1999.04.11 10:00_
8
5
•
•
•
•
•
•
•
•
•
10:05_
•
•
•
•
•
•
•
•
•
•
•
•
•
•
•
•
•
•
•
•
•
1999.04.11
•
SENSOR BREAK OBJECT 2
ACJC BREAK
START
123456 ID999 INT.120
12
•
•
9:00_
7
5
1999.04.11 10:00_
6
•
•
STOP
1999.06.11 9:00_
4
SENSOR
ACJC
•
•
•
•
BREAK
•
•
••
•
•
•
BREAK
•
•
•
•
•
•
•
•
•
•
OBJECT 2
•
•
•
•
•
INT.60
•
•
•
•
•
•
•
•
•
•
•
•
•
•
•
•
•
•
•
•
•
•
•
•
•
•
•
•
•
1999.04.11
•
•
•
•
•
•
•
•
•
•
• 8:45_
•
•
•
•
•
8:30_
•
•
3
•
2
5
8:15_
1
•
•
••••••
Fig.14
8 - Data delivery from the buffer with the new feed 120 mm/h programmed in the SELECTION AND REVIEW OF THE
PARAMETER GROUP mode. If there was no change of feed, this line will not be described.
9. - Alarm occurrence during the data delivery from the buffer. The alarm type symbol, alarm value and the information
description of the object are printed.
NOTICE:
The delivery of data /12/ stored during one hour lasts a determined time, during which the data are still stored in the
buffer and their delivery on the chart continues to run in the unreal time. When it occurs, the first alarm erases nonalarming data which have not been delivered on the chart yet. A loss of the time continuity and non-alarming data follows
in favour of the assistance by the buffer in the scope of record and description on the chart, during the alarm state. This
loss is marked by the sign < = >. The recording time of the first dot in the alarm state, the direction of the alarm level
exceeding and the INFORMATION CHANNEL DESCRIPTION (OBJECT) are described on the chart in the channel
colour.
10 - The message after starting the recording /6/, reminding about a break occurrence in the TC or RTD measuring
sensor, are described in the colour of the given channel.
11 - The message after starting the recording /6/ reminding about a break occurrence in the reference cold junction
sensor circuit.
12 - Recording of the buffer contents stored in the SELECTION AND REVIEW OF PARAMETER GROUP mode on the
chart.
49
13 - Record of the alarm state at the lately set up feed equal 120 mm/h from the described hour (for the C5 parameter
programmed on “OFF” ).
•
Recording stoppage and renewed switching of the recording on, with the erasing of the buffer contents
•
•
•
AL.H
•
•
•
•
•
•
•
•
•
•
••
•
99.99
OBJECT
1
•
10
11
•
SENSOR BREAK OBJECT 2
ACJC BREAK
START BIN 123456 ID999
•
•
•
•
•
•
•
SENSOR
BREAK
•
10:30_
•
•
•
•
•
•
•
INT.120
•
•
•
•
•
•
•
•
•
•
-
•
•
STOP
•
•
•
•
•
•
•
•
•
-
•
9
•
•
•
•
1999.10.11 10:25_
•
6
5
1999.12.11
4
•
•
•
•
•
•
•
•
•
•
•
•
•
•
•
•
OBJECT 2
9:25_
8:45_
•
•
•
Fig.15
After the stoppage /4/ and transition into the SELECTION AND REVIEW OF THE PARAMETER GROUP mode, data
which are to be recorded are stored in the buffer. After starting the recorder /6/ with the erasing of the buffer contents /12/
and the description of eventual messages /10/ and /11/, the recording of the diagram dots on the chart runs currently at
the level of described parameters in the status line /6/. The loss of the time continuity and data because of erasing the
buffer contents is marked on the chart by the symbol <=>. The first alarm /9/ occurs already during the current recording
time, after which the buffer does not store data, thus the alarm /9/ does not erase its contents and data preserve their
continuity.
•
Recording of the alarm state at recording alarm parameters
•
•
•
•
•
•
•
•
•
•
•
•
•
•
•
•
•
•
•
•
•
•
•
•
INT.120
•
•
•
•
•
•
•
•
•
•
•
•
•
•
•
•
•
•
•
4s 600
Fig.16
50
14
13
•
09.12_
10:34_
-
-
10:30_
9
The line describing the first alarm /9/ occurrence includes the alarm feed description and the time marker. After the decay of the alarm state recorded at alarming parameter, a return occurs to the hitherto existing recording parameters
described by the time and feed parameter in the line /14/. During the recording of the alarm state carried on at the alarm
parameters, commands concerning the change of recording parameters are not taken into consideration. These commands will be realized after finishing the record of the last parameter in this mode. The last command concerning the
same parameter will be taken into consideration.
•
Chart description when changing the chart feed by binary signal INT-EXT.
•
•
•
•
•
•
•
•
EXT.240
•
•
•
•
•
•
•
•
•
•
•
•
•
•
•
•
•
•
•
•
•
•
INT.120
•
•
•
•
•
•
10.25_
2
10.10_
1
•
•
• 1999.12.11
•
•
•
•
•
Fig.27
1 - line of the current description including in this case the basic chart feed description ( INT),
2 - description line of the chart feed change (INT), by the binary signal (EXT), into the second programmed feed value.
The time , feed value and command source are described.
•
Chart description when delivering data from the buffer, to give the command to change the feed by the
binary signal INT-EXT remembered and stored in the buffer.
•
•
•
•
•
•
•
•
•
•
•
•
5
•
•
•
•
•
•
INT.120
•
•
•
•
•
16:00_
3
•
4
Fig.18
3 - description line of the command to change the feed into INT remembered in the buffer.
4 - data stored in the buffer and delivered on the chart (in the unreal time) at hitherto existing recording parameters.
5 - data stored in the buffer and delivered on the chart (in the unreal time) with a time base corresponding to the modified
feed value.
51
Description of the chart after a power stoppage occurrence or after exceeding the admissible interference level.
1- recording stoppage after the supply voltage switching off or when interference increases, making impossible a correct
recorder operation.
2 - after the supply voltage recovery or a decay of interference and automatic renewal of the recording, the recorder
advances the chart ca 10 mm, prints out the message with the description of the date and time of switching off the
supply, concerning the last dot stopping the recording.
3 - message about the recorder starting. The calibration point and status line are printed.
•
•
•
•
•
START
•
•
•
•
•
•
•
•
•
•
123456 ID999
•
•
•
•
•
INT.120
•
•
•
•
•
•
•
•
•
•
1999.12.11 10:25_
•
1999.12.11 10:24_
•
POWER OFF
3
2
•
•
•
•
•
•
1
•
•
•
•
•
•
Fig.19
•
Description of the chart when transiting, during the data delivery from the buffer, from the ALL CHANNEL
RECORDING mode into the SELECTED CHANNEL RECORDING mode and inversely, without the erasing of
the buffer contents.
1
3
•
•
•
4
•
•
•
5
•
•
•
•
•
•
5
•
•
•
•
•
_
•
16:00 _
4
15:30_
2
_
•
_
3
•
•
•
•
•
•
•
•
•
•
•
•
•
•
•
•
•
1
Fig.20
1 - delivery of data stored in the buffer on the chart in the ALL CHANNEL RECORDING mode, at defined recording
parameters.
2 - description line of switching from the ALL CHANNEL RECORDING mode into the SELECTED CHANNEL
RECORDING mode (with the erasing of the buffer contents) during the data delivery /2/ from the buffer. An erasing of
data follows, which were not delivered on the chart yet. Because of the loss of the time continuity and data, marked
by the symbol <=>, the recording time of the first dot is described in the SELECTED CHANNEL RECORDING mode.
3 - data recording (currently) in the SELECTED CHANNEL RECORDING mode, with the monitoring of other channels
for the presence of alarms. The recording in the case of alarm occurrence in channels № 1 and № 5 is shown on the
Fig. 20.
52
4 - description line of switching from the SELECTED CHANNEL RECORDING mode into the ALL CHANNEL
RECORDING mode (with the erasing of the buffer contents). An erasing of data follows, which were not delivered on
the chart yet. Because of the loss of the time and data, marked by the symbol <=>, the recording time of the first dot
is described in the ALL CHANNEL RECORDING mode.
5 - data recording currently in the ALL CHANNEL RECORDING mode.
13.5. Chart description when printing 24 hours’ reports.
A 24 hours’ report includes actual measurement results (in output units) of all active channels (from each full hour) or
mean values in channels, calculated from measurements in 1 hour’ time intervals, maximal and minimal values in the
channel described by the real occurrence time and the mean value of all measurements in the channel, in the time
interval comprised by the report.
If in hours comprised by the report printout, an alarm state L (H) occurs in the given channel, the symbol of the alarm
type is printed beside the output value.
If an exceeding of the lower or upper limit of the output range occurred in the channel, instead of the value, the symbol of
the exceeding direction MAX ( MIN ) is printed.
24 H REPORT
TIME:
MIN:
7:55 12:00
19.00L 5.000
TIME:
MAX:
11:31
19.91
AVG:
6:00
7:00
8:00
9:00
10:00
11:00
12:00
TIME
O.UNIT
K
KE8
15:23
-3.12L
12:00
5.00
7:05
5.300H
8:00
7:00
12.2 -2.57
8:25
5.22
19.55
5.201
12.0
-2.99
5.09
19.08L
19.43
19.45
19.30
19.56
19.88
20.00
MAX H
5.199
5.200
5.170
5.200
5.123
5.000
12.0
12.0
12.2
12.1
12.1
12.0
12.0
MIN L
-2.57
-2.99
-3.10
-3.00
-2.67
-3.00
4.55
5.00
5.20
5.19
5.11
5.01
5.00
mA
1
ID.999
12:00
12.00
ACTUAL VALUE
mV
kg
2
3
mV
4
V
5
6
123456 INT.120 1999.12.11 12:00_
Fig.21
53
Table description
•
24 H REPORT
Symbol
Parameter description
C
O. UNIT
TIME
DATE
AVG.
INT / EXT
CURR. VALUE
AVERAGE VALUE
ID
Measuring channel number
Output unit
Astronomical time
Current date
Average of measurements
Chart speed
Current value
Mean value
Recorder identification number
13.6. ARCHIVAL DESCRIPTION OF THE CHART, PRINTING OF ANALOGUE SCALES
The printing of the current chart description starts in each recording mode and in the SELECTION AND REVIEW OF
THE PARAMETER GROUP mode by pressing the
key. Depending on the C4 parameter value (p.9.6) the
current description includes following data:
recorder name, identification number, colour code, chart feed, current date and time or only the time.
The full current description of the chart with the message CHART END is automatically printed after the detection of the
chart end if the C4 parameter (p.9.6) is set up on ON.
CHART END
REC.KE8 ID.999
123456 INT.120 1999.12.11 21:12
Fig.22
After the setup of the C3 parameter value on 3, the printing of the full current chart description and analogue scales for
the active measuring channels described by output units, starts by pressing the
key.
Each scale is printed and described in colour corresponding to its channel.
Range values for lines 0% and 100% of the chart width and some graduations are described by numbers. If the range is
displaced, with the zero within the limits of the chart, the scale graduation corresponding to the range zero value is
described.
Markers of set up active alarms are situated on the scale of the given channel, for the alarm of L type:
, and for the
alarm of H type:
.
Lines resulting from the linear partition of this interval are printed between the described scale graduations.
54
4
12
20
K 3
mA
-10
1000
K 2
0
20
40
mV
0
500
1000
K 1
mV
REC.KE8
ID.999
123456 WEW.120 1999.12.11 12:00_
Fig.23
13.7. CHART DESCRIPTION WHEN PROGRAMMING RECORDER PARAMETERS
One can print the setups of particular recorder parameters from the parameter group S, P, A and C by pressing the
SHIFT
+
keys.
For systemic parameters (S) and recorder setups (C), the parameter symbol (e.g. C5), parameter name and the value of
the accepted setup are printed on the chart.
For the measuring parameters (P), the parameter symbol (e.g. P1), measuring channel number, parameter name and
the value of the accepted setup are printed on the chart.
Descriptions are printed in the channel colour.
At alarm parameter setups (A), the parameter symbol, the channel number, the number of the selected relay in the channel, the parameter value (in output units) and the output terminal number (TERMINAL) of the chosen relay are printed on
the chart.
These descriptions are printed in the colour of the concerned channel.
C5
PARAMETERS
= ON
P1 K1
ACT
= A
A3 K1
S1
P01 ALARM
ID
= 99.99
TERMINAL No 19
= 999
Fig.24
13.8. CHART DESCRIPTION WHEN RECORDING WITH THE BUFFER CONTENTS REPRODUCTION
1 - starting of the recording,
2- stoppage of the recording and transition into the SELECTION AND REVIEW OF THE PARAMETER GROUP mode,
3- starting of the recording from the SELECTION AND REVIEW OF THE PARAMETER GROUP mode, with the data
printing from the buffer acc. the programmed time value.
55
•
•
•
•
•
•
•
•
•
•
START
3
•
STOP
•
2
•
•
•
•
•
•
•
•
START
•
•
•
•
•
•
•
•
•
• ID.999
•
•
•
•
•
•
•
•
•
•
123456
•
•
•
•
•
•
•
•
•
INT.240
•
•
•
•
•
•
•
•
•
•
1999.10.04
•
•
•
•
•
•
•
•
•
•
•
16:02_
•
1999.06.11 16:04
•
•
•
•
•
•
•
•
•ID.999
•
•
•
•
•
•
•
•
•
123456
•
•
•
•
•
•
•
•
•
INT.240
•
•
•
•
•
•
•
•
•
•
1999.10.04
•
•
•
•
•
•
•
•
•
16:00_
•
1
Fig. 25
14. DESCRIPTION OF THE REMOTE CONTROL
14.1. Description of binary functions of control signals
Binary signals START BIN, STOP BIN and START-IMPULS are foreseen to organize the synchronic operation of
recorders and for individual recorder applications in continuous recordings or recordings released by events, without the
mediation of a communication interface.
•
TTL signal at 0 V level or the short-circuiting of the control output by means of a key with a max. 20 mA load-carrying
capacity, for a defined binary signal realizes:
⇒ INT-EXT – choice of the programmed remote released chart speed (EXT- external),
⇒ START BIN-STOP BIN – stoppage of the chart feed and recording,
⇒ START-IMPULS – printout release of one recording line of measured values together with the chart
description.
•
TTL signal at +5 V level or opening of the control input for the defined binary signal realizes:
⇒ INT-EXT – choice of the programmed rated speed of the chart feed (INT – internal),
⇒ START BIN-STOP BIN – starting of the chart feed and recording.
After the reception of the STOP BIN signal , the recorder is on the watch state in which the chart driver is stopped and
the recorder carries on measurements, indications of measurement results and signallings for individual channels and
remembers data in the buffer.
56
START BIN
Released recording
STOP BIN
to
STARTIMPULS
t1
T
T
T
All channel
mode
recording
to ≥ 10 ms
t1 ≥ 1 ms
T – duration time of the
released work cycle
Fig.26
14.2. Exemplary chart descriptions when controlling by binary signals
•
Chart description in the RELEASED RECORDING mode when controlling by START BIN, STOP BIN and
START IMPULS signals.
When realizing the RELEASED RECORDING mode, a joint action of STOP BIN, START BIN and START-IMPULS
binary signals follows.
The acceptance of the START-IMPULS signal in the watch state (after the STOP BIN signal) causes the feed start
during which, the printout of current values measured on particular measuring points follows and the recording chart is
described by the release time.
At the first release after midnight , the date is additionally described.
If successive releases take place before the description of previous, they are stored in the input buffer and they will be
recorded on the chart in order of their time succession and described by real release parameters.
Measured quantity values for which the record of different channels falls in the same place on the recording chart for one
release are printed with a displacement of the time axis, so that the record was always readable from all active channels.
57
•
•
•
•
••
•
•
•
•
•
••
•
•
•
•
•
••
•
•
•
•
•
••
•
START BIN 123456 ID999
•
•
•
----
•
•
•
•
••
•
INT.240
1999.12.11 03:25_
•
6
-
•
02:51_
_
•
•
•
•
-
•
02:20_
•
AL.H
•
•
1000
•
•
•
•
_
OBJECT 1
•
00:44_
•
•
5
•
00:11_
_
•
•
•
•
•
1999.12.11 00:10_
•
•
•
SENSOR BREAK
•
•
•
•
4
•
OBJECT 2
23:14_
•
•
3
•
22:51_
_
•
•
•
•
•
•
22:21_
_
•
STOP
•
•
••
•
•
•
•
BIN 123456 ID999
•
•
••
•
•
••
•
•
••
•
22:18_
1999.12.10 _ 22:12_
•
•
••
•
•
••
2
1
Fig.27
1 - Stoppage of the chart feed and recording by the STOP BIN signal. The recorder continues measurements, indications
and signallings.
2 - Starting of the RELEASED RECORDING mode by the START-IMPULS signal. The reception time of the signal
releasing the record is written on the chart. After finishing the chart description, diagram dots are printed on the base
of current measurement results.
3 - Automatic release of the record caused by the detection of an RTD or TC measuring sensor break in one of the
channel. The time and event name are described in the channel colour in which this event occurred. After the sensor
break occurrence, the diagram recording for this channel is not continued.
4 - First release after midnight described by the date and time.
5 - Automatic release of the record caused by an alarm occurrence. The alarm occurrence time and its name is described on the chart. All descriptions are made in the channel colour related to this event.
6 - Signal START BIN ending the RELEASED RECORDING mode ( return to the measurement result recording).
The status line, including the time and date of the signal acceptance and its name, colour code for diagrams, recorder
identification number and the speed of the recording chart feed, is described on the chart.
If because of too frequent releases, data have been stored in the buffer, then they will be delivered on the recording
chart before the execution of the STAR BIN command.
58
•
Recording and description of individual releases in the RELEASED RECORDING mode
•
•
•
• •
•
20:26_
•
•
•
• •
•
20:35_
<=>
•
•
•
• •
5
•
18:35_
•
•
•
• •
•
18:15_
SENSOR BREAK OBJECT 3
STOP BIN 123456 ID999
4
INT.120
1999.12.11 20:25_
3
•
2
•
STOP
•
1999.12.10 18:12_
•
•
• •
1
•
18:00_
•
•
•
• •
•
17:45_
.
Fig.28
1. Setup of the recorder in the SELECTION AND REVIEW OF PARAMETER GROUP mode by pressing the
STOP
key.
The time , date and name of realized operations are described.
2. - Control recording of calibration points of the beginning (0%) and range end (100%) described after the recording start
in the SELECTION AND REVIEW OF THE PARAMETER GROUP mode.
3. - Recording start, without the erasing of the buffer contents, in the SELECTION AND REVIEW OF THE PARAMETER
GROUP mode by pressing the
key.
The recorder displaces the chart ca 10 mm, carries the range calibration points in and describes the status line including
the time, date, name of realized operations, channel colour codes and the recorder identification number. Then,
messages /4/ are described. If an exchange of the recording chart has been carried out in the SELECTION AND
REVIEW OF THE PARAMETER GROUP mode, then, these operations and descriptions will refer to the new recording
chart.
4. - The exemplary message, after the recording start, reminding the servicing personnel about the existing break in
the sensor circuit, is described in the colour of the concerned channel.
5. - First release after the buffer capacity exceeding – a loss of time continuity and date follows, noted on the chart by the
<=> mark.
59
When starting the recording /3/ with the erasing of the buffer contents, its contents will not be printed and the first release
after the recording start will be described by a later time (or at least the same time) than the recording starting time /3/.
•
Chart description when controlling by the START BIN / STOP BIN SIGNAL
START BIN 1 3 56 ID999
INT.120
1999.12.11 10.25_
-
1999.12.10 09.12_
-
2
STOP
BIN
Fig.29
1- Stoppage of the chart advance and recording by the STOP BIN. The recorder continues measurements, indications
and signallings. The recording chart is described by the time and date.
2 - The change of the signal state into START BIN causes a recording restart. The status line, containing the time, date
of the signal acceptance and its name, colour code of active channels for diagrams, recorder identification number
and the speed of the recording chart, are described on the chart.
The STOP BIN / START BIN signal can be used to the simultaneously recording start when applying many recorders to
service a defined process, without the mediation of a communication interface.
15. STATEMENT OF RECORDER MESSAGES
Message
Description of the message
Sensor break <...>
Message informing about a break in the measuring sensor circuit printed
together with the time description of the break occurrence.
ACJC break
Message printed on the recording chart informing about the lack of the
ACJC temperature sensor connection, break in its circuit or when the input
package configuration does not match with the recorder execution.
INIT
Message on the display informing about the lasting of STATE
RESETTING
Error
Message on the display informing about incorrect data in the recorder
memory.
Err H ( Err L )
Message on the display when trying to introduce a too high or too small
parameter value.
Err
Message on the display informing about the transducer operation range
exceeding in the recorder measuring system (together with the range
exceeding symbol or the measuring sensor opening circuit symbol )
Power down
Message printed on the chart informing about the time of the supply
switching off or about the time of the admissible interference level
exceeding.
New conditions <...>
Message printed on the chart after changing measuring parameters in the
channel
CHART END
Message printed after detecting a lack of recording chart in the chart rewinder.
60
16. PRODUCER’S STANDARD SETUPS
•
•
System parameters (S)
Parametr
number
Parametr
name
0
1
2
3
4
PASSWORD
ID
DATE
TIME
PERIOD
5
6
7
INT
EXT
DISP
8
REPORTS
9
REPORT AT
Standard
setup
0000
000
Production date
current
6s
Opening password to programming 0000....9999
Recorder identification number 000...999
Calendar date ( year, month, day )
Astronomical time ( hour, minute )
Recording period:
4, 6, 12, 24, 30, 60, 120 or 240 s.
0 or 5, 10, 20, 60, 120, 300, 600 mm/h
0 lub 5, 10, 20, 60, 120, 300, 600 mm/h
Display time of the measurement result:
1, 2, 4, 10, 20, 40 s
0 - the 24-hour’s report printing is switched off
1...4 - quantity of reports with current values
1. ... 4. - quantity of reports with average values
00...23 –printing starting time of the first report
20 mm/h
300 mm/h
4s
0
00
Measuring parameters (P)
Parameter Parameter
•
Description
number
name
0
1
2
3
TYPE
ACT
CON
CJ / LR
4
5
6
7
8
9
IN.MIN
IN.MAX
O.MIN
O.MAX
O.UNIT
OBJECT
Parameter
Measuring channel number/setup
description
1
2
3
4
5
6
Measuring range number
01
01
01
01
01
01
Channel activity state
A
A
A
A
A
A
Input signal conversion
000
000
000
000
000
000
ACJC compensation or line
resistance
Minimal input value
-2
-2000
-4000
-6000
-8000
-9998
Maximal input value
9998
8000
6000
4000
2000
2
Minimal indicated value
999
-1000
-3000
-5000
-7000
-8998
Maximal indicate value
9000
9000
7000
5000
3000
1002
Indicated value unit
mV
mV
mV
mV
mV
mV
Channel information description OBJECT OBJECT OBJECT OBJECT OBJECT OBJECT
1
2
3
4
5
6
Alarm parameters (A)
Parameter
Parameter
Parameter
number
name
description
0
1
2
3
4
CHAN. No
AL. ACT
AL. TYPE
ALARM
AL. HYS
Relay number/setup
1
2
3
4
5
6
7
8
9
10
11
12
Channel number 1
1
2
2
3
3
4
4
5
5
6
6
Alarm activity
A
A
A
A
A
A
A
A
A
A
A
A
Alarm type
L
H
L
H
L
H
L
H
L
H
L
H
Alarm value
999 9000 -1000 9000 -3000 7000 -5000 5000 -7000 3000 8998 1002
Alarm histerezis 0.5 0.5 0.5 0.5 0.5 0.5 0.5 0.5 0.5 0.5 0.5 0.5
61
•
Recorder setups (C)
Parameter
number
Parameter
name
Description
Standard
setup
0
BAUD RATE
9600
1
PROTOCOL
2
LANGUAGE
Transmission speed 1200, 2400, 4800, 9600
bauds
Transmission protocol:
Lumbus - L
Modbus - P1...P6
Chart language description: English - E
3
DESCRIPTION
4
MESSAGES
5
ALARM SPEED
6
PARAM. PR
7
ALARM REC
0 - chart current description switched off
1 - current description limited to the time printing
2 - full line of the current description (code,
colours, chart advance speed, date and time
are printed)
3 - printing of the actual description line and
analogue scales
Message printing:
switched on - ON
switched off - OFF
Alarm speed:
switched on - ON
switched off - OFF
Printing of parameter tables switched on - ON
switched off - OFF
Recording in the alarm state:
dot line - P
dashed line - L
L
E
2
ON
ON
ON
L
Standard setups can be agreed with the customer or changed during the recorder exploitation, through changing the
EPROM memory on the base of a separate ORDER FORM filled in acc. information included in the KE8 recorder catalogue card.
Parameters included in the order are recorded into the EPROM memory and they are individual parameters for the given
exemplar of recorder.
Parameters changed by the user during the recorder exploitation are recorded into its working memory and take part in
the recorder operations instead of appropriate standard parameters.
In case of an eventual incidental error in the recorder memory, one must carry out the “STATE RESETTING” which
restores the operational efficiency to the recorder.
The “STATE RESETTING” causes the loss of programmed parameters by the user (excepting the time and date, the
state of which remains without changing) and into their places, individual standard parameters are transferred from the
EPROM memory.
17. TESTS
After choosing test procedures designed by the letter “t” in the selection of the parameter group mode and accepting the
setups by pressing the
key, the flashing number of the first test 01 appears on the display.
ENTER
By means of the
he test by pressing the
test number selection.
or
key,
choose
the
number
of
the
required
ENTER key. The stoppage of the test by pressing the
62
STOP
test
procedure
and
start
key causes the return to the
•
Test № 01 – test of the digital field
This test serves to check the work of the display segments
The start of the test begins the cyclical display of the translocating digit 8 and the decimal point on successive display
fields. During the test, the point of the field № 1 is not displayed.
The pressing of the ENTER key stops the cyclical display. In order to change the lighted display fields one must press
the
•
key. The pressing of the ENTER
key causes the return to the cyclical display mode.
Test № 02 – printing of the ASCII character table
After starting the test, the full table of ASCII characters in the HEX code, accessible in the KE8 recorder to programme
the chart description, is printed.
• Test № 03 – test of alarm relays
This test serves to check the work of 12 alarm relays, their setups and activity declaration. The test allows the
identification of alarm outputs, in each active measuring channel assigned to individual alarm terminals and
facilitates the correct connection of external executing alarm circuits.
After starting the test, the relay № 1 is connected and the inscription including successively, the channel number in which
the relay is set up, the activity state A ( P ), alarm type L( H ) and the relay number appear on the display field.
The pressing of the
key causes the display of the channel number and the alarm value set up for the given relay.
The short-circuiting of the relay output contacts follows simultaneously independently on the set up activity state.
A renewed pressure of this key restores the previous state of information display and the contact opening.
The pressure of the ENTER key switch the test over on the information display about the next relay number.
• Test № 04 – test the astronomical time clock.
The test serves to check the time setup accuracy.
After starting the test, the astronomical time with a 1 sec resolution appears on the display.
It will be updated every second.
• Test № 05 – test of the recording system.
The test is foreseen to the evaluation of the carriage drive system efficiency (sensor of the carriage position, stepby-step motor, resistance to motion along the guide).
After starting, the test begins the printing of six parallel diagram lines distant from each other of 15 mm.
Line dots are recorded for one motion direction of the carriage.
Each successive dot in the line should be printed in the same colour.
• Test № 6 – test of the carriage and sensor.
This test serves to check the work of the carriage extreme sensor. One can take advantage of it when setting the
sensor position..
After starting the test , a vertical line distant of ca 10 mm from the chart initial line (0%) is drawn on the recording chart.
The deflection of particular dots of this line from the straight line should not exceed 0.2 mm.
63
• Test № 07 – test of the temperature sensor.
The test serves to check the work of the cold junction temperature sensor in recorder executions with and automatic compensation (ACJC) and the configuration correctness of the recorder for the sensor placed on the recorder terminals or in the ACJC attachment.
After starting the test on the display , the value of the measured thermocouple cold junction temperature appears on the
display ( in the recorder execution with ACJC and the temperature sensor in the ACJC attachment , one must connect
the attachment suitably by two conductors to the terminal marked with symbols B and E). The temperature is displayed
in °C in the format 00.0...99.9.
The temperature measurement result can be printed by pressing the
SHIFT
+
keys.
In case when the recorder ACJC configuration does not correspond to the execution recorded in the recorder memory, if
there is a sensor break or the ACJC attachment is not connected, then the message “Err t” appears on the display.
• Test № 08 – test of the rewinder drive.
This test serves to check the work correctness of the rewinder drive .It can be used to set up the beginning of the
recording on the defined horizontal line of the recording chart line graduation.
After starting the test, the recording chart moves. After pressing the
ing
the
ENTER key the chart stops. In this state, by press-
key, one can displace the chart by leaps of 0.1 mm. After each chart step one can print a dot by means of
SHIFT
+
keys and choose for this printout an optional colour of the head by pressing the
key.
A renewed pressure of the ENTER key causes the return to a continuous chart feed.
18. RECORDER INSTALLATION
The KE8 recorder fulfils requirements concerning the service safety according the EN 61010-1+A1 standard and the
noise immunity occurring in industrial environment according the EN 61000-6-2 standard.
Different interference sources practically influences the recorder in a continuous or pulse way from the power supply
network side (as the result of work of other appliances) and also overlaps on the measured signal or recorder auxiliary
circuits. Interferences also arises as the result of capacitive-inductive load switchings through the own alarm recorder
relays.
High pulse interferences are especially threatening for the device work, because they can occasionally cause false
measurement results or accidental alarm operations, despite of the application of suitable filters in the recorder.
The level of these interferences should be reduced to a value lower than the recorder noise immunity threshold, first of
all, through a suitable installation of the recorder in the object.
In this scope it is recommended to observe following principles:
•
•
•
•
•
•
•
•
•
•
do not supply recorders from the network in the proximity of appliances generating high pulse interferences in the
supply network and do not apply common earth circuits,
apply network filters for the group of recorders installed in the same object,
to lead supply conductors (phase, zero), apply metal screen in the shape of tubes or braids in which, one can also
lead the ground conductor and if need be, network conductors supplying alarm relay contacts of the given recorder,
lead individually in a screen as above, the connections of binary inputs by means of twisted conductors in a screen as
above,
lead individually the connections of communication interface circuits by means of twisted conductors in a screen,
conductors leading measuring signals to each recorder measuring channel should be twisted in pairs and for resistance sensors in the three-wire connection, twisted with conductors having the same length, cross-section and resistance, and led in a screen. Conductors leading measuring signals to the same recorder can be led in the same
screen (if it is possible),
all screens should be one side earthed by the recorder,
one must avoid a common earth conductor together with other appliances,
apply the general principle that conductors (bundles) leading different signals should be led in the largest distance
from each other and crossings of such bundles should be made on the square,
put a ZCAT 2035-0930A (TKD) ferrite filter on the supply conductor. This filter is foreseen in the KE8 recorder
accessory set.
64
NOTICE: The recorder must be earthed or neutral grounded
19. General precautions in the scope of the protection against electrostatic discharges
Semiconductor elements applied in the recorder construction, packages marked by the sign as above can be damaged
as the result of electrostatic discharges (ESD).
In order to prevent electrostatic discharges, one must observe following recommendations during servicing:
•
•
•
•
•
disassemble recorders only in a zone secured against electrostatic discharges,
in the work zone, use conductive materials for the dissipation of electrostatic discharges
for the storage of electronic elements and packages use only anti-static containers ,
touch as little as possible electronic elements with hands,
do not keep materials susceptible to generating electrostatic charges in the work zone.
20. RECORDER CO-OPERATION WITH A COMPUTER
The KE8 recorder co-operates with external appliances in the system through the RS-232C or RS-485 communication
serial interface.
The interface system controller can be a suitably programmed IBM PC computer or another device programmed to this
purpose.
A diskette including the LEONARDO programme demo version is delivered with the recorder. This programme is destined to manage the work of KE8 recorders together with the service manual of this programme version.
In the demo version, the user does not have any access to recording functions of recorder measuring data on the
recorder disc and does not have the possibility to change the configuration of recorder parameters from the programme
level.
21. CONNECTION OF DEVICES
In the RS-232C and RS-485 interface systems, a 9-pin drawer plug of DB-9 type is applied.
The numbering of connector contacts, in the view from recorder terminal side, is shown on the Fig. 30.
The lead-out conductor organisation of the connector for both interfaces and the designation of signals are presented on
the table № 5
Fig. 30
65
Table № 5
RS-232C
Lead-out number
on the connector
1
2
3
4
5
6
7
8
9
RS-485
Designation
Lead-out number
on the connector
Designation
RxD
TxD
DTR
GND
DSR
RTS
CTS
1
2
3
4
5
6
7
8
9
TXTX+
RX+
RXGND
RTSRTS+
CTS+
CTS-
Schemes of cables and additional elements which can be used to the construction of connections between the recorder
and the computer are presented on Fig. 31 … 32.
The names of interface lines in cables are defined from the side of connected external device, and for this reason there
are two different names when describing the cable on the sockets despite they are the same lines.
The conductors in cables should be twisted and led in a screen one-sidedly connected to the conductor of the signalling
mass GND.
Setting up a communication system, one must connect devices with cables suitable to the interface type, programme in
all devices the same baud rate and device addresses, so that there was not two identical addresses in the network.
The connection for the RS-232C interface should be made with a cable which the scheme is presented on the Fig. 31.
If there is a 25-pin socket in the computer, then one must use a 25/9 transition link the configuration of which is shown on
the Fig. 32.
The recorder connection of the RS-485 interface to the bus should be made with a cable the scheme of which is shown
on the Fig. 33.
to PC
RxD
TxD
DTR
DSR
RTS
CTS
GND
2
3
4
6
7
8
5
to KE8
RxD
TxD
DTR
DSR
RTS
CTS
GND
2
3
4
6
7
8
5
TxD
RxD
DTR
DSR
RTS
CTS
GND
9 - pin socket
9 - pin socket
Fig. 31 Connection cable of the RS-232C interface
2
3
20
6
4
5
7
RxD
TxD
DTR
DSR
RTS
CTS
GND
2
3
4
6
7
8
5
25-pin socket
9-pin plug
Fig. 32 25/9 transition link for RS-232C
66
to PC
to KE8
TX- 1
RX- 4
TX+ 2
RX+ 3
RTS+ 7
CTS+ 8
RTS- 6
CTS- 9
GND 5
TXRXTX+
RX+
RTS+
CTS+
RTSCTSGND
9 - pin socket
1
4
2
3
7
8
6
9
5
9 – pin socket
Fig. 33 Connection cable of the RS-485 interface
22. EXPLOITATION CONSIDERATIONS
Change of standard setups:
In the KE8 recorder, one can settle work parameters other than the given set of
standard setups by the manufacturer through their programming by the user,
directly from the recorder keyboard.
In case of the necessity to change standard setups in the owned recorder or the need to order an individual set of its
work parameters, one must contact directly the manufacturer. The change of standard setups will require the replacement of the EPROM memory by the manufacturer.
•
Example of connection of an inductive load to the recorder alarm terminals.
Terminals
19..... 30
31
Elements protecting the P relay contacts
C – 100 nF / 250 V a.c. X2
R – 100 Ω / 1 W
Or a spark-quench system in the place of RC:
RC-UNIT MP PMR 209M. ( 0,047µF+100Ω ) RIFA
125 V a.c.
R
C
P
67
23. TABLE OF ASCII CHARACTERS IN THE HEXADECIMAL NOTATION
Table № 6
0
Second position of the ASCII character
2
3
4
5
6
7
8
9
A
B
C
D
E
F
0 EOL C1
C2
C3
C4
C5
C6
1
2
3
4
5
6
7
8
0
1
2
3
4
5
6
7
8
9
0
↔
∧
∨
1
2
1
9
!
"
#
$
%
&
’
(
)
*
+
,
-
.
/
3
0
1
2
3
4
5
6
7
8
9
:
;
<
=
>
?
4
@
A
B
C
D
E
F
G
H
I
J
K
L
M
N
O
5
P
Q
R
S
T
U
V
W
X
Y
Z
[
\
]
^
_
6
`
a
b
c
d
e
f
g
h
i
j
k
l
m
n
o
7
p
q
r
s
t
u
v
w
x
y
z
{
|
}
″
∆
8
Ç
ü
é
â
ä
ŕ
ą
ç
ę
ë
č
ď
î
ć
Ä
Ą
9
Ę
ę
ł
ô
ö
Ć
ű
ů
Ś
Ö
ü
˘
Ł
Ą
ś
A
Ź
Ż
ó
Ó
ń
Ń
ź
ż
ż
˝
Ľ
i
«
»
B
C
−
=
D
E
α
β
Γ
π
Σ
σ
µ
γ
Φ
θ
Ω
δ
∞
∈
∩
F
≡
±
≥
≤
÷
≈
°
•
·
√
2
Notice:
Characters used in the table mean:
- lack of character
C1...C6 - symbol of the successive colour of the printing head (the colour symbol before the character
causes the printing of the character in the colour corresponding to the symbol number )
EOL - edition end symbol of the character sequence for P8 and P9 parameters.
68
24. EXECUTION CODES
KE8 TYPE RECORDER
x
Without alarms
With alarms
0
1
RS-232C interface
RS-485 interface
RS-232C interface + servicing program from the computer 1)
RS-485 interface + servicing program from the computer 1)
LUMBUS communication protocol
MODBUS communication protocol
x
x
x
x
x
x
x
1
2
3
4
1
2
Without compensation of the thermocouple cold junction
Compensation of the thermocouple cold junction sensor
Red colour of the read-out field
Green colour of the read-out field
0
1
1
2
Standard parameter settings
Custom-made parameter settings (acc. customers’ order)
1
2
Supply 90…230…253V a.c.
Supply 18…24…30V d.c./a.c.
1
2
Without additional requirements
With a control quality certificate
Acc. agreements with the customer 2)
0
1
X
1
) Concerns the recorder execution with the LUMBUS communication protocol.
) The code number will be settle by the producer.
2
NOTICE: When choosing a KE8 recorder execution:
• Standard parameter settings: blank spaces in parameter tables are not fill in the,,Ordering form”.
Manufacturer standard parameters will be programmed in the recorder.
•
User’s parameter settings: it is required to write down in parameter tables, in the,,Ordering form”, setting
values of respective parameters.
•
RS-232C interface (or RS-485): for a recorder with the LUMBUS communication protocol, a demo version
of the LEONARDO Version 6.00 program is delivered (without the possibility to change recorder
settings and without recording data measurements in the computer).
•
RS-232C interface (or RS-485) + program to the recorder servicing from the computer: with the
recorder (and only in the execution with the LUMBUS communication protocol), for an additional charge, we
can deliver a commercial version of the LEONARDO Version 6.00 programme with the coding key enabling
the full service of the given recorder from the computer level.
69
25. MAINTENANCE AND GUARANTEE
The KE8 recorder requires some periodical maintenance as described in the Service Manual.
In case of some incorrect unit operations:
1. In the period given in the guarantee card:
One should return the recorder to the manufacturer’s Quality Inspection Dept.
If the unit has been used in compliance with the instructions,
The manufacturer warrants to repair it free of charge.
The disassembling of the housing causes the cancellation of the granted guarantee.
2. After the warranty period:
One should turn over the recorder to repair it in a certified service workshop.
Spare parts are available for the period of five years from the date of purchase.
The manufacturer reserves the right to make
changes in design and specifications of any
products as engineering advances or necessity
requires.
70