1
Notice
Hewlett-Packard to Agilent Technologies Transition
This manual may contain references to HP or Hewlett-Packard. Please note that HewlettPackard's former test and measurement, semiconductor products and chemical analysis
businesses are now part of Agilent Technologies. To reduce potential confusion, the only
change to product numbers and names has been in the company name prefix: where a
product name/number was HP XXXX the current name/number is now Agilent XXXX. For
example, model number HP 8648 is now model number Agilent 8648.
Contacting Agilent Sales and Service Offices
The sales and service contact information in this manual may be out of date. The latest
service and contact information for your location can be found on the Web at:
http://www.agilent.com/find/assist
If you do not have access to the Internet, contact your field engineer. In any correspondence
or telephone conversation, refer to your instrument by its model number and full serial
number.
Printed in USA
July 2004
HP 85640A
RF Tracking Generator
Operation and Service Manual
ABCDE
Printed in USA
Notice.
The information contained in this document is subject to change without notice.
Hewlett-Packard makes no warranty of any kind with regard to this material, including,
but not limited to, the implied warranties of merchantability and tness for a particular
purpose. Hewlett-Packard shall not be liable for errors contained herein or for incidental or
consequential damages in connection with the furnishing, performance, or use of this material.
HP part number: 85640-90005
Printed July 1992
This manual applies to HP 85640A RF tracking generators with serial numbers prexed 2918A
and below.
c Copyright Hewlett-Packard Company 1989, 1992.
All Rights Reserved. Reproduction, adaptation, or translation without prior written permission
is prohibited, except as allowed under the copyright laws.
Certication
Hewlett-Packard Company certies that this product met its published specications at the
time of shipment from the factory. Hewlett-Packard further certies that its calibration
measurements are traceable to the United States National Institute of Standards and
Technology, to the extent allowed by the Institute's calibration facility, and to the calibration
facilities of other International Standards Organization members.
Warranty
This Hewlett-Packard instrument product is warranted against defects in material and
workmanship for a period of one year from date of shipment. During the warranty period,
Hewlett-Packard Company will, at its option, either repair or replace products which prove to
be defective.
For warranty service or repair, this product must be returned to a service facility designated by
HP. Buyer shall prepay shipping charges to HP and HP shall pay shipping charges to return the
product to Buyer. However, Buyer shall pay all shipping charges, duties, and taxes for products
returned to HP from another country.
HP warrants that its software and rmware designated by HP for use with an instrument will
execute its programming instructions when properly installed on that instrument. HP does not
warrant that the operation of the instrument, or software, or rmware will be uninterrupted or
error- free.
Limitation of Warranty
The foregoing warranty shall not apply to defects resulting from improper or inadequate
maintenance by Buyer, Buyer-supplied software or interfacing, unauthorized modication or
misuse, operation outside of the environmental specications for the product, or improper
site preparation or maintenance.
NO OTHER WARRANTY IS EXPRESSED OR IMPLIED. HP SPECIFICALLY DISCLAIMS
THE IMPLIED WARRANTIES OF MERCHANTABILITY AND FITNESS FOR A PARTICULAR
PURPOSE.
Exclusive Remedies
THE REMEDIES PROVIDED HEREIN ARE BUYER'S SOLE AND EXCLUSIVE REMEDIES.
HP SHALL NOT BE LIABLE FOR ANY DIRECT, INDIRECT, SPECIAL, INCIDENTAL, OR
CONSEQUENTIAL DAMAGES, WHETHER BASED ON CONTRACT, TORT, OR ANY OTHER
LEGAL THEORY.
Assistance
Product maintenance agreements and other customer assistance agreements are available for
Hewlett-Packard products.
For any assistance, contact your nearest Hewlett-Packard Sales and Service Oce.
iii
Safety Symbols
The following safety symbols are used throughout this manual. Familiarize yourself with each
of the symbols and its meaning before operating this instrument.
Caution
The caution sign denotes a hazard. It calls attention to a procedure which, if
not correctly performed or adhered to, could result in damage to or destruction
of the instrument. Do not proceed beyond a caution sign until the indicated
conditions are fully understood and met.
Warning
The warning sign denotes a hazard. It calls attention to a procedure
which, if not correctly performed or adhered to, could result in injury
or loss of life. Do not proceed beyond a warning sign until the indicated
conditions are fully understood and met.
General Safety Considerations
Warning
Before this instrument is switched on, make sure it has been properly
Warning
There are many points in the instrument which can, if contacted, cause
personal injury. Be extremely careful.
Any adjustments or service procedures that require operation of the
instrument with protective covers removed should be performed only by
trained service personnel.
Caution
Before this instrument is switched on, make sure its primary power circuitry
has been adapted to the voltage of the ac power source.
Failure to set the ac power input to the correct voltage could cause damage to
the instrument when the ac power cable is plugged in.
iv
grounded through the protective conductor of the ac power cable to a
socket outlet provided with protective earth contact.
Any interruption of the protective (grounding) conductor, inside or
outside the instrument, or disconnection of the protective earth terminal
can result in personal injury.
Contents
1. General Information
What You'll Find in This Operation and Service Manual . . .
What You'll Find in This Chapter . . . . . . . . . . . .
Quick Overview of the HP 85640A RF Tracking Generator
Accessories Supplied . . . . . . . . . . . . . . . . .
RF Tracking Generators Covered by This Manual . . . .
Serial Numbers . . . . . . . . . . . . . . . . . . .
Calibration Cycle . . . . . . . . . . . . . . . . . . .
Specications and Characteristics . . . . . . . . . . . .
Table 1-1. HP 85640A Specications . . . . . . . . . .
Frequency Specications . . . . . . . . . . . . . . .
Amplitude Specications . . . . . . . . . . . . . . .
Electromagnetic Specications . . . . . . . . . . . .
General Specications . . . . . . . . . . . . . . . .
Physical and Mechanical Specications . . . . . . . .
Table 1-2. HP 85640A Characteristics . . . . . . . . . .
Frequency Characteristics . . . . . . . . . . . . . .
Amplitude Characteristics . . . . . . . . . . . . . .
Inputs and Outputs . . . . . . . . . . . . . . . . .
.
.
.
.
.
.
.
.
.
.
.
.
.
.
.
.
.
.
.
.
.
.
.
.
.
.
.
.
.
.
.
.
.
.
.
.
.
.
.
.
.
.
.
.
.
.
.
.
.
.
.
.
.
.
.
.
.
.
.
.
.
.
.
.
.
.
.
.
.
.
.
.
.
.
.
.
.
.
.
.
.
.
.
.
.
.
.
.
.
.
.
.
.
.
.
.
.
.
.
.
.
.
.
.
.
.
.
.
.
.
.
.
.
.
.
.
.
.
.
.
.
.
.
.
.
.
.
.
.
.
.
.
.
.
.
.
.
.
.
.
.
.
.
.
.
.
.
.
.
.
.
.
.
.
.
.
.
.
.
.
.
.
.
.
.
.
.
.
.
.
.
.
.
.
.
.
.
.
.
.
1-1
1-1
1-2
1-3
1-4
1-4
1-4
1-5
1-6
1-6
1-7
1-8
1-9
1-10
1-11
1-11
1-11
1-12
What You'll Find in This Chapter . . . . . . . . . . . . . . .
Compatibility with Portable Spectrum Analyzers . . . . . . .
Initial Inspection . . . . . . . . . . . . . . . . . . . . . .
Is the Shipment Complete? . . . . . . . . . . . . . . . .
Is the Shipping Container in Good Condition? . . . . . . .
Save the Packaging Materials . . . . . . . . . . . . . . .
Preparing the RF Tracking Generator for Use . . . . . . . .
Power Requirements . . . . . . . . . . . . . . . . . . .
Setting the Line-Voltage Selector Switch . . . . . . . . . .
Checking the Fuse . . . . . . . . . . . . . . . . . . . .
Power Cable . . . . . . . . . . . . . . . . . . . . . . .
Connecting an HP 85640A to a Compatible Spectrum Analyzer
Turning On the Tracking Generator . . . . . . . . . . . . .
Sales and Service Oces . . . . . . . . . . . . . . . . . .
.
.
.
.
.
.
.
.
.
.
.
.
.
.
.
.
.
.
.
.
.
.
.
.
.
.
.
.
.
.
.
.
.
.
.
.
.
.
.
.
.
.
.
.
.
.
.
.
.
.
.
.
.
.
.
.
.
.
.
.
.
.
.
.
.
.
.
.
.
.
.
.
.
.
.
.
.
.
.
.
.
.
.
.
.
.
.
.
.
.
.
.
.
.
.
.
.
.
.
.
.
.
.
.
.
.
.
.
.
.
.
.
.
.
.
.
.
.
.
.
.
.
.
.
.
.
2-1
2-1
2-2
2-2
2-2
2-2
2-2
2-3
2-4
2-5
2-5
2-7
2-8
2-9
.
.
.
.
.
.
.
.
.
.
.
.
.
.
.
.
.
.
.
.
.
.
.
.
.
.
.
.
.
.
.
.
.
.
.
.
.
.
.
.
.
.
.
.
.
.
.
.
.
.
.
.
.
.
.
.
.
.
.
.
.
.
.
.
.
.
.
.
.
.
.
.
3-1
3-2
3-4
3-5
3-7
3-7
3-8
3-9
.
.
.
.
.
.
.
.
.
.
.
.
.
.
.
.
.
2. Installation
3. Operation
What You'll Find in This Chapter . . . . . . . . . . .
Front-Panel Features . . . . . . . . . . . . . . . .
Rear-Panel Features . . . . . . . . . . . . . . . .
HP 85640A and Host Spectrum Analyzer Connections
Measurement Overview . . . . . . . . . . . . . .
Making a Stimulus-Response Measurement . . . .
Equipment Needed . . . . . . . . . . . . . . .
Transmission Measurements . . . . . . . . . . . .
HP 85640A RF Tracking Generator Operation and Service Manual
.
.
.
.
.
.
.
.
.
.
.
.
.
.
.
.
.
.
.
.
.
.
.
.
.
.
.
.
.
.
.
.
Contents-1
Making a Transmission Measurement Using an HP 8560A/E, HP 8561B/E, or
HP 8563A/E Spectrum Analyzer . . . . . . . . . . . . . . . . . . .
Set up the System. . . . . . . . . . . . . . . . . . . . . . . . . . .
Calibrate. . . . . . . . . . . . . . . . . . . . . . . . . . . . . . .
Normalize. . . . . . . . . . . . . . . . . . . . . . . . . . . . . . .
Measure. . . . . . . . . . . . . . . . . . . . . . . . . . . . . . .
Making a Transmission Measurement Using an HP 8561A or HP 8562A/B
Spectrum Analyzer . . . . . . . . . . . . . . . . . . . . . . . . .
Set up the System. . . . . . . . . . . . . . . . . . . . . . . . . . .
Calibrate. . . . . . . . . . . . . . . . . . . . . . . . . . . . . . .
Normalize. . . . . . . . . . . . . . . . . . . . . . . . . . . . . . .
Measure. . . . . . . . . . . . . . . . . . . . . . . . . . . . . . .
Reection Measurements . . . . . . . . . . . . . . . . . . . . . . . . .
Making a Reection Measurement Using an HP 8560A/E, HP 8561B/E, or
HP 8563A/E Spectrum Analyzer . . . . . . . . . . . . . . . . . . .
Set up the System. . . . . . . . . . . . . . . . . . . . . . . . . . .
Calibrate. . . . . . . . . . . . . . . . . . . . . . . . . . . . . . .
Normalize. . . . . . . . . . . . . . . . . . . . . . . . . . . . . . .
Measure. . . . . . . . . . . . . . . . . . . . . . . . . . . . . . .
Making a Reection Measurement Using an HP 8561A or HP 8562A/B
Spectrum Analyzer . . . . . . . . . . . . . . . . . . . . . . . . .
Set up the System. . . . . . . . . . . . . . . . . . . . . . . . . . .
Calibrate. . . . . . . . . . . . . . . . . . . . . . . . . . . . . . .
Normalize. . . . . . . . . . . . . . . . . . . . . . . . . . . . . . .
Measure. . . . . . . . . . . . . . . . . . . . . . . . . . . . . . .
4. Performance Tests
.
.
.
.
.
.
.
.
.
.
3-9
3-9
3-15
3-17
3-18
.
.
.
.
.
.
.
.
.
.
.
.
3-21
3-21
3-26
3-27
3-28
3-30
.
.
.
.
.
.
.
.
.
.
3-30
3-30
3-30
3-35
3-36
.
.
.
.
.
.
.
.
.
.
3-37
3-37
3-38
3-40
3-40
.
.
.
.
.
.
.
.
.
.
.
.
.
.
.
.
.
.
.
.
.
.
.
.
.
.
.
.
.
.
.
.
.
.
.
.
.
.
.
.
.
.
.
.
.
.
.
.
.
.
.
.
.
.
.
.
.
.
.
.
.
.
.
.
.
.
.
.
.
.
.
.
.
.
.
.
.
.
.
.
.
.
.
.
.
.
.
.
.
.
.
.
.
.
.
.
.
.
.
.
.
.
.
.
.
.
.
.
.
.
.
.
.
.
.
.
.
.
.
.
.
.
.
.
.
.
.
.
.
.
.
.
.
.
.
.
.
.
.
.
.
.
.
.
.
.
.
.
.
.
.
.
.
.
.
.
.
.
.
.
.
.
.
.
.
.
.
.
.
.
.
.
.
.
.
.
.
.
.
.
.
.
.
.
.
.
.
.
.
.
.
.
.
.
.
.
.
.
.
.
.
.
.
.
.
.
.
.
.
.
.
.
.
.
.
.
.
.
.
.
.
4-1
4-1
4-3
4-3
4-3
4-6
4-9
4-12
4-16
4-19
4-25
4-28
4-32
What You'll Find in This Chapter . . . . . . . .
Safety Considerations . . . . . . . . . . . .
Which Adjustment Should Be Performed? . .
Test Equipment . . . . . . . . . . . . . .
Adjustable and Factory-Selected Components
Adjustment Tools . . . . . . . . . . . . .
1. Power Supply Adjustments and Checks .
2. 600 MHz Level Adjustment . . . . . .
3. Power Level Adjustments . . . . . . .
4. Tracking Oscillator Range Adjustments .
Fine Adjustment . . . . . . . . . . . . .
Coarse Adjustment . . . . . . . . . . . .
.
.
.
.
.
.
.
.
.
.
.
.
.
.
.
.
.
.
.
.
.
.
.
.
.
.
.
.
.
.
.
.
.
.
.
.
.
.
.
.
.
.
.
.
.
.
.
.
.
.
.
.
.
.
.
.
.
.
.
.
.
.
.
.
.
.
.
.
.
.
.
.
.
.
.
.
.
.
.
.
.
.
.
.
.
.
.
.
.
.
.
.
.
.
.
.
.
.
.
.
.
.
.
.
.
.
.
.
.
.
.
.
.
.
.
.
.
.
.
.
.
.
.
.
.
.
.
.
.
.
.
.
.
.
.
.
.
.
.
.
.
.
.
.
.
.
.
.
.
.
.
.
.
.
.
.
.
.
.
.
.
.
.
.
.
.
.
.
.
.
.
.
.
.
.
.
.
.
.
.
.
.
.
.
.
.
.
.
.
.
.
.
5-1
5-1
5-1
5-1
5-2
5-2
5-4
5-7
5-12
5-15
5-17
5-17
What You'll Find in This Chapter . . . . .
What is Performance Verication? . . .
Before Beginning . . . . . . . . . . .
Test Equipment You'll Need . . . . .
Recording Test Results . . . . . . . .
1. Output Attenuator Accuracy . . .
2. Maximum Leveled Output Power .
3. Level Flatness . . . . . . . . .
4. Harmonic Spurious Outputs . . .
5. Non-Harmonic Spurious Outputs .
6. LO Feedthrough Amplitude . . .
7. Tracking Generator Feedthrough .
8. Frequency Tracking Range . . .
5. Adjustment Procedures
Contents-2
.
.
.
.
.
.
.
.
.
.
.
.
.
.
.
.
.
.
.
.
.
.
.
.
.
.
HP 85640A RF Tracking Generator Operation and Service Manual
6. Assembly Replaceable Parts
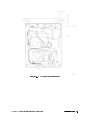
What You'll Find in This Chapter . . . . . . . . . . . . . . . . . . . . . . .
Major Assembly and Cable Locations . . . . . . . . . . . . . . . . . . . .
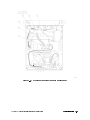
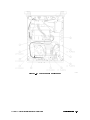
Mechanical Replaceable Parts . . . . . . . . . . . . . . . . . . . . . . . .
7. Service Information
What You'll Find in This Chapter . . . . . . . . . . . . . . . . . . . . . .
Electrostatic Discharge . . . . . . . . . . . . . . . . . . . . . . . . . .
PC Board Assemblies and Electronic Components . . . . . . . . . . . .
Returning the RF Tracking Generator for Service . . . . . . . . . . . . .
Replacement Procedures . . . . . . . . . . . . . . . . . . . . . . . . .
Rebuilt Exchange Assemblies . . . . . . . . . . . . . . . . . . . . . .
Removing and Replacing the Instrument Cover . . . . . . . . . . . . . .
Removal . . . . . . . . . . . . . . . . . . . . . . . . . . . . . . .
Replacement . . . . . . . . . . . . . . . . . . . . . . . . . . . . .
A1 Attenuator Replacement . . . . . . . . . . . . . . . . . . . . . . .
Removal . . . . . . . . . . . . . . . . . . . . . . . . . . . . . . .
Replacement . . . . . . . . . . . . . . . . . . . . . . . . . . . . .
A2 Tracking Generator Assembly Replacement . . . . . . . . . . . . . .
Removal . . . . . . . . . . . . . . . . . . . . . . . . . . . . . . .
Replacement . . . . . . . . . . . . . . . . . . . . . . . . . . . . .
A3 Interface Board Assembly Replacement . . . . . . . . . . . . . . . .
Removal . . . . . . . . . . . . . . . . . . . . . . . . . . . . . . .
Replacement . . . . . . . . . . . . . . . . . . . . . . . . . . . . .
A4 Power Supply Replacement . . . . . . . . . . . . . . . . . . . . . .
Removal . . . . . . . . . . . . . . . . . . . . . . . . . . . . . . .
Replacement . . . . . . . . . . . . . . . . . . . . . . . . . . . . .
A5 Line Filter/Switch Assembly Replacement . . . . . . . . . . . . . . .
Removal . . . . . . . . . . . . . . . . . . . . . . . . . . . . . . .
Replacement . . . . . . . . . . . . . . . . . . . . . . . . . . . . .
HP 85640A RF Tracking Generator Circuit Descriptions and Troubleshooting
Procedures . . . . . . . . . . . . . . . . . . . . . . . . . . . . . .
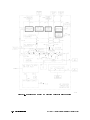
HP 85640A Block Diagram Circuit Descriptions . . . . . . . . . . . . .
Troubleshooting the HP 85640A RF Tracking Generator Circuits . . . . . .
A1 Attenuator . . . . . . . . . . . . . . . . . . . . . . . . . . . . .
A2 Tracking Generator . . . . . . . . . . . . . . . . . . . . . . . . .
A3 Interface Assembly . . . . . . . . . . . . . . . . . . . . . . . . .
A4 Power Supply . . . . . . . . . . . . . . . . . . . . . . . . . . .
A5 Line Filter/Switch Assembly . . . . . . . . . . . . . . . . . . . . .
Troubleshooting Tracking Generator-Related Faults . . . . . . . . . . . .
Output Unleveled . . . . . . . . . . . . . . . . . . . . . . . . . . .
Excessive Residual FM . . . . . . . . . . . . . . . . . . . . . . . . .
Flatness Out of Tolerance . . . . . . . . . . . . . . . . . . . . . . .
Harmonic/Spurious Outputs Too High . . . . . . . . . . . . . . . . . .
No Output Power . . . . . . . . . . . . . . . . . . . . . . . . . . .
6-1
6-2
6-4
.
.
.
.
.
.
.
.
.
.
.
.
.
.
.
.
.
.
.
.
.
.
.
.
.
.
.
.
.
.
.
.
.
.
.
.
.
.
.
.
.
.
.
.
.
.
.
.
7-1
7-2
7-2
7-4
7-6
7-6
7-7
7-7
7-7
7-8
7-8
7-8
7-10
7-10
7-10
7-12
7-12
7-12
7-14
7-14
7-14
7-16
7-16
7-16
.
.
.
.
.
.
.
.
.
.
.
.
.
.
.
.
.
.
.
.
.
.
.
.
.
.
.
.
7-18
7-18
7-21
7-21
7-21
7-22
7-23
7-23
7-24
7-24
7-26
7-27
7-28
7-30
Index
HP 85640A RF Tracking Generator Operation and Service Manual
Contents-3
Figures
1-1.
1-2.
2-1.
2-2.
2-3.
2-4.
3-1.
3-2.
3-3.
3-4.
3-5.
3-6.
3-7.
3-8.
3-9.
3-10.
3-11.
3-12.
3-13.
3-14.
3-15.
3-16.
3-17.
3-18.
3-19.
3-20.
3-21.
3-22.
3-23.
3-24.
3-25.
3-26.
3-27.
3-28.
3-29.
3-30.
3-31.
3-32.
3-33.
3-34.
3-35.
3-36.
3-37.
3-38.
3-39.
HP 85640A with Accessories Supplied . . . . . . . . . . . . . . . . .
An Example of a Serial Number Label . . . . . . . . . . . . . . . . .
Voltage Selection Switch and Line Fuse Locations . . . . . . . . . . .
AC Power Cables Available . . . . . . . . . . . . . . . . . . . . . .
Front-Panel Cable Connections . . . . . . . . . . . . . . . . . . . .
Rear-Panel Cable Connections . . . . . . . . . . . . . . . . . . . .
Front-Panel Feature Overview . . . . . . . . . . . . . . . . . . . .
HP 85640A Rear-Panel Feature Overview . . . . . . . . . . . . . . .
Tracking Generator-to-Host Analyzer Front-Panel Connections . . . . .
Tracking Generator-to-Host Analyzer Rear-Panel Connections . . . . . .
Host Spectrum Analyzer and Tracking Generator System Block Diagram .
Tracking Generator Power over Specied Frequency Range . . . . . . .
Display of DUT Response . . . . . . . . . . . . . . . . . . . . . . .
System Setup for Transmission Measurement . . . . . . . . . . . . .
Faster Sweep Times in Stimulus-Response Auto-Coupled Mode . . . . .
Adjusting the Spectrum Analyzer for Measurement Requirements . . . .
Decrease Resolution Bandwidth to Improve Sensitivity . . . . . . . . .
Using Tracking Adjust to Compensate for Tracking Error . . . . . . . .
Tracking Error . . . . . . . . . . . . . . . . . . . . . . . . . . . .
Guided Calibration Prompt . . . . . . . . . . . . . . . . . . . . . .
Thru Connected for Guided Calibration Routines . . . . . . . . . . . .
Display of Thru-Reference Trace in Trace B . . . . . . . . . . . . . .
Normalized Trace . . . . . . . . . . . . . . . . . . . . . . . . . .
Measuring Rejection Range with Delta Markers . . . . . . . . . . . .
NORM REF LVL Adjusts the Trace and Retains Analyzer Settings . . . .
RANGE LVL Increases Dynamic Measurement Range . . . . . . . . . .
Tracking Generator Power over Specied Frequency Range . . . . . . .
System Setup for Transmission Measurement . . . . . . . . . . . . .
Display of DUT Response . . . . . . . . . . . . . . . . . . . . . . .
Adjusting the Spectrum Analyzer for Measurement Requirements . . . .
Decrease Resolution Bandwidth to Improve Sensitivity . . . . . . . . .
Using TRACKING ADJUST to Compensate for Tracking Error . . . . . .
Tracking Error . . . . . . . . . . . . . . . . . . . . . . . . . . . .
Thru Connected for Calibration Routine . . . . . . . . . . . . . . . .
Display of Thru-Reference Trace in Trace B . . . . . . . . . . . . . .
Normalized Trace . . . . . . . . . . . . . . . . . . . . . . . . . .
Measuring Rejection Range with Delta Markers . . . . . . . . . . . .
Increased Dynamic Measurement Range . . . . . . . . . . . . . . . .
System Setup for a Reection Measurement . . . . . . . . . . . . . .
Display with System Congured for a Reection Measurement . . . . .
Spectrum Analyzer Display of Bandpass Filter Region . . . . . . . . .
On-Screen Prompts to Connect an Open . . . . . . . . . . . . . . . .
Connect the Open . . . . . . . . . . . . . . . . . . . . . . . . . .
On-Screen Prompts to Connect an Short . . . . . . . . . . . . . . . .
Connect the Short . . . . . . . . . . . . . . . . . . . . . . . . . .
NNNNNNNNNNNNNNNNNNNNNNNNNNNNNNNNNNNNNN
NNNNNNNNNNNNNNNNNNNNNNNNNNNNN
Contents-4
.
.
.
.
.
.
.
.
.
.
.
.
.
.
.
.
.
.
.
.
.
.
.
.
.
.
.
.
.
.
.
.
.
.
.
.
.
.
.
.
.
.
.
.
.
.
.
.
.
.
.
.
.
.
.
.
.
.
.
.
.
.
.
.
.
.
.
.
.
.
.
.
.
.
.
.
.
.
.
.
.
.
.
.
.
.
.
.
.
.
.
.
.
.
.
.
.
.
.
.
.
.
.
.
.
.
.
.
.
.
.
.
.
.
.
.
.
.
.
.
.
.
.
.
.
.
.
.
.
.
.
.
.
.
.
1-3
1-4
2-4
2-6
2-7
2-8
3-3
3-4
3-5
3-6
3-7
3-10
3-10
3-11
3-12
3-12
3-13
3-13
3-14
3-15
3-16
3-17
3-18
3-18
3-19
3-19
3-21
3-22
3-22
3-23
3-24
3-24
3-25
3-26
3-27
3-28
3-28
3-29
3-31
3-31
3-32
3-33
3-33
3-34
3-34
HP 85640A RF Tracking Generator Operation and Service Manual
3-40.
3-41.
3-42.
3-43.
3-44.
3-45.
4-1.
4-2.
4-3.
4-4.
4-5.
4-6.
4-7.
4-8.
4-9.
5-1.
5-2.
5-3.
5-4.
5-5.
5-6.
5-7.
5-8.
6-1.
6-2.
6-3.
7-1.
7-2.
7-3.
7-4.
7-5.
7-6.
7-7.
7-8.
7-9.
Normalized Return Loss Measurement . . . . . . . . . . . . . . . . .
Return Loss Reading Using the 4MKR5 Function . . . . . . . . . . . . .
Display with the System Congured for a Reection Measurement . . .
System Setup for a Reection Measurement . . . . . . . . . . . . . .
Spectrum Analyzer Display of Bandpass Filter Region . . . . . . . . .
Return Loss Reading Using the 4MKR5 Function . . . . . . . . . . . . .
HP 85640A RF Tracking Generator Connections . . . . . . . . . . . .
Output Attenuator Accuracy Test Setup . . . . . . . . . . . . . . . .
Maximum Leveled Output Power Test Setup . . . . . . . . . . . . . .
Level Flatness Test Setup . . . . . . . . . . . . . . . . . . . . . . .
Harmonic Spurious Outputs Test Setup . . . . . . . . . . . . . . . .
Non-Harmonic Spurious Outputs Test Setup . . . . . . . . . . . . . .
LO Feedthrough Test Setup . . . . . . . . . . . . . . . . . . . . . .
Tracking Generator Feedthrough Test Setup . . . . . . . . . . . . . .
Frequency Tracking Range Test Setup . . . . . . . . . . . . . . . . .
Power Supply Adjustments and Checks Setup . . . . . . . . . . . . .
Power Supply Adjustments and Test Point Locations . . . . . . . . . .
600 MHz Level Adjustment Setup . . . . . . . . . . . . . . . . . . .
Attenuator A3U4 Location . . . . . . . . . . . . . . . . . . . . . .
Power Level Adjustment Setup . . . . . . . . . . . . . . . . . . . .
Power Level Adjustment and Test Point Locations . . . . . . . . . . .
Tracking Oscillator Range Adjustment . . . . . . . . . . . . . . . . .
Tracking Oscillator Range Adjustment Locations . . . . . . . . . . . .
Major Assemblies and Cable Locations . . . . . . . . . . . . . . . .
Mechanical Replaceable Parts (1 of 2) . . . . . . . . . . . . . . . . .
Mechanical Replaceable Parts (2 of 2) . . . . . . . . . . . . . . . . .
A Static-Safe Workstation . . . . . . . . . . . . . . . . . . . . . .
HP 85640A Shipping Container and Cushioning Materials . . . . . . . .
A1 Attenuator Replacement . . . . . . . . . . . . . . . . . . . . .
A2 Tracking Generator Assembly Replacement . . . . . . . . . . . .
A3 Interface Board Assembly Replacement . . . . . . . . . . . . . .
A4 Power Supply Replacement . . . . . . . . . . . . . . . . . . . .
A5 FL1 Line Filter Module Replacement . . . . . . . . . . . . . . . .
Simplied HP 85640A to Host Spectrum Analyzer System Block Diagram
Simplied HP 85640A RF Tracking Generator Block Diagram . . . . . .
HP 85640A RF Tracking Generator Operation and Service Manual
.
.
.
.
.
.
.
.
.
.
.
.
.
.
.
.
.
.
.
.
.
.
.
.
.
.
.
.
.
.
.
.
.
.
.
.
.
.
.
.
.
.
.
.
.
.
.
.
.
.
.
.
.
.
.
.
.
.
.
.
.
.
.
.
.
.
.
.
.
.
.
.
.
.
.
.
.
.
.
.
.
.
.
.
.
.
.
.
.
.
.
.
.
.
.
.
.
.
.
.
.
.
.
.
.
3-35
3-36
3-38
3-38
3-39
3-40
4-3
4-6
4-9
4-12
4-16
4-20
4-25
4-28
4-32
5-4
5-5
5-7
5-8
5-12
5-13
5-15
5-16
6-3
6-4
6-6
7-2
7-5
7-9
7-11
7-13
7-15
7-17
7-19
7-20
Contents-5
Tables
2-1.
2-2.
2-3.
3-1.
3-2.
3-3.
4-1.
4-2.
4-3.
4-4.
4-5.
4-6.
4-7.
4-8.
4-9.
4-9.
4-9.
5-1.
5-2.
5-3.
5-4.
5-5.
5-6.
5-7.
6-1.
7-1.
Host Spectrum Analyzer-to-Tracking Generator Compatibility .
Operating Power Requirements . . . . . . . . . . . . . . .
Hewlett-Packard Sales and Service Oces . . . . . . . . . .
Front-Panel Interconnections . . . . . . . . . . . . . . . .
Rear-Panel Interconnections . . . . . . . . . . . . . . . .
HP 85640A and Host Spectrum Analyzer Connections . . . .
Performance Tests . . . . . . . . . . . . . . . . . . . . .
Recommended Test Equipment . . . . . . . . . . . . . . .
Output Attenuator Accuracy . . . . . . . . . . . . . . . .
Flatness Relative to 300 MHz . . . . . . . . . . . . . . . .
Harmonic Spurious Outputs . . . . . . . . . . . . . . . .
Fundamental Response Amplitudes . . . . . . . . . . . . .
Non-Harmonic Spurious Responses . . . . . . . . . . . . .
Tracking Generator Feedthrough . . . . . . . . . . . . . .
Performance Test Record (Page 1 of 3) . . . . . . . . . . .
Performance Test Record (Page 2 of 3) . . . . . . . . . . .
Performance Test Record (Page 3 of 3) . . . . . . . . . . .
Adjustment Procedures and Equipment Used . . . . . . . .
Post-Repair or Specication Failure Adjustment List . . . . .
Adjustable Components . . . . . . . . . . . . . . . . . .
Factory Selectable Component . . . . . . . . . . . . . . .
Attenuation Values of Pad A3U4 . . . . . . . . . . . . . .
Harmonic and Subharmonic Levels . . . . . . . . . . . . .
Tracking Oscillator Range Centering . . . . . . . . . . . . .
Part Numbers for Figure 6-2 . . . . . . . . . . . . . . . .
Static-Safe Accessories . . . . . . . . . . . . . . . . . . .
Contents-6
.
.
.
.
.
.
.
.
.
.
.
.
.
.
.
.
.
.
.
.
.
.
.
.
.
.
.
.
.
.
.
.
.
.
.
.
.
.
.
.
.
.
.
.
.
.
.
.
.
.
.
.
.
.
.
.
.
.
.
.
.
.
.
.
.
.
.
.
.
.
.
.
.
.
.
.
.
.
.
.
.
.
.
.
.
.
.
.
.
.
.
.
.
.
.
.
.
.
.
.
.
.
.
.
.
.
.
.
.
.
.
.
.
.
.
.
.
.
.
.
.
.
.
.
.
.
.
.
.
.
.
.
.
.
.
.
.
.
.
.
.
.
.
.
.
.
.
.
.
.
.
.
.
.
.
.
.
.
.
.
.
.
.
.
.
.
.
.
.
.
.
.
.
.
.
.
.
.
.
.
.
.
.
.
.
.
.
.
.
.
.
.
.
.
.
.
.
.
.
.
.
.
.
.
.
.
.
.
2-1
2-3
2-10
3-2
3-4
3-5
4-2
4-4
4-8
4-15
4-18
4-23
4-24
4-31
4-35
4-36
4-37
5-2
5-3
5-3
5-3
5-10
5-11
5-18
6-4
7-3
HP 85640A RF Tracking Generator Operation and Service Manual
1
General Information
What You'll Find in This Operation and Service Manual . . .
Chapter 1, \General Information," gives specications and characteristics for the instrument.
Chapter 2, \Installation," discusses power requirements, spectrum analyzer compatibility, and
interconnect requirements, and gives a list of HP sales and service oces.
Chapter 3, \Operation," explains the use of front- and rear-panel features and gives the
steps for transmission and reection measurements using the tracking generator with a host
spectrum analyzer.
Chapter 4, \Performance Tests," describes the tests you'll use to verify the electrical
performance of the tracking generator.
Chapter 5, \Adjustment Procedures," provides steps to adjust assemblies of the tracking
generator.
Chapter 6, \Assembly Replaceable Parts," shows the replaceable parts of the tracking
generator.
Chapter 7, \Service Information," describes replacement procedures, suggests methods for
troubleshooting, and explains how to return the instrument for service or repair. In this
chapter you'll also nd lists of component-level replaceable parts, instrument block diagrams,
and schematic and component location diagrams for the A3 interface assembly.
What You'll Find in This Chapter
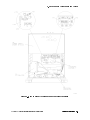
This chapter introduces you to the HP 85640A RF tracking generator. Figure 1-1 shows the
accessories supplied with the instrument at shipment; Table 1-1, \HP 85640 Specications" and
Table 1-2, \HP 85640 Characteristics," describe the instrument's performance under specied
conditions.
HP 85640A RF Tracking Generator Operation and Service Manual
General Information
1-1
Quick Overview of the HP 85640A RF Tracking Generator
The HP 85640A RF tracking generator provides a tracking source covering the 300 kHz to
2.9 GHz frequency range. It is compatible with HP 8560A/E, HP 8561A/B/E, HP 8562A/B, and
HP 8563A/E spectrum analyzers.
A 70 dB step attenuator combined with an 11 dB vernier provide continuously variable output
power levels from 0 dBm to 080 dBm. The tracking generator's output frequency is controlled
by the spectrum analyzer. The front-panel tracking control enables the tracking generator's
output frequency to be matched exactly to the spectrum analyzer input frequency, minimizing
tracking errors. Tracking errors appear as a decrease in the displayed signal amplitude when
the resolution bandwidth of the spectrum analyzer signal is decreased.
The HP 85640A can be leveled externally with a negative-polarity detector improving eective
source match. A rear-panel switch selects between internal and external leveling.
1-2
General Information
HP 85640A RF Tracking Generator Operation and Service Manual
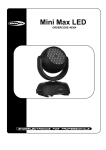
Accessories Supplied
Accessories (some not shown)
3 cables with BNC(m) connectors
1 cable with SMA(m) connectors
2 fuses, 1A 250V UL/CSA (for 100/120V operation)
or
2 fuses, 0.5A 250V IEC (for 220/240V operation)
HP Part Number
8120-1839
5061-9038
2110-0823
210-0824
Figure 1-1. HP 85640A with Accessories Supplied
HP 85640A RF Tracking Generator Operation and Service Manual
General Information
1-3
RF Tracking Generators Covered by This Manual
This manual applies to tracking generators with the serial number prexes listed inside the title
page.
Serial Numbers
Hewlett-Packard makes frequent improvements to its products to enhance their performance,
usability, or reliability. Hewlett-Packard service personnel have access to complete records of
design changes to each type of equipment, based on the equipment's serial number. Whenever
you contact Hewlett-Packard about your tracking generator, have the complete serial number
available to ensure obtaining the most complete and accurate information possible.
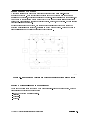
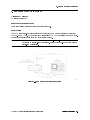
The serial number label is attached to the rear of the tracking generator. The serial number has
two parts: a prex (the rst four numbers and a letter), and a sux (the last ve numbers).
See Figure 1-2.
The rst four numbers of the prex are a code identifying the date of the last major design
change incorporated in your analyzer. The letter identies the country in which the unit
was manufactured. The ve-digit sux is a sequential number and is dierent for each unit.
Whenever you list the serial number or refer to it in obtaining information about your tracking
generator, be sure to use the complete number, including the full prex and the sux.
Figure 1-2. An Example of a Serial Number Label
Calibration Cycle
The performance tests located in Chapter 4, \Performance Tests," should be used every 12
months to check the analyzer against the specications listed in Table 1-1.
1-4
General Information
HP 85640A RF Tracking Generator Operation and Service Manual
Specications and Characteristics
Table 1-1 lists the tracking generator's specications. Unless stated otherwise, all specications
describe the tracking generator's warranted performance under these conditions:
a ve-minute warmup for ambient conditions.
a one-year calibration cycle.
all environmental requirements met.
tracking generator used with one of the compatible spectrum analyzers listed in
Table 1-1, \HP 85640 Specications."
Characteristics provide useful, but non-warranted, information in the form of typical, nominal,
or approximate values for tracking generator performance. See Table 1-2 for a list of tracking
generator characteristics.
HP 85640A RF Tracking Generator Operation and Service Manual
General Information
1-5
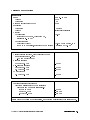
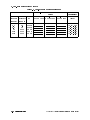
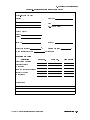
Table 1-1. HP 85640A Specications
Frequency Specications
Frequency Range
Minimum Resolution Bandwidth Supported
HP 8561A, HP 8562A/B
HP 8560A/E, HP 8561B/E, HP 8563A/E
1-6
General Information
300 kHz to 2.9 GHz
100 Hz
300 Hz
HP 85640A RF Tracking Generator Operation and Service Manual
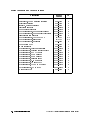
Amplitude Specications
Output Level
Range
Vernier
Attenuator
Maximum leveled output power
Resolution
Attenuator
Vernier
Accuracy
Level atness
(referenced to 300 MHz, vernier at 0 dB,
attenuator at 010 dB)
Output attenuator
Switching Accuracy
(10 dB to 70 dB settings, referenced to 0 dB setting
0 dBm to 080 dBm
>10 dB
70 dB
0 dBm
10 dB steps
Continuously adjustable
<62.0 dB
<60.8 dB per 10 dB step, to a
maximum of 61.5 dB
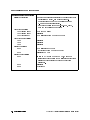
Spurious Outputs
Unless otherwise specied, with vernier set to 0 dBm
and attenuator set to 010 dB
(010 dBm output power)
Harmonic spurious
300 kHz to 2.9 GHz
Non-harmonic spurious
300 kHz to 2.0 GHz
2.0 GHz to 2.9 GHz
LO feedthrough
3.9 GHz to 6.8 GHz
<025 dBc
<027 dBc
<023 dBc
<026 dBm
Dynamic Range
Tracking generator feedthrough*
(Spectrum analyzer set to 300 Hz resolution
bandwidth and 0 dB input attenuation.)
300 kHz to 1 MHz
1 MHz to 2.0 GHz
2.0 GHz to 2.9 GHz
<095 dBm
<0115 dBm
<0110 dBm
* Leakage measured on spectrum analyzer with tracking generator delivering maximum
leveled output power into a 50
termination, and spectrum analyzer input terminated in 50
.
HP 85640A RF Tracking Generator Operation and Service Manual
General Information
1-7
Electromagnetic Specications
Electromagnetic Compatibility
Military specication
Conducted emissions
CE01 (narrowband)
CE03 (narrowband)
CE03 (broadband)
Conducted susceptibility
CS01
CS02
CS06
Radiated emissions
RE01
RE02
Radiated susceptibility
RS03
RS01
RS02
1-8
General Information
Conducted and radiated interference complies with CISPR
Publication 11 (1985), and MessempfaengerPostverfuegung 526/527/79 (Kennzeichnung Mit
F-Nummer/Funkschutzzeichen).
Meets the requirements of MIL-STD-461B, Part 4,
with the exceptions shown below:
1 kHz to 15 kHz only
Full limits
20 dB relaxation from 15 kHz to 100 kHz
Full limits
Full limits
Full limits
15 dB relaxation of 30 kHz
(exceptioned from 30 kHz to 50 kHz)
Full limits to 1 GHz
Limited to 1 V/m from 14 kHz to 1 GHz, with 20 dB
relaxation IF frequencies (30 dB relaxation at spectrum
analyzer IF frequencies for Option 001 spectrum
analyzers).
Full limits
Exceptioned
HP 85640A RF Tracking Generator Operation and Service Manual
General Specications
Type-tested to MIL-T-28800C, Class 5 environmental conditions as listed below:
Warmup
Temperature
Operating
Non-operating
Humidity
Altitude
Operating
Non-operating
Vibration
5 to 15 Hz
15 to 25 Hz
25 to 55 Hz
Pulse Shock
Half Sine
Transit Drop
5 min. from ambient conditions
010 C to +50 C
062 C to +85 C
95% at 40 C for 5 days
15,000 ft
50,000 ft
0.060 in. peak-to-peak excursion
0.040 in. peak-to-peak excursion
0.020 in. peak-to-peak excursion
30 g for 11 ms duration
8-in. drop on 6 faces and 8 corners
HP 85640A RF Tracking Generator Operation and Service Manual
General Information
1-9
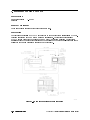
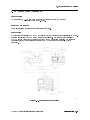
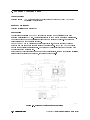
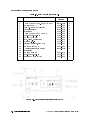
Physical and Mechanical Specications
Power Requirements
Voltage
Current
Maximum power dissipation
100, 120, 220, or 240 V ac, 610%
47 to 66 Hz
130 VA, 35 W
Compatibility
Works with HP 8560A/E*, HP 8561A/B/E,
HP 8562A/B, and HP 8563A/E portable
spectrum analyzers.
Weight
8.4 kg (18.5 lb)
Dimensions
A 337.6 mm (13.5 in) wide
B 461.1 mm (18.3 in) long
C 138.6 mm (5.5 in) deep
* Except HP 8560A/E Option 002. This option does not provide sucient 1st LO drive to the
HP 85640A.
1-10
General Information
HP 85640A RF Tracking Generator Operation and Service Manual
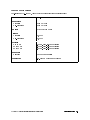
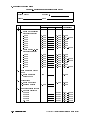
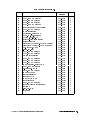
Table 1-2. HP 85640A Characteristics
Note
These are not specications. Characteristics provide useful, but nonwarranted,
information about instrument performance.
Frequency Characteristics
Frequency Drift
(after 30-min. warmup)
Tracking Drift
300 Hz per hour
Usable in a 1 kHz RES BW after 5 min.
Usable in a 300 Hz RES BW after 30 min.
Amplitude Characteristics
Output Range
+2.8 dBm to 080 dBm
Output Attenuator Repeatability
<60.2 dB
Eective Source Match
0 dB attenuator setting
10 dB attenuator setting
<1.92:1
<1.33:1
Dynamic Range
(300 Hz RES BW, 0 dB input attenuation)
300 kHz to 1 MHz
1 MHz to 2.0 GHz
2.0 GHz to 2.9 GHz
HP 85640A RF Tracking Generator Operation and Service Manual
>95 dB
>115 dB
>110 dB
General Information
1-11
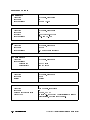
Inputs and Outputs
300 MHz INPUT
Connector
Impedance
Input amplitude
LO INPUT
Connector
Impedance
Frequency
Input amplitude
0.5V/GHz INPUT
Connector
Impedance
Input amplitude
BLANKING INPUT
Connector
Input amplitude
During sweep
During retrace
EXT ALC INPUT
Connector
Impedance
Polarity
RF OUTPUT
Connector
Impedance
Maximum safe reverse level
Output VSWR
1-12
General Information
BNC female, front panel
50
010 dBm 61.0 dB
SMA female, front panel
50
3.9107 GHz to 6.8107 GHz
+16.5 dBm 62.0 dB
BNC female, rear panel
>100 k
0.5 V/GHz of tuned frequency
BNC female, rear panel
Low TTL level
High TTL level
BNC female, rear panel
>10 k
Negative
Type N female, front panel
50
+30 dBm, 30 V dc
See Table 1-1, \HP 85640A Characteristics: Amplitude
Characteristics, Eective Source Match."
HP 85640A RF Tracking Generator Operation and Service Manual
2
Installation
What You'll Find in This Chapter . . .
This chapter explains how to set up the HP 85640A tracking generator for operation. You'll
also nd:
Serial numbers of host spectrum analyzers that can be used with the tracking generator.
Line power and line fuse requirements.
Illustrations of front- and rear-panel connections.
HP sales and service oce addresses.
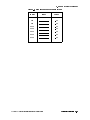
Compatibility with Portable Spectrum Analyzers
The HP 85640A is compatible with these portable spectrum analyzers:
Table 2-1.
Host Spectrum Analyzer-to-Tracking Generator Compatibility
Spectrum Analyzer Model Numbers
Serial Number
HP 8560A
HP 8560E
HP 8561A
HP 8561B
HP 8561E
HP 8562A
HP 8562B
HP 8563A
HP 8563E
all serials of non-Option 002
all serials of non-Option 002
all serials
all serials
all serials
all serials
all serials
all serials
all serials
HP 85640A RF Tracking Generator Operation and Service Manual
Installation
2-1
Initial Inspection
Is the Shipment Complete?
Figure 1-1 shows the parts and accessories that are shipped with your HP 85640A RF tracking
generator. If any part or accessory is missing, contact your sales representative.
Is the Shipping Container in Good Condition?
Inspect the shipping container. If the container or cushioning material is damaged, verify that
the contents are complete and that the analyzer functions correctly, both mechanically and
electrically.
If the contents are incomplete or if the HP 85640A fails the verication tests in Chapter 4,
notify any Hewlett-Packard sales and service oce (see Table 2-3). The HP sales and service
oce will arrange for repair or replacement without waiting for a claim settlement.
Save all packaging materials; show any damages to the container or cushioning materials to the
carrier.
Save the Packaging Materials
The shipping container and cushioning materials are shown in Figure 7-2. Save these materials,
to use when you ship your instrument, or return it for service or repair. If the original
materials are not available, you may order replacements from any HP sales and service oce
(see Table 2-3).
Instructions for repackaging the HP 85640A are in \Returning the RF Tracking Generator for
Service" in Chapter 7.
Preparing the RF Tracking Generator for Use
The RF tracking generator must be properly connected to one of the compatible portable
spectrum analyzers listed in Table 2-1. You also need to connect it to an ac power source. If
you want to install your tracking generator in an HP System II cabinet or a standard 19 inch
(486.2 mm) equipment rack, complete instructions are provided with the Option 908 and Option
909 rack mounting kits.
Caution
2-2
Installation
Before you connect your tracking generator to an ac power source, make sure
that the line voltage is correct, the line-voltage selector switch located on
the tracking generator rear panel is set to the correct voltage (refer to the
following paragraphs), and the proper fuse is installed. You can damage the
instrument if you connect it to the wrong voltage.
HP 85640A RF Tracking Generator Operation and Service Manual
Power Requirements
Table 2-2. Operating Power Requirements
100/120 V ac Operation 220/240 V ac Operation
Line Voltage
Line Current
Line Frequency
100 V to 120 V, 610%
1 A rms max
47 Hz to 66 Hz
HP 85640A RF Tracking Generator Operation and Service Manual
220 V to 240 V, 610%
0.5 A rms max
47 Hz to 66 Hz
Installation
2-3
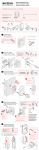
Setting the Line-Voltage Selector Switch
Set the tracking generator's rear-panel voltage selector switch to the line voltage range
(100, 120, 220, or 240 V) corresponding to the available ac voltage. Insert a small screwdriver
or similar tool in the line-module door slot and gently pry open the door. Rotate the voltage
barrel to the appropriate value.
Figure 2-1. Voltage Selection Switch and Line Fuse Locations
2-4
Installation
HP 85640A RF Tracking Generator Operation and Service Manual
Checking the Fuse
The type of ac line input fuse depends on the input line voltage. Use the correct fuse for your
voltage:
100 V to 120 V operation:
1 A 250 V UL/CSA
(HP part number 2110-0823)
(for use in any of the United States)
220 V to 240 V operation:
0.5 A 250 V IEC
(HP part number 2110-0458)
(for use in other countries)
The line fuse is housed in a small container located inside the rear-panel power-connector
module. When replacing a fuse, be sure the arrows on the container match the direction of the
arrows on the power-connector door. See Figure 2-1.
Power Cable
The HP 85640A is equipped with a three-wire power cable, in accordance with international
safety standards. When connected to an appropriate power source outlet, this cable grounds
the instrument cabinet.
Warning
Failure to ground the instrument properly can result in personal injury.
Before turning on the tracking generator, you must connect its protective
earth terminals to the protective conductor of the main power cable.
Insert the main power cable plug only into a socket outlet that has a
protective earth contact.
Do not defeat the earth-grounding protection by using an extension cable,
power cable, or auto transformer without a protective ground conductor.
If you are using an auto transformer, make sure its common terminal is
connected to the protective earth contact of the power source socket.
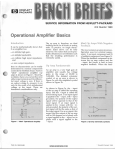
Various power cables are available for the power outlets unique to specic geographic areas.
The appropriate cable is included with the instrument when it is shipped to an area requiring
one of these cables. You can order additional ac power cables listed in Figure 2-2 for use in
dierent areas. Figure 2-2 also illustrates the plug congurations and identies the geographic
area in which each cable is appropriate.
HP 85640A RF Tracking Generator Operation and Service Manual
Installation
2-5
Figure 2-2. AC Power Cables Available
2-6
Installation
HP 85640A RF Tracking Generator Operation and Service Manual
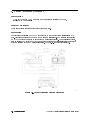
Connecting an HP 85640A to a Compatible Spectrum Analyzer
Figure 1-1 contains the cable part numbers included with your tracking generator at shipment.
Use these cables to connect your portable tracking generator to a compatible spectrum
analyzer. Figure 2-3 and Figure 2-4 illustrate the proper cable connections between the
tracking generator and an HP 8561B spectrum analyzer. Any of the compatible spectrum
analyzers is connected to the same inputs and outputs as illustrated in these gures.
Note
Connect the cables with the tracking generator placed beneath the portable
spectrum analyzer to prevent the cables from obscuring your view of the
display during operation.
Figure 2-3. Front-Panel Cable Connections
HP 85640A RF Tracking Generator Operation and Service Manual
Installation
2-7
Note
Figure 2-4. Rear-Panel Cable Connections
On HP 8560 E-Series spectrum analyzers, BLANKING OUTPUT is labeled
BLKG/GATE OUTPUT.
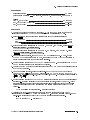
Turning On the Tracking Generator
If the tracking generator does not seem to function properly the rst time you turn it on, turn
the power o and refer to the cable connection illustrations in Figure 2-3 and Figure 2-4. If the
cable connections appear to be correct, contact one of the HP sales and service oces listed in
Table 2-3.
2-8
Installation
HP 85640A RF Tracking Generator Operation and Service Manual
Sales and Service Oces
Hewlett-Packard has sales and service oces around the world providing complete support
for Hewlett-Packard products. To obtain servicing information, or to order replacement parts,
contact the nearest Hewlett-Packard sales and service oce listed in Table 2-3.
In any correspondence, be sure to include the pertinent information about model numbers,
serial numbers, or assembly part numbers.
HP 85640A RF Tracking Generator Operation and Service Manual
Installation
2-9
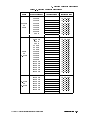
Table 2-3. Hewlett-Packard Sales and Service Oces
US FIELD OPERATIONS
Customer Information
California, Northern
California, Southern
Hewlett-Packard Company
Hewlett-Packard Co.
Hewlett-Packard Co.
19320 Pruneridge Avenue
301 E. Evelyn
1421 South Manhattan Ave.
Cupertino, CA 95014, USA
Mountain View, CA 94041
Fullerton, CA 92631
(800) 752-0900
(415) 694-2000
(714) 999-6700
Colorado
Georgia
Illinois
Hewlett-Packard Co.
Hewlett-Packard Co.
Hewlett-Packard Co.
24 Inverness Place, East
2000 South Park Place
5201 Tollview Drive
Englewood, CO 80112
Atlanta, GA 30339
Rolling Meadows, IL 60008
(303) 649-5000
(404) 955-1500
(708) 255-9800
New Jersey
Texas
120 W. Century Road
930 E. Campbell Rd.
Paramus, NJ 07653
Richardson, TX 75081
(201)599-5000
(214) 231-6101
EUROPEAN FIELD OPERATIONS
Headquarters
France
Germany
Hewlett-Packard S.A.
Hewlett-Packard France
Hewlett-Packard GmbH
150, Route du Nant-d'Avril
1 Avenue Du Canada
Berner Strasse 117
1217 Meyrin 2/Geneva
Zone D'Activite De Courtaboeuf 6000 Frankfurt 56
Switzerland
F-91947 Les Ulis Cedex
West Germany
(41 22) 780.8111
France
(49 69) 500006-0
(33 1) 69 82 60 60
Great Britain
Hewlett-Packard Ltd
Eskdale Road, Winnersh Triangle
Wokingham, Berkshire RF11 5DZ
England
(44 734) 696622
INTERCON FIELD OPERATIONS
Headquarters
Australia
Canada
Hewlett-Packard Company
Hewlett-Packard Australia Ltd.
Hewlett- Packard (Canada) Ltd.
3495 Deer Creek Rd.
31-41 Joseph Street
17500 South Service Road
Palo Alto, California 94304-1316
Blackburn, Victoria 3130
Trans- Canada Highway
(415) 857-5027
(61 3) 895-2895
Kirkland, Quebec H9J 2X8
Canada
(514) 697-4232
China
Japan
China Hewlett-Packard Co.
Yokogawa-Hewlett-Packard Ltd. Hewlett-Packard Singapore (Pte.) Ltd
Singapore
38 Bei San Huan X1 Road
1-27-15 Yabe, Sagamihara
1150 Depot Road
Shuang Yu Shu
Kanagawa 229, Japan
Singapore 0410
Hai Dian District
(81 427) 59-1311
(65) 273-7388
Beijing, China
(86 1) 256-6888
Taiwan
Hewlett-Packard Taiwan
8th Floor, H-P Building
337 Fu Hsing North Road
Taipei, Taiwan
(886 2) 712-0404
2-10
Installation
HP 85640A RF Tracking Generator Operation and Service Manual
3
Operation
What You'll Find in This Chapter . . .
After a quick overview of the HP 85640A RF tracking generator, you'll learn about:
Using front- and rear-panel features.
Connecting the tracking generator to an HP host portable spectrum analyzer.
Making a simple transmission measurement.
Making a simple reection measurement.
HP 85640A RF Tracking Generator Operation and Service Manual
Operation
3-1
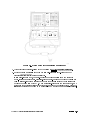
Front-Panel Features
LINE SWITCH
LO INPUT
300 MHz INPUT
RF OUTPUT
TRACKING ADJUST
knob
OUTPUT LEVEL
knobs
UNLEVELED LED
Connector
turns the instrument on or o. The LED above the switch indicates
whether or not ac power is applied to the tracking generator.
uses the 1st LO output from the host spectrum analyzer to drive the
tuning of the tracking generator.
uses the 300 MHz calibrator signal (3rd LO) of the host spectrum
analyzer to drive the tracking generator.
is the output signal of the tracking generator.
allows you to adjust for any tracking errors that may result from
dierences between the tracking generator output frequency and the
frequency to which the spectrum analyzer is tuned.
The tracking adjust knob is non-linear; clockwise and counter-clockwise
rotation will not necessarily have an equal eect on the displayed
signal.
adjust the tracking generator's output power. The vernier (left-hand)
knob makes ne-resolution adjustments, while the right-hand knob
adjusts the attenuator from 0 dB to 070 dB in 10 dB increments.
lights when an unleveled condition is detected (except during retrace).
Table 3-1. Front-Panel Interconnections
Frequency Range
Amplitude Limits
LO INPUT (SMA female)
3.9107 GHz 0 6.8107 GHz +16.5 dBm 62.0 dB
010 dBm 61.0 dB
300 MHz INPUT (BNC female)
N/A
RF OUTPUT (Type N female)
300 kHz 0 2.9 GHz
3-2
Operation
Maximum output power: 0 dBm
Minimum output power: 080 dBm
HP 85640A RF Tracking Generator Operation and Service Manual
Figure 3-1. Front-Panel Feature Overview
HP 85640A RF Tracking Generator Operation and Service Manual
Operation
3-3
Rear-Panel Features
Input power
ALC INT EXT
EXT ALC INPUT
BLANKING
INPUT
0.5V/GHZ INPUT
The appropriate power cable is included with your tracking generator.
Connect the main-power plug only to a socket outlet that has protective
ground contact.
allows you to select between internal and external leveling.
allows you to form an external leveling loop, using a negative-polarity
detector.
uses the spectrum analyzer's blanking output to deactivate the unleveled
LED during retrace.
uses the 0.5 V/GHz output from the spectrum analyzer for atness
compensation.
Table 3-2. Rear-Panel Interconnections
Connector
Amplitude Voltage Limits
EXT ALC INPUT (BNC female)
0 to 01 V (operating)
615 V (damage level)
BLANKING INPUT (BNC female)
TTL high during retrace
TTL low during sweep
0.5 V/GHz INPUT (BNC female)
0.5 V/GHz of tuned frequency
Figure 3-2. HP 85640A Rear-Panel Feature Overview
3-4
Operation
HP 85640A RF Tracking Generator Operation and Service Manual
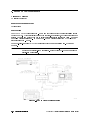
HP 85640A and Host Spectrum Analyzer Connections
One SMA cable and three BNC cables connect the tracking generator to a host spectrum
analyzer, as shown in Figure 3-3 and Figure 3-4.
Table 3-3. HP 85640A and Host Spectrum Analyzer Connections
Front-panel connections
Rear-panel connections
Tracking Generator to Spectrum Analyzer
1ST LO INPUT to 1ST LO OUTPUT
300 MHz INPUT to CAL OUTPUT
0.5 V/GHz INPUT to LO SWPj0.5V/GHz OUTPUT
BLANKING INPUT to BLANKING OUTPUT or
BLKG/GATE OUTPUT
Figure 3-3. Tracking Generator-to-Host Analyzer Front-Panel Connections
HP 85640A RF Tracking Generator Operation and Service Manual
Operation
3-5
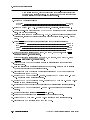
Figure 3-4. Tracking Generator-to-Host Analyzer Rear-Panel Connections
When you have made these connections, select the 0.5 V/GHz output on the spectrum analyzer:
NNNNNNNNNNNNNNNNNNNNNNNNNNNNNNNNNNNNNNNNNNNNNNN NNNNNNNNNNNNNNNNNNNNNNNNNNNNNNNNNNNNNN
On an HP 8561A or HP 8562A/B, select 4SWEEP5 REAR PNL OUTPUT .5V/GHZ(FAV) .
NNNNNNNNNNNNNNNNNNNNNNNNNNNNNNNN
On an HP 8560A/E, HP 8561B/E, or HP 8563A/E press 4AUX CTRL5 REAR PANEL
.5V/GHZ (FAV) .
NNNNNNNNNNNNNNNNNNNNNNNNNNNNNNNNNNNNNNNNN
To view the tracking generator's output, connect the tracking generator's RF OUTPUT directly
to the host spectrum analyzer's INPUT 50
connector. The spectrum analyzer should be tuned
between 300 kHz and 2.9 GHz, within the specied range of the tracking generator.
NNNNNNNNNNNNNNNNNNNNNNNNNN
On an HP 8560E, HP 8561E, or HP 8563E, press 4SWEEP5 GATE OFF .
3-6
Operation
HP 85640A RF Tracking Generator Operation and Service Manual
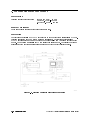
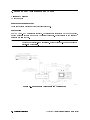
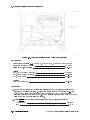
Measurement Overview
A spectrum analyzer combined with a tracking generator forms a stimulus-response
measurement system. With the tracking generator as the swept source and the spectrum
analyzer as the receiver, operation is analogous to a single-channel scalar network analyzer. It
can be used to characterize a device under test (DUT) in terms of transmission or reection
parameters. Transmission measurements include ripple, atness, and rejection. Return loss is a
typical reection measurement.
Because it is a narrowband system, the tracking generator's output frequency tracks the
spectrum analyzer's input frequency, resulting in a wide dynamic range. This wide dynamic
range is illustrated in the following simplied block diagram.
Figure 3-5. Host Spectrum Analyzer and Tracking Generator System Block Diagram
Making a Stimulus-Response Measurement
There are four basic steps to perform when doing stimulus-response measurements, whether
transmission or reection measurements:
Set up the spectrum analyzer settings.
Calibrate.
Normalize.
Measure.
HP 85640A RF Tracking Generator Operation and Service Manual
Operation
3-7
Equipment Needed
The DUT used in the transmission and reection measurements shown in this chapter is a
bandpass lter with a 321.4 MHz center frequency and a specied rejection of 080 dB. For
the test setups in Figure 3-8, Figure 3-22, Figure 3-33, and Figure 3-43, you also will need
a directional bridge with sucient range to accommodate the frequency of the DUT, a 50
termination, a short and an open, a barrel or bullet connector (to replace the DUT when
making the reference trace), and appropriate cables and adapters.
Note
3-8
Operation
If you have an HP 8560A/E, HP 8561B/E, or HP 8563A/E spectrum analyzer,
follow the instructions starting on page 3-9 for a transmission measurement
and on page 3-30 for a reection measurement. These spectrum analyzers
have tracking generator-related softkeys included in their rmware.
If you have an HP 8561A or HP 8562A/B spectrum analyzer, follow the
instructions starting on page 3-21 for a transmission measurement and on
page 3-37 for a reection measurement.
HP 85640A RF Tracking Generator Operation and Service Manual
Transmission Measurements
Making a Transmission Measurement Using an HP 8560A/E, HP 8561B/E,
or HP 8563A/E Spectrum Analyzer
Note
Instructions for making transmission measurements using an HP 8561A or
HP 8562A/B begin on page 3-21.
The examples in this section were made using an HP 8560A spectrum analyzer,
but are similar to results you may expect with an HP 8560E, HP 8561B/E or
HP 8563A/E.
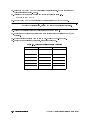
Set up the System.
To measure the rejection of a bandpass lter:
1. Make the necessary connections between the spectrum analyzer and the tracking generator
(see Figure 3-3).
2. Examine the tracking generator's output power by connecting its RF OUTPUT directly to
the spectrum analyzer's INPUT 50
.
3. On the spectrum analyzer, press 4PRESET5 4FREQUENCY5 START FREQ 300 4kHz5 STOP FREQ
2.9 4GHz5.
4. Select the 0.5 V/GHz OUTPUT on the spectrum analyzer by pressing 4AUX CONTROL5
REAR PANEL .5V/GHZ(FAV) .
NNNNNNNNNNNNNNNNNNNNNNNNNNNNNNNN
NNNNNNNNNNNNNNNNNNNNNNNNNNNNN
NNNNNNNNNNNNNNNNNNNNNNNNNNNNNNNN NNNNNNNNNNNNNNNNNNNNNNNNNNNNNNNNNNNNNN
NNNNNNNNNNNNNNNNNNNNNNNNNN
On an HP 8560E, HP 8561E, or HP 8563E, press 4SWEEP5 GATE OFF .
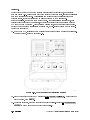
5. Adjust the tracking generator's output power with the OUTPUT LEVEL controls: set the
output power of the tracking generator to 010 dBm by setting the attenuator (right-hand)
knob to 010 dBm, and the vernier (left-hand) knob to 0 dBm. (The lter we are testing will
not be damaged by the 010 dBm power level.)
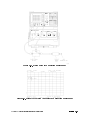
Figure 3-6 shows the spectrum analyzer display with these settings.
Note
Although the displayed start frequency annotation was set to 300 kHz, notice
that it remains at 0 Hz. This is due to the resolution of the display. If the stop
frequency is decreased to 1 GHz, the start frequency reads 300 kHz.
HP 85640A RF Tracking Generator Operation and Service Manual
Operation
3-9
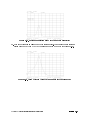
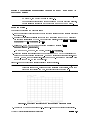
Figure 3-6. Tracking Generator Power over Specied Frequency Range
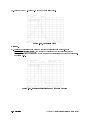
6. Connect the DUT as shown in Figure 3-8. Figure 3-7 shows the corresponding display.
Figure 3-7. Display of DUT Response
3-10
Operation
HP 85640A RF Tracking Generator Operation and Service Manual
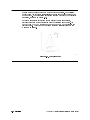
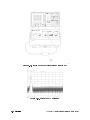
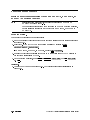
Figure 3-8. System Setup for Transmission Measurement
7. Access tracking generator-related keys by pressing 4AUX CTRL5 TRACKING GENRATOR .
NNNNNNNNNNNNNNNNNNNNNNNNNNNNNNNNNNNNNNNNNNNNNNNNNNNNN
8. Set the spectrum analyzer's sweep time to stimulus-response auto-coupled mode by
pressing SWP CPL SR SA until SR is selected.
NNNNNNNNNNNNNNNNNNNNNNNNNNNNNNNNNNNNNNNNN
In stimulus-response mode, the auto-coupled sweep times usually are much faster for
swept-response measurements. Stimulus-response auto-coupled sweep times typically are
valid in stimulus-response measurements where the system's frequency span is less than
20 times the bandwidth of the DUT. When a stimulus-response sweep time is chosen, an E
appears in the special functions area at the left-hand side of the display screen. Figure 3-9
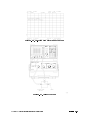
illustrates the faster sweep time of 50 ms instead of 60 ms for the same analyzer settings.
HP 85640A RF Tracking Generator Operation and Service Manual
Operation
3-11
Figure 3-9. Faster Sweep Times in Stimulus-Response Auto-Coupled Mode
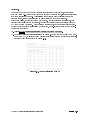
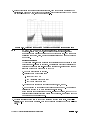
9. Because this test is for bandpass lter rejection only, tune the spectrum analyzer so the
lter's roll-o takes up most of trace on the display. Set the start frequency to 1 MHz and
the stop frequency to 1 GHz, as shown in Figure 3-10.
Figure 3-10. Adjusting the Spectrum Analyzer for Measurement Requirements
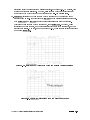
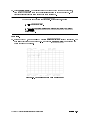
10. Decrease resolution bandwidth to reduce the displayed average noise level. Press
4BW5 RES BW (to select MAN), then press 4+5 on the spectrum analyzer. In Figure 3-11,
resolution bandwidth is set at 300 kHz.
11. Narrow video bandwidth to smooth the noise; press VIDEO BW (to select MAN), then press
4+5 on the spectrum analyzer. In Figure 3-11, video bandwidth is set at 300 Hz.
NNNNNNNNNNNNNNNNNNNN
NNNNNNNNNNNNNNNNNNNNNNNNNN
3-12
Operation
HP 85640A RF Tracking Generator Operation and Service Manual
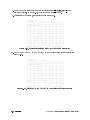
Figure 3-11. Decrease Resolution Bandwidth to Improve Sensitivity
12. Note the decrease in amplitude due to the tracking error. Compensate for any tracking
errors with the TRACKING ADJUST vernier knob on the HP 85640A (see Figure 3-12).
Figure 3-12. Using Tracking Adjust to Compensate for Tracking Error
HP 85640A RF Tracking Generator Operation and Service Manual
Operation
3-13
Note
Tracking errors occur when the tracking generator's output frequency does not
exactly match the input frequency of the spectrum analyzer. The resulting
product from the spectrum analyzer's input mixer is not at the center of the
IF bandwidth. The degradation in tracking causes a decrease of the displayed
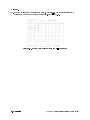
amplitude, as shown in Figure 3-13.
Because a small error in tracking causes a larger change in amplitude,
tracking errors are most noticeable in narrow resolution bandwidths. Use
the TRACKING ADJUST vernier knob on the HP 85640A to compensate for
tracking errors. Adjust the knob until the displayed signal increases to its
maximum amplitude.
Figure 3-13. Tracking Error
3-14
Operation
HP 85640A RF Tracking Generator Operation and Service Manual
Calibrate.
Notice that the output power of the tracking generator is not perfectly at, as previously
shown in Figure 3-6. This is due in part to the frequency response error, inherent in all scalar
network measurement systems. Normalization is a technique used to eliminate frequency
response errors, thereby increasing the amplitude accuracy of the measurement.
Before normalizing, a reference trace must be taken. For transmission measurements, this
reference trace is referred to as a \thru," because the reference trace is measured with the
DUT removed from the system. For reection measurements, an open/short average is used.
Because you are making a transmission measurement, a thru-reference trace must be stored.
To store the thru trace:
13. Press 4AUX CTRL5 TRACKING GENRATOR SOURCE CAL MENU CAL THRU .
NNNNNNNNNNNNNNNNNNNNNNNNNNNNNNNNNNNNNNNNNNNNNNNNNNNNN NNNNNNNNNNNNNNNNNNNNNNNNNNNNNNNNNNNNNNNNNNNNNNN NNNNNNNNNNNNNNNNNNNNNNNNNN
14. The guided calibration routine illustrated in Figure 3-14 prompts you to connect the thru.
Remove the DUT, replacing it with a barrel connector for optimum measurement integrity,
and connect the thru as shown in Figure 3-15.
Figure 3-14. Guided Calibration Prompt
HP 85640A RF Tracking Generator Operation and Service Manual
Operation
3-15
Figure 3-15. Thru Connected for Guided Calibration Routines
3-16
Operation
HP 85640A RF Tracking Generator Operation and Service Manual
15. Press STORE THRU when ready. The thru trace is stored in trace B. It is also stored in an
internal memory location in the analyzer. The state information of the thru-reference trace
is stored in state register #9. This trace can be recalled for future use. In Figure 3-16, the
DUT is reconnected and trace B is in view, showing the thru trace.
NNNNNNNNNNNNNNNNNNNNNNNNNNNNNNNN
Note
NNNNNNNNNNNNNNNNNNNNNNNNNNNNNNNN
If SAVE LOCK is on, pressing STORE THRU causes the message SAVELOCK ON to
appear in the active function area. If this happens, press:
a.
4SAVE5
NNNNNNNNNNNNNNNNNNNNNNNNNNNNNNNNNNNNNNNNN
SAVE LOCK OFF .
NNNNNNNNNNNNNNNNNNNNNNNNNNNNNNNNNNNNNNNNNNNNNNNNNNNNNNNN NNNNNNNNNNNNNNNNNNNNNNNNNNNNNNNNNNNNNNNNNNNNNNN NNNNNNNNNNNNNNNNNNNNNNNNNN
b. 4AUX CTRL5 TRACKING GENERATOR SOURCE CAL MENU CAL THRU
STORE THRU .
NNNNNNNNNNNNNNNNNNNNNNNNNNNNNNNN
Figure 3-16. Display of Thru-Reference Trace in Trace B
Normalize.
NNNNNNNNNNNNNNNNNNNNNNNNNNNNNNNNNNNNNNNNNNNNNNNNNNNNNNNN NNNNNNNNNNNNNNNNNNNNNNNNNNNNNNNNNNNNNNNNNNNNNNN
16. To normalize, press 4AUX CTRL5 TRACKING GENERATOR NORMLIZE ON OFF until ON is
selected. Notice that an arrow appears on each side of the graticule when normalization is
activated. These arrows mark the normalized reference position, or the position where 0
dB insertion loss (transmission measurements) or 0 dB return loss (reection measurements)
normally resides.
When normalization is ON, trace math is being performed on the active trace:
A 0 B + NRP ! A
where:
A is the active trace,
B is the stored thru-reference trace,
NRP is the normalized reference position.
When normalization is on, an N appears in the special function section of the display
screen. Notice that the reference level reading changes to dB to reect this relative
measurement (see Figure 3-17).
HP 85640A RF Tracking Generator Operation and Service Manual
Operation
3-17
Note
After a reference trace is saved, changing the settings of the spectrum
analyzer, then activating normalization, will cause an ERR 902 BAD NORM.
Error messages are displayed in the lower right-hand corner of the spectrum
analyzer's display. To clear the error (and obtain a valid measurement), either
reset the analyzer to the same settings as the reference trace, or save a new
reference trace.
Figure 3-17. Normalized Trace
Measure.
17. Measure the rejection range using the spectrum analyzer's delta markers. Press
4PEAK SEARCH5 MARKER DELTA , and adjust the vernier knob on the front panel of the
spectrum analyzer to position the second marker in the rejection area of the bandpass lter.
See Figure 3-18.
NNNNNNNNNNNNNNNNNNNNNNNNNNNNNNNNNNNNNN
Figure 3-18. Measuring Rejection Range with Delta Markers
18. Press 4AMPLITUDE5; note that activating normalization changes the REF LVL softkey
label to NORM REF LVL . NORM REF LVL , like NORM REF POSN , is a trace math function
that allows you to change the position of the normalized trace within the range of the
NNNNNNNNNNNNNNNNNNNNNNN
NNNNNNNNNNNNNNNNNNNNNNNNNNNNNNNNNNNNNN
3-18
Operation
NNNNNNNNNNNNNNNNNNNNNNNNNNNNNNNNNNNNNN
NNNNNNNNNNNNNNNNNNNNNNNNNNNNNNNNNNNNNNNNN
HP 85640A RF Tracking Generator Operation and Service Manual
graticule without changing spectrum analyzer settings. See Figure 3-19. As a result, your
measurement remains calibrated. However, using these two trace math functions may
mean that the top of the screen does not represent the gain-compression limit.
19. RANGE LVL increases the dynamic range of the measurement by changing the input
attenuator and IF gain. It is equivalent to REF LVL used in signal analysis measurements.
Both RANGE LVL and REF LVL ensure the input signal is not in gain compression.
NNNNNNNNNNNNNNNNNNNNNNNNNNNNN
NNNNNNNNNNNNNNNNNNNNNNN
NNNNNNNNNNNNNNNNNNNNNNNNNNNNN
NNNNNNNNNNNNNNNNNNNNNNN
NNNNNNNNNNNNNNNNNNNNNNNNNNNNN
To increase dynamic range of the measurement, press RANGE LVL . Note that, while
increasing the dynamic range, more errors are introduced into the measurement, such as
attenuator switching. However, as shown in Figure 3-20, dynamic range level has increased
when using RANGE LVL .
NNNNNNNNNNNNNNNNNNNNNNNNNNNNN
Figure 3-19.
NNNNNNNNNNNNNNNNNNNNNNNNNNNNNNNNNNNNNN
NORM REF LVL
Figure 3-20.
Adjusts the Trace and Retains Analyzer Settings
NNNNNNNNNNNNNNNNNNNNNNNNNNNNN
RANGE LVL
Increases Dynamic Measurement Range
HP 85640A RF Tracking Generator Operation and Service Manual
Operation
3-19
Note
3-20
Operation
If the actual signal measurement is beyond the gain-compression limit, or
below the bottom graticule of the display, an error message appears in the
lower right-hand corner of the display. In the case shown in Figure 3-20,
the passband information has been adjusted o-screen in order to view
the rejection range with better resolution. Changing the analyzer settings
to raise the pass-band information above the top of the screen causes an
ERR 903 A>DLMT.
HP 85640A RF Tracking Generator Operation and Service Manual
Making a Transmission Measurement Using an HP 8561A or HP 8562A/B
Spectrum Analyzer
Note
Instructions for making transmission measurements using an HP 8560A/E,
HP 8561B/E, or HP 8563A/E begin on page 3-9.
The examples in this section were made using an HP 8562B spectrum analyzer,
but are similar to results you may expect with an HP 8561A or HP 8562A.
Set up the System.
To measure the rejection of a bandpass lter:
1. Make the necessary connections between the spectrum analyzer and the tracking generator
(see Figure 3-3).
2. Examine the tracking generator's output power by connecting its RF OUTPUT directly to
the spectrum analyzer's INPUT 50
. On the spectrum analyzer, press 4PRESET5 4FREQUENCY5
START FREQ 300 4kHz5 STOP FREQ 2.9 4GHz5.
NNNNNNNNNNNNNNNNNNNNNNNNNNNNNNNN
NNNNNNNNNNNNNNNNNNNNNNNNNNNNN
3. Select the 0.5 V/GHz OUTPUT on the spectrum analyzer by pressing 4SWEEP5
REAR PNL OUTPUT .5V/GHZ(FAV) .
NNNNNNNNNNNNNNNNNNNNNNNNNNNNNNNNNNNNNNNNNNNNNNN NNNNNNNNNNNNNNNNNNNNNNNNNNNNNNNNNNNNNN
NNNNNNNNNNNNNNNNNNNNNNNNNN
On an HP 8560E, HP 8561E, or HP 8563E, press 4SWEEP5 GATE OFF .
4. Adjust the tracking generator's output power with the OUTPUT LEVEL controls; set the
output power of the tracking generator to 010 dBm by setting the attenuator (right-hand)
knob to 010 dBm, and the vernier (left-hand) knob to 0 dB. (The lter we are testing will
not be damaged by the 010 dBm power level.)
Figure 3-21 shows the spectrum analyzer display with these settings.
Note
Although the displayed start frequency annotation was set to 300 kHz, notice
that it remains at 0 Hz. This is due to the resolution of the display. If the stop
frequency is decreased to 1 GHz, the start frequency reads 300 kHz.
Figure 3-21. Tracking Generator Power over Specied Frequency Range
5. Connect the DUT as shown in Figure 3-22. Figure 3-23 shows the corresponding display.
HP 85640A RF Tracking Generator Operation and Service Manual
Operation
3-21
Figure 3-22. System Setup for Transmission Measurement
Figure 3-23. Display of DUT Response
3-22
Operation
HP 85640A RF Tracking Generator Operation and Service Manual
6. Because this test is for bandpass lter rejection only, tune the spectrum analyzer so the
lter's roll-o takes up most of trace on the display. Set the start frequency to 1 MHz and
the stop frequency to 1 GHz, as shown in Figure 3-24.
Note
Figure 3-24. Adjusting the Spectrum Analyzer for Measurement Requirements
HP 8561A and HP 8562A/B spectrum analyzers do not have tracking
generator-related keys. Sweep-time settings during a stimulus-response
measurement are highly dependent on the device under test. Any changes to
resolution bandwidth, span, or other analyzer settings may cause a change in
sweep time.
Setting Sweeptimes
Accurate stimulus-response measurements typically can use sweeptimes much
faster than auto-coupled sweeptimes. The following procedure calculates the
fastest sweeptime for stimulus-response measurements, assuming the span is
less than 20 times the bandwidth of the DUT:
1. Note the autocoupled sweeptime.
2. Calculate each of the following:
a. span (Hz) / 156 GHz
b. 500 / resolution bandwidth (Hz)
c. 200 / video bandwidth (Hz)
3. Determine the greatest of the values in steps 2a, 2b, and 2c.
4. Set sweeptime to the smaller of the values in steps 1 and 3. The analyzer
will limit sweeptime to 50 msec or less in non-zero spans.
If the value in step 4 is less than the auto-coupled sweeptime, the MEAS UNCAL
indicator will be displayed; this message may be ignored, as it has no eect on
the outcome of the measurement.
7. Decrease resolution bandwidth to reduce the displayed average noise level. Press 4BW5
RES BW 4+5 on the spectrum analyzer. Note the decrease in amplitude due to the tracking
error.
NNNNNNNNNNNNNNNNNNNN
HP 85640A RF Tracking Generator Operation and Service Manual
Operation
3-23
NNNNNNNNNNNNNNNNNNNNNNNNNN
8. Narrow the video bandwidth to smooth the noise; press 4BW5 VIDEO BW
spectrum analyzer. In Figure 3-25, video bandwidth is set at 300 Hz.
9. Recalculate the sweeptime, as described in the note above.
+
4 5
on the
Figure 3-25. Decrease Resolution Bandwidth to Improve Sensitivity
10. Use TRACKING ADJUST on the HP 85640A to compensate for any tracking errors (see
Figure 3-26).
Figure 3-26. Using TRACKING ADJUST to Compensate for Tracking Error
3-24
Operation
HP 85640A RF Tracking Generator Operation and Service Manual
Note
Tracking errors occur when the tracking generator's output frequency does not
exactly match the input frequency of the spectrum analyzer. The resulting
product from the spectrum analyzer's input mixer is not at the center of the
IF bandwidth. The degradation in tracking causes a decrease of the displayed
amplitude, as shown in Figure 3-27.
Because a small error in tracking causes a larger change in amplitude,
tracking errors are most noticeable in narrow resolution bandwidths. Use
the TRACKING ADJUST vernier knob on the HP 85640A to compensate for
tracking errors. Adjust the knob until the displayed signal increases to its
maximum amplitude.
Figure 3-27. Tracking Error
HP 85640A RF Tracking Generator Operation and Service Manual
Operation
3-25
Calibrate.
Notice that the output power of the tracking generator is not perfectly at, as previously
shown in Figure 3-21. This is due in part to the frequency response error, inherent in all scalar
network measurement systems. Normalization is a technique used to eliminate frequency
response errors, thereby increasing the amplitude accuracy of the measurement.
Before normalizing, a reference trace must be taken. For transmission measurements, this
reference trace is referred to as a \thru," because the reference trace is measured with the
DUT removed from the system. For reection measurements, an open/short average is used.
Because you are making a transmission measurement, a thru-reference trace must be stored.
To store the thru trace:
11. Remove the DUT, replacing it with a barrel connector for optimum measurement integrity.
Connect the thru, as shown in Figure 3-28.
Figure 3-28. Thru Connected for Calibration Routine
12. Store the thru trace in trace B by pressing 4TRACE5 TRACE B CLR-WRT B . Wait for the new
speed to nish, then VIEW B .
NNNNNNNNNNNNNNNNNNNNNNN NNNNNNNNNNNNNNNNNNNNNNNNNNNNN
NNNNNNNNNNNNNNNNNNNN
13. For future reference, store the thru trace in a trace register. Press 4SAVE5 SAVE TRACE B
TRACE n (where n is the number of the trace register.)
NNNNNNNNNNNNNNNNNNNNNNNNNNNNNNNNNNNNNN
NNNNNNNNNNNNNNNNNNNNNNN
3-26
Operation
HP 85640A RF Tracking Generator Operation and Service Manual
Note
NNNNNNNNNNNNNNNNNNNNNNN
If SAVE LOCK is on, pressing TRACE n on an HP 8561A/62A causes the
message SAVELOCK ON to appear in the active function area.
NNNNNNNNNNNNNNNNNNNNNNNNNNNNNNNNNNNNNN NNNNNNNNNNNNNNNNNNNNNNNNNNNNNNNNNNNNNN NNNNNNNNNNNNNNNNNNNNNNN
If this happens, press 4SAVE5 SAVELOCK OFF SAVE TRACE B TRACE n
Figure 3-29 shows the on-screen condition after a thru trace is stored. In the illustration, the
DUT is reconnected and trace B is in view, displaying the thru trace.
Figure 3-29. Display of Thru-Reference Trace in Trace B
Normalize.
14. To normalize, activate the trace math function, A0B+DL ! A, by pressing 4TRACE5 MORE .
Press A0B+DL!A ON OFF to select ON.
NNNNNNNNNNNNNN
NNNNNNNNNNNNNNNNNNNNNNNNNNNNNNNNNNNNNNNNNNNNNNNNNN
Note
When trace math is on, an M will appear in the special functions section of the
display.
15. If necessary, make adjustments to the position of the trace by changing the position of the
display line. Access the display line by pressing 4DISPLAY5 DSPL LIN ON OFF . The preset
value of the display line is 0 dBm.
NNNNNNNNNNNNNNNNNNNNNNNNNNNNNNNNNNNNNNNNNNNNNNN
HP 85640A RF Tracking Generator Operation and Service Manual
Operation
3-27
16. Reconnect the DUT. Figure 3-30 shows the normalized trace.
Figure 3-30. Normalized Trace
Measure.
17. Measure the rejection range using the spectrum analyzer's delta markers. Press
4PEAK SEARCH5 MARKER DELTA , and adjust the vernier knob on the front panel of the
spectrum analyzer to position the second marker in the rejection area of the bandpass lter.
See Figure 3-31.
NNNNNNNNNNNNNNNNNNNNNNNNNNNNNNNNNNNNNN
Figure 3-31. Measuring Rejection Range with Delta Markers
3-28
Operation
HP 85640A RF Tracking Generator Operation and Service Manual
18. REF LVL increases the dynamic range of the measurement by changing the input
attenuator and IF gain. It makes sure the input signal is not in gain compression. To
increase the dynamic range of the measurement, press 4AMPLITUDE5 REF LVL 4+5. Note that
while increasing the dynamic range, more errors are introduced into the measurement.
Figure 3-32 shows the results of increasing the dynamic range. Notice that the top of the
screen does not necessarily represent the gain-compression limit.
NNNNNNNNNNNNNNNNNNNNNNN
NNNNNNNNNNNNNNNNNNNNNNN
Figure 3-32. Increased Dynamic Measurement Range
HP 85640A RF Tracking Generator Operation and Service Manual
Operation
3-29
Reection Measurements
Making a Reection Measurement Using an HP 8560A/E, HP 8561B/E, or
HP 8563A/E Spectrum Analyzer
Note
Instructions for making reection measurements using an HP 8561A or
HP 8562A/B begin on page 3-37.
The examples in this section were made using an HP 8560A spectrum analyzer,
but are similar to results you may expect with an HP 8560E, HP 8561B/E or
HP 8563A/E.
Set up the System.
To measure the return loss of a bandpass lter:
1. Make the necessary connections between the spectrum analyzer and the tracking generator
(see Figure 3-3).
2. Select the 0.5 V/GHz OUTPUT on the spectrum analyzer by pressing 4SWEEP5
REAR PNL OUTPUT .5V/GHZ(FAV) .
NNNNNNNNNNNNNNNNNNNNNNNNNNNNNNNNNNNNNNNNNNNNNNN NNNNNNNNNNNNNNNNNNNNNNNNNNNNNNNNNNNNNN
NNNNNNNNNNNNNNNNNNNNNNNNNN
On an HP 8560E, HP 8561E, or HP 8563E, press 4SWEEP5 GATE OFF .
3. Examine the tracking generator's output power by connecting its RF OUTPUT directly to
the spectrum analyzer's INPUT 50
.
4. On the spectrum analyzer, Press 4PRESET5 4FREQUENCY5 START FREQ 300 4kHz5 STOP FREQ
2.9 4GHz5.
NNNNNNNNNNNNNNNNNNNNNNNNNNNNNNNN
NNNNNNNNNNNNNNNNNNNNNNNNNNNNN
Calibrate.
5. Connect the DUT as shown in Figure 3-33. The corresponding display is illustrated in
Figure 3-34.
3-30
Operation
HP 85640A RF Tracking Generator Operation and Service Manual
Figure 3-33. System Setup for a Reection Measurement
Figure 3-34. Display with System Congured for a Reection Measurement
HP 85640A RF Tracking Generator Operation and Service Manual
Operation
3-31
6. Adjust the tracking generator's output power with the OUTPUT LEVEL controls: increase
the output power 6 dB by setting the attenuator (right-hand) knob to 0 dBm and the
vernier (left-hand) knob to 04 dBm. This output-power level diers from the level used for
the transmission measurement example because a 6 dB coupler is used in the reection
measurement setup.
7. Select stimulus-response auto-coupled sweep time mode for the spectrum analyzer by
pressing 4AUX CTRL5 TRACKING GENRATOR SWP CPL SA SR until SR is selected.
NNNNNNNNNNNNNNNNNNNNNNNNNNNNNNNNNNNNNNNNNNNNNNNNNNNNN NNNNNNNNNNNNNNNNNNNNNNNNNNNNNNNNNNNNNNNNN
8. Adjust the spectrum analyzer settings according to the measurement requirements. For this
measurement, set the analyzer to frequencies around the minimum reection region of the
lter. Change the start frequency to 1 MHz and the stop frequency to 1 GHz. Figure 3-35
illustrates what should appear on-screen.
Note
On the HP 8560A/E, HP 8561B/E, or HP 8563A/E, the minimum resolution
bandwidth supported in stimulus-response measurements is 300 Hz.
Figure 3-35. Spectrum Analyzer Display of Bandpass Filter Region
To store an open/short-average reference trace:
9. Remove the DUT.
10. Press 4AUX CTRL5 TRACKING GENRATOR SOURCE CAL MENU CAL OPN/SHRT .
NNNNNNNNNNNNNNNNNNNNNNNNNNNNNNNNNNNNNNNNNNNNNNNNNNNNN NNNNNNNNNNNNNNNNNNNNNNNNNNNNNNNNNNNNNNNNNNNNNNN NNNNNNNNNNNNNNNNNNNNNNNNNNNNNNNNNNNNNN
11. The analyzer will prompt you to connect the open (Figure 3-36).
3-32
Operation
HP 85640A RF Tracking Generator Operation and Service Manual
Figure 3-36. On-Screen Prompts to Connect an Open
Figure 3-37. Connect the Open
HP 85640A RF Tracking Generator Operation and Service Manual
Operation
3-33
12. After connecting the open as shown in Figure 3-27, press STORE OPEN .
NNNNNNNNNNNNNNNNNNNNNNNNNNNNNNNN
13. The analyzer will prompt you to connect the short (Figure 3-38).
Figure 3-38. On-Screen Prompts to Connect an Short
14. Connect the short as shown in Figure 3-39.
Figure 3-39. Connect the Short
3-34
Operation
HP 85640A RF Tracking Generator Operation and Service Manual
15. Press AVERAGE SHORT . The analyzer takes the average of the open and short traces,
then stores the averaged trace in the analyzer's internal memory and in trace B. The
corresponding state information is stored in state register #8.
NNNNNNNNNNNNNNNNNNNNNNNNNNNNNNNNNNNNNNNNN
Note
NNNNNNNNNNNNNNNNNNNNNNNNNNNNNNNNNNNNNNNNN
If SAVE LOCK is on, pressing AVERAGE SHORT causes the message SAVELOCK
ON to appear in the active function area. If this happens, press:
a.
4SAVE5
NNNNNNNNNNNNNNNNNNNNNNNNNNNNNNNNNNNNNNNNN
SAVE LOCK OFF .
NNNNNNNNNNNNNNNNNNNNNNNNNNNNNNNNNNNNNNNNNNNNNNNNNNNNNNNN NNNNNNNNNNNNNNNNNNNNNNNNNNNNNNNNNNNNNNNNNNNNNNN NNNNNNNNNNNNNNNNNNNNNNNNNNNNN
b. 4AUX CTRL5 TRACKING GENERATOR SOURCE CAL MENU CAL SHORT
STORE SHORT .
NNNNNNNNNNNNNNNNNNNNNNNNNNNNNNNNNNN
Normalize.
NNNNNNNNNNNNNNNNNNNNNNNNNNNNNNNNNNNNNNNNNNNNNNN
16. Reconnect the DUT, and normalize by pressing NORMLIZE ON OFF until ON is selected. The
normalized trace is shown in Figure 3-40. In this case, NORM REF POSN was adjusted for
better viewing of the signal.
NNNNNNNNNNNNNNNNNNNNNNNNNNNNNNNNNNNNNNNNN
Figure 3-40. Normalized Return Loss Measurement
HP 85640A RF Tracking Generator Operation and Service Manual
Operation
3-35
Measure.
17. Read the return loss by activating the marker. Press 4MKR5. Use the analyzer's knob to
position the marker at the frequency of interest. See Figure 3-41.
Figure 3-41. Return Loss Reading Using the 4
MKR5
3-36
Operation
Function
HP 85640A RF Tracking Generator Operation and Service Manual
Making a Reection Measurement Using an HP 8561A or HP 8562A/B
Spectrum Analyzer
Note
Instructions for making reection measurements using an HP 8560A/E,
HP 8561B/E, or HP 8563A/E begin on page 3-30.
The examples in this section were made using an HP 8562B spectrum analyzer,
but are similar to results you may expect with an HP 8561A or HP 8562A.
Set up the System.
To measure the return loss of a bandpass lter:
1. Make the necessary connections between the spectrum analyzer and the tracking generator
(see Figure 3-3).
2. Examine the tracking generator's output power by connecting its RF OUTPUT directly to
the spectrum analyzer's INPUT 50
. On the spectrum analyze, Press 4PRESET5 4FREQUENCY5
START FREQ 300 4kHz5 STOP FREQ 2.9 4GHz5.
NNNNNNNNNNNNNNNNNNNNNNNNNNNNNNNN
NNNNNNNNNNNNNNNNNNNNNNNNNNNNN
3. Select the 0.5 V/GHz OUTPUT on the spectrum analyzer by pressing 4SWEEP5
REAR PNL OUTPUT .5V/GHZ(FAV) .
NNNNNNNNNNNNNNNNNNNNNNNNNNNNNNNNNNNNNNNNNNNNNNN NNNNNNNNNNNNNNNNNNNNNNNNNNNNNNNNNNNNNN
Note
HP 8561A and HP 8562A/B spectrum analyzers do not have tracking
generator-related keys. Sweep-time settings during a stimulus-response
measurement are highly dependent on the device under test. Any changes to
resolution bandwidth, span, or other analyzer settings may cause a change in
sweep time.
Setting Sweeptimes
Accurate stimulus-response measurements typically can use sweeptimes much
faster than auto-coupled sweeptimes. The following procedure calculates the
fastest sweeptime for stimulus-response measurements, assuming the span is
less than 20 times the bandwidth for the DUT:
1. Note the autocoupled sweeptime.
2. Calculate each of the following:
a. span (Hz) / 156 GHz
b. 500 / resolution bandwidth (Hz)
c. 200 / video bandwidth (Hz)
3. Determine the greatest of the values in steps 2a, 2b, and 2c.
4. Set sweeptime to the smaller of the values in steps 1 and 3. The analyzer
will limit sweeptime to 50 msec or less in non-zero spans.
If the value in step 4 is less than the auto-coupled sweeptime, the MEAS UNCAL
indicator will be displayed; this message may be ignored, as it has no eect on
the outcome of the measurement.
HP 85640A RF Tracking Generator Operation and Service Manual
Operation
3-37
Calibrate.
4. Connect the DUT as shown in Figure 3-43. The corresponding display is illustrated in
Figure 3-42.
Figure 3-42. Display with the System Congured for a Reection Measurement
Figure 3-43. System Setup for a Reection Measurement
3-38
Operation
HP 85640A RF Tracking Generator Operation and Service Manual
5. Adjust the tracking generator's output power with the OUTPUT LEVEL controls: increase
the output power 6 dB by setting the attenuator (right-hand) knob to 0 dBm and the
vernier (left-hand) knob to 04 dBm. This output-power level diers from the level used for
the transmission measurement example because a 6 dB coupler is used in the reection
measurement setup.
6. Adjust the host analyzer's settings according to the measurement requirements. For this
measurement, set the analyzer to frequencies around the minimum reection region of
the lter. Change the start frequency to 1 MHz and the stop frequency to 1 GHz. Figure
Figure 3-44 shows what should appear on the display.
Note
Figure 3-44. Spectrum Analyzer Display of Bandpass Filter Region
Unlike the thru-reference trace, an open/short average-reference trace cannot
be performed from the front panel of an HP 8561A or HP 8562A/B. However,
this measurement can be done via remote operation.
The program should perform the following steps:
1. Read the open trace.
2. Read the short trace.
3. Average the two traces.
4. Put the average trace into trace B.
For more information, refer to the host analyzer's operating and programming
manual, and to the HP 85620A Mass Memory Module Operating and
Programming Manual.
7. On HP 8561A and HP 8562A/B host analyzers, an open/short average-reference trace can
only be performed via remote operation (see note). If a controller is not available, steps 8
through 10 will establish a reference trace using only a short.
8. Remove the DUT. Replace it with a short.
9. Press 4TRACE5 TRACE B CLR-WRT B . Wait for a new sweep to nish. Press VIEW B .
NNNNNNNNNNNNNNNNNNNNNNN NNNNNNNNNNNNNNNNNNNNNNNNNNNNN
NNNNNNNNNNNNNNNNNNNN
10. For future reference, store the short trace in a trace register. Press 4SAVE5 SAVE TRACE B
TRACE n (where n is the number of the trace register).
NNNNNNNNNNNNNNNNNNNNNNNNNNNNNNNNNNNNNN
NNNNNNNNNNNNNNNNNNNNNNN
HP 85640A RF Tracking Generator Operation and Service Manual
Operation
3-39
Note
NNNNNNNNNNNNNNNNNNNNNNN
If SAVE LOCK is on, pressing TRACE n on an HP 8561A/62A causes the
message SAVELOCK ON to appear in the active function area.
NNNNNNNNNNNNNNNNNNNNNNNNNNNNNNNNNNNNNN NNNNNNNNNNNNNNNNNNNNNNNNNNNNNNNNNNNNNN NNNNNNNNNNNNNNNNNNNNNNN
If this happens, press 4SAVE5 SAVELOCK OFF SAVE TRACE B TRACE n .
Normalize.
11. Reconnect the DUT.
12. To normalize, activate the trace math function A 0 B + DL ! A, by pressing 4TRACE5
MORE . Press A0B+DL!A ON OFF until ON is selected.
NNNNNNNNNNNNNN
NNNNNNNNNNNNNNNNNNNNNNNNNNNNNNNNNNNNNNNNNNNNNNNNNN
13. If necessary, make adjustments to the position of the trace by changing the position of the
display line. Access the display line by pressing 4DISPLAY5 DSPL LIN ON OFF . The preset
value of the display line is 0 dBm.
NNNNNNNNNNNNNNNNNNNNNNNNNNNNNNNNNNNNNNNNNNNNNNN
Measure.
NNNNNNNNNNNNNNNNNNNNNNNNNNNNNNNNNNNNNN
14. Read the return loss by activating the marker. Press PEAK SEARCH 4ON5 MARKER DELTA ,
then use the analyzer's adjustment knob to position the marker at the frequency of interest
(typically the point of maximum return loss). See Figure 3-45.
Figure 3-45. Return Loss Reading Using the 4
MKR5
3-40
Operation
Function
HP 85640A RF Tracking Generator Operation and Service Manual
4
Performance Tests
What You'll Find in This Chapter . . .
This chapter contains performance test procedures that verify the electrical performance of
the HP 85640A RF tracking generator against the specications in Table 1-1. None of the test
procedures requires removing the instrument cover.
To test the tracking generator, you must connect it to a powered-on Hewlett- Packard spectrum
analyzer. Any one of the following may serve as the \host" spectrum analyzer:
HP 8560A/E spectrum analyzer (non-Option 002)
HP 8561A/B/E spectrum analyzer
HP 8562A/B spectrum analyzer
HP 8563A/E spectrum analyzer
What is Performance Verication?
The highest-level testing, called performance verication, tests the tracking generator's
performance against all its specications listed in Table 1-1. Table 4-1 lists all performance
verication tests and test equipment required to perform each test. Refer to each test for
appropriate adapters and cables.
HP 85640A RF Tracking Generator Operation and Service Manual
Performance Tests
4-1
Test
Number
Table 4-1. Performance Tests
Test Name
Equipment Used
1
Output attenuator accuracy
Measuring receiver
Host spectrum analyzer*
2
Maximum leveled output power 50
termination
Host spectrum analyzer*
3
Level atness
Measuring receiver
Power sensor
Host spectrum analyzer*
4
Harmonic spurious outputs
Microwave spectrum analyzer
Host spectrum analyzer*
5
Non-harmonic spurious outputs Microwave spectrum analyzer
Host spectrum analyzer*
6
LO feedthrough amplitude
7
Tracking generator feedthrough 50
termination
Host spectrum analyzer*
8
Frequency tracking range
Microwave spectrum analyzer
Host spectrum analyzer
Frequency counter
Power splitter
Host spectrum analyzer*
* A host spectrum analyzer can be any one of these models:
HP 8560A or HP 8560E spectrum analyzer (non-Option 002)
HP 8561A, HP 8561B or HP 8561E spectrum analyzer
HP 8562A or HP 8562B spectrum analyzer
HP 8563A or HP 8563E spectrum analyzer
4-2
Performance Tests
HP 85640A RF Tracking Generator Operation and Service Manual
Before Beginning
The HP 85640A RF tracking generator requires at least a ve-minute warm-up before beginning
the performance tests.
Figure 4-1 illustrates the connections to make between the host spectrum analyzer and the
tracking generator. You must also set the rear-panel sweep output to 0.5 V/GHz as instructed
in each performance test. Retain the cable conguration illustrated in Figure 4-1 unless a test
procedure species otherwise.
Figure 4-1. HP 85640A RF Tracking Generator Connections
Test Equipment You'll Need
Refer to Table 4-2 for the recommended test equipment model numbers. Any equipment that
meets the critical specications given in the table may be substituted for the recommended
model(s). The table also lists the recommended test equipment for the tracking generator's
adjustment procedures located in Chapter 5, \Adjustment Procedures," and the troubleshooting
procedures in Chapter 7, \Service Information."
Note
Each host spectrum analyzer has a required warm-up time; refer to Table 1-1 in
the appropriate installation and verication manual for specications.
Each performance test in this section describes setting your host spectrum
analyzer for 0.5 V/GHz output.
Recording Test Results
Record test results in the performance test record located at the end of this chapter. The table
lists test specications and acceptable limits. We recommend that you make a copy of this
table, record the complete test results on the copy, and keep the copy for your calibration test
record. This record could prove invaluable in tracking gradual changes in test results over long
periods of time.
HP 85640A RF Tracking Generator Operation and Service Manual
Performance Tests
4-3
Table 4-2. Recommended Test Equipment
Critical Specications
for Equipment Substitution
Instrument
Host spectrum
analyzer
Compatible with the tracking generator
(See Table 1-1)
Microwave spectrum Frequency range: 300 kHz to 7 GHz
analyzer
Relative amplitude accuracy:
300 kHz to 2.7 GHz: <61.8 dB
300 kHz to 7 GHz: <64.0 dB
Absolute amplitude accuracy:
3.9 GHz to 6.9 GHz: <62.7 dB
Frequency accuracy:
<610 kHz at 7 GHz
Recommended Use
Model
HP 8560A/E, P,A,T
HP 8561A/B/E,
HP 8562A/B
HP 8563A/E
HP 8566A/B*
P,T
Microwave frequency Frequency range: 1 MHz to 2.9 GHz
counter
Timebase accuracy (aging): <5 210010 /day
External frequency reference input
HP 5343A*
Option 001
P,A,T
Measuring receiver
Compatible with power sensor
dB-relative mode
Resolution: 0.01 dB
Reference accuracy: <61.2%
Tuned RF level mode
Tuned RF level accuracy: <60.15 dB
Tuned RF level frequency range: 300 MHz 61 MHz
HP8902A*
P,A,T
Power sensor
Frequency range: 300 kHz to 2.9 GHz
Maximum SWR:
1.1 (1 MHz to 2.0 GHz)
1.30 (2.0 GHz to 2.9 GHz)
HP 8482A*
P,A,T
Digital Voltmeter
Range: 015 V dc to +15 V dc
Accuracy: <610 mV on 100 V range
Input impedance: 1 M
HP 3456A*
A,T
Power splitter
Frequency range: 300 kHz to 2.9 GHz
Insertion loss: 6 dB (nominal)
Output tracking: <0.25 dB
Equivalent output SWR: <1.22
HP 11667A
P,A,T
P = Performance tests; A = Adjustments; T = Troubleshooting; 3Part of microwave workstation
4-4
Performance Tests
HP 85640A RF Tracking Generator Operation and Service Manual
Table 4-2. Recommended Test Equipment (continued)
Instrument
Critical Specications
Recommended
for Equipment Substitution
Model
DVM test leads
36 inches, alligator clips, probe tips
HP 34118A
Use
Termination
Frequency range: dc to 2.9 GHz
Impedance: 50
Maximum SWR: <1.05
Connector: Type N
HP 908A
P,A
Adapters
BNC (f) to SMB (f)
Type N (f) to APC 3.5 (f)
Type N (m) to BNC (f)
HP 1250-1236
HP 1250-1745
HP 1250-1476
A
P
P,A
Cable, RG-214/U
(two required)
Connectors: Type N (m)
Length: 61 cm (24 in)
HP 11500B/C
P,A
Cable, 50
Coaxial Connectors: BNC (m)
(two required)
Length: 23 cm (9 in)
HP 10502A
P,A
Cable, 50
Coaxial Connectors: BNC (m)
(two required)
Length: 122 cm (48 in)
HP 10503A
P,A,
Cable
Frequency range: dc to 300 MHz
(three required)
Connectors: BNC (m), both ends
Length: 62 cm (24 in)
HP 8120-1839
P,A
Cable
Frequency range: 3.9 to 6.9 GHz
Maximum SWR: <1.4:1
Maximum insertion loss: 1.5 dB
Connectors: SMA(m), both ends
Length: 52 cm (20 in.)
HP 5061-9038
P,A,T
Non-metallic
alignment tool
N/A
HP 8710-0033
A
Balldriver
0.050 in
HP 8710-1199
A
Hexdriver
0.050 in
HP 8710-1250
T
A,T
P = Performance tests; A = Adjustments; T = Troubleshooting
HP 85640A RF Tracking Generator Operation and Service Manual
Performance Tests
4-5
1. Output Attenuator Accuracy
Specication
<60.8 dB/10 dB step <61.5 dB maximum for attenuator settings 10 to 70 dB,
referenced to 0 dB setting
Related Adjustment
There is no related adjustment for this performance test.
Description
The tracking generator's RF OUTPUT is connected to the host spectrum analyzer's INPUT
50
. Tracking is adjusted at 300 MHz for a maximum signal level. The tracking generator's
RF OUTPUT is then connected to the input of a measuring receiver. The measuring receiver,
used in its tuned RF level (TRFL) mode, measures the tracking generator's output attenuator
accuracy relative to the 0 dB attenuator setting. The step-to-step error is calculated.
Figure 4-2. Output Attenuator Accuracy Test Setup
4-6
Performance Tests
HP 85640A RF Tracking Generator Operation and Service Manual
1. Output Attenuator Accuracy
Equipment
Measuring receiver . . . . . . . . . . . . . . . . . . . . . . . . . . . . . . . . . . . . . . . . . . . . . . . . . . . . HP 8902A
Host spectrum analyzer . . . HP 8560A/E, 8561A/B/E, HP 8562A/62B, or HP 8563A/E
Cables
Type N, 62 cm (24 in) . . . . . . . . . . . . . . . . . . . . . . . . . . . . . . . . . . . . . . . . . . . . . . HP 11500B/C
BNC, 62 cm (24 in) (3 required) . . . . . . . . . . . . . . . . . . . . . . . . . . . . . . . . . . . . . . . . 8120-1839
SMA, 52 cm (20 in) . . . . . . . . . . . . . . . . . . . . . . . . . . . . . . . . . . . . . . . . . . . . . . . . . . . . 5061-9038
Procedure
1. Connect the equipment as shown in Figure 4-2. Use the type N cable to connect the
tracking generator RF OUTPUT to the host spectrum analyzer's INPUT 50
.
2. Press 4PRESET5 on the host spectrum analyzer and set the controls as follows:
CENTER FREQ . . . . . . . . . . . . . . . . . . . . . . . . . . . . . . . . . . . . . . . . . . . . . . . . . . . . . . . 300 MHz
SPAN . . . . . . . . . . . . . . . . . . . . . . . . . . . . . . . . . . . . . . . . . . . . . . . . . . . . . . . . . . . . . . . . . . . . 0 Hz
RES BW . . . . . . . . . . . . . . . . . . . . . . . . . . . . . . . . . . . . . . . . . . . . . . . . . . . . . . . . . . . . . . 300 Hz
3. If the host spectrum analyzer is an HP 8561A, HP 8562A, or HP 8562B, press 4SWEEP5
REAR PNL OUTPUT .5 V/GHz (FAV) .
NNNNNNNNNNNNNNNNNNNNNNNNNNNNNNNNNNNNNNNNNNNNNNN NNNNNNNNNNNNNNNNNNNNNNNNNNNNNNNNNNNNNNNNNNNN
If the host spectrum analyzer is an HP 8560A/E, HP 8561B/E, or HP 8563A/E, press
4AUX CTRL5 REAR PANEL .5V/GHz (FAV) .
NNNNNNNNNNNNNNNNNNNNNNNNNNNNNNNN NNNNNNNNNNNNNNNNNNNNNNNNNNNNNNNNNNNNNNNNNNNN
4. On the tracking generator, set the OUTPUT LEVEL vernier knob to 05 dBm. Set the
OUTPUT LEVEL attenuator knob to 0 dB, then adjust TRACKING ADJUST to display a
maximum signal level on the host spectrum analyzer.
5. Set the tracking generator OUTPUT LEVEL vernier to 0 dBm. Do not readjust the OUTPUT
LEVEL vernier control for the remainder of this test.
6. Connect the type N cable to the tracking generator RF OUTPUT and the measuring receiver
INPUT 50
connectors.
7. On the measuring receiver, press the blue shift-key AUTOMATIC OPERATION (INSTR
PRESET), FREQ 4MHz5 (INPUT FREQ), gold shift-key, RF POWER (TUNED RF LEVEL), 4.4,
4SPCL5, 32.0, 4SPCL5, blue shift-key, ZERO (SET REF), LOG/LIN. The display should read
0.00 dB 60.01 dB.
8. Set the tracking generator OUTPUT LEVEL attenuator control to each of the settings listed
in Table 4-3. If RECAL is displayed on the measuring receiver, press CALIBRATE. At each
attenuator setting, subtract the attenuator setting (always negative) from the measuring
receiver reading and record the result as the cumulative attenuator accuracy (CAA) in
Table 4-3.
CAA = measuring receiver reading 0 attenuator setting
9. Calculate the step-to-step attenuator accuracy for each setting other than 0 dB by
subtracting the previous CAA from the current CAA. Record the result in Table 4-3 as the
step-to-step attenuator accuracy (SSAA) for the current attenuator setting.
SSAA = current CAA 0 previous CAA
HP 85640A RF Tracking Generator Operation and Service Manual
Performance Tests
4-7
1. Output Attenuator Accuracy
Table 4-3. Output Attenuator Accuracy
Output Level
Attenuator Accuracy
Attenuator Setting
(dB)
Cumulative (dB)
Step-to-Step (dB)
0
010
020
030
040
050
060
070
4-8
Performance Tests
0 (Ref)
0 (Ref)
Measurement
Uncertainty
(dB)
0 (Ref)
60.40
+0.07/00.08
60.09
60.10
60.11
60.12
+0.12/00.13
HP 85640A RF Tracking Generator Operation and Service Manual
2. Maximum Leveled Output Power
2. Maximum Leveled Output Power
Specication
Maximum leveled output power:
0 dBm
Related Adjustment
Tracking generator power level adjustments
Description
The tracking generator's RF OUTPUT is connected to the host spectrum analyzer's INPUT 50
.
Tracking is adjusted at 300 MHz for a maximum signal level. The tracking generator's RF
OUTPUT is then terminated in 50
.
The tracking generator is set to specied output level settings and slowly swept from 300 kHz
to 2.9 GHz. The UNLEVELED indicator is monitored to check for an unleveled condition. If
the UNLEVELED indicator is not activated during the sweep, the tracking generator meets
this specication. If the UNLEVELED indicator is activated during the sweep, the OUTPUT
LEVEL vernier setting is decreased until the output remains leveled during the entire sweep.
This setting is recorded.
Figure 4-3. Maximum Leveled Output Power Test Setup
Equipment
Host spectrum analyzer . . . . . . HP 8560A/E, 8561A/B/E, HP 8562A/B, or HP 8563A/E
50
termination . . . . . . . . . . . . . . . . . . . . . . . . . . . . . . . . . . . . . . . . . . . . . . . . . . . . . . . HP 908A
Cables
Type N, 62 cm (24 in) . . . . . . . . . . . . . . . . . . . . . . . . . . . . . . . . . . . . . . . . . . . . . . HP 11500B/C
BNC, 62 cm (24 in) (3 required) . . . . . . . . . . . . . . . . . . . . . . . . . . . . . . . . . . . . . . . . 8120-1839
SMA, 52 cm (20 in) . . . . . . . . . . . . . . . . . . . . . . . . . . . . . . . . . . . . . . . . . . . . . . . . . . . . 5061-9038
HP 85640A RF Tracking Generator Operation and Service Manual
Performance Tests
4-9
2. Maximum Leveled Output Power
Procedure
1. Connect the equipment as shown in Figure 4-3. Use the type N cable to connect the
tracking generator's RF OUTPUT to the host spectrum analyzer's INPUT 50
.
2. Press 4PRESET5 on the host spectrum analyzer and set the controls as follows:
CENTER FREQ . . . . . . . . . . . . . . . . . . . . . . . . . . . . . . . . . . . . . . . . . . . . . . . . . . . . . 300 MHz
SPAN . . . . . . . . . . . . . . . . . . . . . . . . . . . . . . . . . . . . . . . . . . . . . . . . . . . . . . . . . . . . . . . . . . . 0 Hz
RES BW . . . . . . . . . . . . . . . . . . . . . . . . . . . . . . . . . . . . . . . . . . . . . . . . . . . . . . . . . . . . . 300 Hz
3. If the host spectrum analyzer is an HP 8561A, HP 8562A, or HP 8562B, press 4SWEEP5
REAR PNL OUTPUT .5 V/GHz (FAV) .
NNNNNNNNNNNNNNNNNNNNNNNNNNNNNNNNNNNNNNNNNNNNNNN NNNNNNNNNNNNNNNNNNNNNNNNNNNNNNNNNNNNNNNNNNNN
If the host spectrum analyzer is an HP 8560A/E, HP 8561B/E, or HP 8563A/E, press
4AUX CTRL5 REAR PANEL .5 V/GHz (FAV) .
NNNNNNNNNNNNNNNNNNNNNNNNNNNNNNNN NNNNNNNNNNNNNNNNNNNNNNNNNNNNNNNNNNNNNNNNNNNN
4. On the tracking generator, set the OUTPUT LEVEL vernier knob to 05 dBm. Set the
OUTPUT LEVEL attenuator knob to 0 dB, then adjust TRACKING ADJUST to display a
maximum signal level on the host spectrum analyzer.
Note
The OUTPUT LEVEL vernier is prone to parallax error. To minimize parallax
when setting the knob, view the pointer and the scale marking directly from
the front of the instrument panel. The ridges on the knob are also useful for
properly aligning the pointer with the scale marking.
5. Set the tracking generator OUTPUT LEVEL vernier precisely to 0 dBm. Locate the groove
on the vernier knob closest to the pointer on the knob. Follow this groove down the knob
to the front panel. Align this groove with the front-panel \0" mark.
6. Disconnect the type N cable from the tracking generator RF OUTPUT. Terminate the RF
OUTPUT using the 50
termination.
7. Set the host spectrum analyzer controls as follows:
START FREQ . . . . . . . . . . . . . . . . . . . . . . . . . . . . . . . . . . . . . . . . . . . . . . . . . . . . . . . 300 kHz
STOP FREQ . . . . . . . . . . . . . . . . . . . . . . . . . . . . . . . . . . . . . . . . . . . . . . . . . . . . . . . . . 2.9 GHz
SWEEP TIME . . . . . . . . . . . . . . . . . . . . . . . . . . . . . . . . . . . . . . . . . . . . . . . . . . . . . . . . . 10 sec
8. Check the UNLEVELED indicator function by temporarily disconnecting the BNC
cable between the host spectrum analyzer CAL OUTPUT and the tracking generator
300 MHz INPUT connectors. The UNLEVELED indicator should light when this cable is
disconnected. Reconnect the BNC cable.
9. Watch the UNLEVELED indicator as the host spectrum analyzer sweeps. If the
UNLEVELED indicator does not light during a sweep, proceed to step 13 and enter
> 0 dBm as the maximum leveled output power in the space provided below.
10. If the UNLEVELED indicator does light anytime during a sweep, reduce the OUTPUT
LEVEL vernier setting by 1 dB.
11. Watch the UNLEVELED indicator as the host spectrum analyzer sweeps. If the
UNLEVELED indicator does not light during a sweep, proceed to step 13.
4-10
Performance Tests
HP 85640A RF Tracking Generator Operation and Service Manual
2. Maximum Leveled Output Power
12. Repeat steps 9 through 11 until an OUTPUT LEVEL vernier setting is achieved that results
in a leveled output during the entire sweep.
13. Record the power level value indicated by the OUTPUT LEVEL vernier as the maximum
leveled output power.
Maximum leveled output power
HP 85640A RF Tracking Generator Operation and Service Manual
dBm
Performance Tests
4-11
3. Level Flatness
Specication
Flatness:
<62.0 dB referenced to 300 MHz, 10 dB attenuation, 0 dB vernier setting
Related Adjustment
Power level adjustment
Description
The tracking generator's RF OUTPUT is connected to the host spectrum analyzer's INPUT
50
. Tracking is adjusted at 300 MHz for a maximum signal level. The tracking generator's
RF OUTPUT is then connected to a calibrated power sensor and the power level is measured
at 300 MHz. The measuring receiver is set to RATIO mode so that subsequent power-level
readings are dB relative to the power level at 300 MHz.
The tracking generator is stepped through several frequencies within its range. The
output-power dierence relative to the power level at 300 MHz is measured at each frequency
and recorded.
Figure 4-4. Level Flatness Test Setup
4-12
Performance Tests
HP 85640A RF Tracking Generator Operation and Service Manual
3. Level Flatness
Equipment
Host spectrum analyzer . . . . . . HP 8560A/E, 8561A/B/E, HP 8562A/B, or HP 8563A/E
Measuring receiver . . . . . . . . . . . . . . . . . . . . . . . . . . . . . . . . . . . . . . . . . . . . . . . . . . . . HP 8902A
Power sensor . . . . . . . . . . . . . . . . . . . . . . . . . . . . . . . . . . . . . . . . . . . . . . . . . . . . . . . . . HP 8482A
Cables
Type N, 62 cm (24 in) . . . . . . . . . . . . . . . . . . . . . . . . . . . . . . . . . . . . . . . . . . . . . . HP 11500B/C
BNC, 62 cm (24 in) (3 required) . . . . . . . . . . . . . . . . . . . . . . . . . . . . . . . . . . . . . . . . 8120-1839
SMA, 52 cm (20 in) . . . . . . . . . . . . . . . . . . . . . . . . . . . . . . . . . . . . . . . . . . . . . . . . . . . . 5061-9038
Procedure
1. Connect the equipment as shown in Figure 4-4. Use the type N cable to connect the
tracking generator's RF OUTPUT to the host spectrum analyzer's INPUT 50
.
2. Press 4PRESET5 on the host spectrum analyzer and set the controls as follows:
CENTER FREQ . . . . . . . . . . . . . . . . . . . . . . . . . . . . . . . . . . . . . . . . . . . . . . . . . . . . . 300 MHz
CF STEP . . . . . . . . . . . . . . . . . . . . . . . . . . . . . . . . . . . . . . . . . . . . . . . . . . . . . . . . . . . 100 MHz
SPAN . . . . . . . . . . . . . . . . . . . . . . . . . . . . . . . . . . . . . . . . . . . . . . . . . . . . . . . . . . . . . . . . . . . 0 Hz
RES BW . . . . . . . . . . . . . . . . . . . . . . . . . . . . . . . . . . . . . . . . . . . . . . . . . . . . . . . . . . . . . 300 Hz
3. If the host spectrum analyzer is an HP 8561A, HP 8562A, or HP 8562B, press 4SWEEP5
REAR PNL OUTPUT .5 V/GHz (FAV) .
NNNNNNNNNNNNNNNNNNNNNNNNNNNNNNNNNNNNNNNNNNNNNNN NNNNNNNNNNNNNNNNNNNNNNNNNNNNNNNNNNNNNNNNNNNN
If the host spectrum analyzer is an HP 8560A/E, HP 8561B/E, or HP 8563A/E, press
4AUX CTRL5 REAR PANEL .5 V/GHz (FAV) .
NNNNNNNNNNNNNNNNNNNNNNNNNNNNNNNN NNNNNNNNNNNNNNNNNNNNNNNNNNNNNNNNNNNNNNNNNNNN
4. On the tracking generator, set the OUTPUT LEVEL vernier knob to 05 dBm. Set the
OUTPUT LEVEL attenuator knob to 0 dB, then adjust TRACKING ADJUST to display a
maximum signal amplitude on the host spectrum analyzer.
5. Zero and calibrate the measuring-receiver/power-sensor combination in log mode (power
level readings are in dBm). Enter the power sensor's 300 MHz calibration factor into the
measuring receiver.
6. Replace the type N cable on the RF OUTPUT with the power sensor.
7. On the tracking generator, set the OUTPUT LEVEL vernier knob to 0 dBm and the OUTPUT
LEVEL attenuator knob to 010 dB.
8. On the host spectrum analyzer, press 4TRIG5 SINGLE .
NNNNNNNNNNNNNNNNNNNN
9. Press RATIO on the measuring receiver. The measuring receiver readings are now relative
to the power level at 300 MHz.
10. Set the spectrum analyzer center frequency to 300 kHz. Press 4TRIG5 SINGLE .
NNNNNNNNNNNNNNNNNNNN
11. Enter the appropriate power sensor calibration factor into the measuring receiver as
indicated in Table 4-4.
12. Record the measuring receiver power level reading as the atness in Table 4-4.
HP 85640A RF Tracking Generator Operation and Service Manual
Performance Tests
4-13
3. Level Flatness
13. Repeat steps 10 through 12 to measure the atness at each CENTER FREQ setting listed in
Table 4-4. The 4*5 key can be used to tune to center frequencies above 100 MHz.
14. Record the most positive atness reading in Table 4-4 as the maximum atness.
Maximum atness
dB
15. Record the most negative atness reading in Table 4-4 as the Minimum Flatness.
Minimum atness
4-14
Performance Tests
dB
HP 85640A RF Tracking Generator Operation and Service Manual
3. Level Flatness
Table 4-4. Flatness Relative to 300 MHz
Center Frequency
Flatness (dB)
CAL Factor
Measurement
Frequency (MHz) Uncertainty (dB)
300 kHz
500 kHz
1 MHz
2 MHz
5 MHz
10 MHz
20 MHz
50 MHz
100 MHz
200 MHz
300 MHz
400 MHz
500 MHz
600 MHz
700 MHz
800 MHz
900 MHz
1000 MHz
1100 MHz
1200 MHz
1300 MHz
1400 MHz
1500 MHz
1600 MHz
1700 MHz
1800 MHz
1900 MHz
2000 MHz
2100 MHz
2200 MHz
2300 MHz
2400 MHz
2500 MHz
2600 MHz
2700 MHz
2800 MHz
2900 MHz
HP 85640A RF Tracking Generator Operation and Service Manual
0.3
0.3
1
3
3
10
30
50
100
300
300
300
300
300
1000
1000
1000
1000
1000
1000
1000
1000
2000
2000
2000
2000
2000
2000
2000
2000
2000
2000
3000
3000
3000
3000
3000
+0.28/00.28
+0.28/00.28
+0.28/00.28
+0.28/00.28
+0.28/00.28
+0.24/00.24
+0.24/00.24
+0.24/00.24
+0.24/00.24
+0.24/00.24
+0.24/00.24
+0.24/00.24
+0.24/00.24
+0.24/00.24
+0.24/00.24
+0.24/00.24
+0.24/00.24
+0.24/00.24
+0.24/00.24
+0.24/00.24
+0.24/00.24
+0.24/00.24
+0.24/00.24
+0.24/00.24
+0.24/00.24
+0.24/00.24
+0.24/00.24
+0.41/00.41
+0.41/00.41
+0.41/00.41
+0.41/00.41
+0.41/00.41
+0.41/00.41
+0.41/00.41
+0.41/00.41
+0.41/00.41
+0.41/00.41
Performance Tests
4-15
4. Harmonic Spurious Outputs
Specication
Harmonic spurious
outputs:
<025 dBc
Related Adjustment
There is no related adjustment for this performance test.
Description
The tracking generator's RF OUTPUT is connected to the host spectrum analyzer's INPUT 50
.
Tracking is adjusted at 300 MHz for a maximum signal level. The tracking generator's RF
OUTPUT is then connected to the input of an HP 8566A/B spectrum analyzer. The spectrum
analyzer is tuned to dierent frequencies and the amplitude of the second and third harmonics
relative to the fundamental are measured at each frequency.
Figure 4-5. Harmonic Spurious Outputs Test Setup
4-16
Performance Tests
HP 85640A RF Tracking Generator Operation and Service Manual
4. Harmonic Spurious Outputs
Equipment
Microwave spectrum analyzer . . . . . . . . . . . . . . . . . . . . . . . . . . . . . . . . . . . . . . . HP 8566A/B
Host spectrum analyzer . . . . . . HP 8560A/E, 8561A/B/E, HP 8562A/B, or HP 8563A/E
Cables
Type N, 62 cm (24 in) . . . . . . . . . . . . . . . . . . . . . . . . . . . . . . . . . . . . . . . . . . . . . . HP 11500B/C
BNC, 23 cm (9 in) . . . . . . . . . . . . . . . . . . . . . . . . . . . . . . . . . . . . . . . . . . . . . . . . . . . . HP 10502A
BNC, 62 cm (24 in) (3 required) . . . . . . . . . . . . . . . . . . . . . . . . . . . . . . . . . . . . . . . . 8120-1839
SMA, 52 cm (20 in) . . . . . . . . . . . . . . . . . . . . . . . . . . . . . . . . . . . . . . . . . . . . . . . . . . . . 5061-9038
Adapter
Type N (m) to BNC (f) . . . . . . . . . . . . . . . . . . . . . . . . . . . . . . . . . . . . . . . . . . . . . . . . . 1250-1476
Procedure
1. Connect the equipment as shown in Figure 4-5. Use the type N cable to connect the
tracking generator RF OUTPUT to the host spectrum analyzer's INPUT 50
.
2. Press 4PRESET5 on the host spectrum analyzer and set the controls as follows:
CENTER FREQ . . . . . . . . . . . . . . . . . . . . . . . . . . . . . . . . . . . . . . . . . . . . . . . . . . . . . 300 MHz
SPAN . . . . . . . . . . . . . . . . . . . . . . . . . . . . . . . . . . . . . . . . . . . . . . . . . . . . . . . . . . . . . . . . . . . 0 Hz
RES BW . . . . . . . . . . . . . . . . . . . . . . . . . . . . . . . . . . . . . . . . . . . . . . . . . . . . . . . . . . . . . 300 Hz
3. If the host spectrum analyzer is an HP 8561A, HP 8562A, or HP 8562B, press 4SWEEP5
REAR PNL OUTPUT .5 V/GHz (FAV) .
NNNNNNNNNNNNNNNNNNNNNNNNNNNNNNNNNNNNNNNNNNNNNNN NNNNNNNNNNNNNNNNNNNNNNNNNNNNNNNNNNNNNNNNNNNN
If the host spectrum analyzer is an HP 8560A/E, HP 8561B/E, or HP 8563A/E, press
4AUX CTRL5 REAR PANEL .5 V/GHz (FAV) .
NNNNNNNNNNNNNNNNNNNNNNNNNNNNNNNN NNNNNNNNNNNNNNNNNNNNNNNNNNNNNNNNNNNNNNNNNNNN
4. On the tracking generator, set the OUTPUT LEVEL vernier knob to 05 dBm. Set the
OUTPUT LEVEL attenuator knob to 0 dB, then adjust TRACKING ADJUST to display a
maximum signal level on the host spectrum analyzer.
5. Set the tracking generator OUTPUT LEVEL vernier knob to 0 dBm. Set the OUTPUT
LEVEL attenuator knob to 010 dB.
6. Press 4TRIG5 SINGLE on the host spectrum analyzer.
NNNNNNNNNNNNNNNNNNNN
Note
It is only necessary to perform step 7 if more than two hours have elapsed
since a front-panel calibration of the HP 8566A/B has been performed. The
HP 8566A/B needs to be allowed to warm up for at least 30 minutes before
proceeding.
7. Perform a front-panel calibration of the HP 8566A/B as follows:
a. Connect a BNC cable between CAL OUTPUT and RF INPUT.
b. Press 42022 GHz5 (INSTR PRESET), then 4RECALL5 485. Adjust AMPTD CAL for a marker
amplitude reading of 010 dBm.
c. Press 4RECALL5 495. Adjust FREQ ZERO for maximum amplitude response.
d. Press 4SHIFT5 4FREQUENCY SPAN5 to start the 30 second internal error correction routine.
e. Press 4SHIFT5 4START FREQ5 to use the error correction factors just calculated.
8. Connect the type N cable from the tracking generator RF OUTPUT to the HP 8566A/B RF
INPUT as shown in Figure 4-5.
HP 85640A RF Tracking Generator Operation and Service Manual
Performance Tests
4-17
4. Harmonic Spurious Outputs
9. Set the HP 8566A/B controls as follows:
CENTER FREQUENCY . . . . . . . . . . . . . . . . . . . . . . . . . . . . . . . . . . . . . . . . . . . . . . 300 kHz
SPAN . . . . . . . . . . . . . . . . . . . . . . . . . . . . . . . . . . . . . . . . . . . . . . . . . . . . . . . . . . . . . . . 100 kHz
REFERENCE LEVEL . . . . . . . . . . . . . . . . . . . . . . . . . . . . . . . . . . . . . . . . . . . . . . . . 05 dBm
RES BW . . . . . . . . . . . . . . . . . . . . . . . . . . . . . . . . . . . . . . . . . . . . . . . . . . . . . . . . . . . . . 30 kHz
10. On the HP 8566A/B do the following:
a. Press 4PEAK SEARCH5 and 4SIGNAL TRACK5 (ON). Wait for the signal to be displayed at
center screen. Press 4SIGNAL TRACK5 (OFF).
b. If the marker frequency is less than 2.5 GHz, press 4PEAK SEARCH5 4MKR ! CF STEP5
4MARKER DELTA5.
c. If the marker frequency is greater than 2.5 GHz, press 4PEAK SEARCH5 4PRESEL PEAK5. Wait
for the PEAKING! message to disappear. Then press 4MKR ! CF STEP5 4MARKER DELTA5.
d. Press 4CENTER FREQUENCY5 4*5 to tune to the second harmonic. Press 4PEAK SEARCH5. If
the center frequency value is greater than 2.5 GHz, press 4PRESEL PEAK5 and wait for the
PEAKING! message to disappear. Record the marker amplitude reading in Table 4-5 as
the 2nd harmonic level for the 300 kHz tracking generator output frequency.
e. If the tracking generator output frequency is less than 1 GHz, press 4CENTER FREQUENCY5
4*5 on the HP 8566A/B to tune to the third harmonic. Press 4PEAK SEARCH5. If the center
frequency is greater than 2.5 GHz, press 4PRESEL PEAK5 and wait for the PEAKING!
message to disappear. Record the marker amplitude reading in Table 4-5 as the 3rd
harmonic level for the 300 kHz tracking generator output frequency.
f. On the HP 8566A/B, press MARKER 4OFF5.
11. Repeat steps 9 and 10 for the remaining tracking generator output frequencies listed in
Table 4-5. Note that the host spectrum analyzer's center frequency is the same as the
tracking generator output frequency.
12. Locate the most positive 2nd harmonic level in Table 4-5 and record the value below.
2nd harmonic level
dBc
13. Locate the most positive 3rd harmonic level in Table 4-5 and record the value below.
3rd harmonic level
Table 4-5. Harmonic Spurious Outputs
Tracking Generator
2nd Harmonic
3rd Harmonic
Frequency
Level (dBc)
Level (dBc)
300 kHz
100 MHz
300 MHz
900 MHz
1.4 GHz
4-18
Performance Tests
N/A
dBc
Measurement
Uncertainty (dB)
+1.55/01.80
+1.55/01.80
+1.55/01.80
+1.55/01.80
+3.45/04.01
HP 85640A RF Tracking Generator Operation and Service Manual
5. Non-Harmonic Spurious Outputs
5. Non-Harmonic Spurious Outputs
Specication
Non-harmonic spurious
outputs:
300 kHz to 2.0 GHz:
<027 dBc
2.0 GHz to 2.9 GHz:
<023 dBc
Related Adjustment
There is no related adjustment for this performance test.
Description
The tracking generator's RF OUTPUT is connected to the host spectrum analyzer's INPUT 50
.
Tracking is adjusted at 300 MHz for a maximum signal level. The tracking generator's RF
OUTPUT is then connected to the input of an HP 8566A/B spectrum analyzer. The tracking
generator is set to various output frequencies.
At each output frequency, several sweeps are taken with an HP 8566A/B at dierent span
settings. The highest displayed spurious output is measured in each span. Responses at the
fundamental frequency of the tracking generator output, or their harmonics, are ignored. The
amplitude of the highest spurious response is recorded.
HP 85640A RF Tracking Generator Operation and Service Manual
Performance Tests
4-19
5. Non-Harmonic Spurious Outputs
Figure 4-6. Non-Harmonic Spurious Outputs Test Setup
Equipment
Host spectrum analyzer . . . . . . HP 8560A/E, 8561A/B/E, HP 8562A/B, or HP 8563A/E
Microwave spectrum analyzer . . . . . . . . . . . . . . . . . . . . . . . . . . . . . . . . . . . . . . . HP 8566A/B
Cables
Type N, 62 cm (24 in) (2 required) . . . . . . . . . . . . . . . . . . . . . . . . . . . . . . . . . . HP 11500B/C
BNC, 62 cm (24 in) (3 required) . . . . . . . . . . . . . . . . . . . . . . . . . . . . . . . . . . . . . . . . 8120-1839
SMA, 52 cm (20 in) . . . . . . . . . . . . . . . . . . . . . . . . . . . . . . . . . . . . . . . . . . . . . . . . . . . . 5061-9038
BNC, 23 cm (9 in) . . . . . . . . . . . . . . . . . . . . . . . . . . . . . . . . . . . . . . . . . . . . . . . . . . . . HP 10502A
Adapters
Type N (m) to BNC (f) . . . . . . . . . . . . . . . . . . . . . . . . . . . . . . . . . . . . . . . . . . . . . . . . . 1250-1476
4-20
Performance Tests
HP 85640A RF Tracking Generator Operation and Service Manual
5. Non-Harmonic Spurious Outputs
Procedure
1. Connect the equipment as shown in Figure 4-6. Use the type N cable to connect the
tracking generator's RF OUTPUT to the host spectrum analyzer's INPUT 50
.
2. Press 4PRESET5 on the host spectrum analyzer and set the controls as follows:
CENTER FREQ . . . . . . . . . . . . . . . . . . . . . . . . . . . . . . . . . . . . . . . . . . . . . . . . . . . . . 300 MHz
SPAN . . . . . . . . . . . . . . . . . . . . . . . . . . . . . . . . . . . . . . . . . . . . . . . . . . . . . . . . . . . . . . . . . . . 0 Hz
RES BW . . . . . . . . . . . . . . . . . . . . . . . . . . . . . . . . . . . . . . . . . . . . . . . . . . . . . . . . . . . . . 300 Hz
3. If the host spectrum analyzer is an HP 8561A, HP 8562A, or HP 8562B, press 4SWEEP5
REAR PNL OUTPUT .5 V/GHz (FAV) .
NNNNNNNNNNNNNNNNNNNNNNNNNNNNNNNNNNNNNNNNNNNNNNN NNNNNNNNNNNNNNNNNNNNNNNNNNNNNNNNNNNNNNNNNNNN
If the host spectrum analyzer is an HP 8560A/E, HP 8561B/E, or HP 8563A/E, press
4AUX CTRL5 REAR PANEL .5 V/GHz (FAV) .
NNNNNNNNNNNNNNNNNNNNNNNNNNNNNNNN NNNNNNNNNNNNNNNNNNNNNNNNNNNNNNNNNNNNNNNNNNNN
4. On the tracking generator, set the OUTPUT LEVEL vernier knob to 05 dBm. Set the
OUTPUT LEVEL attenuator knob to 0 dB, then adjust TRACKING ADJUST to display a
maximum signal level on the host spectrum analyzer.
5. On the tracking generator, set the OUTPUT LEVEL vernier knob to 0 dBm and the OUTPUT
LEVEL attenuator knob to 010 dB.
6. On the host spectrum analyzer, press 4TRIG5 4SGL SWP5.
Note
You need to perform step 8 only if more than 2 hours have elapsed since a
front-panel calibration of the HP 8566A/B has been performed.
The HP 8566A/B should be allowed to warm up for at least 30 minutes before
proceeding.
7. Perform a front-panel calibration of the HP 8566A/B as follows:
a. Connect a BNC cable between CAL OUTPUT and RF INPUT.
b. Press 42 0 22 GHz5 (INSTR PRESET) 4RECALL5 485. Adjust AMPTD CAL for a marker
amplitude reading of 010 dBm.
c. Press 4RECALL5 495. Adjust FREQ ZERO for a maximum amplitude response.
d. Press 4SHIFT5 4FREQUENCY SPAN5 to start the 30 second internal error correction routine.
e. Press 4SHIFT5 4START FREQ5 to use the error correction factors just calculated.
8. Connect the type N cable from the tracking generator output to the HP 8566A/B RF INPUT.
See Figure 4-6.
HP 85640A RF Tracking Generator Operation and Service Manual
Performance Tests
4-21
5. Non-Harmonic Spurious Outputs
Measure fundamental amplitudes.
9. Set the host spectrum analyzer's center frequency to the fundamental frequency listed in
Table 4-6.
10. Set the HP 8566A/B controls as follows:
SPAN . . . . . . . . . . . . . . . . . . . . . . . . . . . . . . . . . . . . . . . . . . . . . . . . . . . . . . . . . . . . . . . 100 kHz
REFERENCE LEVEL . . . . . . . . . . . . . . . . . . . . . . . . . . . . . . . . . . . . . . . . . . . . . . . . 05 dBm
ATTEN . . . . . . . . . . . . . . . . . . . . . . . . . . . . . . . . . . . . . . . . . . . . . . . . . . . . . . . . . . . . . . . 10 dB
11. Set the HP 8566A/B center frequency to the fundamental frequency listed in Table 4-6.
12. On the HP 8566A/B, press 4PEAK SEARCH5. If the marker frequency is greater than
2.5 GHz, press 4PRESEL PEAK5 and wait for the PEAKING! message to disappear. Press
4MKR ! REF LVL5. Wait for another sweep to nish.
13. Record the HP 8566A/B marker amplitude reading in Table 4-6 as the fundamental
amplitude.
14. Repeat steps 9 through 13 for all fundamental frequency settings in Table 4-6.
Measure non-harmonic responses.
15. On the host spectrum analyzer, set the center frequency to 300 kHz.
16. Set the HP 8566A/B 4START FREQ5, 4STOP FREQ5, and 4RES BW5 as indicated in the rst row of
Table 4-7.
17. Press 4SINGLE5 on the HP 8566A/B and wait for the sweep to nish. Press 4PEAK SEARCH5.
If the marker frequency is greater than 2.5 GHz, press 4PRESEL PEAK5 and wait for the
PEAKING! message to disappear.
18. Verify that the marked signal is not the fundamental or a harmonic of the fundamental as
follows:
a. Divide the marker frequency by the fundamental frequency (the host spectrum analyzer
center frequency setting). For example, if the marker frequency is 880 kHz and the
fundamental frequency is 300 kHz, dividing 880 kHz by 300 kHz yields 2.933.
b. Round the number calculated in step a to the nearest whole number. In the example
above, 2.933 should be rounded to three.
c. Multiply the fundamental frequency by the number calculated in step b. Following the
example, multiplying 300 kHz by three yields 900 kHz.
d. Calculate the dierence between the marker frequency and the frequency calculated in
step c above. Continuing the example, the dierence would be 20 kHz.
e. Due to span accuracy uncertainties in the HP 8566A/B, the marker frequency might
not equal the actual frequency. Given the marker frequency, check if the dierence
calculated in step d is within the appropriate tolerance:
For marker frequencies <5 MHz, tolerance = 6200 kHz.
For marker frequencies <55 MHz, tolerance = 6750 kHz.
For marker frequencies >55 MHz, tolerance = 610 MHz.
f. If the dierence in step d is within the indicated tolerance, the signal in question is the
fundamental signal (if the number in step b equals 1) or a harmonic of the fundamental
(if the number in step b is greater than 1). This response should be ignored.
19. Press 4SINGLE5 on the HP 8566A/B to verify that the marked signal is a true response and
not a random noise peak. Wait for the sweep to complete, then press 4PEAK SEARCH5. A true
4-22
Performance Tests
HP 85640A RF Tracking Generator Operation and Service Manual
5. Non-Harmonic Spurious Outputs
20.
21.
22.
23.
24.
25.
26.
response remains at the same frequency and amplitude on successive sweeps, but a noise
peak does not.
If the marked signal is either the fundamental (or a harmonic of the fundamental|see step
18) or a noise peak (see step 19), move the marker to the next highest signal by pressing
4SHIFT5, then 4PEAK SEARCH5. Continue with step 18.
If the marked signal is not the fundamental or a harmonic of the fundamental (see step
16) and is a true response (see step 17), calculate the dierence between the amplitude of
marked signal and the fundamental amplitude as listed in Table 4-6.
a. For example, if the fundamental amplitude for a fundamental frequency of 300 kHz is
+1.2 dBm, and the marker amplitude is 030.8 dBm, the dierence is 032 dBc.
b. Record this dierence as the non-harmonic response amplitude for the appropriate host
spectrum analyzer CENTER FREQ and HP 8566A/B START and STOP FREQ settings in
Table 4-7.
non-harmonic amplitude = marker amplitude 0 fundamental amplitude
If a true non-harmonic spurious response is not found, record \NOISE" as the
non-harmonic response amplitude in Table 4-7 for the appropriate host spectrum analyzer
CENTER FREQ and HP 8566A/B START and STOP FREQ settings.
Repeat steps 17 through 22 for the remaining HP 8566A/B settings for START FREQ, STOP
FREQ, and RES BW for the host spectrum analyzer CENTER FREQ setting of 300 kHz.
Repeat steps 16 through 23 with the host spectrum analyzer CENTER FREQ set to 1.5 GHz.
Repeat steps 16 through 23 with the host spectrum analyzer CENTER FREQ set to 2.9 GHz.
Locate in Table 4-7 the most-positive non-harmonic response amplitude for HP 8566A/B
STOP FREQ settings of 2000 MHz. Record this amplitude below:
Non-harmonic response amplitude (2000 MHz)
dBc
27. Locate in Table 4-7 the most-positive non-harmonic response amplitude for the HP 8566A/B
START FREQ settings 2000 MHz. Record this amplitude below:
Non-harmonic response amplitude (2000 MHz)
dBc
Table 4-6. Fundamental Response Amplitudes
Fundamental Frequency Fundamental
Amplitude (dBm)
300 kHz
1.5 GHz
2.9 GHz
HP 85640A RF Tracking Generator Operation and Service Manual
Performance Tests
4-23
5. Non-Harmonic Spurious Outputs
Table 4-7. Non-Harmonic Spurious Responses
HP 8566A/B Settings
Non-Harmonic Response Amplitude
(dBc)
Start
Stop
Frequency Frequency
(in MHz) (in MHz)
0.3
5.0
55
1240
2000
4-24
5.0
55
1240
2000
2900
Performance Tests
RES
BW
30 kHz
100 kHz
1 MHz
1MHz
1 MHz
at 300 kHz
at 1.5 GHz
at 2.9 GHz
CENTER FREQ CENTER FREQ CENTER FREQ
Measurement
Uncertainty
(in dB)
+1.55/01.80
+1.55/01.80
+1.55/01.80
+1.55/01.80
+3.48/04.01
HP 85640A RF Tracking Generator Operation and Service Manual
6. LO Feedthrough Amplitude
6. LO Feedthrough Amplitude
Specication
LO feedthrough:
<026 dBm with output level vernier knob set to 0 dBm and
attenuator knob set to 010 dB.
Related Adjustment
There is no related adjustment for this performance test.
Description
The tracking generator's RF OUTPUT is connected to the host spectrum analyzer's INPUT 50
.
Tracking is adjusted at 300 MHz for a maximum signal level. The tracking generator's RF
OUTPUT is then connected to the input of an HP 8566A/B spectrum analyzer. The tracking
generator is tuned to several frequencies and the LO feedthrough is measured at each
frequency.
Figure 4-7. LO Feedthrough Test Setup
HP 85640A RF Tracking Generator Operation and Service Manual
Performance Tests
4-25
6. LO Feedthrough Amplitude
Equipment
Host spectrum analyzer . . . . . . HP 8560A/E, 8561A/B/E, HP 8562A/B, or HP 8563A/E
Microwave spectrum analyzer . . . . . . . . . . . . . . . . . . . . . . . . . . . . . . . . . . . . . . . HP 8566A/B
Cables
Type N, 62 cm (24 in) (2 required) . . . . . . . . . . . . . . . . . . . . . . . . . . . . . . . . . . HP 11500B/C
BNC, 62 cm (24 in) (3 required) . . . . . . . . . . . . . . . . . . . . . . . . . . . . . . . . . . . . . . . . 8120-1839
SMA, 52 cm (20 in) . . . . . . . . . . . . . . . . . . . . . . . . . . . . . . . . . . . . . . . . . . . . . . . . . . . . 5061-9038
BNC, 23 cm (9 in) . . . . . . . . . . . . . . . . . . . . . . . . . . . . . . . . . . . . . . . . . . . . . . . . . . . . HP 10502A
Adapters
Type N (m) to BNC (f) . . . . . . . . . . . . . . . . . . . . . . . . . . . . . . . . . . . . . . . . . . . . . . . . . 1250-1476
Procedure
1. Connect the equipment as shown in Figure 4-7. Use the type N cable to connect the
tracking generator's RF OUTPUT to the host spectrum analyzer's INPUT 50
.
2. Press 4PRESET5 on the host spectrum analyzer and set the controls as follows:
CENTER FREQ . . . . . . . . . . . . . . . . . . . . . . . . . . . . . . . . . . . . . . . . . . . . . . . . . . . . . 300 MHz
SPAN . . . . . . . . . . . . . . . . . . . . . . . . . . . . . . . . . . . . . . . . . . . . . . . . . . . . . . . . . . . . . . . . . . . 0 Hz
RES BW . . . . . . . . . . . . . . . . . . . . . . . . . . . . . . . . . . . . . . . . . . . . . . . . . . . . . . . . . . . . . 300 Hz
3. If the host spectrum analyzer is an HP 8561A, HP 8562A, or HP 8562B, press 4SWEEP5
REAR PNL OUTPUT .5 V/GHz (FAV) .
NNNNNNNNNNNNNNNNNNNNNNNNNNNNNNNNNNNNNNNNNNNNNNN NNNNNNNNNNNNNNNNNNNNNNNNNNNNNNNNNNNNNNNNNNNN
If the host spectrum analyzer is an HP 8560A/E, HP 8561B/E, or HP 8563A/E, press
4AUX CTRL5 REAR PANEL .5 V/GHz (FAV) .
NNNNNNNNNNNNNNNNNNNNNNNNNNNNNNNN NNNNNNNNNNNNNNNNNNNNNNNNNNNNNNNNNNNNNNNNNNNN
4. On the tracking generator, set the OUTPUT LEVEL vernier knob to 05 dBm. Set the
OUTPUT LEVEL attenuator knob to 0 dB, then adjust TRACKING ADJUST to display a
maximum signal level on the host spectrum analyzer.
Note
It is only necessary to perform step ve if more than two hours have elapsed
since a front-panel calibration of the HP 8566A/B has been performed.
The HP 8566A/B should be allowed to warm up for at least 30 minutes before
proceeding.
5. Perform a front-panel calibration of the HP 8566A/B as follows:
a. Connect a BNC cable between CAL OUTPUT and RF INPUT.
b. Press 42--22 GHz5 (INSTR PRESET) 4RECALL5 485. Adjust AMPTD CAL for a marker
amplitude reading of 010 dBm.
c. Press 4RECALL5 495. Adjust FREQ ZERO for a maximum amplitude response.
d. Press 4SHIFT5 4FREQUENCY SPAN5 to start the 30 second internal error correction routine.
e. Press 4SHIFT5 4START FREQ5 to use the error correction factors just calculated.
6. Connect the type N cable from the tracking generator output to the HP 8566A/B RF INPUT.
See Figure 4-7.
7. Set the tracking generator OUTPUT LEVEL vernier knob to 0 dBm and the OUTPUT
LEVEL attenuator knob to 010 dB. Set the host spectrum analyzer CENTER FREQ to
300 kHz.
4-26
Performance Tests
HP 85640A RF Tracking Generator Operation and Service Manual
6. LO Feedthrough Amplitude
8. Set the HP 8566A/B controls as follows:
CENTER FREQUENCY . . . . . . . . . . . . . . . . . . . . . . . . . . . . . . . . . . . . . . . . . . . . 3.911 GHz
SPAN . . . . . . . . . . . . . . . . . . . . . . . . . . . . . . . . . . . . . . . . . . . . . . . . . . . . . . . . . . . . . . . 100 kHz
REFERENCE LEVEL . . . . . . . . . . . . . . . . . . . . . . . . . . . . . . . . . . . . . . . . . . . . . . . . . . 0 dBm
RES BW . . . . . . . . . . . . . . . . . . . . . . . . . . . . . . . . . . . . . . . . . . . . . . . . . . . . . . . . . . . . . . 1 kHz
9. On the HP 8566A/B, press 4PEAK SEARCH5 4SIGNAL TRACK5 (ON). Wait for the signal to be
centered on the display. Press 4SIGNAL TRACK5 (OFF).
10. On the HP 8566A/B, press 4PEAK SEARCH5 4PRESEL PEAK5. Wait for the PEAKING! message to
disappear.
11. Record the HP 8566A/B marker amplitude below:
LO feedthrough (at 3.911 GHz)
dBm
(Measurement uncertainty: <+2.02/02.50 dB)
12. Set the host spectrum analyzer CENTER FREQ to 2.9 GHz.
13. Set the HP 8566A/B CENTER FREQUENCY to 6.8107 GHz.
14. On the HP 8566A/B, press 4PEAK SEARCH5 4SIGNAL TRACK5 (ON). Wait for the signal to be
centered on the display. Press 4SIGNAL TRACK5 (OFF).
15. On the HP 8566A/B, press 4PEAK SEARCH5 4PRESEL PEAK5. Wait for the PEAKING! message to
disappear.
16. Record the HP 8566A/B marker amplitude below:
LO feedthrough (at 6.8107 GHz)
(Measurement uncertainty:
HP 85640A RF Tracking Generator Operation and Service Manual
dBm
<+2.10/02.67 dB)
Performance Tests
4-27
7. Tracking Generator Feedthrough
Specication
Tracking generator feedthrough:
300 kHz to 1 MHz <095 dBm
1 MHz to 2.0 GHz <0115 dBm
2.0 GHz to 2.9 GHz <0110 dBm
Related Adjustment
There is no related adjustment for this performance test.
Description
The tracking generator's RF OUTPUT is connected to the host spectrum analyzer's INPUT 50
.
Tracking is adjusted at 300 MHz for a maximum signal level. The tracking generator's RF
OUTPUT is terminated in 50
and the output power is set for 0 dBm (maximum leveled output
power). The spectrum analyzer's INPUT 50
is also terminated in 50
. The displayed average
noise level of the spectrum analyzer is measured and recorded at several frequencies.
Figure 4-8. Tracking Generator Feedthrough Test Setup
4-28
Performance Tests
HP 85640A RF Tracking Generator Operation and Service Manual
7. Tracking Generator Feedthrough
Equipment
Host spectrum analyzer . . . . . . HP 8560A/E, 8561A/B/E, HP 8562A/B, or HP 8563A/E
50
termination (2 required) . . . . . . . . . . . . . . . . . . . . . . . . . . . . . . . . . . . . . . . . . . . . HP 908A
Cables
Type N, 62 cm (24 in) (2 required) . . . . . . . . . . . . . . . . . . . . . . . . . . . . . . . . . . HP 11500B/C
BNC, 62 cm (24 in) (3 required) . . . . . . . . . . . . . . . . . . . . . . . . . . . . . . . . . . . . . . . . 8120-1839
SMA, 52 cm (20 in) . . . . . . . . . . . . . . . . . . . . . . . . . . . . . . . . . . . . . . . . . . . . . . . . . . . . 5061-9038
BNC, 23 cm (9 in) . . . . . . . . . . . . . . . . . . . . . . . . . . . . . . . . . . . . . . . . . . . . . . . . . . . . HP 10502A
Adapters
Type N (m) to BNC (f) . . . . . . . . . . . . . . . . . . . . . . . . . . . . . . . . . . . . . . . . . . . . . . . . . 1250-1476
Procedure
1. Connect the equipment as shown in Figure 4-8. Use the type N cable to connect the
tracking generator's RF OUTPUT to the host spectrum analyzer's INPUT 50
.
2. Press 4PRESET5 on the host spectrum analyzer and set the controls as follows:
CENTER FREQ . . . . . . . . . . . . . . . . . . . . . . . . . . . . . . . . . . . . . . . . . . . . . . . . . . . . . 300 MHz
SPAN . . . . . . . . . . . . . . . . . . . . . . . . . . . . . . . . . . . . . . . . . . . . . . . . . . . . . . . . . . . . . . . . . . . 0 Hz
RES BW . . . . . . . . . . . . . . . . . . . . . . . . . . . . . . . . . . . . . . . . . . . . . . . . . . . . . . . . . . . . . 300 Hz
3. If the host spectrum analyzer is an HP 8561A, HP 8562A, HP 8562B, press 4SWEEP5
REAR PNL OUTPUT .5 V/GHz (FAV) .
NNNNNNNNNNNNNNNNNNNNNNNNNNNNNNNNNNNNNNNNNNNNNNN NNNNNNNNNNNNNNNNNNNNNNNNNNNNNNNNNNNNNNNNNNNN
If the host spectrum analyzer is an HP 8560A/E, HP 8561B/E, or HP 8563A/E, press
4AUX CTRL5 REAR PANEL .5 V/GHz (FAV) .
NNNNNNNNNNNNNNNNNNNNNNNNNNNNNNNN NNNNNNNNNNNNNNNNNNNNNNNNNNNNNNNNNNNNNNNNNNNN
4. On the tracking generator, set the OUTPUT LEVEL vernier knob to 05 dBm. Set the
OUTPUT LEVEL attenuator knob to 0 dB, then adjust TRACKING ADJUST to display a
maximum signal level on the host spectrum analyzer.
5. Connect the CAL OUTPUT to the INPUT 50
. Set the host spectrum analyzer controls as
follow:
REF LVL . . . . . . . . . . . . . . . . . . . . . . . . . . . . . . . . . . . . . . . . . . . . . . . . . . . . . . . . . . 010 dBm
ATTEN . . . . . . . . . . . . . . . . . . . . . . . . . . . . . . . . . . . . . . . . . . . . . . . . . . . . . . . . . . . . . . . . 0 dB
RES BW . . . . . . . . . . . . . . . . . . . . . . . . . . . . . . . . . . . . . . . . . . . . . . . . . . . . . . . . . . . . . 300 Hz
VIDEO BW . . . . . . . . . . . . . . . . . . . . . . . . . . . . . . . . . . . . . . . . . . . . . . . . . . . . . . . . . . . . .1 Hz
6. If the host spectrum analyzer is an HP 8561A, HP 8562A, or HP 8562B, press MARKER ON
4AMPLITUDE5 MORE REF LVL CAL .
NNNNNNNN
NNNNNNNNNNNNNN NNNNNNNNNNNNNNNNNNNNNNNNNNNNNNNNNNN
If the host spectrum analyzer is an HP 8560A/E, HP 8561B/E, or HP 8563A/E, press 4MKR5
4CAL5 REF LVL ADJ .
NNNNNNNNNNNNNNNNNNNNNNNNNNNNNNNNNNN
7. Use the knob or step keys to adjust the REF LEVEL ADJ # for a marker amplitude reading of
010.00 dBm 60.17 dB.
8. Connect one HP 908A 50
termination to the host spectrum analyzer's INPUT 50
and
another to the tracking generator's RF OUTPUT. Reconnect the BNC cable from the CAL
OUTPUT to the 300 MHz INPUT on the tracking generator.
9. Set the tracking generator OUTPUT LEVEL vernier knob to 0 dBm.
HP 85640A RF Tracking Generator Operation and Service Manual
Performance Tests
4-29
7. Tracking Generator Feedthrough
10. Set the host spectrum analyzer controls as follows:
CENTER FREQ . . . . . . . . . . . . . . . . . . . . . . . . . . . . . . . . . . . . . . . . . . . . . . . . . . . . . 300 kHz
SPAN . . . . . . . . . . . . . . . . . . . . . . . . . . . . . . . . . . . . . . . . . . . . . . . . . . . . . . . . . . . . . . . . . . . 0 Hz
REF LVL . . . . . . . . . . . . . . . . . . . . . . . . . . . . . . . . . . . . . . . . . . . . . . . . . . . . . . . . . . 050 dBm
Markers . . . . . . . . . . . . . . . . . . . . . . . . . . . . . . . . . . . . . . . . . . . . . . . . . . . . . . . . . . . . . . . . OFF
RES BW . . . . . . . . . . . . . . . . . . . . . . . . . . . . . . . . . . . . . . . . . . . . . . . . . . . . . . . . . . . . . 300 Hz
VIDEO BW . . . . . . . . . . . . . . . . . . . . . . . . . . . . . . . . . . . . . . . . . . . . . . . . . . . . . . . . . . . . . 1 Hz
11. On the host spectrum analyzer, press 4TRIG5 SINGLE and wait for the sweep to nish. If
the host spectrum analyzer is an HP 8561A, HP 8562A, or HP 8562B, press MARKER 4ON5.
Press 4MKR5 on an HP 8560A/E, HP 8561B/E, or HP 8563A/E. Record the marker amplitude
reading in Table 4-8 for the 300 kHz tracking generator output frequency.
12. Repeat step 12 for the remaining tracking generator output frequencies listed in Table 4-8.
13. In Table 4-8, locate the most positive noise level amplitude for the 300 kHz to 1 MHz
frequency range. Record this amplitude value here:
NNNNNNNNNNNNNNNNNNNN
Tracking generator feedthrough, 300 kHz to 1 MHz
dBm
14. In Table 4-8, locate the most positive noise level amplitude for the 1 MHz to 2.0 GHz
frequency range. Record this amplitude value here:
Tracking generator feedthrough, 1 MHz to 2.0 GHz
dBm
15. In Table 4-8, locate the most positive noise level amplitude for the 2.0 GHz to 2.9 GHz
frequency range. Record this amplitude value here:
Tracking generator feedthrough, 2.0 GHz to 2.9 MHz
4-30
Performance Tests
dBm
HP 85640A RF Tracking Generator Operation and Service Manual
7. Tracking Generator Feedthrough
Table 4-8. Tracking Generator Feedthrough
Frequency Tracking Generator
Noise Level
Measurement
Range Output Frequency Amplitude (dBm) Uncertainty (dB)
300 kHz
to
1 MHz
1 MHz
to
2.0 GHz
2.0 GHz
to
2.9 GHz
300 kHz
400 kHz
500 kHz
600 kHz
700 kHz
800 kHz
900 kHz
1 MHz
+1.74/01.98
+1.74/01.98
+1.74/01.98
+1.74/01.98
+1.74/01.98
+1.74/01.98
+1.74/01.98
+1.74/01.98
1.01 MHz
2 MHz
5 MHz
10 MHz
20 MHz
50 MHz
100 MHz
299 MHz
500 MHz
700 MHz
899 MHz
1100 MHz
1300 MHz
1499 MHz
1700 MHz
1900 MHz
2000 MHz
+1.74/01.98
+1.74/01.98
+1.74/01.98
+1.74/01.98
+1.74/01.98
+1.74/01.98
+1.74/01.98
+1.74/01.98
+1.74/01.98
+1.74/01.98
+1.74/01.98
+1.74/01.98
+1.74/01.98
+1.74/01.98
+1.74/01.98
+1.74/01.98
+1.74/01.98
2001 MHz
2099 MHz
2300 MHz
2500 MHz
2699 MHz
2800 MHz
2900 MHz
+1.74/01.98
+1.74/01.98
+1.74/01.98
+1.74/01.98
+1.74/01.98
+1.74/01.98
+1.74/01.98
HP 85640A RF Tracking Generator Operation and Service Manual
Performance Tests
4-31
8. Frequency Tracking Range
Characteristic
Tracking range:
>65 kHz, referenced to output frequency after TRACKING ADJUST is
optimized (Characteristic)
Related Adjustment
Tracking oscillator range adjustment
Description
The tracking generator's RF OUTPUT is connected through a power splitter to the host
spectrum analyzer's INPUT 50
. Tracking is adjusted at 500 MHz for a maximum signal level.
The other output of the power splitter is connected to a frequency counter. The frequency
value displayed on the counter is recorded.
The TRACKING ADJUST vernier knob is set fully clockwise, then the frequency value is
recorded and compared with the rst frequency measurement. TRACKING ADJUST vernier
knob is then set fully counterclockwise. The frequency value is recorded and compared with
the rst frequency measurement.
If the frequency tracking range does not meet the characteristic, perform the tracking oscillator
range adjustment located in Chapter 5, \Adjustment Procedures."
Figure 4-9. Frequency Tracking Range Test Setup
4-32
Performance Tests
HP 85640A RF Tracking Generator Operation and Service Manual
8. Frequency Tracking Range
Equipment
Host spectrum analyzer . . . . . . HP 8560A/E, 8561A/B/E, HP 8562A/B, or HP 8563A/E
Power splitter . . . . . . . . . . . . . . . . . . . . . . . . . . . . . . . . . . . . . . . . . . . . . . . . . . . . . . . HP 11667A
Frequency counter . . . . . . . . . . . . . . . . . . . . . . . . . . . . . . . . . . . . . . . . . . . . . . . . . . . . HP 5343A
Cables
Type N, 62 cm (24 in) (2 required) . . . . . . . . . . . . . . . . . . . . . . . . . . . . . . . . . . HP 11500B/C
BNC, 62 cm (24 in) (3 required) . . . . . . . . . . . . . . . . . . . . . . . . . . . . . . . . . . . . . . . . 8120-1839
SMA, 52 cm (20 in) . . . . . . . . . . . . . . . . . . . . . . . . . . . . . . . . . . . . . . . . . . . . . . . . . . . . 5061-9038
BNC, 122 cm (48 in) . . . . . . . . . . . . . . . . . . . . . . . . . . . . . . . . . . . . . . . . . . . . . . . . . . HP 10503A
Adapters
Type N (m) to Type N (m) . . . . . . . . . . . . . . . . . . . . . . . . . . . . . . . . . . . . . . . . . . . . . 1250-1475
Type N (m) to APC 3.5 (f) . . . . . . . . . . . . . . . . . . . . . . . . . . . . . . . . . . . . . . . . . . . . . 1250-1745
Procedure
1. Connect the equipment as shown in Figure 4-9. Use the type N cable to connect the
tracking generator's RF OUTPUT to the host spectrum analyzer's INPUT 50
.
2. Press 4PRESET5 on the host spectrum analyzer and set the controls as follows:
CENTER FREQ . . . . . . . . . . . . . . . . . . . . . . . . . . . . . . . . . . . . . . . . . . . . . . . . . . . . . 500 MHz
SPAN . . . . . . . . . . . . . . . . . . . . . . . . . . . . . . . . . . . . . . . . . . . . . . . . . . . . . . . . . . . . . . . . . . . 0 Hz
RES BW . . . . . . . . . . . . . . . . . . . . . . . . . . . . . . . . . . . . . . . . . . . . . . . . . . . . . . . . . . . . . 300 Hz
3. If the host spectrum analyzer is an HP 8561A, HP 8562A, or HP 8562B, press 4SWEEP5
REAR PNL OUTPUT .5 V/GHz (FAV) .
NNNNNNNNNNNNNNNNNNNNNNNNNNNNNNNNNNNNNNNNNNNNNNN NNNNNNNNNNNNNNNNNNNNNNNNNNNNNNNNNNNNNNNNNNNN
4. If the host spectrum analyzer is an HP 8560A/E, HP 8561B/E, or HP 8563A/E, press
4AUX CTRL5 REAR PANEL .5 V/GHz (FAV) .
NNNNNNNNNNNNNNNNNNNNNNNNNNNNNNNN NNNNNNNNNNNNNNNNNNNNNNNNNNNNNNNNNNNNNNNNNNNN
On the tracking generator, set the OUTPUT LEVEL vernier knob to 05 dBm. Set the
OUTPUT LEVEL attenuator knob to 0 dB, then adjust TRACKING ADJUST to display a
maximum signal level on the host spectrum analyzer.
5. Set the frequency counter controls as follow:
SAMPLE RATE . . . . . . . . . . . . . . . . . . . . . . . . . . . . . . . . . . . . . . . . . . . . . . . . . . . . midrange
10Hz-500MHz / 500MHz-26.5GHz Switch . . . . . . . . . . . . . . . . . . . . . . 500MHz-26.5GHz
RESOLUTION . . . . . . . . . . . . . . . . . . . . . . . . . . . . . . . . . . . . . . . . . . . . . . . . . . . . . . . . . . .1 Hz
6. Wait for the counter to gate two or three times and record the counter reading below as
the peaked frequency.
Peaked frequency
MHz
7. On the tracking generator, set the TRACKING ADJUST control fully clockwise. Notice that
this is a multi-turn control.
HP 85640A RF Tracking Generator Operation and Service Manual
Performance Tests
4-33
8. Frequency Tracking Range
8. Wait for the counter to gate two or three times, then record the counter reading below as
the maximum frequency.
Maximum frequency
MHz
9. On the tracking generator, set the TRACKING ADJUST control fully counterclockwise.
10. Wait for the counter to gate two or three times, then record the counter reading below as
the minimum frequency.
Minimum frequency
MHz
11. Subtract the minimum frequency from the peaked frequency and record the result as the
negative frequency variation. The variation should be greater than 5 kHz. Perform the
tracking oscillator range adjustment if the variation is less than 5 kHz.
Negative frequency variation
kHz
12. Subtract the maximum frequency from the peaked frequency and record the result as the
positive frequency variation. The variation should be greater than 5 kHz. Perform the
tracking oscillator range adjustment if the variation is less than 5 kHz.
Positive frequency variation
4-34
Performance Tests
kHz
HP 85640A RF Tracking Generator Operation and Service Manual
8. Frequency Tracking Range
Table 4-9. Performance Test Record (Page 1 of 3)
Hewlett-Packard Company
Address:
Report No.
Date
(e.g. 10 FEB 1992)
Model HP 85640A
Serial No.
Options
Customer
Ambient temperature
Tested by
C
Power main line frequency
Test Equipment Used:
Description
Relative humidity
%
Hz (nominal)
Model No.
Trace No.
Cal Due Date
Host spectrum analyzer
Measuring receiver
Power sensor
Microwave spectrum analyzer
Frequency counter
Power splitter
Special notes:
HP 85640A RF Tracking Generator Operation and Service Manual
Performance Tests
4-35
8. Frequency Tracking Range
Table 4-9. Performance Test Record (Page 2 of 3)
Hewlett-Packard Company
Model HP 85640A
Report No.
Serial No.
Date
Test
No.
1.
2.
3.
4.
4-36
Test Description
Output attenuator accuracy
8. Maximum cumulative
attenuator accuracy
010 dB
020 dB
030 dB
040 dB
050 dB
060 dB
070 dB
9. Maximum step-to-step
attenuator accuracy
010 dB
020 dB
030 dB
040 dB
050 dB
060 dB
070 dB
Maximum leveled output
power
13. Maximum leveled
output power
Level atness
14. Maximum atness
15. Minimum atness
Harmonic spurious outputs
12. 2nd harmonic level
300 kHz
100 MHz
300 MHz
900 MHz
1.4 GHz
Performance Tests
Min
Results
Measured
Max
Measurement
Uncertainty
01.5 dB
01.5 dB
01.5 dB
01.5 dB
01.5 dB
01.5 dB
01.5 dB
+1.5 dB 60.40 dB
+1.5 dB +0.07/00.08 dB
+1.5 dB 60.09 dB
+1.5 dB 60.10 dB
+1.5 dB 60.11 dB
+1.5 dB 60.12 dB
+1.5 dB +0.12/00.13 dB
00.8 dB
00.8 dB
00.8 dB
00.8 dB
00.8 dB
00.8 dB
00.8 dB
+0.8 dB 60.40 dB
+0.8 dB 60.41 dB
+0.8 dB +0.11/00.12 dB
+0.8 dB +0.13/00.14 dB
+0.8 dB 60.15 dB
+0.8 dB 60.16 dB
+0.8 dB +0.17/00.18 dB
60.46 dB
0 dBm
02.0 dB
+2.0 dB
60.41 dB
60.41 dB
025 dBc
025 dBc
025 dBc
025 dBc
025 dBc
+1.55/01.80 dB
+1.55/01.80 dB
+1.55/01.80 dB
+1.55/01.80 dB
+3.45/04.01 dB
HP 85640A RF Tracking Generator Operation and Service Manual
8. Frequency Tracking Range
Table 4-9. Performance Test Record (Page 3 of 3)
Hewlett-Packard Company
Model HP 85640A
Report No.
Serial No.
Date
Test
No.
Test Description
4.
13. 3rd harmonic level
300 kHz
100 MHz
300 MHz
900 MHz
5.
Non-harmonic spurious
outputs
26. Non-harmonic response
amplitude, < 2000 MHz
27. Non-harmonic response
amplitude, > 2000 MHz
6.
7.
8.
Min
LO feedthrough amplitude
11. LO feedthrough
at 3.911 GHz
16. LO feedthrough
at 6.8107 GHz
Tracking generator
feedthrough
13. TG feedthrough,
300 kHz to 1 MHz
14. TG feedthrough,
1 MHz to 2 GHz
15. TG feedthrough,
2 GHz to 2.9 GHz
Frequency tracking
range
11. Negative frequency
variation
12. Positive frequency
variation
+ 5 kHz
HP 85640A RF Tracking Generator Operation and Service Manual
Results
Measured
Max
Measurement
Uncertainty
025 dBc
025 dBc
025 dBc
025 dBc
+1.55/01.80 dB
+1.55/01.80 dB
+1.55/01.80 dB
+1.55/01.80 dB
027 dBc
+1.55/01.80 dB
023 dBc
+3.45/04.01 dB
026 dBm
+2.02/02.50 dB
026 dBm
+2.10/02.67 dB
095 dBm
+1.74/01.98 dB
0115 dBm
+1.74/01.98 dB
0110 dBm
+1.74/01.98 dB
05 kHz
61 Hz
61 Hz
Performance Tests
4-37
5
Adjustment Procedures
What You'll Find in This Chapter . . .
This chapter contains adjustment procedure information for the HP 85640A RF tracking
generator. Use adjustment procedures after repairing the tracking generator, or if performance
test results fail specications.
Safety Considerations
Warning
Adjustments in this section are performed with power supplied to the
instrument and protective covers removed. There are voltages at many
points in the instrument that can, if contacted, cause personal injury.
Be extremely careful. Adjustments should be performed only by trained
service personnel.
Power is still applied to this instrument with the LINE switch in the
OFF position. Before removing or installing any assembly or printed
circuit board, remove the instrument's line-power cord. Capacitors inside
the instrument may still be charged, even if the instrument has been
disconnected from its source of supply. Use a nonmetallic adjustment tool
whenever possible.
Note
Before beginning the adjustment procedures, allow the instrument to warm up
for at least ve minutes (see General Specications in Table 1-1).
Which Adjustment Should Be Performed?
Refer to Table 5-2 for the list of adjustment procedures you should perform after instrument
repairs or after performance test results fail specication.
Test Equipment
Refer to Table 4-1, \Recommended Test Equipment," for a list of equipment needed to perform
these adjustment procedures. Any equipment that satises the critical specications provided
in the table may be substituted for the preferred test equipment.
HP 85640A RF Tracking Generator Operation and Service Manual
Adjustment Procedures
5-1
Adjustable and Factory-Selected Components
Refer to Table 5-3 for a list of the adjustable components, organized by reference designator
and name. The table provides an adjustment description and lists the adjustment number for
each component.
Refer to Table 5-4 for information about the factory-selected component used in the tracking
generator. Factory-selected components are identied with an asterisk on the schematic
diagram.
Adjustment Tools
For adjustments requiring a nonmetallic tuning tool, refer to the equipment list in Chapter 4 for
the ber tuning tool part number. Never try to force an adjustment control. This is especially
critical when tuning variable capacitors and slug-tuned inductors. Refer to Table 4-1 for any
other required service accessory part numbers.
Table 5-1. Adjustment Procedures and Equipment Used
Adjustment
Adjustment Name
Equipment Used
Number
1
Power supply adjustments and checks Digital voltmeter
2
600 MHz level adjustment
Host spectrum analyzer*
3
Power level adjustments
Host spectrum analyzer*
Power sensor
Measuring receiver
Digital voltmeter
0.05 in. balldriver
4
Tracking oscillator range adjustment
Microwave frequency counter
Host spectrum analyzer*
Non-metallic alignment tool
* A host spectrum analyzer can be any one of these models:
HP 8560A or HP 8560E spectrum analyzer (non-Option 002)
HP 8561A, HP 8561B or HP 8561E spectrum analyzer
HP 8562A or HP 8562B spectrum analyzer
HP 8563A or HP 8563E spectrum analyzer
5-2
Adjustment Procedures
HP 85640A RF Tracking Generator Operation and Service Manual
Table 5-2. Post-Repair or Specication Failure Adjustment List
Assembly Changed
Adjustment
or Repaired
Perform adjustment(s) in the order listed Number
A1 output attenuator
Power level adjustments
3
A2 tracking generator assembly
Power level adjustments
Tracking oscillator range adjustment
3
4
A3 interface assembly
600 MHz level adjustment
Power level adjustments
Tracking oscillator range adjustments
2
3
4
A4 power supply assembly
Power supply adjustments and checks
1
A5 line lter/switch assembly
None
Reference
Designator
+15V ADJ
N/A
Table 5-3. Adjustable Components
Adjustment
Adjustment
Name
Number
Adjustment Description
+15V ADJ
1
Adjusts the +15 V dc supply voltage
015V ADJ 015V ADJ
1
Adjusts the 015 V dc supply voltage
A2C3
TRACK OSC
4
Sets center frequency of tracking oscillator
A3R1
COR TRACK
4
Coarse adjustment of +TUNE voltage to
tracking oscillator
A3R2
S + T GAIN
3
Adjusts gain of sweep-plus-tune voltage for
slope (atness) compensation
A3R3
LVL OFFSET
3
Sets output level at 020 dBm setting
A3R4
LVL GAIN
3
Sets output level at 010 dBm setting
Table 5-4. Factory Selectable Component
Reference Adjustment
Designator Number
Basis of Selection
A3U4
2
Sets 600 MHz level at A3J5 to 08 dBm 61 dB
HP 85640A RF Tracking Generator Operation and Service Manual
Adjustment Procedures
5-3
1. Power Supply Adjustments and Checks
Assembly Adjusted
A4 power supply
Related Performance Test
There is no related performance test for this adjustment.
Description
The +15 V and 015 V supplies are adjusted. The adjustments are located on A4 power supply,
but the measurements are made on the A3 interface assembly. Other voltages on the interface
assembly are also checked.
Caution
The tracking generator assemblies are static sensitive. Perform this adjustment
procedure at a static-safe workstation. Refer to Figure 7-1 for an example of a
static-safe workstation.
Figure 5-1. Power Supply Adjustments and Checks Setup
5-4
Adjustment Procedures
HP 85640A RF Tracking Generator Operation and Service Manual
1. Power Supply Adjustments and Checks
Figure 5-2. Power Supply Adjustments and Test Point Locations
HP 85640A RF Tracking Generator Operation and Service Manual
Adjustment Procedures
5-5
1. Power Supply Adjustments and Checks
Equipment
Digital voltmeter . . . . . . . . . . . . . . . . . . . . . . . . . . . . . . . . . . . . . . . . . . . . . . . . . . . . . . HP 3456A
Cables
Test lead kit . . . . . . . . . . . . . . . . . . . . . . . . . . . . . . . . . . . . . . . . . . . . . . . . . . . . . . . . . HP 34118A
Procedure
1. Set the HP 85640A LINE switch to OFF. Disconnect all cables from the tracking generator
and remove the cover assembly (refer to \Removing and Replacing the Instrument Cover"
in Chapter 7). Place the tracking generator in the service position illustrated in Figure 5-1.
2. Connect the negative test lead from the DVM to the negative end of A3C27. See
Figure 5-2. Connect the positive DVM test lead to the positive end of A3C27 (the end
labeled \+15V").
3. Reconnect the tracking generator's power cord and set the LINE switch to ON.
4. Set the DVM controls as follows:
FUNCTION . . . . . . . . . . . . . . . . . . . . . . . . . . . . . . . . . . . . . . . . . . . . . . . . . . . . . . . DC VOLTS
RANGE . . . . . . . . . . . . . . . . . . . . . . . . . . . . . . . . . . . . . . . . . . . . . . . . . . . . . . . . . . 100 VOLTS
5. Locate +15V ADJ (see Figure 5-1). Adjust +15V ADJ for a DVM reading of +15 V 60.05 V.
6. Remove the positive test lead from the DVM from A3C27. Connect it to the negative end
of A3C28 (the end labeled \015V"). See Figure 5-2.
7. Locate 015V ADJ (see Figure 5-1). Adjust 015 V ADJ for a DVM reading of 015 V 60.05 V.
8. Connect the positive test lead from the DVM to the positive end of A3C2 (the end labeled
\+5V"). See Figure 5-1. Check that the DVM reads +5 V 60.2 V.
9. Connect the positive test lead from the DVM to A3TP6. Check that the DVM reads
+10.000 V 60.030 V.
10. Connect the positive test lead from the DVM to A3TP7. Check that the DVM reads
010.000 V 60.030 V.
11. Remove the DVM test leads.
5-6
Adjustment Procedures
HP 85640A RF Tracking Generator Operation and Service Manual
2. 600 MHz Level Adjustment
2. 600 MHz Level Adjustment
Assembly Adjusted
A3 interface assembly
Related Performance Test
There is no related performance test for this adjustment.
Description
The A3U4 attenuator-pad value is selected to adjust the 600 MHz drive signal power level at
A3J5 to 08 dBm 61 dB. The host spectrum analyzer's CAL OUTPUT amplitude is checked rst.
The level of undesired harmonics at A3J5 are also checked.
Caution
The tracking generator assemblies are static-sensitive. Perform this adjustment
procedure at a static-safe workstation. Refer to Figure 7-1 for an example of a
static-safe workstation.
Figure 5-3. 600 MHz Level Adjustment Setup
HP 85640A RF Tracking Generator Operation and Service Manual
Adjustment Procedures
5-7
2. 600 MHz Level Adjustment
Figure 5-4. Attenuator A3U4 Location
Equipment
Host spectrum analyzer . . . . . HP 8560A/E, HP 8561A/B/E, HP 8562A/B, HP 8563A/E
Cables
BNC, 62 cm (24 in) . . . . . . . . . . . . . . . . . . . . . . . . . . . . . . . . . . . . . . . . . . . . . . . . . . . . 8120-1839
BNC, 122 cm (48 in) . . . . . . . . . . . . . . . . . . . . . . . . . . . . . . . . . . . . . . . . . . . . . . . . . . HP 10503A
Adapters
Type N (m) to BNC (f) . . . . . . . . . . . . . . . . . . . . . . . . . . . . . . . . . . . . . . . . . . . . . . . . . 1250-1476
BNC (f) to SMB (f) . . . . . . . . . . . . . . . . . . . . . . . . . . . . . . . . . . . . . . . . . . . . . . . . . . . . 1250-1236
Procedure
1. Set the HP 85640A LINE switch to OFF. Disconnect all cables from the tracking generator
and remove the cover assembly (refer to \Removing and Replacing the Instrument Cover"
in Chapter 7). Place the tracking generator in the service position. See Figure 5-3.
2. Disconnect W5 from A3J5 (see Figure 5-4). Turn the tracking generator LINE switch ON.
3. Check the host spectrum analyzer's CAL OUTPUT amplitude using the appropriate
performance test in the spectrum analyzer's installation and verication manual. If the
amplitude does not meet the specication, correct the problem before continuing with this
procedure.
4. Connect the equipment as shown in Figure 5-3 with the 122 cm BNC cable between the
host spectrum analyzer's CAL OUTPUT and INPUT 50
connectors.
5-8
Adjustment Procedures
HP 85640A RF Tracking Generator Operation and Service Manual
2. 600 MHz Level Adjustment
5. Press 4PRESET5 on the host spectrum analyzer and set the controls as follows:
CENTER FREQ . . . . . . . . . . . . . . . . . . . . . . . . . . . . . . . . . . . . . . . . . . . . . . . . . . . . . 300 MHz
CF STEP . . . . . . . . . . . . . . . . . . . . . . . . . . . . . . . . . . . . . . . . . . . . . . . . . . . . . . . . . . . 300 MHz
SPAN . . . . . . . . . . . . . . . . . . . . . . . . . . . . . . . . . . . . . . . . . . . . . . . . . . . . . . . . . . . . . . . . 20 MHz
6. If the host spectrum analyzer is an HP 8560A/E, HP 8561B/E, or HP 8563A/E, press
4PEAK SEARCH5 4CAL5 REF LVL ADJ .
NNNNNNNNNNNNNNNNNNNNNNNNNNNNNNNNNNN
If the host spectrum analyzer is an HP 8561A, HP 8562A, or HP 8562B, press 4PEAK SEARCH5
4AMPLITUDE5 MORE REF LVL CAL .
NNNNNNNNNNNNNN NNNNNNNNNNNNNNNNNNNNNNNNNNNNNNNNNNN
7. Use the knob or step keys to adjust the displayed REF LEVEL ADJ # for a marker amplitude
reading of 010.00 dBm 60.17 dB.
8. Connect the 62 cm BNC cable between the host spectrum analyzer CAL OUTPUT and the
tracking generator 300 MHz INPUT. Connect the 122 cm BNC cable between A3J5 (using an
adapter) on the tracking generator and the INPUT 50
on the spectrum analyzer.
9. Press 4FREQUENCY5 CENTER FREQ 600 4MHz5 4PEAK SEARCH5 on the host spectrum analyzer
and record the marker amplitude reading below.
NNNNNNNNNNNNNNNNNNNNNNNNNNNNNNNNNNN
Initial 600 MHz amplitude:
dBm
10. Calculate the amount of dierence in attenuation required to set the amplitude to 08 dBm
as indicated below. Round the calculated value to the nearest whole number.
attenuation dierence = initial 600 MHz amplitude + 8 dBm
Attenuation dierence (rounded):
dBm
11. If the attenuation dierence (rounded) is 61 dB, disconnect the BNC cable from A3J5
and reconnect W5 to A3J5; a new value of A3U4 need not be selected. If the attenuation
dierence is greater than 61 dB, continue with this procedure.
Note
The following steps should be performed only if the attenuation dierence is
greater than 61 dB.
12. Set the tracking generator LINE switch to OFF. Remove the top shield from the A3
interface assembly. See Figure 5-4. The bottom shield should remain in position. See
Figure 5-3. Locate A3U4 and note the HP part number (0955-0311, for example) or the
manufacturer's part number (MAT-4, for example). Refer to Table 5-5 to determine the
current attenuation value of A3U4. Record the value below.
Current attenuation value:
HP 85640A RF Tracking Generator Operation and Service Manual
Adjustment Procedures
dB
5-9
2. 600 MHz Level Adjustment
13. Calculate the desired attenuation value by adding the current attenuation value to the
attenuation dierence.
desired attenuation = current attenuation value + attenuation dierence
Desired attenuation:
dB
14. Select a new value for pad A3U4 using Table 5-5, based on the desired attenuation
calculated above.
15. Replace the A3 interface assembly top shield. Set the LINE switch to ON.
16. On the host spectrum analyzer, press 4PEAK SEARCH5 MARKER DELTA 4FREQUENCY5
CENTER FREQ . Use the step keys to set the spectrum analyzer to each of the center
frequencies listed in Table 5-6. At each frequency setting, press 4PEAK SEARCH5 and record
the marker amplitude in Table 5-6 for the appropriate frequency. The marker amplitude
should be less than the specication listed.
17. Replace the BNC cable at A3J5 with the W5 cable.
NNNNNNNNNNNNNNNNNNNNNNNNNNNNNNNNNNNNNN
NNNNNNNNNNNNNNNNNNNNNNNNNNNNNNNNNNN
Table 5-5. Attenuation Values of Pad A3U4
Attenuation
HP Part Number Manufacturer's Part Number*
(dB)
0955-0308
0955-0309
0955-0310
0955-0311
0955-0312
0955-0313
0955-0314
MAT-1
MAT-2
MAT-3
MAT-4
MAT-5
MAT-6
MAT-7
1
2
3
4
5
6
7
*These manufacturer's part numbers are for Mini Circuits Lab, Inc. parts.
Part numbers for other manufacturers' parts may be dierent.
5-10
Adjustment Procedures
HP 85640A RF Tracking Generator Operation and Service Manual
2. 600 MHz Level Adjustment
Table 5-6. Harmonic and Subharmonic Levels
Frequency Marker Amplitude Specication
(MHz)
(dBc)
(dBc)
300
900
1200
1500
1800
2100
2400
HP 85640A RF Tracking Generator Operation and Service Manual
025
025
010
025
010
025
010
Adjustment Procedures
5-11
3. Power Level Adjustments
Assembly Adjusted
A3 interface assembly
Related Performance Test
Level atness
Description
The OUTPUT LEVEL vernier is set to 04 dBm and the voltage at the vernier control's wiper is
checked for +2.5 V (the electrical center of the control). If necessary, the vernier control knob
is reset. The gain and oset of the power level control circuitry is adjusted to yield 010 dBm at
the 0 dBm vernier setting and 020 dBm at the 010 dBm vernier setting (the OUTPUT LEVEL
attenuator is set to 010 dB).
The sweep-plus-tune gain (S+T GAIN) is adjusted for the same amplitude at 2.9 GHz as at
300 MHz.
Caution
The tracking generator assemblies are static sensitive. Perform this adjustment
procedure at a static-safe workstation. Refer to Figure 7-1 for an example of a
static-safe workstation.
Figure 5-5. Power Level Adjustment Setup
5-12
Adjustment Procedures
HP 85640A RF Tracking Generator Operation and Service Manual
3. Power Level Adjustments
Figure 5-6. Power Level Adjustment and Test Point Locations
Equipment
Host spectrum analyzer . . HP 8560A/E, HP 8561A/B/E, HP 8562A/B, or HP 8563A/E
Measuring receiver . . . . . . . . . . . . . . . . . . . . . . . . . . . . . . . . . . . . . . . . . . . . . . . . . . . . HP 8902A
Power sensor . . . . . . . . . . . . . . . . . . . . . . . . . . . . . . . . . . . . . . . . . . . . . . . . . . . . . . . . . HP 8482A
Digital voltmeter . . . . . . . . . . . . . . . . . . . . . . . . . . . . . . . . . . . . . . . . . . . . . . . . . . . . . . HP 3456A
Ball driver, 0.05 in . . . . . . . . . . . . . . . . . . . . . . . . . . . . . . . . . . . . . . . . . . . . . . . . . HP 8710-1199
Cables
Type N, 62 cm (24 in) . . . . . . . . . . . . . . . . . . . . . . . . . . . . . . . . . . . . . . . . . . . . . . HP 11500B/C
BNC, 62 cm (24 in) (3 required) . . . . . . . . . . . . . . . . . . . . . . . . . . . . . . . . . . . . . HP 8120-1839
SMA, 52 cm (20 in) . . . . . . . . . . . . . . . . . . . . . . . . . . . . . . . . . . . . . . . . . . . . . . . . . HP 5061-9038
Test lead kit . . . . . . . . . . . . . . . . . . . . . . . . . . . . . . . . . . . . . . . . . . . . . . . . . . . . . . . . . HP 34118A
Procedure
1. Remove the tracking generator cover (refer to \Removing and Replacing the Instrument
Cover" in Chapter 7). Connect the equipment as shown in Figure 5-5 with the Type N
cable connected between the tracking generator RF OUTPUT and the host spectrum
analyzer INPUT 50
connectors. Set the LINE switch to ON.
2. Connect the positive DVM test lead to A3TP4 and the negative DVM test lead to the
negative side of A3C27. Refer to Figure 5-6.
3. Set the OUTPUT LEVEL attenuator to 010 dB and the OUTPUT LEVEL vernier to 04 dBm.
HP 85640A RF Tracking Generator Operation and Service Manual
Adjustment Procedures
5-13
3. Power Level Adjustments
Note
The OUTPUT LEVEL vernier is prone to parallax error. To minimize parallax
when setting the knob, view the pointer and the scale marking directly from
the front of the instrument panel. The ridges on the knob are also useful for
properly aligning the pointer with the scale marking.
4. Set the DVM controls as follows:
FUNCTION . . . . . . . . . . . . . . . . . . . . . . . . . . . . . . . . . . . . . . . . . . . . . . . . . . . . . . . . DC VOLTS
RANGE . . . . . . . . . . . . . . . . . . . . . . . . . . . . . . . . . . . . . . . . . . . . . . . . . . . . . . . . . . . . . . . . 10 V
5. If the DVM reads +2.5 V 60.1 V, continue at step 8. Otherwise, continue to step 6.
6. Loosen the set-screws that secure the OUTPUT LEVEL vernier knob to the vernier control
shaft. Remove the vernier knob.
7. Adjust the shaft for a DVM reading of +2.5 V 60.1 V. Without moving the position of the
control shaft, replace the vernier control knob with the pointer set to 04 dBm. Repeat
step 5.
8. Press 4PRESET5 on the host spectrum analyzer and set the controls as follows:
CENTER FREQ . . . . . . . . . . . . . . . . . . . . . . . . . . . . . . . . . . . . . . . . . . . . . . . . . . . . . 300 MHz
SPAN . . . . . . . . . . . . . . . . . . . . . . . . . . . . . . . . . . . . . . . . . . . . . . . . . . . . . . . . . . . . . . . . . . . 0 Hz
RES BW . . . . . . . . . . . . . . . . . . . . . . . . . . . . . . . . . . . . . . . . . . . . . . . . . . . . . . . . . . . . . 300 Hz
TRIG . . . . . . . . . . . . . . . . . . . . . . . . . . . . . . . . . . . . . . . . . . . . . . . . . . . . . . . . . . . . . . . SINGLE
9. If the host spectrum analyzer an HP 8561A, HP 8562A, or HP 8562B, press 4SWEEP5
REAR PNL OUTPUT .5 V/GHz (FAV) .
NNNNNNNNNNNNNNNNNNNNNNNNNNNNNNNNNNNNNNNNNNNNNNN NNNNNNNNNNNNNNNNNNNNNNNNNNNNNNNNNNNNNNNNNNNN
If the host spectrum analyzer is an HP 8560A/E, HP 8561B/E, or HP 8563A/E, press
4AUX CTRL5 REAR PANEL 0.5 V/GHz (FAV) .
NNNNNNNNNNNNNNNNNNNNNNNNNNNNNNNN NNNNNNNNNNNNNNNNNNNNNNNNNNNNNNNNNNNNNNNNNNNNNNN
10. Adjust TRACKING ADJUST to display a maximum signal level on the host spectrum
analyzer screen.
11. Zero and calibrate the measuring receiver and power sensor. Enter the power sensor's
300 MHz Cal Factor into the measuring receiver.
12. Disconnect the Type N cable from the tracking generator RF OUTPUT and connect the
power sensor to the RF OUTPUT.
13. Set the OUTPUT LEVEL vernier to 010 dBm. Adjust A3R3 LVL OFFSET for a 020 dBm
60.2 dB reading on the measuring receiver.
14. Set the OUTPUT LEVEL vernier to 0 dBm. Adjust A3R4 LVL GAIN for a 010 dBm 60.2 dB
reading on the measuring receiver.
15. Repeat steps 13 and 14 until the power level at each vernier setting is within tolerance.
16. Set the OUTPUT LEVEL vernier for a 010 dBm 60.05 dB reading on the measuring
receiver.
17. Set the host spectrum analyzer 4CENTER FREQ5 to 2.9 GHz.
18. Enter the power sensor's 3 GHz Cal Factor into the measuring receiver.
19. Adjust A3R2 S+T GAIN for a 010 dBm 60.2 dB reading on the measuring receiver.
20. Disconnect the DVM test leads from A3TP4 and A3C27.
5-14
Adjustment Procedures
HP 85640A RF Tracking Generator Operation and Service Manual
4. Tracking Oscillator Range Adjustments
4. Tracking Oscillator Range Adjustments
Assemblies Adjusted
A2 tracking generator assembly
A3 interface assembly
Related Performance Test
Tracking adjustment range
Description
The centering of the tracking oscillator range is adjusted in the factory to ensure that the
tracking adjustment works properly. Over a period of 5 years, however, the center frequency
of the tracking oscillator range may drift outside of acceptable limits. These limits are tested
with the tracking adjustment range performance test in Chapter 4 of this manual. Perform this
adjustment only if the tracking adjustment range performance test has failed.
This adjustment centers the tracking oscillator range. Typically, performing the ne adjustment
on the A3 interface assembly is sucient. In some cases, however, adjusting the A2 tracking
generator coarse adjustment is necessary. The coarse adjustment, A2C3, is rated for a
maximum of 10 adjustment cycles. Because of this limitation, adjust A2C3 only when
absolutely necessary.
Caution
The tracking generator assemblies are static-sensitive. Perform this adjustment
procedure at a static-safe workstation. Refer to Figure 7-1 for an example of a
static-safe workstation.
Figure 5-7. Tracking Oscillator Range Adjustment
HP 85640A RF Tracking Generator Operation and Service Manual
Adjustment Procedures
5-15
4. Tracking Oscillator Range Adjustments
Figure 5-8. Tracking Oscillator Range Adjustment Locations
Equipment
Host spectrum analyzer . . . HP 8560A/E, HP 8561A/B/E, HP 8562A/B or HP 8563A/E
Microwave frequency counter . . . . . . . . . . . . . . . . . . . . . . . . . . . . . . . . . . . . . . . . . HP 5343A
Alignment tool, nonmetallic . . . . . . . . . . . . . . . . . . . . . . . . . . . . . . . . . . . . . . . . . . . 8710-0033
Cables
BNC, 122 cm (48 in) (2 required) . . . . . . . . . . . . . . . . . . . . . . . . . . . . . . . . . . . . . . HP 10503A
BNC, 62 cm (24 in) (3 required) . . . . . . . . . . . . . . . . . . . . . . . . . . . . . . . . . . . . . . . . 8120-1839
SMA, 52 cm (20 in) . . . . . . . . . . . . . . . . . . . . . . . . . . . . . . . . . . . . . . . . . . . . . . . . . . . . 5061-9038
Adapter
Type N (m) to BNC (f) . . . . . . . . . . . . . . . . . . . . . . . . . . . . . . . . . . . . . . . . . . . . . . . . . 1250-1476
Procedure
1. Remove the cover from the tracking generator (refer to \Removing and Replacing the
Instrument Cover" in Chapter 7). Connect the equipment as shown in Figure 5-7. Also
connect a BNC cable between the frequency counter FREQ STD OUT and the host
spectrum analyzer 10 MHz REF IN/OUT. Set the tracking generator LINE switch to ON and
allow it to warm up for at least 10 minutes.
2. Press 4PRESET5 on the host spectrum analyzer and set the controls as follows:
CENTER FREQ . . . . . . . . . . . . . . . . . . . . . . . . . . . . . . . . . . . . . . . . . . . . . . . . . . . . . 300 MHz
SPAN . . . . . . . . . . . . . . . . . . . . . . . . . . . . . . . . . . . . . . . . . . . . . . . . . . . . . . . . . . . . . . . . . . . 0 Hz
5-16
Adjustment Procedures
HP 85640A RF Tracking Generator Operation and Service Manual
4. Tracking Oscillator Range Adjustments
3. If the host spectrum analyzer is an HP 8561A, HP 8562A, or HP 8562B, press 4SWEEP5
REAR PNL OUTPUT .5 V/GHz (FAV) 4FREQUENCY5 MORE 10 MHz EXT 4TRIG5 SINGLE .
NNNNNNNNNNNNNNNNNNNNNNNNNNNNNNNNNNNNNNNNNNNNNNN NNNNNNNNNNNNNNNNNNNNNNNNNNNNNNNNNNNNNNNNNNNN
NNNNNNNNNNNNNN NNNNNNNNNNNNNNNNNNNNNNNNNNNNNNNN
NNNNNNNNNNNNNNNNNNNN
If the host spectrum analyzer is an HP 8560A/E, HP 8561B/E, or HP 8563A/E, press
4AUX CTRL5 REAR PANEL 0.5 V/GHz (FAV) 10 MHz EXT 4SGL SWP5.
NNNNNNNNNNNNNNNNNNNNNNNNNNNNNNNN NNNNNNNNNNNNNNNNNNNNNNNNNNNNNNNNNNNNNNNNNNNNNNN NNNNNNNNNNNNNNNNNNNNNNNNNNNNNNNN
Fine Adjustment
4. Set the microwave frequency counter controls as follows:
SAMPLE RATE . . . . . . . . . . . . . . . . . . . . . . . . . . . . . . . . . . . . . FULLY Counterclockwise
50
01 M
Switch . . . . . . . . . . . . . . . . . . . . . . . . . . . . . . . . . . . . . . . . . . . . . . . . . . . . . . 50
10Hz0500MHz/500MHz026.5 GHz Switch . . . . . . . . . . . . . . . . . . . . . . . . 10Hz0500MHz
5. Oset the counter's displayed frequency by 300 MHz by pressing 4SET5 4OFS MHz5 300 CHS
ENTER .
NNNNNNNNNNN
NNNNNNNNNNNNNNNNN
Note
Pressing 4OFS MHz5 toggles between oset and normal modes.
6. Rotate the TRACKING ADJUST control fully counterclockwise. Note the frequency counter
reading.
7. Rotate the TRACKING ADJUST control fully clockwise.
8. Access A3R1 COR TRACK through the right-hand side of the chassis (see Figure 5-8). Adjust
A3R1 COR TRACK for a counter reading equal to the absolute value of the frequency noted
in step six above 6100 Hz.
9. Repeat steps six through eight at least once more until the absolute values of the counter
readings with the TRACKING ADJUST control fully clockwise and fully counterclockwise
are within 500 Hz of each other. If the absolute values of the counter readings cannot be
set to within 500 Hz of each other, continue with step 11 to check the absolute tracking
range. It is acceptable for the absolute values of the counter readings to not be within
500 Hz of each other as long as the tracking generator has sucient absolute tracking
range.
10. Press 4OFS MHz5 on the counter. The counter should display a frequency of approximately
300 MHz.
11. Rotate the TRACKING ADJUST fully counterclockwise. The frequency counter should read
less than 299.993 MHz. If the frequency counter reads greater than 299.993 MHz, perform
the Coarse Adjustment.
12. Rotate the TRACKING ADJUST fully clockwise. The frequency counter should read greater
than 300.007 MHz. If the frequency counter reads less than 300.007 MHz, perform the
Coarse Adjustment.
Coarse Adjustment
13. Remove the dust-cap screw used to seal the tracking oscillator adjustment. See Figure 5-7.
14. Rotate A3R1 COR TRACK fully clockwise. Rotate A3R1 COR TRACK three turns
counterclockwise.
15. Rotate the TRACKING ADJUST control fully clockwise. Record the frequency counter
reading in Table 5-7 as F1.
HP 85640A RF Tracking Generator Operation and Service Manual
Adjustment Procedures
5-17
16. Rotate the TRACKING ADJUST control fully counterclockwise. Record the frequency
counter reading in Table 5-7 as F2.
17. Calculate FCENTER as shown below and record the result in Table 5-7.
FCENTER = (F1 + F2) / 2
18. Set TRACKING ADJUST for a frequency counter reading of FCENTER 6100 Hz.
Note
The coarse adjustment, A2C3, is rated for a maximum of 10 adjustment cycles.
Because of this limitation, adjust A2C3 only when absolutely necessary.
19. Adjust A2C3 until the frequency counter reads 300 MHz 6500 Hz.
20. Repeat steps 15 through 19 at least once more until no further adjustment of A2C3 is
necessary.
21. Set the tracking generator LINE switch to OFF. Replace A2 dust- cap screw.
22. Repeat the ne adjustment procedure, steps four through 12.
Table 5-7. Tracking Oscillator Range Centering
F1 (MHz)
F2 (MHz)
FCENTER (MHz)
5-18
Adjustment Procedures
HP 85640A RF Tracking Generator Operation and Service Manual
6
Assembly Replaceable Parts
What You'll Find in This Chapter
The replaceable parts and assemblies of the HP 85640A tracking generator are listed in
tables, some with accompanying illustrations, in this chapter. Rebuilt-exchange assembly part
numbers are included here as well. Refer to Chapter 7 for replacement procedures and the
rebuilt-exchange assembly procedure.
HP 85640A RF Tracking Generator Operation and Service Manual
Assembly Replaceable Parts
6-1
Major Assembly and Cable Locations
6-2
Description
HP Part
Number
CD
A1 attenuator, 70 dB w/blocking capacitor
A2 tracking generator
Rebuilt A2, exchange required
A3 interface assembly
A4 power supply assembly
A4W1 cable assembly, power supply primary
A4W2 cable assembly, power supply to interface
A5 line lter/switch assembly
A5W1 cable assembly, A5FL1 to A4W1
A5W2 cable assembly, line switch
A5W3 cable assembly, grounding
A5W2S1 switch DPST
AT1 50
terminator
W1 cable assembly, front panel controls
W2 cable assembly, tracking generator drive
W3 cable assembly, EXT ALC input
W4 cable assembly, 300 MHz input
W5 cable assembly, 600 MHz input
W6 cable assembly, blanking input
W7 cable assembly, 0.5V/GHz input
W8 cable assembly, LO input to TG
W9 cable assembly, ATTEN to RF output
W10 cable assembly, TG to ATTEN
Power supply cover
5086-7845
5086-7879
5086-6879
85640-60001
85640-60006
85640-60004
85640-60003
5062-4853
(p/o A5)
(p/o A5)
5062-1903
3101-2905
1810-0118
85640-60002
8120-4157
08560-60001
85640-60008
85640-60007
85640-60009
85640-60010
85640-20004
08560-20002
08560-20003
5002-0611
2
2
0
5
0
8
7
6
N/A
N/A
1
7
1
6
0
6
2
1
3
6
4
2
3
0
Assembly Replaceable Parts
HP 85640A RF Tracking Generator Operation and Service Manual
Figure 6-1. Major Assemblies and Cable Locations
HP 85640A RF Tracking Generator Operation and Service Manual
Assembly Replaceable Parts
6-3
Mechanical Replaceable Parts
Table 6-1. Part Numbers for Figure 6-2
Description
HP Part
Number
Item
1
2
3
4
5
6
7
8
9
10
11
12
13
14
15
16
17
W1DS1 LED GRN BAR 0.56 MCD (p/o W1)
Bumper (4 per)
Screw 3.0 mm26 mm panhead
Front dress panel
Front frame
W1DS2 LED RED 1 MCD (p/o W1)
Lock-washer 0.384-in ID
Hex nut 3/8232 mm
Knob, round .75 jade gray
Set screw .125-in
Bulkhead connector, type N (f)
Hex nut 15/32232 mm
W4 cable assembly 300 MHz IN
Not assigned
Hex nut 3/8232 mm
Lock-washer .314-in ID
Adapter SMA(f) to SMA(f)
CD
85640-40004
5041-8928
0515-1146
85640-00001
5021-8693
1990-0486
2190-0022
2950-0001
0370-3215
3030-0007
1250-2191
0590-1251
85640-60008
6
0
0
9
4
6
1
8
0
5
6
6
5
2950-0001
2190-0033
1250-1666
8
4
8
Figure 6-2. Mechanical Replaceable Parts (1 of 2)
6-4
Assembly Replaceable Parts
HP 85640A RF Tracking Generator Operation and Service Manual
Item
18
19
20
21
22
23
24
25
26
27
28
29
30
31
32
33
34
35
36
37
38
39
40
41
42
43
44
45
46
47
48
49
50
51
52
Part Numbers for Figure 6-3
Description
Screw 4.0210 mm panhead
Screw 3.028 mm panhead
Screw 4.028 mm athead
Screw 3.0212 mm panhead
RFI gasket (front) (3 feet required)
Screw 3.026 mm panhead
AT1 50
termination
Nut with lock-washer 4 mm
Screw 4-40 .312-in panhead
Set screw .125-in, 4-40
Attenuator-knob shaft adapter
Attenuator bracket
Shield screws (2 center) 2.5216 mm panhead
Shield screws (4 outer) 2.5214 mm panhead
Lock-washer 2.5 mm ID
O-ring 0.070-in ID
Screw 3.028 mm athead
Screw 3.026 mm panhead
Hook and loop fastener
Screw 3.028 mm panhead
Screw 3.028 mm athead
Screw 4.028 mm athead
Hex nut with lock-washer 4 mm
Screw 3.0210 mm athead
Flat-washer 2.5 mm ID
Screw 2.528 mm panhead
Hex nut 3/8232 mm
Connector insulator
Connector BNC(f)
Hex nut 15/32232 mm
Rear dress panel
Screw 4.028 mm athead
RFI gasket (rear) (3 feet required)
Rear frame
O-ring .101-in ID
Center deck
HP 85640A RF Tracking Generator Operation and Service Manual
HP Part
Number
CD
0515-1069
0515-1079
0515-1367
0515-1552
8160-0662
0515-1146
1810-0118
0535-0082
2200-0105
3030-0007
5021-8695
5002-0603
0515-0951
1390-0745
2190-0583
0905-0375
0515-1459
0515-1146
0510-1303
0515-1079
0515-1459
0515-1367
0535-0082
0515-1460
3050-0890
0515-1548
2950-0001
5040-0345
1250-0186
2950-0035
85640-00002
0515-1367
8160-0662
5021-8694
0900-0010
5002-0602
6
8
7
2
8
0
1
3
4
5
6
0
3
8
9
2
8
0
1
8
8
7
3
1
6
6
8
7
5
8
0
7
8
5
2
9
Assembly Replaceable Parts
6-5
Figure 6-3. Mechanical Replaceable Parts (2 of 2)
6-6
Assembly Replaceable Parts
HP 85640A RF Tracking Generator Operation and Service Manual
7
Service Information
What You'll Find in This Chapter . . .
This chapter tells you how to service the tracking generator:
How to avoid damage from electrostatic discharge.
How to replace assemblies in the instrument.
What to do if you have a problem with the tracking generator.
You'll also nd:
A system-level block diagram.
An instrument-level block diagram.
An instrument-level wiring diagram.
An A3 interface assembly component-level replaceable parts list.
An A3 interface assembly component location diagram.
An A3 interface assembly schematic diagram.
HP 85640A RF Tracking Generator Operation and Service Manual
Service Information
7-1
Electrostatic Discharge
Electrostatic discharge (ESD) can damage or destroy electronic components. All work
performed on assemblies containing electronic components should be done only at a static-safe
work station.
Figure 7-1. A Static-Safe Workstation
PC Board Assemblies and Electronic Components
Caution
7-2
Handle these items only at a static-safe work station.
Store or transport these items only in static-shielding containers.
Personnel should be grounded with a resistor-isolated wrist strap before
touching any connector pins or before removing any assembly from the
instrument.
Be sure that all instruments are properly earth-grounded to prevent buildup of
static charge.
Service Information
HP 85640A RF Tracking Generator Operation and Service Manual
HP Part
Number
9300-0797
9300-0980
9300-1383
9300-1169
Table 7-1. Static-Safe Accessories
Description
Set includes: 3M static control mat 0.6 m 2 1.2 m (2 ft 2 4 ft) and 4.6 cm
(15 ft) ground wire. (The wrist-strap and wrist-strap cord are not included.
They must be ordered separately.)
Wrist-strap cord 1.5 m (5 ft)
Wrist-strap, black, stainless steel, without cord, has four adjustable links
and a 7 mm post-type connection.
ESD heel-strap (reusable 6 to 12 months).
HP 85640A RF Tracking Generator Operation and Service Manual
Service Information
7-3
Returning the RF Tracking Generator for Service
Repackage the tracking generator in the original packaging materials, or with commercially
available materials as described in steps 3, 4 and 5.
1. Fill in a blue service tag (located at the back of this manual) and attach it to the instrument.
Please be as specic as possible about the nature of the problem. Include:
Any error messages that appeared on the display.
A completed performance test record.
Any other information about the performance of the instrument.
2. Wrap the instrument in anti-static plastic to reduce the possibility of damage caused by
electrostatic discharge.
Caution
Tracking generator damage can result from using packaging materials other
than those specied. Never use styrene pellets in any shape as packaging
materials. They do not adequately cushion the equipment or prevent it from
shifting in the carton. Pellets cause equipment damage by generating static
electricity.
3. Use the original materials (see Figure 7-2) or a strong shipping container of double-walled,
corrugated cardboard with 159 kg (350 lb) bursting strength. The carton must be large
enough and strong enough to accommodate the instrument and to allow at least three to
four inches on all sides of the instrument for packing material.
4. Surround the equipment with at least three to four inches of packing material; use enough
to prevent the equipment from moving in the carton. If rigid packing foam is unavailable,
you may use any anti-static brand of bubble packaging (sheet plastic formed with air-lled
bubbles). Wrap the equipment several times in this material to protect the equipment and to
keep it from moving in the carton.
5. Seal the shipping container securely with strong nylon adhesive tape.
6. Mark the shipping container \FRAGILE, HANDLE WITH CARE" to ensure careful handling.
7. Keep copies of all shipping papers.
7-4
Service Information
HP 85640A RF Tracking Generator Operation and Service Manual
Figure 7-2. HP 85640A Shipping Container and Cushioning Materials
Item
1
2
3
4
5
HP Part Number
Outer carton
Front foam pad
Bottom tray
Rear foam pad
Anti-static vinyl bag
(large)
HP 85640A RF Tracking Generator Operation and Service Manual
Description
9211-6065
9220-4620
9220-4621
9220-4622
85901-80002
Service Information
7-5
Replacement Procedures
A1 attenuator replacement
A2 tracking generator assembly replacement
A3 interface board assembly replacement
A4 Power supply replacement
A5 FL1 line lter/switch assembly replacement
Rebuilt Exchange Assemblies
Table 6-1 lists part numbers for rebuilt exchange assemblies. Exchange assemblies (factory
repaired and tested) are available only on a trade-in basis; therefore, the defective assembly
must be returned for credit.
To return a defective exchange assembly:
1. Record the nature of the assembly's defect.
2. Wrap the defective assembly in its static-safe wrapping and replace it in the original
shipping container. Enclose a copy of the recorded defect information.
3. Place the pre-addressed label on the package, and return the defective assembly to receive
credit.
7-6
Service Information
HP 85640A RF Tracking Generator Operation and Service Manual
Removing and Replacing the Instrument Cover
Caution
The tracking generator assemblies are sensitive to static. Perform assembly
procedures at static-safe work stations. See Figure 7-1 for an example of a
static-safe work station.
The cover assembly is removed and replaced the same way for each replacement procedure.
Follow these steps when performing any of the other replacement procedures:
Removal
1. Remove any adapters and cables from the front-panel connectors.
2. Place the tracking generator on its front panel.
3. Use a 4 mm hex key to loosen the four screws in the rear bumper feet. (These feet are
secured to the instrument cover assembly. It is not necessary to remove them now.)
4. Pull the instrument cover toward the rear of the tracking generator to remove it.
Replacement
5. Turn the cover assembly so the vent holes are on the bottom of the tracking generator. With
the tracking generator sitting on its front panel, slide the instrument cover assembly onto
the tracking generator.
6. Place the four screws in the rear bumper feet. Use the 4 mm hex key to start tightening the
screws.
7. Alternately tighten the screws on each bumper foot to ensure that the cover is seated in the
front frame.
8. Torque each set screw to 40 or 50 inch-pounds.
HP 85640A RF Tracking Generator Operation and Service Manual
Service Information
7-7
A1 Attenuator Replacement
Caution
The tracking generator assemblies are static sensitive. Perform assembly
procedures at static-safe work stations. Refer to Figure 7-1 for an example of a
static-safe work station.
Removal
1. Remove the instrument cover as described on page 7-7.
2. Remove W9 1 and W10 2 . See Figure 7-3.
3. Use a 0.05-inch hex driver to loosen the two set screws 4 on the attenuator shaft
adapter 6 . Pull the attenuator knob 3 and attenuator shaft adapter forward as far as it
can go.
4. Remove the two screws 5 holding the attenuator to the attenuator bracket.
Replacement
5. Rotate the attenuator shaft fully clockwise.
6. Connect the replacement attenuator to the attenuator bracket by replacing and start
tightening the two screws 5.
4.
7. Replace the attenuator adapter and secure it with the two allen screws 8. Move the attenuator to align the knob properly with the front-panel markings. Tighten the
set screws 5 to six inch-pounds.
9. Reconnect W9 1 and W10 2 . Tighten them to eight inch-pounds each.
7-8
Service Information
HP 85640A RF Tracking Generator Operation and Service Manual
Figure 7-3. A1 Attenuator Replacement
HP 85640A RF Tracking Generator Operation and Service Manual
Service Information
7-9
A2 Tracking Generator Assembly Replacement
Caution
The tracking generator assemblies are static sensitive. Perform assembly
procedures at static-safe work stations. Refer to Figure 7-1 for an example of a
static-safe work station.
Removal
1. Remove the instrument cover as described on page 7-7.
2. Refer to Figure 7-4 and remove the following ve cable assemblies from the tracking
generator circuitry. Use caution when handling the semirigid cables; they should not be
bent.
1 W2 from A2J1
2 W10 from A2J2
3 W8 from A2J4
4 W3 from A2J6
5 W5 from A2J8
3. Rotate the instrument onto its front panel. Hold the A2 tracking generator as you remove
the three screws 6 that attach it to the chassis.
Replacement
4. Orient A2 with A2J2, A2J3, and A2J4 facing toward the front of the instrument.
6 tightened to six inch-pounds.
5. Attach A2 to the instrument chassis with the three screws 6. Replace the following ve cable assemblies. Use caution when handling the semirigid cables;
they should not be bent.
1 W2 to A2J1
2 W10 to A2J2
3 W8 to A2J4
4 W3 to A2J6
5 W5 to A2J8
7. Tighten the semirigid cable assemblies to eight inch-pounds.
7-10
Service Information
HP 85640A RF Tracking Generator Operation and Service Manual
Figure 7-4. A2 Tracking Generator Assembly Replacement
HP 85640A RF Tracking Generator Operation and Service Manual
Service Information
7-11
A3 Interface Board Assembly Replacement
Caution
The tracking generator assemblies are static sensitive. Perform assembly
procedures at static-safe work stations. Refer to Figure 7-1 for an example of a
static-safe work station.
Removal
1. Remove the instrument cover as described on page 7-7.
2. Refer to Figure 7-5 to disconnect the following seven cable assemblies from the A3 interface
board assembly:
1 W1 from A3J2
2 W2 from A3J1
3 A4W2 from A3J3
4 W4 from A3J4
5 W5 from A3J5
6 W6 from A3J6
7 W7 from A3J3
3. Remove the ve screws 8 (washers are attached to the screws) from the A3 board assembly.
4. Loosen the board assembly from the hook and loop fastener then lift the board assembly
from the instrument.
Replacement
5. If you are replacing the bottom shield or installing a new board assembly, attach either the
hook or loop side to the bottom shield so it aligns with the fastener remaining on the chassis.
9.
6. Replace the top and bottom shields to the A3 board assembly, then tighten the six screws 7. Align the A3 board assembly in the chassis. The hook and loop fasteners hold the board
8 and washers
in position temporarily. Secure the board assembly with the ve screws tightened to six inch-pounds.
8. Reconnect the following seven cable assemblies to the A3 interface board assembly:
1 W1 to A3J2
2 W2 to A3J1
3 A4W2 to A3J3
4 W4 to A3J4
5 W5 to A3J5
6 W6 to A3J6
7 W7 to A3J3
7-12
Service Information
HP 85640A RF Tracking Generator Operation and Service Manual
Figure 7-5. A3 Interface Board Assembly Replacement
HP 85640A RF Tracking Generator Operation and Service Manual
Service Information
7-13
A4 Power Supply Replacement
Caution
The tracking generator assemblies are static sensitive. Perform assembly
procedures at static-safe work stations. Refer to Figure 7-1 for an example of a
static-safe work station.
Note
If replacing only the power supply board assembly (not including A4W1 and
A4W2), remove the jumpers between the transformer terminals marked 1 and
3, and 2 and 4.
Removal
1.
2.
3.
4.
5.
6.
7.
8.
9.
Remove the instrument cover as described on page 7-7.
Remove the four screws 1 (two per side) from the power supply shield. See Figure 7-6.
Remove the cables from the cable clips 2 on the power supply shield.
Remove the three screws 3 connecting the power supply shield to the chassis. Remove the
shield.
4 between A5W1 and A4W1 to
Depress the clips on the sides of A5W1P1 connector disconnect the cables.
Remove the three screws 6 from the back panel and lower the rear frame.
Desolder the two wires 7 on the ALC switch, making note of the proper connections. Lift
the switch out of its slot.
9.
Clip the two cable ties 8 to free A4W2 cable assembly and disconnect it from A3J3 Remove the four screws A and B that secure the power supply bracket to the chassis. Lift
the power supply assembly out of the instrument.
Replacement
A.
10. Replace the A4 power supply in the chassis and lightly tighten three of the four screws 11. Replace the grounding wire with the forth screw B . Alternately tighten all four screws to
7 inch-pounds.
12. Resolder the two wires from A4W2 to the ALC switch 7 . The wires should be connected
between the closed contacts when the ALC switch is set to INT.
13. Connect A4W1 to A5W1 4.
14. Replace the cable ties 8 with A4W2 included.
15. Replace the power supply cover, loosely tighten the four side screws 1 and the three
chassis screws 2 . Alternately tighten all screws to six inch-pounds.
16. Replace the cables into the cable clips 2.
7-14
Service Information
HP 85640A RF Tracking Generator Operation and Service Manual
Figure 7-6. A4 Power Supply Replacement
HP 85640A RF Tracking Generator Operation and Service Manual
Service Information
7-15
A5 Line Filter/Switch Assembly Replacement
Caution
The tracking generator assemblies are static sensitive. Perform assembly
procedures at static-safe work stations. Refer to Figure 7-1 for an example of a
static-safe work station.
Removal
1. Remove the instrument cover as described on page 7-7.
2. Remove the four screws 1 (two per side) from the power supply shield.
3. Remove the three screws 2 connecting the power supply shield to the chassis. Remove the
shield.
4. Depress the clips on the sides of A5W1 P1 connector 3 to disconnect A5W1 from A4W1.
5. Remove the line module grounding nut 4 to disconnect A5W3.
6. To remove the front-panel line switch, remove the screw 6 securing the grounding wire to
the frame.
7. Pull the line switch away from the front frame, and slip the LED out of its socket.
8. Remove the two screws 5 that connect the line module to the chassis.
9. Carefully pull A5W2 7 out of the harness clips 8 and remove the A5 assembly.
Replacement
10. Replace the line module into the chassis with the plug prongs toward the top of the
tracking generator and the voltage selection switch toward the bottom. Alternately tighten
the two screws 5.
11. Reconnect A5W3 grounding wire with the nut 4 and tighten it to six inch-pounds.
12. Lay A5W2 7 along its path near the harness clips 8 , and slip the LED into its slot on the
line switch.
13. Orient the line switch so that \LINE" reads correctly from the outside. Tighten the
grounding screw 6 to six inch-pounds.
14. Press A5W2 into the harness clips 8 . Reconnect A5W1 to A4W1 3.
15. Replace the power supply cover, loosely tighten the four side screws 1 and the three
chassis screws 2 . Alternately tighten all screws to six inch-pounds.
16. Check that the fuse in A5FL1 and the voltage selector are correct for your power mains.
Refer to Chapter 2, \Installation," for additional power requirement information.
7-16
Service Information
HP 85640A RF Tracking Generator Operation and Service Manual
Figure 7-7. A5 FL1 Line Filter Module Replacement
HP 85640A RF Tracking Generator Operation and Service Manual
Service Information
7-17
HP 85640A RF Tracking Generator Circuit Descriptions and
Troubleshooting Procedures
The HP 85640A RF tracking generator is designed for operation with:
HP 8560A/E spectrum analyzers (non-Option 002)
HP 8561A/B/E spectrum analyzers
HP 8562A/B spectrum analyzers
HP 8563A/E spectrum analyzers
These instruments, referred to as \host" spectrum analyzers, may have a much wider
frequency range than the tracking generator's range of 300 kHz to 2.9 GHz.
The simplied block diagram of a spectrum analyzer/tracking generator system, Figure 7-8,
shows only the host spectrum analyzer's low band (<2.9 GHz). The tracking generator accepts
two RF signals from the host spectrum analyzer (1ST LO OUTPUT and CAL OUTPUT), and two
control signals (0.5V/GHz OUTPUT and BLANKING OUTPUT). Although Figure 7-8 does not
show these two control signals, they appear as 0.5V/GHz INPUT and BLANKING INPUT in
Figure 7-9. Their operation is explained in \HP 85640A Block Diagram Circuit Descriptions,"
below.
The tracking generator amplies the 300 MHz CAL OUTPUT signal from the host spectrum
analyzer and doubles it to 600 MHz. The 91.07 MHz tracking oscillator (VCXO) output is
doubled to 182.14 MHz, then mixed with the 600 MHz signal. The sum of these two signals,
782.14 MHz, is multiplied by ve to generate 3.9107 GHz. Notice that 3.9107 GHz is the same
frequency as the host spectrum analyzer's rst IF.
The 3.9107 GHz signal is applied to a modulator, which levels the output and provides ne
adjustment of the output power level (using the OUTPUT LEVEL vernier). The modulator
output is mixed with the 1st LO signal from the host spectrum analyzer and amplied.
Since the host spectrum analyzer's 1st LO is always greater than the tuned frequency by 3.9107
GHz (the 1st IF), and the tracking generator mixes this 1st LO signal with 3.9107 GHz, the
tracking generator output frequency will be the same as the host spectrum analyzer's tuned
frequency. The spectrum analyzer's 1st IF does not need to be exactly 3.9107 GHz, as long as
the tracking generator's 1st IF is equal to the 1st IF of the host spectrum analyzer. Use the
TRACKING ADJUST control to set the tracking generator's 1st IF equal to the analyzer's 1st IF.
The output power of the HP 85640A RF tracking generator can be adjusted in 10 dB steps using
the 70 dB step attenuator.
HP 85640A Block Diagram Circuit Descriptions
A block diagram of the HP 85640A RF tracking generator is shown in Figure 7-9. Most of the
RF circuitry is contained in the A2 tracking generator assembly. The A3 interface assembly
provides the control signals for the A2 tracking generator assembly. A3 also monitors A2's ALC
loop (ALC MON) for unleveled conditions, and multiplies the 300 MHz CAL OUTPUT signal
from the host spectrum analyzer to 600 MHz for use by A2. The A1 Attenuator includes a dc
blocking capacitor on its output to prevent damage due to reverse input voltages in less than
630 V dc.
The 0.5V/GHz INPUT is routed to the power level control circuitry (refer to Figure 7-9) on the
A3 interface assembly. This signal is used for atness compensation. As the tuned frequency
increases, the 0.5V/GHz INPUT voltage also increases, causing A2 tracking generator's
output power level to increase. This helps compensate for increased power losses at higher
frequencies.
The unlevel detector circuitry on A3 monitors the ALC MON line from the A2 tracking
generator. It lights the UNLEVELED LED on the instrument's front panel when an unleveled
7-18
Service Information
HP 85640A RF Tracking Generator Operation and Service Manual
condition is detected. Under certain conditions, it is normal for the output to be unleveled
during retrace. The BLANKING INPUT signal prevents the UNLEVELED LED from ashing
during retrace when these conditions exist.
The tracking generator output may be leveled externally by using a negative-polarity crystal
detector. A rear-panel switch on the tracking generator can be used to select between internal
and external leveling. The EXT ALC INPUT connector on the rear-panel routes the detector
output directly to the A2 tracking generator assembly.
Figure 7-8. Simplied HP 85640A to Host Spectrum Analyzer System Block Diagram
HP 85640A RF Tracking Generator Operation and Service Manual
Service Information
7-19
Figure 7-9. Simplied HP 85640A RF Tracking Generator Block Diagram
7-20
Service Information
HP 85640A RF Tracking Generator Operation and Service Manual
Troubleshooting the HP 85640A RF Tracking Generator Circuits
The A2 tracking generator, A1 attenuator assemblies, and A4 power supply may be replaced
if they are defective; these assemblies are not eld serviceable. The A2 tracking generator
assembly is available as a rebuilt exchange assembly. Refer to the rebuilt exchange assembly
procedure in this chapter for more information about obtaining rebuilt, factory-tested
assemblies.
A1 Attenuator
The A1 Attenuator is a 70 dB step attenuator, with three sections that provide attenuation
values of 10, 20 and 40 dB. The attenuator includes a dc blocking capacitor on its output to
prevent damage from reverse input voltages less than 630 V dc.
A2 Tracking Generator
The A2 tracking generator consists of several smaller circuits. The A2 is not component-level
repairable; a rebuilt exchange assembly is available. Part numbers are in Table 6-1 and the
rebuilt exchange assembly procedure is at the beginning of this chapter.
The tracking generator is unique because it recreates only onehost-analyzer intermediate
frequency, thereby minimizing isolation problems associated with the tracking generator. The
function blocks of the A2 tracking generator circuitry are described below. Refer to Figure 7-9
for the location of these circuits in the block diagram.
Tracking oscillator
Upconverter
Pentupler
Modulator
Coupler
Output mixer
The tracking oscillator enables the ne adjustment of the tracking
generator output frequency to compensate for the frequency
inaccuracies of the host spectrum analyzer's 10.7 MHz IF. The tracking
oscillator determines the residual FM and frequency drift of the
tracking generator. The 182.14 MHz output frequency is obtained by
doubling the output of a crystal oscillator operating at 91.07 MHz.
The upconverter mixes the tracking oscillator output with the 600 MHz
signal coming from the A3 Interface Assembly. The upconverter also
contains a lter which passes only the 782.14 MHz upper sideband.
The pentupler multiplies the 782.14 MHz signal by ve to generate
3.9107 GHz, which equals the host spectrum analyzer's 1st IF. A
dual-cavity band-pass lter centered at 3.9107 GHz eliminates all
unwanted harmonics of 782.14 MHz.
The output of the pentupler passes through a modulator which
adjusts the power level going into the output mixer. The modulator is
controlled by an ALC circuit on the bias board controlled by a detector
in the output amplier. If the detected output power is too high, the
ALC drives the modulator to decrease the input level into the output
mixer, which decreases the output power.
The 1st LO INPUT signal from the host spectrum analyzer is coupled
and buered to drive the output mixer. The main line of the coupler
is terminated in 50
by AT1. The loss through the coupler main line is
less than 2.5 dB.
The 3.9107 GHz signal from the modulator goes into the RF port of
the output mixer. The LO port of the output mixer is driven by the
HP 85640A RF Tracking Generator Operation and Service Manual
Service Information
7-21
Output amplier
Bias board
buered 1st LO signal from the coupler. The mixer output is then
amplied.
The signal from the output mixer passes through the low-pass lter of
the output amplier, which then amplies the signal to a usable range.
The amplier also contains a detector for leveling the output.
The bias board houses the ALC circuitry for the tracking generator.
It also distributes dc power to the rest of A2. ALC inputs originate
from the A3 Interface Assembly (for power level control), from the
rear-panel EXT ALC INPUT, and from the output amplier detector.
The ALC loop drives the modulator.
A3 Interface Assembly
The A3 interface assembly provides control signals for the A2 tracking generator's power
level and tracking oscillator. A3 also monitors A2's ALC MON (ALC monitor) line to check for
unleveled output. The A2 tracking generator 600 MHz drive signal originates on A3.
300 MHz to 600 MHz This circuitry receives the host spectrum analyzer's 300 MHz,
converter
010 dBm CAL OUTPUT signal. The signal is doubled to 600 MHz
to drive the A2 tracking generator. The converter consists of two
amplication stages followed by a frequency doubler and A3U4, a
factory-selected attenuator. A3U4 is used to set the output power
from the converter to 08 dBm at 600 MHz. The circuit's 300 MHz
notch lter eliminates the 300 MHz fundamental signal.
Power level control
The power level of the A2 tracking generator is controlled by both
the front panel OUTPUT LEVEL vernier and the rear panel 0.5V/GHz
INPUT from the host spectrum analyzer. The 0.5V/GHz INPUT
provides slope (atness) compensation to the output power level.
Unlevel detector
The A2 tracking generator provides the ALC MON (ALC monitor)
control line to the A3 interface. The A2 output is leveled when
ALC MON is between 00.545 V and +1.09 V. The unlevel detector
buers ALC MON and feeds this signal to a window comparator. The
window comparator output is low when the output is unleveled.
Power supply
Tracking control
7-22
Service Information
It is normal for the output to be unleveled momentarily
during retrace. The host spectrum analyzer's BLANKING signal
prevents a ashing UNLEVELED LED during retrace. The
BLANKING signal is high during retrace and low during a sweep.
The power supply circuitry provides added ltering for the +15 V
and 015 V supplies and regulators for the +5 V and 610 V supplies.
The tracking control circuitry generates the +TUNE control line.
This control line determines the A2 tracking generator's tracking
oscillator frequency. Tracking is controlled by setting the front panel
TRACKING ADJUST potentiometer and A3R1 COR TRACK (coarse
tracking). Noise on the +TUNE line may cause residual FM on the
tracking generator output.
HP 85640A RF Tracking Generator Operation and Service Manual
A4 Power Supply
The A4 power supply provides 615 V dc at up to 1.5 A. The power supply operates from power
mains of 100, 120, 200 or 240 V ac at line frequencies between 47 and 66 Hz. Refer to the
interconnect diagram in this chapter for A4 to A4W1 and A4W2 connections.
A5 Line Filter/Switch Assembly
The A5 line lter/switch assembly consists primarily of A5FL1, the line lter module, and
A5W2S1, the instrument line switch. A5FL1 line lter module lters incoming ac power, fuses
the power-line side of the ac power, and sets the proper transformer taps on the A4 power
supply for the required line voltage. A spare fuse is included in the line lter module. The
instrument line switch switches both the line and neutral sides of ac power.
HP 85640A RF Tracking Generator Operation and Service Manual
Service Information
7-23
Troubleshooting Tracking Generator-Related Faults
This section will help you isolate tracking generator-related faults to a specic assembly in the
HP 85640A or in the host spectrum analyzer.
Output Unleveled
The unlevel-detector circuitry on the A3 interface assembly is used to monitor the control line
ALC MON (ALC monitor) from A2. If ALC MON is greater than +1.091 V dc or less than
00.545 V dc, the UNLEVELED LED on the front panel lights. When lit, it indicates that the
tracking generator output is unleveled. The tracking generator can typically provide up to
+2.8 dBm of output power and remain leveled. In any case, the output should remain leveled
for output power settings less than the specied maximum leveled output power. Refer to the
specications in Table 1-1 for more information.
It is normal for the tracking generator to be unleveled at frequencies below 300 kHz.
The ALC MON line is monitored continuously; therefore, if the output is unleveled for only
part of a sweep, the UNLEVELED LED only lights during the unleveled condition. The LED
may turn o before the sweep is completed.
If the UNLEVELED LED remains lit, proceed as follows:
1. Determine which frequencies cause the unleveled condition.
a. Do this by setting the host spectrum analyzer to zero span and a 5 second sweep time.
b. Step the center frequency in 50 MHz increments.
c. Note and record which frequencies cause the unleveled condition.
2. Determine which power levels cause the unleveled condition.
a. Connect the tracking generator's RF OUTPUT to the host spectrum analyzer's INPUT 50
.
b. Set the host spectrum analyzer to zero span and CENTER FREQ to 300 MHz, or to one of
the frequencies noted in step 1.
c. Maximize the amplitude response displayed on the host spectrum analyzer with the
TRACKING ADJUST control.
d. Increase the OUTPUT POWER vernier setting from 010 dBm to 0 dBm.
e. Note and record the power levels that cause the unleveled condition.
Note
It is acceptable for the output to be unleveled at power levels greater than the
specied maximum leveled output power level.
3. Check the maximum power available from the tracking generator.
a. Connect the tracking generator's RF OUTPUT to the host spectrum analyzer's INPUT 50
.
b. Set the host spectrum analyzer to sweep from 300 kHz to 2.9 GHz.
c. Set the reference level to +10 dBm and the log scale to 5 dB/Div.
d. Set the ALC switch on the tracking generator's rear panel to EXT. Make no connection to
the rear-panel EXT ALC INPUT.
e. The available power should always be greater than +1 dBm. If the output is only
unleveled at specic frequencies, a power hole is usually visible at those frequencies.
7-24
Service Information
HP 85640A RF Tracking Generator Operation and Service Manual
4. Refer to the host spectrum analyzer's installation and verication manual and perform the
1ST LO OUTPUT amplitude performance test for the host spectrum analyzer. Examine the
host spectrum analyzer if it fails this test.
Note
The HP 8560A/E Option 002 spectrum analyzer does not provide sucient LO
drive for the HP 85640A RF tracking generator.
5. If the spectrum analyzer passes the 1st LO output amplitude test, repeat the test, but
measure the output power at A2J3 (remove AT1) on the tracking generator. The power level
at this point should be +14.5 dBm 63 dB.
a. Note and record any 1st LO frequency setting(s) at which the power level is out of
tolerance.
b. Determine the equivalent center frequency setting for any 1st LO frequency at which the
amplitude is out of tolerance by subtracting 3.9107 GHz from the 1st LO frequency.
c. If the equivalent center frequency setting for any out-of-tolerance 1st LO amplitude
(measured at A2J3) is close to the CENTER FREQ setting(s) that caused an unleveled
condition, suspect either A2 or W8.
6. If the output is unleveled only at certain power level settings or certain frequencies, monitor
A3U5 pin 1 with a digital voltmeter (DVM).
a. Connect the negative DVM lead to the negative end of A3C27.
b. Vary the tracking generator OUTPUT LEVEL vernier or host spectrum analyzer CENTER
FREQ settings, as appropriate, and plot the voltage variation versus power level or
frequency. A discontinuity in the plot near the power level causing the unleveled
condition indicates a problem on the A3 interface assembly.
c. A discontinuity in the plot near the frequency which caused the unleveled condition may
indicate a problem on A3 (in the power level control function block) or on the 0.5 V/GHz
signal from the host spectrum analyzer.
d. Check the 0.5 V/GHz signal. Monitor the 0.5 V/GHz signal voltage with a DVM.
e. Vary the spectrum analyzer frequency and plot the voltage variation versus frequency. If
a discontinuity exists near the frequency causing the unleveled condition, examine the
host spectrum analyzer.
HP 85640A RF Tracking Generator Operation and Service Manual
Service Information
7-25
Excessive Residual FM
The tracking oscillator or the ALC circuitry may be responsible for excessive residual FM.
Residual FM can be measured on another spectrum analyzer, such as an HP 8566A/B or HP
8568A/B, using slope detection with the host spectrum analyzer set to zero span.
1. Perform the residual FM performance test for the host spectrum analyzer, as described in
the analyzer's installation and verication manual. If the analyzer passes this test, the
analyzer's LO INPUT and 300 MHz INPUT signals probably are acceptable. If the analyzer
fails the test, examine the host spectrum analyzer's synthesizer section.
2. Monitor A3J1 pin 5 (+TUNE ) with an oscilloscope.
a. Connect the ground lead of the oscilloscope probe to the negative end of A3C27.
b. The voltage at this point should be greater than 500 mV. If the voltage is less than
500 mV, perform the tracking oscillator range performance test in Chapter 4 of this
manual.
c. If the instrument fails this test, perform the tracking oscillator range adjustment in
Chapter 5 of this manual.
d. If noise on this tune line is greater than 10 mV, examine the tracking control circuitry on
A3.
3. Monitor the output of the tracking generator with another spectrum analyzer.
a. Check for high-amplitude spurious responses from 100 kHz to at least 3 GHz.
b. If the spurious responses amplitudes are too high, the (broadband) ALC detector may be
causing ALC loop oscillations, generating FM sidebands.
c. If any spurious responses are excessively high, refer to \Harmonic/Spurious Outputs Too
High" later in this section.
4. If no spurious responses are present or are suciently low in amplitude to not cause a
problem, suspect A2.
7-26
Service Information
HP 85640A RF Tracking Generator Operation and Service Manual
Flatness Out of Tolerance
The output level atness of the tracking generator is specied at a 010 dBm output power
setting (vernier set to 0 dBm, attenuator set to 010 dB). In general, most atness problems
result from a failure in the A2 tracking generator microcircuit. However the POWER LVL
signal from the A3 interface assembly and the LO INPUT signal from the host spectrum
analyzer can also contribute to atness problems.
1. Check the function of the POWER LVL signal from the A3 interface assembly.
a. Set the tracking generator's OUTPUT LEVEL vernier to a level at which the atness is
out of tolerance.
b. Monitor A3U5A pin 1 with a DVM while stepping the CENTER FREQ from 100 MHz to
2.9 GHz in 100 MHz increments.
c. Plot the voltage variation versus frequency.
d. A discontinuity in the plot near the frequency at which the atness is out of tolerance
indicates a problem on the host spectrum analyzer's 0.5 V/GHz OUTPUT.
2. Check the atness of the LO INPUT signal.
a. Perform the 1ST LO OUTPUT amplitude performance test for the host spectrum analyzer.
b. If the spectrum analyzer passes this test, the fault most likely is with the A2 tracking
generator.
c. If the spectrum analyzer fails this test, determine the equivalent CENTER FREQ setting
at which the power level was out of tolerance by subtracting 3.9107 from the 1st LO
frequency. Compare the result with the frequency(ies) at which the atness was out of
tolerance.
d. Repeat the test with the power sensor connected to A2J3 (remove AT1) noting the
equivalent center frequency of any out-of-tolerance power levels.
e. The power level should be +14.5 dBm 63 dB.
f. If the power level is acceptable at the spectrum analyzer's 1ST LO OUTPUT but out of
tolerance at A2J3 and the CENTER FREQ setting of the out of tolerance power levels is
close to the frequencies that caused the unleveled condition, suspect A2.
g. If the power level at the 1ST LO OUTPUT is also out of tolerance, suspect the host
spectrum analyzer.
3. Check all coax cables, especially semirigid cables. A fault in one of these cables can cause a
very high-Q power hole.
HP 85640A RF Tracking Generator Operation and Service Manual
Service Information
7-27
Harmonic/Spurious Outputs Too High
Harmonic and spurious outputs may be generated by A2 itself or may be present in either the
300 MHz INPUT or LO INPUT signals. There is a direct relationship between spurious signals on
the 1st LO and spurious signals on the tracking generator output|if the 1st LO moves 1 MHz,
the tracking generator output will move 1 MHz.
There is a ve-to-one relationship between the 600 MHz drive spurious outputs and tracking
generator output spurious signals because of the pentupler multiplication. For example, if the
600 MHz signal moves 1 MHz, the tracking generator output signal moves 5 MHz.
If the harmonic spurious outputs performance test has failed:
1. If the harmonic spurious outputs performance test has failed, disconnect the tracking
generator and connect a spectrum analyzer, such as an HP 8566A/B, to the host spectrum
analyzer's 1ST LO OUTPUT.
2. Set the host spectrum analyzer frequency as indicated in the performance test, with SPAN
set to 0 Hz.
3. At each frequency setting, press 4TRIG5 SINGLE .
NNNNNNNNNNNNNNNNNNNN
4. If the host spectrum analyzer is an HP 8560A/E, HP 8561B/E, or HP 8563A/E press 4CAL5
MORE 1 OF 2 FREQ DIAGNOSE LO FREQ .
NNNNNNNNNNNNNNNNNNNNNNNNNNNNNNNNNNN NNNNNNNNNNNNNNNNNNNNNNNNNNNNNNNNNNNNNNNNN NNNNNNNNNNNNNNNNNNNNNNN
NNNNNNNNNNNNNN
If the host spectrum analyzer is an HP 8561A, HP 8562A, or HP 8562B, press 4RECALL5 MORE
FREQ DIAGNOSE LO FREQ .
NNNNNNNNNNNNNNNNNNNNNNNNNNNNNNNNNNNNNNNNN NNNNNNNNNNNNNNNNNNNNNNN
5. The frequency displayed is the 1ST LO OUTPUT fundamental frequency. Use the
HP 8566A/B to measure the 1st LO signal's second and third harmonics levels.
Note
The 1st LO typically has a higher harmonic content than does the tracking
generator output. For this check, the variation in harmonic content versus
frequency is the factor of interest.
6. If the 1st LO harmonic level variation versus frequency tracks the tracking generator output
harmonic level variation, replace the host spectrum analyzer connection to the LO INPUT
on the tracking generator and repeat step one while measuring the 1st LO signal at A2J3
(temporarily remove AT1).
7. If the 1st LO harmonic level variation measured at A2J3 relative to the 1ST LO OUTPUT is
slight and the relative harmonic variation tracks the tracking generator's output harmonic
level, suspect the host spectrum analyzer's 1ST LO OUTPUT.
8. If the 1st LO harmonic level variation versus frequency does not track the tracking
generator output harmonic level variation, suspect the A2 assembly.
If sidebands are present at the same frequency oset at every output frequency, check the
spectral purity of the LO INPUT and 600 MHz drive signals with another spectrum analyzer. Set
the host spectrum analyzer to zero span when checking the 1st LO. Use the method described
above to determine the 1st LO frequency. A 1 MHz sideband on the 1st LO appears as a 1 MHz
sideband on the output signal.
7-28
Service Information
HP 85640A RF Tracking Generator Operation and Service Manual
1. To verify whether the 600 MHz drive or 1st LO signal is responsible for sidebands, substitute
a clean signal for the 600 MHz drive or LO INPUT.
2. If the sidebands on the output disappear when using the clean signal, the substituted signal
is responsible for the sidebands.
Note
The 600 MHz drive signal should be 08 dBm 63.5 dB. The 1st LO signal should
be +16 dBm 62 dB.
HP 85640A RF Tracking Generator Operation and Service Manual
Service Information
7-29
No Output Power
The A2 requires power supplies, a 1st LO signal, and a 600 MHz drive signal in order to provide
output power.
1. Check power supply voltages at A3J1 and A2J1. Refer to the A3 interface assembly
schematic diagram in this chapter.
2. Check that ALC EXT measured at A3J1 pin 10 is a TTL low when the tracking generator is
set to ALC INT and TTL high when the tracking generator is set to ALC EXT.
3. Check that the 600 MHz drive signal is 08 dBm 63.5 dB. If the signal is outside this range,
examine the A3 interface assembly.
4. Check that the LO INPUT signal measures +16 dBm 62 dB. If not, perform the 1ST LO
OUTPUT amplitude performance test for the host spectrum analyzer.
5. Check the tracking adjustment controls. Monitor A3U5 pin 8 with a DVM. Rotate the
TRACKING ADJUST control from fully counterclockwise to fully clockwise. The voltage
measured should increase from 0 V to >+8 V.
Caution
The following step requires adjustment of A2C3. The lifetime of A2C3 is rated
for less than 10 cycles. Do not adjust A2C3 unless it is absolutely necessary.
6. If all the above checks are acceptable, then the tracking oscillator may be malfunctioning.
a. Set up the host spectrum analyzer as indicated in the tracking oscillator adjustment
procedure (coarse adjustment) found in Chapter 5 of this manual.
b. Use a spectrum analyzer such as an HP 8566A/B in place of a frequency counter.
c. Try to adjust A2C3 until a signal is displayed on the HP 8566A/B.
d. If the tracking oscillator does not start by adjusting A2C3, suspect A2.
7-30
Service Information
HP 85640A RF Tracking Generator Operation and Service Manual
Index
0
F
0.5V/GHz input, 3-4
0.5V/GHz output, 3-6
300 MHz input, 3-2
atness out of tolerance, 7-27
frequency tracking range performance test,
4-31
front-panel features, 3-2
front-panel interconnections, 3-2
A
G
adjustment procedures
600 MHz level adjustment, 5-7
adjustable components, 5-3
adjustment list table, 5-2
adjustment tools, 5-2
factory-selected components, 5-3
post-repair/spec fail adjustment list, 5-2
power level adjustment, 5-12
power supply adjustment, 5-3
safety considerations, 5-1
tracking oscillator range adjustment, 5-15
which adjustment to perform, 5-1
alc int ext, 3-4
assembly replaceable parts, 6-1{6
introduction, 6-1
major assembly and cable locations, 6-2
mechanical replaceable parts, 6-4
general information
calibration cycle, 1-4
characteristics, 1-11
serial numbers, 1-4
specications, 1-6
B
input power, 3-4
installation information
compatibility with host spectrum analyzer,
2-1
inspection, 2-2
power requirements, 2-3
preparation for use, 2-2
sales and service oces, 2-9
instrument description, 7-18{21
3
bandpass lter rejection, 3-21
blanking input, 3-4
block diagrams, 7-18, 7-20
C
calibration, equipment needed, 3-7
characteristics, 1-11{12
connections
tracking generator/spectrum analyzer, 3-5
E
electrostatic discharge, 7-2
error messages
ERR 902 BAD NORM, 3-18
ERR 903 A>DLMT, 3-20
SAVELOCK ON, 3-17, 3-27, 3-35, 3-40
ext alc input, 3-4
HP 85640A RF Tracking Generator Operation and Service Manual
H
harmonic spurious outputs performance test,
4-16
host spectrum analyzers, 4-1
HP 8560A/E, HP 8561B/E, HP 8563A/E
reection measurements, 3-30
transmission measurements, 3-9
HP 8561A, HP 8562A/B
reection measurements, 3-37
transmission measurements, 3-21
I
L
level atness performance test, 4-12
line switch, 3-2
LO feedthrough amplitude performance test,
4-24
LO input, 3-2
Index-1
M
R
major assembly and cable locations, 6-2{4
maximum leveled output power performance
test, 4-9
mechanical replaceable parts, 6-4{6
rear panel features, 3-4
rear panel interconnections, 3-4
rear panel sweep output, 4-3
reference trace, 3-15, 3-26
reection measurement example
HP 8560A/E, HP 8561B/E, HP 8563A/E,
3-30
HP 8561A, HP 8562A/B, 3-37
\savelock on" error, 3-35, 3-40
store open/short average reference, 3-32
replacement procedures, 7-6{17
A5 line lter/switch assembly replacement,
7-16
replacing A1 attenuator, 7-8
replacing A2 tracking generator, 7-10
replacing A3 interface board assembly,
7-12
replacing A4 power supply, 7-14
replacing the instrument cover, 7-7
RF output, 3-2
N
non-harmonic spurious outputs performance
test, 4-19
O
operation
front-panel features, 3-2
rear panel features, 3-4
reection measurement example, HP
8560A/E, HP 8561B/E, HP 8563A/E,
3-30
reection measurement example, HP
8561A, HP 8562A/B, 3-37
setting .5 V/GHz rear panel output, 3-6
tracking generator and host spectrum
analyzer connections, 3-5
transmission measurement example, HP
8560A/E, HP 8561B/E, HP 8563A/E,
3-9
transmission measurement example, HP
8561A, HP 8562A/B, 3-21
output attenuator accuracy performance
test, 4-6
output level knob, 3-2
P
packaging, 2-2, 7-4
performance tests
frequency tracking range, 4-31
harmonic spurious outputs, 4-16
host spectrum analyzers, 4-1
level atness, 4-12
LO feedthrough amplitude, 4-24
maximum leveled output power, 4-9
non-harmonic spurious outputs, 4-19
output attenuator accuracy, 4-6
preparing the host spectrum analyzer, 4-3
preparing the tracking generator, 4-3
recommended test equipment list, 4-3
recording test results, 4-3
test equipment required, 4-3
test list table, 4-1
tracking generator feedthrough, 4-27
power requirements, 2-3{6
line fuse, 2-5
line voltage range, 2-3
line-voltage selection, 2-4
power cables, 2-5
Index-2
S
sales and service, 2-9
service information, 2-9
A1 attenuator circuit description, 7-21
A2 tracking generator circuit description,
7-21
A3 interface assembly circuit description,
7-22
A4 power supply circuit description, 7-23
A5 line lter/switch assembly circuit
description, 7-23
A5 line lter/switch assembly replacement,
7-16
electrostatic discharge, 7-2
excessive FM, 7-26
atness out of tolerance, 7-27
output unleveled, 7-24
rebuilt-exchange assemblies, 7-6
replacement procedures, 7-6
replacing A1 attenuator, 7-8
replacing A2 tracking generator, 7-10
replacing A3 interface board assembly,
7-12
replacing A4 power supply, 7-14
replacing the instrument cover, 7-7
returning the instrument for service, 7-4
spectrum analyzer to tracking generator
system block diagram, 7-20
tracking generator block diagram, 7-20
tracking generator circuit description, 7-18
tracking generator circuit troubleshooting,
7-18
troubleshooting, 7-24
HP 85640A RF Tracking Generator Operation and Service Manual
setting .5 V/GHz rear panel output, 3-6
shipping, 2-2, 7-4
specications, 1-6{10
stimulus-response measurement
equipment needed, 3-7
T
thru trace, 3-15, 3-26
tracking adjust knob, 3-2
tracking errors, 3-13, 3-25
tracking generator circuit description
A1 attenuator, 7-21
A2 tracking generator, 7-21
A3 interface assembly, 7-22
A4 power supply, 7-23
A5 line lter/switch assembly, 7-23
tracking generator feedthrough performance
test, 4-27
tracking generator/host spectrum analyzer
connections, 3-5
HP 85640A RF Tracking Generator Operation and Service Manual
transmission measurement example
adjusting the range level, 3-18, 3-28
calibration, HP 8561A or HP 8562A/B,
3-15, 3-26
HP 8560A/E, HP 8561B/E, HP 8563A/E,
3-9
HP 8561A, HP 8562A/B, 3-21
\savelock on" error, 3-17, 3-27
storing thru-reference, 3-17, 3-27
troubleshooting, 7-24{30
block diagram, 7-18
excessive FM, 7-26
harmonic outputs too high, 7-28
no output power, 7-30
output unleveled, 7-24
spurious outputs too high, 7-28
U
unleveled LED, 3-2
Index-3