1
Agilent 4396B Network/Spectrum/Impedance Analyzer
PERFORMANCE TEST MANUAL
SERIAL NUMBERS
This manual applies directly to instruments with serial
number prex JP1KE, or rmware revision 1.01 and below.
For additional important information about serial
numbers, read \Serial Number" in Appendix A.
Agilent Part No. 04396-90130
Printed in Japan March 2000
Third Edition
Notice
The information contained in this document is subject to change without notice.
This document contains proprietary information that is protected by copyright. All rights are
reserved. No part of this document may be photocopied, reproduced, or translated to another
language without the prior written consent of the Agilent Technologies.
Agilent Technologies Japan, Ltd.
Component Test PGU-Kobe
1-3-2, Murotani, Nishi-ku, Kobe-shi,
Hyogo, 651-2241 Japan
c 1997,2000 Agilent Technologies Japan, Ltd.
Manual Printing History
March 1997 : : : : : : : : : : : : : : : : : : : : : : : : : : : : : : : : : : : : : : : : : : : First Edition (part number: 04396-90120)
July 1997 : : : : : : : : : : : : : : : : : : : : : : : : : : : : : : : : : : : : : : : : : : Second Edition (part number: 04396-90130)
March 2000 : : : : : : : : : : : : : : : : : : : : : : : : : : : : : : : : : : : : : : : : : : Third Edition (part number: 04396-90130)
iii
Safety Summary
The following general safety precautions must be observed during all phases of operation,
service, and repair of this instrument. Failure to comply with these precautions or with specic
WARNINGS elsewhere in this manual may impair the protection provided by the equipment.
In addition it violates safety standards of design, manufacture, and intended use of the
instrument.
The Agilent Technologies assumes no liability for the customer's failure to comply with these
requirements.
Note
4396B comply with INSTALLATION CATEGORY II and POLLUTION DEGREE 2
in IEC1010-1. 4396B are INDOOR USE product.
Note
LEDs in 4396B are Class 1 in accordance with IEC825-1.
CLASS 1 LED PRODUCT
Ground The Instrument
To avoid electric shock hazard, the instrument chassis and cabinet must be connected to a
safety earth ground by the supplied power cable with earth blade.
DO NOT Operate In An Explosive Atmosphere
Do not operate the instrument in the presence of ammable gasses or fumes. Operation of any
electrical instrument in such an environment constitutes a denite safety hazard.
Keep Away From Live Circuits
Operating personnel must not remove instrument covers. Component replacement and internal
adjustments must be made by qualied maintenance personnel. Do not replace components
with the power cable connected. Under certain conditions, dangerous voltages may exist even
with the power cable removed. To avoid injuries, always disconnect power and discharge
circuits before touching them.
DO NOT Service Or Adjust Alone
Do not attempt internal service or adjustment unless another person, capable of rendering rst
aid and resuscitation, is present.
DO NOT Substitute Parts Or Modify Instrument
Because of the danger of introducing additional hazards, do not install substitute parts or
perform unauthorized modications to the instrument. Return the instrument to a Agilent
Technologies Sales and Service Oce for service and repair to ensure that safety features are
maintained.
iv
Dangerous Procedure Warnings
Warnings , such as the example below, precede potentially dangerous procedures throughout
this manual. Instructions contained in the warnings must be followed.
Warning
Dangerous voltages, capable of causing death, are present in this
instrument. Use extreme caution when handling, testing, and adjusting
this instrument.
v
Certication
Agilent Technologies certies that this product met its published specications at the time
of shipment from the factory. Agilent Technologies further certies that its calibration
measurements are traceable to the United States National Institute of Standards and
Technology, to the extent allowed by the Institution's calibration facility, or to the calibration
facilities of other International Standards Organization members.
Warranty
This Agilent Technologies instrument product is warranted against defects in material and
workmanship for a period of one year from the date of shipment, except that in the case of
certain components listed in General Information of this manual, the warranty shall be for the
specied period. During the warranty period, Agilent Technologies will, at its option, either
repair or replace products that prove to be defective.
For warranty service or repair, this product must be returned to a service facility designated by
Agilent Technologies. Buyer shall prepay shipping charges to Agilent Technologies and Agilent
Technologies shall pay shipping charges to return the product to Buyer. However, Buyer shall
pay all shipping charges, duties, and taxes for products returned to Agilent Technologies from
another country.
Agilent Technologies warrants that its software and rmware designated by Agilent
Technologies for use with an instrument will execute its programming instruction when
property installed on that instrument. Agilent Technologies does not warrant that the operation
of the instrument, or software, or rmware will be uninterrupted or error free.
Limitation Of Warranty
The foregoing warranty shall not apply to defects resulting from improper or inadequate
maintenance by Buyer, Buyer-supplied software or interfacing, unauthorized modication or
misuse, operation outside the environmental specications for the product, or improper site
preparation or maintenance.
No other warranty is expressed or implied. Agilent Technologies specically disclaims the
implied warranties of merchantability and tness for a particular purpose.
vi
Exclusive Remedies
The remedies provided herein are buyer's sole and exclusive remedies. Agilent Technologies
shall not be liable for any direct, indirect, special, incidental, or consequential damages,
whether based on contract, tort, or any other legal theory.
Assistance
Product maintenance agreements and other customer assistance agreements are available for
Agilent Technologies products.
For any assistance, contact your nearest Agilent Technologies Sales and Service Oce.
Addresses are provided at the back of this manual.
vii
Safety Symbols
General denitions of safety symbols used on equipment or in manuals are listed below.
Instruction manual symbol: the product is marked with this symbol when it is
necessary for the user to refer to the instruction manual.
Alternating current.
Direct current.
On (Supply).
O (Supply).
In position of push-button switch.
Out position of push-button switch.
Frame (or chassis) terminal. A connection to the frame (chassis) of the
equipment which normally include all exposed metal structures.
High voltage terminals : terminals fed from internal or external sources by
voltages which may exceed 1000 volts.
This Warning sign denotes a hazard. It calls attention to a procedure, practice,
condition or the like, which, if not correctly performed or adhered to, could
result in injury or death to personnel.
This Caution sign denotes a hazard. It calls attention to a procedure, practice,
condition or the like, which, if not correctly performed or adhered to, could
result in damage to or destruction of part or all of the product.
Note denotes important information. It calls attention to a procedure,
practice, condition or the like, which is essential to highlight.
Axed to product containing static sensitive devices use anti-static handling
procedures to prevent electrostatic discharge damage to component.
viii
Documentation Map
The following manuals are available for the analyzer.
Task Reference (Agilent Part Number 04396-90030)
Task Reference helps you to learn how to use the analyzer. This manual provide simple
step-by-step instruction, without concepts.
User's Guide (Agilent Part Number 04396-90031)
The User's Guide walks you through system setup and initial power-on, shows how to
make basic measurements, explains commonly used features, and typical application
measurement examples. After you receive your analyzer, begin with this manual.
Function Reference (Agilent Part Number 04396-90052)
Function Reference describes all function accessed from the front panel keys and
softkeys, and provides information on options and accessories available, specications,
system performance, and some topics about the analyzer's features.
Programming Guide (Agilent Part Number 04396-90043)
The Programming Guide shows how to make basic program to control the analyzer by a
controller by GPIB.
GPIB Command Reference (Agilent Part Number 04396-90044)
GPIB Command Reference provides a summary of all available GPIB command, and
information on status reporting structure and trigger system correspond to SCPI.
HP instrument BASIC Users Handbook (Agilent Part Number E2083-90000)
The HP instrument BASIC Users Handbook introduces you to the HP instrument BASIC
programming language, provide some helpful hints on getting the most use from it, and
provide a general programming reference. It is divided into three books, HP instrument
BASIC Programming Techniques , HP instrument BASIC Interface Techniques , and HP
instrument BASIC Language Reference.
Performance Test Manual (Agilent Part Number 04396-90130)
The Performance Test Manual explains how to verify conformance to published
specications.
Service Manual (Option 0BW only), (Agilent Part Number 04396-90121)
The Service Manual explains how to adjust, troubleshoot, and repair the instrument.
This manual is option 0BW only.
ix
Contents
1. General Information
INTRODUCTION . . . . . . . . . . . . . . . . . . . . . .
ABOUT THIS MANUAL . . . . . . . . . . . . . . . . . . .
Manual Organization . . . . . . . . . . . . . . . . . . .
PERFORMANCE TESTS . . . . . . . . . . . . . . . . . .
CALIBRATION CYCLE . . . . . . . . . . . . . . . . . . .
CALCULATION SHEET AND PERFORMANCE TEST RECORD .
Calculation Sheet . . . . . . . . . . . . . . . . . . . .
Performance Test Record . . . . . . . . . . . . . . . . .
How to Use . . . . . . . . . . . . . . . . . . . . . . .
RECOMMENDED TEST EQUIPMENT . . . . . . . . . . . .
Calibration Data Required for Step Attenuator . . . . . . .
2. Performance Tests
INTRODUCTION . . . . . . . . . . . . . . . . . . .
1. FREQUENCY ACCURACY TEST (NA) . . . . . . . .
Description . . . . . . . . . . . . . . . . . . . .
Specication . . . . . . . . . . . . . . . . . . . .
Test Equipment . . . . . . . . . . . . . . . . . .
Procedure . . . . . . . . . . . . . . . . . . . . .
2. SOURCE LEVEL ACCURACY/FLATNESS TEST (NA) .
Description . . . . . . . . . . . . . . . . . . . .
Specication . . . . . . . . . . . . . . . . . . . .
Test Equipment . . . . . . . . . . . . . . . . . .
Procedure . . . . . . . . . . . . . . . . . . . . .
3. NON-SWEEP POWER LINEARITY TEST (NA) . . . .
Description . . . . . . . . . . . . . . . . . . . .
Specication . . . . . . . . . . . . . . . . . . . .
Test Equipment . . . . . . . . . . . . . . . . . .
Procedure . . . . . . . . . . . . . . . . . . . . .
4. POWER SWEEP LINEARITY TEST (NA) . . . . . .
Description . . . . . . . . . . . . . . . . . . . .
Specication . . . . . . . . . . . . . . . . . . . .
Test Equipment . . . . . . . . . . . . . . . . . .
Procedure . . . . . . . . . . . . . . . . . . . . .
5. HARMONICS/NON-HARMONIC SPURIOUS TEST (NA)
Description . . . . . . . . . . . . . . . . . . . .
Specication . . . . . . . . . . . . . . . . . . . .
Test Equipment . . . . . . . . . . . . . . . . . .
Procedure . . . . . . . . . . . . . . . . . . . . .
6. RECEIVER NOISE LEVEL TEST (NA) . . . . . . .
Description . . . . . . . . . . . . . . . . . . . .
Specication . . . . . . . . . . . . . . . . . . . .
Test Equipment . . . . . . . . . . . . . . . . . .
Procedure . . . . . . . . . . . . . . . . . . . . .
7. INPUT CROSSTALK TEST (NA) . . . . . . . . . .
.
.
.
.
.
.
.
.
.
.
.
.
.
.
.
.
.
.
.
.
.
.
.
.
.
.
.
.
.
.
.
.
.
.
.
.
.
.
.
.
.
.
.
.
.
.
.
.
.
.
.
.
.
.
.
.
.
.
.
.
.
.
.
.
.
.
.
.
.
.
.
.
.
.
.
.
.
.
.
.
.
.
.
.
.
.
.
.
.
.
.
.
.
.
.
.
.
.
.
.
.
.
.
.
.
.
.
.
.
.
.
.
.
.
.
.
.
.
.
.
.
.
.
.
.
.
.
.
.
.
.
.
.
.
.
.
.
.
.
.
.
.
.
.
.
.
.
.
.
.
.
.
.
.
.
.
.
.
.
.
.
.
.
.
.
.
.
.
.
.
.
.
.
.
.
.
.
.
.
.
.
.
.
.
.
.
.
.
.
.
.
.
.
.
.
1-1
1-1
1-1
1-2
1-3
1-3
1-3
1-3
1-3
1-4
1-5
.
.
.
.
.
.
.
.
.
.
.
.
.
.
.
.
.
.
.
.
.
.
.
.
.
.
.
.
.
.
.
.
.
.
.
.
.
.
.
.
.
.
.
.
.
.
.
.
.
.
.
.
.
.
.
.
.
.
.
.
.
.
.
.
.
.
.
.
.
.
.
.
.
.
.
.
.
.
.
.
.
.
.
.
.
.
.
.
.
.
.
.
.
.
.
.
.
.
.
.
.
.
.
.
.
.
.
.
.
.
.
.
.
.
.
.
.
.
.
.
.
.
.
.
.
.
.
.
.
.
.
.
.
.
.
.
.
.
.
.
.
.
.
.
.
.
.
.
.
.
.
.
.
.
.
.
.
.
.
.
.
.
.
.
.
.
.
.
.
.
.
.
.
.
.
.
.
.
.
.
.
.
.
.
.
.
.
.
.
.
.
.
.
.
.
.
.
.
.
.
.
.
.
.
.
.
.
.
.
.
.
.
.
.
.
.
.
.
.
.
.
.
.
.
.
.
.
.
.
.
.
.
.
.
.
.
.
.
.
.
.
.
.
.
.
.
.
.
.
.
.
.
.
.
.
.
.
.
.
.
.
.
.
.
.
.
.
.
.
.
.
.
.
.
.
.
.
.
.
.
.
.
.
.
.
.
.
.
2-1
2-2
2-2
2-2
2-2
2-2
2-4
2-4
2-4
2-4
2-4
2-6
2-6
2-6
2-6
2-6
2-9
2-9
2-9
2-9
2-9
2-12
2-12
2-12
2-12
2-12
2-16
2-16
2-16
2-16
2-16
2-20
Contents-1
Description . . . . . . . . . . . . . . . . . . . . . . . . . . . .
Specication . . . . . . . . . . . . . . . . . . . . . . . . . . . .
Test Equipment . . . . . . . . . . . . . . . . . . . . . . . . . .
Procedure . . . . . . . . . . . . . . . . . . . . . . . . . . . . .
8. INPUT IMPEDANCE TEST (NA) . . . . . . . . . . . . . . . . . .
Description . . . . . . . . . . . . . . . . . . . . . . . . . . . .
Specication . . . . . . . . . . . . . . . . . . . . . . . . . . . .
Test Equipment . . . . . . . . . . . . . . . . . . . . . . . . . .
Procedure . . . . . . . . . . . . . . . . . . . . . . . . . . . . .
9. ABSOLUTE AMPLITUDE ACCURACY TEST (NA) . . . . . . . . . .
Description . . . . . . . . . . . . . . . . . . . . . . . . . . . .
Specication . . . . . . . . . . . . . . . . . . . . . . . . . . . .
Test Equipment . . . . . . . . . . . . . . . . . . . . . . . . . .
Procedure . . . . . . . . . . . . . . . . . . . . . . . . . . . . .
10. MAGNITUDE RATIO/PHASE DYNAMIC ACCURACY TEST (NA) . . .
Description . . . . . . . . . . . . . . . . . . . . . . . . . . . .
Specication . . . . . . . . . . . . . . . . . . . . . . . . . . . .
Test Equipment . . . . . . . . . . . . . . . . . . . . . . . . . .
Procedure . . . . . . . . . . . . . . . . . . . . . . . . . . . . .
11. MAGNITUDE RATIO/PHASE FREQUENCY RESPONSE TEST (NA) . .
Description . . . . . . . . . . . . . . . . . . . . . . . . . . . .
Specication . . . . . . . . . . . . . . . . . . . . . . . . . . . .
Test Equipment . . . . . . . . . . . . . . . . . . . . . . . . . .
Procedure . . . . . . . . . . . . . . . . . . . . . . . . . . . . .
12. CALIBRATOR AMPLITUDE ACCURACY TEST (SA) . . . . . . . . .
Description . . . . . . . . . . . . . . . . . . . . . . . . . . . .
Specication . . . . . . . . . . . . . . . . . . . . . . . . . . . .
Test Equipment . . . . . . . . . . . . . . . . . . . . . . . . . .
Procedure . . . . . . . . . . . . . . . . . . . . . . . . . . . . .
13. DISPLAYED AVERAGE NOISE LEVEL TEST (SA) . . . . . . . . .
Description . . . . . . . . . . . . . . . . . . . . . . . . . . . .
Specication . . . . . . . . . . . . . . . . . . . . . . . . . . . .
Test Equipment . . . . . . . . . . . . . . . . . . . . . . . . . .
Procedure . . . . . . . . . . . . . . . . . . . . . . . . . . . . .
14. AMPLITUDE FIDELITY TEST (SA) . . . . . . . . . . . . . . . .
Description . . . . . . . . . . . . . . . . . . . . . . . . . . . .
Specication . . . . . . . . . . . . . . . . . . . . . . . . . . . .
Test Equipment . . . . . . . . . . . . . . . . . . . . . . . . . .
Procedure . . . . . . . . . . . . . . . . . . . . . . . . . . . . .
15. INPUT ATTENUATOR SWITCHING UNCERTAINTY TEST (SA) . . .
Description . . . . . . . . . . . . . . . . . . . . . . . . . . . .
Specication . . . . . . . . . . . . . . . . . . . . . . . . . . . .
Test Equipment . . . . . . . . . . . . . . . . . . . . . . . . . .
Procedure . . . . . . . . . . . . . . . . . . . . . . . . . . . . .
16. RESOLUTION BANDWIDTH ACCURACY/SELECTIVITY TEST (SA) .
Description . . . . . . . . . . . . . . . . . . . . . . . . . . . .
Specication . . . . . . . . . . . . . . . . . . . . . . . . . . . .
Test Equipment . . . . . . . . . . . . . . . . . . . . . . . . . .
Procedure . . . . . . . . . . . . . . . . . . . . . . . . . . . . .
17. RESOLUTION BANDWIDTH SWITCHING UNCERTAINTY TEST (SA) .
Description . . . . . . . . . . . . . . . . . . . . . . . . . . . .
Specication . . . . . . . . . . . . . . . . . . . . . . . . . . . .
Test Equipment . . . . . . . . . . . . . . . . . . . . . . . . . .
Procedure . . . . . . . . . . . . . . . . . . . . . . . . . . . . .
18. IF GAIN SWITCHING UNCERTAINTY TEST (SA) . . . . . . . . . .
Contents-2
.
.
.
.
.
.
.
.
.
.
.
.
.
.
.
.
.
.
.
.
.
.
.
.
.
.
.
.
.
.
.
.
.
.
.
.
.
.
.
.
.
.
.
.
.
.
.
.
.
.
.
.
.
.
.
.
.
.
.
.
.
.
.
.
.
.
.
.
.
.
.
.
.
.
.
.
.
.
.
.
.
.
.
.
.
.
.
.
.
.
.
.
.
.
.
.
.
.
.
.
.
.
.
.
.
.
.
.
.
.
.
.
.
.
.
.
.
.
.
.
.
.
.
.
.
.
.
.
.
.
.
.
.
.
.
.
.
.
.
.
.
.
.
.
.
.
.
.
.
.
.
.
.
.
.
.
.
.
.
.
.
.
.
.
.
.
.
.
.
.
.
.
.
.
.
.
.
.
.
.
.
.
.
.
.
.
.
.
.
.
.
.
.
.
.
.
.
.
.
.
.
.
.
.
.
.
.
.
.
.
.
.
.
.
.
.
.
.
.
.
2-20
2-20
2-20
2-20
2-25
2-25
2-25
2-25
2-25
2-28
2-28
2-28
2-28
2-28
2-31
2-31
2-31
2-32
2-32
2-41
2-41
2-41
2-41
2-41
2-49
2-49
2-49
2-49
2-49
2-50
2-50
2-50
2-50
2-50
2-52
2-52
2-52
2-52
2-53
2-56
2-56
2-56
2-56
2-56
2-59
2-59
2-59
2-59
2-59
2-63
2-63
2-63
2-63
2-63
2-65
Description . . . . . . . . . . . . . . . . . . . . . . . .
Specication . . . . . . . . . . . . . . . . . . . . . . . .
Test Equipment . . . . . . . . . . . . . . . . . . . . . .
Procedure . . . . . . . . . . . . . . . . . . . . . . . . .
19. NOISE SIDEBANDS TEST (SA) . . . . . . . . . . . . . .
Description . . . . . . . . . . . . . . . . . . . . . . . .
Specication . . . . . . . . . . . . . . . . . . . . . . . .
Test Equipment . . . . . . . . . . . . . . . . . . . . . .
Procedure . . . . . . . . . . . . . . . . . . . . . . . . .
20. FREQUENCY RESPONSE TEST (SA) . . . . . . . . . . .
Description . . . . . . . . . . . . . . . . . . . . . . . .
Specication . . . . . . . . . . . . . . . . . . . . . . . .
Test Equipment . . . . . . . . . . . . . . . . . . . . . .
Procedure . . . . . . . . . . . . . . . . . . . . . . . . .
21. SECOND HARMONIC DISTORTION TEST (SA) . . . . . . .
Description . . . . . . . . . . . . . . . . . . . . . . . .
Specication . . . . . . . . . . . . . . . . . . . . . . . .
Test Equipment . . . . . . . . . . . . . . . . . . . . . .
Procedure . . . . . . . . . . . . . . . . . . . . . . . . .
22. THIRD ORDER INTERMODULATION DISTORTION TEST (SA)
Description . . . . . . . . . . . . . . . . . . . . . . . .
Specication . . . . . . . . . . . . . . . . . . . . . . . .
Test Equipment . . . . . . . . . . . . . . . . . . . . . .
Procedure . . . . . . . . . . . . . . . . . . . . . . . . .
23. OTHER SPURIOUS (SA) . . . . . . . . . . . . . . . . .
Description . . . . . . . . . . . . . . . . . . . . . . . .
Specication . . . . . . . . . . . . . . . . . . . . . . . .
Test Equipment . . . . . . . . . . . . . . . . . . . . . .
Procedure . . . . . . . . . . . . . . . . . . . . . . . . .
24. RESIDUAL RESPONSE TEST (SA) . . . . . . . . . . . . .
Description . . . . . . . . . . . . . . . . . . . . . . . .
Specication . . . . . . . . . . . . . . . . . . . . . . . .
Test Equipment . . . . . . . . . . . . . . . . . . . . . .
Procedure . . . . . . . . . . . . . . . . . . . . . . . . .
3. Calculation Sheet
INTRODUCTION . . . . . . . . . . . . . . . . . . . . . .
2. SOURCE LEVEL FLATNESS TEST . . . . . . . . . . . .
3. NON SWEEP POWER LINEARITY TEST . . . . . . . . .
Step Attenuator Calibration Value at 50 MHz . . . . . . .
Reference (0 dBm) . . . . . . . . . . . . . . . . . . . .
Non Sweep Power Linearity . . . . . . . . . . . . . . .
4. POWER SWEEP LINEARITY TEST . . . . . . . . . . . .
Step Attenuator Calibration Value at 50 MHz . . . . . . .
6. RECEIVER NOISE LEVEL TEST . . . . . . . . . . . . .
At IF BW 10 Hz . . . . . . . . . . . . . . . . . . . . .
At IF BW 40 kHz . . . . . . . . . . . . . . . . . . . .
9. ABSOLUTE AMPLITUDE ACCURACY TEST . . . . . . . .
R input . . . . . . . . . . . . . . . . . . . . . . . . .
A input . . . . . . . . . . . . . . . . . . . . . . . . .
B input . . . . . . . . . . . . . . . . . . . . . . . . .
10. MAGNITUDE RATIO/PHASE DYNAMIC ACCURACY TEST
Step Attenuator Calibration Value at 50 MHz . . . . . . .
A/R Measurement . . . . . . . . . . . . . . . . . . . .
B/R Measurement . . . . . . . . . . . . . . . . . . . .
.
.
.
.
.
.
.
.
.
.
.
.
.
.
.
.
.
.
.
.
.
.
.
.
.
.
.
.
.
.
.
.
.
.
.
.
.
.
.
.
.
.
.
.
.
.
.
.
.
.
.
.
.
.
.
.
.
.
.
.
.
.
.
.
.
.
.
.
.
.
.
.
.
.
.
.
.
.
.
.
.
.
.
.
.
.
.
.
.
.
.
.
.
.
.
.
.
.
.
.
.
.
.
.
.
.
.
.
.
.
.
.
.
.
.
.
.
.
.
.
.
.
.
.
.
.
.
.
.
.
.
.
.
.
.
.
.
.
.
.
.
.
.
.
.
.
.
.
.
.
.
.
.
.
.
.
.
.
.
.
.
.
.
.
.
.
.
.
.
.
.
.
.
.
.
.
.
.
.
.
.
.
.
.
.
.
.
.
.
.
.
.
.
.
.
.
.
.
.
.
.
.
.
.
.
.
.
.
.
.
.
.
.
.
.
.
.
.
.
.
.
.
.
.
.
.
.
.
.
.
.
.
.
.
.
.
.
.
.
.
.
.
.
.
.
.
.
.
.
.
.
.
.
.
.
.
.
.
.
.
.
.
.
.
.
.
.
.
.
.
.
.
.
.
.
.
.
.
.
.
.
.
.
.
.
.
.
.
.
.
.
2-65
2-65
2-65
2-66
2-69
2-69
2-69
2-69
2-69
2-73
2-73
2-73
2-73
2-73
2-78
2-78
2-78
2-78
2-78
2-80
2-80
2-80
2-80
2-80
2-83
2-83
2-83
2-83
2-83
2-86
2-86
2-86
2-86
2-86
.
.
.
.
.
.
.
.
.
.
.
.
.
.
.
.
.
.
.
.
.
.
.
.
.
.
.
.
.
.
.
.
.
.
.
.
.
.
.
.
.
.
.
.
.
.
.
.
.
.
.
.
.
.
.
.
.
.
.
.
.
.
.
.
.
.
.
.
.
.
.
.
.
.
.
.
.
.
.
.
.
.
.
.
.
.
.
.
.
.
.
.
.
.
.
.
.
.
.
.
.
.
.
.
.
.
.
.
.
.
.
.
.
.
.
.
.
.
.
.
.
.
.
.
.
.
.
.
.
.
.
.
.
.
.
.
.
.
.
.
.
.
.
.
.
.
.
.
.
.
.
.
3-1
3-1
3-2
3-2
3-2
3-2
3-3
3-3
3-4
3-4
3-5
3-6
3-6
3-6
3-6
3-7
3-7
3-7
3-7
Contents-3
13. DISPLAYED AVERAGE NOISE LEVEL TEST . . . . . . . .
14. AMPLITUDE FIDELITY . . . . . . . . . . . . . . . . .
Step Attenuator Calibration Value at 50 MHz . . . . . . . .
At RBW 10 kHz . . . . . . . . . . . . . . . . . . . . . .
At RBW 1 MHz . . . . . . . . . . . . . . . . . . . . . .
15. INPUT ATTENUATOR SWITCHING UNCERTAINTY TEST . .
Step Attenuator Calibration Value at 50 MHz . . . . . . . .
Input Attenuator Switching Uncertainty . . . . . . . . . .
16. RESOLUTION BANDWIDTH ACCURACY/SELECTIVITY TEST
RBW Selectivity . . . . . . . . . . . . . . . . . . . . . .
18. IF GAIN SWITCHING UNCERTAINTY TEST . . . . . . . .
10 dB Step Attenuator Calibration Value at 50 MHz . . . . .
1 dB Step Attenuator Calibration Value at 50 MHz . . . . . .
IF Gain Switching Uncertainty . . . . . . . . . . . . . . .
20. FREQUENCY RESPONSE TEST . . . . . . . . . . . . . .
Reference at 20 MHz . . . . . . . . . . . . . . . . . . . .
At Frequencies 100 kHz . . . . . . . . . . . . . . . . .
At Frequencies < 100 kHz . . . . . . . . . . . . . . . . .
22. THIRD ORDER INTERMODULATION DISTORTION TEST . .
4. Performance Test Record
1. FREQUENCY ACCURACY TEST . . . . . . . . . . . . . .
without Option 1D5 . . . . . . . . . . . . . . . . . . . .
with Option 1D5 . . . . . . . . . . . . . . . . . . . . . .
2. SOURCE LEVEL ACCURACY/FLATNESS TEST . . . . . . .
Level Accuracy . . . . . . . . . . . . . . . . . . . . . .
Level Flatness . . . . . . . . . . . . . . . . . . . . . . .
3. NON SWEEP POWER LINEARITY TEST . . . . . . . . . .
4. POWER SWEEP LINEARITY TEST . . . . . . . . . . . . .
5. HARMONICS/NON-HARMONIC SPURIOUS TEST . . . . . .
Harmonics . . . . . . . . . . . . . . . . . . . . . . . . .
Non-Harmonic Spurious . . . . . . . . . . . . . . . . . .
6. RECEIVER NOISE LEVEL TEST . . . . . . . . . . . . . .
At IF BW 10 Hz . . . . . . . . . . . . . . . . . . . . . .
At IF BW 40 kHz . . . . . . . . . . . . . . . . . . . . .
7. INPUT CROSSTALK TEST . . . . . . . . . . . . . . . . .
8. INPUT IMPEDANCE TEST . . . . . . . . . . . . . . . . .
9. ABSOLUTE AMPLITUDE ACCURACY TEST . . . . . . . . .
Input R . . . . . . . . . . . . . . . . . . . . . . . . . .
Input A . . . . . . . . . . . . . . . . . . . . . . . . . .
Input B . . . . . . . . . . . . . . . . . . . . . . . . . .
10. MAGNITUDE RATIO/PHASE DYNAMIC ACCURACY TEST .
A/R Measurement . . . . . . . . . . . . . . . . . . . . .
B/R Measurement . . . . . . . . . . . . . . . . . . . . .
11. MAGNITUDE RATIO/PHASE FREQUENCY RESPONSE TEST
A/R Measurement . . . . . . . . . . . . . . . . . . . . .
B/R Measurement . . . . . . . . . . . . . . . . . . . . .
12. CALIBRATOR AMPLITUDE ACCURACY TEST . . . . . . .
13. DISPLAYED AVERAGE NOISE LEVEL TEST . . . . . . . .
14. AMPLITUDE FIDELITY TEST . . . . . . . . . . . . . . .
At RBW 10 kHz . . . . . . . . . . . . . . . . . . . . . .
At RBW 1 MHz . . . . . . . . . . . . . . . . . . . . . .
15. INPUT ATTENUATOR SWITCHING UNCERTAINTY TEST . .
16. RESOLUTION BANDWIDTH ACCURACY/SELECTIVITY TEST
Bandwidth Accuracy . . . . . . . . . . . . . . . . . . . .
Contents-4
.
.
.
.
.
.
.
.
.
.
.
.
.
.
.
.
.
.
.
.
.
.
.
.
.
.
.
.
.
.
.
.
.
.
.
.
.
.
.
.
.
.
.
.
.
.
.
.
.
.
.
.
.
.
.
.
.
.
.
.
.
.
.
.
.
.
.
.
.
.
.
.
.
.
.
.
.
.
.
.
.
.
.
.
.
.
.
.
.
.
.
.
.
.
.
.
.
.
.
.
.
.
.
.
.
.
.
.
.
.
.
.
.
.
.
.
.
.
.
.
.
.
.
.
.
.
.
.
.
.
.
.
.
.
.
.
.
.
.
.
.
.
.
.
.
.
.
.
.
.
.
.
3-8
3-9
3-9
3-9
3-9
3-10
3-10
3-10
3-11
3-11
3-12
3-12
3-12
3-12
3-13
3-13
3-13
3-13
3-14
.
.
.
.
.
.
.
.
.
.
.
.
.
.
.
.
.
.
.
.
.
.
.
.
.
.
.
.
.
.
.
.
.
.
.
.
.
.
.
.
.
.
.
.
.
.
.
.
.
.
.
.
.
.
.
.
.
.
.
.
.
.
.
.
.
.
.
.
.
.
.
.
.
.
.
.
.
.
.
.
.
.
.
.
.
.
.
.
.
.
.
.
.
.
.
.
.
.
.
.
.
.
.
.
.
.
.
.
.
.
.
.
.
.
.
.
.
.
.
.
.
.
.
.
.
.
.
.
.
.
.
.
.
.
.
.
.
.
.
.
.
.
.
.
.
.
.
.
.
.
.
.
.
.
.
.
.
.
.
.
.
.
.
.
.
.
.
.
.
.
.
.
.
.
.
.
.
.
.
.
.
.
.
.
.
.
.
.
.
.
.
.
.
.
.
.
.
.
.
.
.
.
.
.
.
.
.
.
.
.
.
.
.
.
.
.
.
.
.
.
.
.
.
.
.
.
.
.
.
.
.
.
.
.
.
.
.
.
.
.
.
.
.
.
.
.
.
.
.
.
.
.
.
.
.
.
.
.
.
.
.
.
.
.
.
.
.
.
.
.
.
.
4-1
4-1
4-1
4-2
4-2
4-2
4-2
4-3
4-4
4-4
4-4
4-5
4-5
4-6
4-7
4-7
4-8
4-8
4-8
4-8
4-9
4-9
4-10
4-11
4-11
4-11
4-11
4-12
4-12
4-12
4-12
4-13
4-13
4-13
Selectivity . . . . . . . . . . . . . . . . . . . . . . . . . .
17. RESOLUTION BANDWIDTH SWITCHING UNCERTAINTY TEST
18. IF GAIN SWITCHING UNCERTAINTY TEST . . . . . . . . .
19. NOISE SIDEBANDS TEST . . . . . . . . . . . . . . . . . .
20. FREQUENCY RESPONSE TEST . . . . . . . . . . . . . . .
21. SECOND HARMONIC DISTORTION TEST . . . . . . . . . .
22. THIRD ORDER INTERMODULATION DISTORTION TEST . . .
23. OTHER SPURIOUS TEST . . . . . . . . . . . . . . . . . .
24. RESIDUAL RESPONSE TEST . . . . . . . . . . . . . . . .
.
.
.
.
.
.
.
.
.
.
.
.
.
.
.
.
.
.
.
.
.
.
.
.
.
.
.
.
.
.
.
.
.
.
.
.
.
.
.
.
.
.
.
.
.
.
.
.
.
.
.
.
.
.
.
.
.
.
.
.
.
.
.
4-13
4-14
4-14
4-15
4-16
4-16
4-16
4-17
4-17
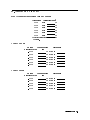
Introduction . . . . . . . . . . . . . . . . . . . . . . . . . . . . . . . . .
Manual Changes . . . . . . . . . . . . . . . . . . . . . . . . . . . . . . .
Serial Number . . . . . . . . . . . . . . . . . . . . . . . . . . . . . . . .
A-1
A-1
A-2
A. Manual Changes
Index
Contents-5
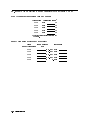
Figures
2-1.
2-2.
2-3.
2-4.
2-5.
2-6.
2-7.
2-8.
2-9.
2-10.
2-11.
2-12.
2-13.
2-14.
2-15.
2-16.
2-17.
2-18.
2-19.
2-20.
2-21.
2-22.
2-23.
2-24.
2-25.
2-26.
2-27.
2-28.
2-29.
2-30.
2-31.
2-32.
A-1.
Frequency Accuracy Test Setup . . . . . . . . . . . . . .
Source Level Accuracy/Flatness Test Setup . . . . . . . .
Non-sweep Power Linearity Test Setup . . . . . . . . . .
Power Sweep Linearity Test Setup . . . . . . . . . . . .
Harmonics Test Setup . . . . . . . . . . . . . . . . . .
Receiver Noise Level Test Setup . . . . . . . . . . . . .
Input Crosstalk Test Setup 1 . . . . . . . . . . . . . . .
Input Crosstalk Test Setup 2 . . . . . . . . . . . . . . .
Input Crosstalk Test Setup 3 . . . . . . . . . . . . . . .
Impedance Test Setup . . . . . . . . . . . . . . . . . .
Absolute Amplitude Accuracy Test Setup . . . . . . . . .
A/R Magnitude Ratio/Phase Dynamic Accuracy Test Setup 1
A/R Magnitude Ratio/Phase Dynamic Accuracy Test Setup 2
B/R Magnitude Ratio/Phase Dynamic Accuracy Test Setup 1
B/R Magnitude Ratio/Phase Dynamic Accuracy Test Setup 2
A/R Magnitude Ratio/Phase Frequency Response Test Setup
B/R Magnitude Ratio/Phase Frequency Response Test Setup
Calibrator Amplitude Accuracy Test Setup . . . . . . . . .
Average Noise Level Test Setup . . . . . . . . . . . . . .
Amplitude Fidelity Test Setup . . . . . . . . . . . . . .
Input Attenuator Accuracy Test Setup . . . . . . . . . . .
RBW Accuracy and Selectivity Test Setup . . . . . . . . .
RBW Switching Uncertainty Test Setup . . . . . . . . . .
IF Gain Switching Uncertainty Test Setup . . . . . . . . .
Noise Sidebands Test Setup . . . . . . . . . . . . . . . .
Frequency Response Test Setup 1 . . . . . . . . . . . . .
Frequency Response Test Setup 2 . . . . . . . . . . . . .
Frequency Response Test Setup 3 . . . . . . . . . . . . .
Second Harmonics Distortion Test Setup . . . . . . . . . .
Third Order Intermodulation Distortion Test Setup . . . . .
Other Spurious Test Setup . . . . . . . . . . . . . . . .
Residual Response Test Setup . . . . . . . . . . . . . . .
Serial Number Plate . . . . . . . . . . . . . . . . . . .
Contents-6
.
.
.
.
.
.
.
.
.
.
.
.
.
.
.
.
.
.
.
.
.
.
.
.
.
.
.
.
.
.
.
.
.
.
.
.
.
.
.
.
.
.
.
.
.
.
.
.
.
.
.
.
.
.
.
.
.
.
.
.
.
.
.
.
.
.
.
.
.
.
.
.
.
.
.
.
.
.
.
.
.
.
.
.
.
.
.
.
.
.
.
.
.
.
.
.
.
.
.
.
.
.
.
.
.
.
.
.
.
.
.
.
.
.
.
.
.
.
.
.
.
.
.
.
.
.
.
.
.
.
.
.
.
.
.
.
.
.
.
.
.
.
.
.
.
.
.
.
.
.
.
.
.
.
.
.
.
.
.
.
.
.
.
.
.
.
.
.
.
.
.
.
.
.
.
.
.
.
.
.
.
.
.
.
.
.
.
.
.
.
.
.
.
.
.
.
.
.
.
.
.
.
.
.
.
.
.
.
.
.
.
.
.
.
.
.
.
.
.
.
.
.
.
.
.
.
.
.
.
.
.
.
.
.
.
.
.
.
.
.
.
.
.
.
.
.
.
.
.
.
.
.
.
.
.
.
.
.
.
.
.
.
.
.
.
.
.
.
.
.
.
.
.
.
.
.
.
.
.
.
.
.
.
.
.
.
.
.
.
.
.
.
.
.
.
.
.
2-3
2-4
2-7
2-10
2-12
2-17
2-21
2-22
2-23
2-26
2-29
2-33
2-35
2-37
2-39
2-42
2-45
2-49
2-50
2-53
2-57
2-60
2-63
2-66
2-70
2-74
2-76
2-77
2-79
2-81
2-83
2-86
A-2
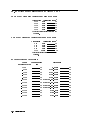
Tables
1-1.
1-2.
1-3.
1-4.
2-1.
2-2.
2-3.
2-4.
2-5.
2-6.
2-7.
2-8.
2-9.
2-10.
2-11.
2-12.
2-13.
2-14.
2-15.
2-16.
2-17.
2-18.
2-19.
2-20.
2-21.
2-22.
2-23.
2-24.
2-25.
2-26.
2-27.
A-1.
A-2.
Performance Tests . . . . . . . . . . . . . . . . .
Recommended Test Equipment . . . . . . . . . . .
Calibration Data Required for 8496A/G . . . . . . .
Calibration Data Required for 8494A/G . . . . . . .
Source Level Flatness Test Settings . . . . . . . . .
Non-Sweep Power Linearity Test Settings . . . . . .
Power Sweep Linearity Test Settings . . . . . . . .
Harmonics Test Settings . . . . . . . . . . . . . .
Non-Harmonic Spurious Test Settings . . . . . . . .
Receiver Noise Test Settings . . . . . . . . . . . .
Receiver Noise Test Settings 2 . . . . . . . . . . .
Absolute Amplitude Accuracy Test Settings . . . . .
A/R Dynamic Accuracy Test Settings 1 . . . . . . .
A/R Dynamic Accuracy Test Settings 2 . . . . . . .
B/R Dynamic Accuracy Test Settings 1 . . . . . . . .
B/R Dynamic Accuracy Test Settings 2 . . . . . . . .
Displayed Average Noise Level Test Settings . . . . .
Amplitude Fidelity Test Settings 1 . . . . . . . . .
Amplitude Fidelity Test Settings 2 . . . . . . . . .
Input Attenuator Switching Uncertainty Test Settings
RBW Accuracy Test Settings . . . . . . . . . . . .
RBW Selectivity Test Settings . . . . . . . . . . . .
RBW Switching Uncertainty Test Settings . . . . . .
IF Gain Switching Uncertainty Test Settings . . . . .
Noise Sideband Test Settings . . . . . . . . . . . .
Frequency Response Test Settings 1 . . . . . . . . .
Frequency Response Test Settings 1 . . . . . . . . .
Third Order Intermodulation Test Settings . . . . . .
Other Spurious Test Settings . . . . . . . . . . . .
Other Spurious Test Settings 2 . . . . . . . . . . .
Residual Response Test Settings . . . . . . . . . . .
Manual Changes by Serial Number . . . . . . . . .
Manual Changes by ROM Version . . . . . . . . . .
.
.
.
.
.
.
.
.
.
.
.
.
.
.
.
.
.
.
.
.
.
.
.
.
.
.
.
.
.
.
.
.
.
.
.
.
.
.
.
.
.
.
.
.
.
.
.
.
.
.
.
.
.
.
.
.
.
.
.
.
.
.
.
.
.
.
.
.
.
.
.
.
.
.
.
.
.
.
.
.
.
.
.
.
.
.
.
.
.
.
.
.
.
.
.
.
.
.
.
.
.
.
.
.
.
.
.
.
.
.
.
.
.
.
.
.
.
.
.
.
.
.
.
.
.
.
.
.
.
.
.
.
.
.
.
.
.
.
.
.
.
.
.
.
.
.
.
.
.
.
.
.
.
.
.
.
.
.
.
.
.
.
.
.
.
.
.
.
.
.
.
.
.
.
.
.
.
.
.
.
.
.
.
.
.
.
.
.
.
.
.
.
.
.
.
.
.
.
.
.
.
.
.
.
.
.
.
.
.
.
.
.
.
.
.
.
.
.
.
.
.
.
.
.
.
.
.
.
.
.
.
.
.
.
.
.
.
.
.
.
.
.
.
.
.
.
.
.
.
.
.
.
.
.
.
.
.
.
.
.
.
.
.
.
.
.
.
.
.
.
.
.
.
.
.
.
.
.
.
.
.
.
.
.
.
.
.
.
.
.
.
.
.
.
.
.
.
.
.
.
.
.
.
.
.
.
.
.
.
.
.
.
.
.
.
.
.
.
.
.
.
.
.
.
.
.
.
.
.
.
.
.
.
.
.
.
.
.
.
.
.
.
.
.
.
.
.
.
.
.
.
.
.
.
.
.
.
.
.
.
.
.
.
.
.
.
.
.
.
.
.
.
.
.
.
.
.
.
.
.
.
.
.
.
.
.
.
.
.
.
.
.
.
.
.
.
1-2
1-4
1-6
1-6
2-5
2-7
2-10
2-13
2-14
2-18
2-18
2-30
2-34
2-36
2-38
2-40
2-51
2-54
2-55
2-58
2-61
2-62
2-64
2-67
2-70
2-75
2-77
2-82
2-84
2-85
2-87
A-1
A-1
Contents-7
1
General Information
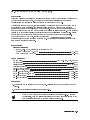
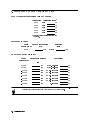
INTRODUCTION
This chapter provides an overview of the manual and 4396B Network/Spectrum/Impedance
Analyzer (analyzer) performance tests. In addition, this chapter describes the analyzer
calibration cycle, calculation sheets and performance test record, and test equipment required
in test procedures of this manual.
ABOUT THIS MANUAL
This manual contains the performance test procedures for the analyzer. These performance
tests are used to verify that the analyzer's performance meets its specications.
Manual Organization
This manual contains the following chapters:
Chapter 1. General Information
Chapter 1 describes this manual, the analyzer's performance tests, calculation sheet and
performance test record, and lists the test equipment required for the preventive maintenance
and the performance tests.
Chapter 2. Performance Tests
Chapter 2 provides all the performance test procedures.
Chapter 3. Calculation Sheet
Chapter 3 provides a calculation sheet for those performance tests that require additional
calculations to determine the nal test result.
Chapter 4. Performance Test Record
Chapter 4 provides a performance test record. The record sheets for all test results are
provided.
The manual also contains Appendix A, Manual Changes.
General Information
1-1
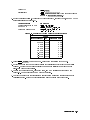
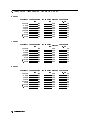
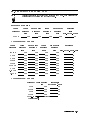
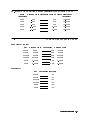
PERFORMANCE TESTS
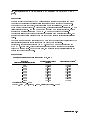
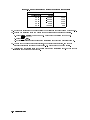
The analyzer's performance tests consist of the 24 tests listed in Table 1-1. These tests verify
that the analyzer's performance meets the guaranteed specications. See the Function
Reference for the specications.
The analyzer's performance is categorized into two groups; performance in the network
analyzer mode and performance in the spectrum analyzer mode. The third column in Table 1-1
indicates to which group the listed performance test belongs.
All tests can be performed without access to the interior of the instrument. The performance
tests can be used to perform incoming inspection, and to verify that the analyzer meets
performance specications after repair.
Test Number
1
2
3
4
5
6
7
8
9
10
11
12
13
14
15
16
17
18
19
10
21
22
23
24
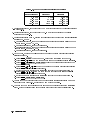
Table 1-1. Performance Tests
Test Name
Frequency Accuracy Test
Source Level Accuracy/Flatness Test
Non-sweep Linearity Test
Power Sweep Linearity Test
Harmonics/Non-harmonic Test
Receiver Noise Level Test
Input Crosstalk Test
Input Impedance Test
Absolute Amplitude Accuracy Test
Magnitude Ratio/Phase Dynamic Accuracy Test
Magnitude Ratio/Phase Frequency Response Test
Calibrator Amplitude Accuracy Test
Displayed Average Noise Level Test
Amplitude Fidelity Test
Input Attenuator Switching Uncertainty Test
Resolution Bandwidth Accuracy/Selectivity Test
Resolution Bandwidth Switching Uncertainty Test
IF Gain Switching Uncertainty Test
Noise Sidebands Test
Frequency Response Test
Second Harmonic Distortion Test
Third Order Intermodulation Distortion Test
Other Spurious Test
Residual Response Test
Category1
NA
NA
NA
NA
NA
NA
NA
NA
NA
NA
NA
SA
SA
SA
SA
SA
SA
SA
SA
SA
SA
SA
SA
SA
1 : NA: Network Analyzer Mode, SA: Spectrum Analyzer Mode
The test numbers in Table 1-1 are numbered according to the recommended sequence of
performing tests. When performing more than one performance test, perform them in the
order listed in Table 1-1. The rst test failed indicates the problem you should troubleshoot
rst.
If the performance tests indicate that the analyzer is not operating within the specied limits,
check the test setup. If the test setup is correct, see the Adjustments and Correction Constants
chapter or the Troubleshooting chapter in the 4396B Service Manual for corrective action.
1-2
General Information
Note
Allow the analyzer to warm up for at least 30 minutes before you execute any
of the performance tests.
Perform all performance tests in an ambient temperature of 23 6 5 C.
CALIBRATION CYCLE
The analyzer requires periodic performance verication to remain in calibration. The frequency
of performance verication depends on the operating and environmental conditions under
which the analyzer is used. Verify the analyzer's performance at least once a year using the
performance tests contained in this manual.
CALCULATION SHEET AND PERFORMANCE TEST RECORD
The Calculation Sheet and Performance Test Record tables are provided in Chapter 3 and
Chapter 4.
Calculation Sheet
Use the calculation sheet as an aid for recording raw measurement data and calculating the
performance test results. Calculation sheet entries are provided only for performance tests in
which calculations are required to obtain the test results.
Performance Test Record
The performance test record lists all test points, acceptable test limits, and measurement
uncertainties (if applicable). The measurement uncertainty shows how accurately the
analyzer's specications are measured and depends on the test equipment used. The listed
measurement uncertainties are valid only when the recommended equipment is used.
How to Use
The following procedure is recommended when using the calculation sheet and the
performance test record:
1. Make extra copies of the calculation sheet and the performance test record.
2. Follow the performance test procedure and record the measured data in the specied
column in the calculation sheet. For tests where no calculation sheet entry spaces are
provided, record the measured values directly in the performance test record.
3. Calculate the test result using the appropriate equation given in the calculation sheet.
Record the test results in the TEST RESULT column in the calculation sheet.
4. When appropriate, copy the test results from the calculation sheet to the performance test
record.
5. Keep the performance test record for tracking gradual changes in test results over long
periods of time.
General Information
1-3
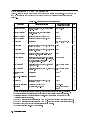
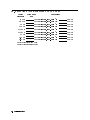
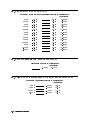
RECOMMENDED TEST EQUIPMENT
Table 1-2 lists the equipment required for performance testing the analyzer. Other equipment
may be substituted if the equipment meets or exceeds the critical specications given in
Table 1-2.
Table 1-2. Recommended Test Equipment
Equipment
Frequency Counter
Frequency Standard2
Critical Specications
Recommended Model/
Agilent Part Number
Frequency Range: 1 GHz, Time Base Error:
61.921007 /year
Frequency: 10 MHz, Time Base Error:
61210010 /year
Qty
5343A Opt. 0011
1
5061B
1
Spectrum Analyzer
Frequency Range: 100 kHz to 4 GHz
8566A/B
1
Network Analyzer
Frequency Range: 300 kHz to 1.8 GHz
8753A/B/C
1
Power Meter
No substitute
436A Opt. 022, 437B, or
438A
1
Power Sensor
Frequency Range : 20 MHz to 1.8 GHz, Power:
020 dBm to +5 dBm
8482A
1
Power Sensor
Frequency Range : 50 MHz to 1.8 GHz, Power:
060 dBm to 020 dBm
8481D
1
Function Genarator
Frequency Range : 10 Hz to 10 kHz, Level
Accuracy: 60.2 dB, Return loss: > 20 dB
3325A
1
Signal Generator
Frequency Range : 100 kHz to 1.82 GHz, SSB
Phase Noise at 1 kHz oset: < 0110 dBc/Hz,
SSB Phase Noise at 10 kHz oset: < 0119
dBc/Hz, Harmonics: < 030 dBc
8663A or 8642B
2
Attenuation Range : 0 dB to 70 dB, Step: 10
dB, VSWR: 1.02
8496A/G Option 001 and
H604
1
Attenuation Range: 0 dB to 10 dB, Step: 1 dB,
VSWR: 1.02
8494A/G Option 001 and
H605
1
Step Attenuator3
Step Attenuator3
Attenuator/Switch
Driver
No substitute
11713A 6
1
50
Type-N Calibration
Kit
No substitute
85032B
1
T/R Test Set
Frequency Range: 300 kHz to 1.8 GHz,
Directivity: 40 dB
85044A
1
50 MHz Low Pass Filter
Rejection at 75 MHz:
PN 0955-0306
1
Termination
50
termination, type-N(m)
909C Opt 012 or part of
85032B 7
3
60 dB
1 Option 001 (optional time base) is not required, when a frequency standard in Table 1-2 is available.
2 Required for testing an analyzer equipped with Option 1D5 (High Stability Frequency Reference).
3 Calibration values at 50 MHz are required in the tests. See the
Calibration Data Required for Step
later in this chapter.
4 An 8496A/G step attenuator with required low VSWR ( 1.02) can be purchased by specifying option H60.
5 An 8494A/G step attenuator with required low VSWR ( 1.02) can be purchased by specifying option H60.
6 Required when an 8494G or 8496G step attenuator is used in the tests.
7 The 85032B includes a type-N(m) 50 termination.
Attenuators
1-4
General Information
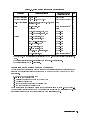
Table 1-2. Recommended Test Equipment (continued)
Equipment
Critical Specications
6 dB Fixed Attenuation
50 , N(m)-N(f)
6 dB Fixed Attenuation
50 , N(m)-N(f), VSWR 1.015
Adapters
8491A Opt 006
8491A Opt 006 & Opt H601
Qty
2
2
11667A
1
N(m)-N(m) cable, 50 11500B or part of 11851B 2
4
RF cable kit
11851B
1
BNC(m)-BNC(m) cable, 61 cm, 50 PN 8120-1839
1
BNC(m)-BNC(m) cable, 122 cm, 50 PN 8120-1840
2
BNC(f)-BNC(f) adapter, 50 PN 1250-0080
1
BNC(f)-SMA(f) adapter, 50 PN 1250-0562
1
Tee BNC(m)-(f)-(f) adapter, 50 PN 1250-0781
1
N(m)-N(m) adapter, 50 PN 1250-1475
1
N(m)-BNC(f) adapter, 50 PN 1250-1476
1
N(f)-BNC(m) adapter, 50 PN 1250-1477
1
APC 3.5(m)-APC 3.5(f) adapter, 50 PN 1250-1866
1
Two-way Power Splitter Frequency Range: 100 kHz to 1.8 GHz, Output
Tracking: 0.15 dB
Cables
Recommended Model/
Agilent Part Number
APC 7-N(f) adapter, 50 11524A or part of 85032B 3
1
1 An 8491A Opt. 006 xed attenuator with required low VSWR ( 1.015) can be purchased by specifying Opt.
H60.
2 The 11851B includes three N(m)-N(m) cables of 61 cm and a N(m)-N(m) cable of 88 cm.
3 The 85032B includes two APC 7-N(f) adapters.
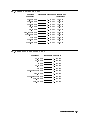
Calibration Data Required for Step Attenuator
The six performance tests listed below measure the analyzer's performance against a known
standard (the attenuation values at a frequency 50 MHz of the 8496A/G and 8494A/G step
attenuators).
3. Non-Sweep Power Linearity Test
4. Power Sweep Linearity Test
10. Magnitude Ratio/Phase Dynamic Accuracy Test
14. Amplitude Fidelity Test
15. Input Attenuator Switching Uncertainty Test
18. IF Gain Switching Uncertainty Test
These tests require the calibrated values of the attenuators listed in Table 1-3 and Table 1-4.
The attenuation values (referenced to 0 dB setting) are required in the calculation sheet. The
attenuation values used in the tests are listed in each calculation sheet.
General Information
1-5
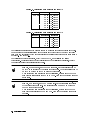
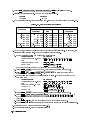
Table 1-3. Calibration Data Required for 8496A/G
Frequency Attenuation Uncertainty
50 MHz
10 dB 0.0060 dB
20 dB 0.0060 dB
30 dB 0.0066 dB
40 dB 0.0090 dB
50 dB 0.0165 dB
60 dB 0.0197 dB
70 dB 0.0272 dB
Table 1-4. Calibration Data Required for 8494A/G
Frequency Attenuation Uncertainty
50 MHz
2 dB 0.007 dB
4 dB 0.007 dB
6 dB 0.007 dB
8 dB 0.007 dB
10 dB 0.007 dB
The calibration uncertainty is the primary source of measurement error in performance tests.
The measurement uncertainties listed in the performance test record of Chapter 4 are valid
only when the uncertainty of the step attenuation data satises that given in the third column
of Table 1-3 and Table 1-4.
The calibration of step attenuators, 8496A/G and 8494A/G, are available at Agilent
Technologies. For information about the calibration and the available uncertainties, contact
your nearest Agilent Technologies service center.
Note
The 8496G programmable step attenuator has four attenuation segments, 10 dB
segment, 20 dB segment, and two 40 dB segments. Each attenuation from 10
dB to 70 dB is obtained by combining these segments. The attenuations from 40
dB to 70 dB depend on the 40 dB segment that is used.
When setting the step attenuator for the calibration, specify one of the 40 dB
segments for attenuations from 40 dB to 70 dB. Then use the specied segment
in the tests.
Note
The 8494G programmable step attenuator has four attenuation segments, 1 dB
segment, 2 dB segment, and two 4 dB segments. Each attenuation is obtained
by combining these segments. The attenuations of 4 dB and 6 dB depend on
the 4 dB segment that is used.
When setting the step attenuator for the calibration, specify one of the 4 dB
segment for attenuations of 4 dB and 6 dB. Then use the specied segment in
the tests.
1-6
General Information
2
Performance Tests
INTRODUCTION
This chapter contains the performance test procedures. The test procedures listed in Table 1-1
are described sequentially in the following pages.
The test name indicates the tested performance and to which performance group the tested
performance belongs to. NA indicates the performance test belongs to the network analyzer
mode performance group. SA indicates the performance test belongs to the spectrum analyzer
mode performance group.
Each procedure consists of the following parts:
Description:
describes the test procedure.
Specication:
describes the performance veried in the test.
Test Equipment:
describes test equipment required in the test.
Procedure:
describes the test procedure step by step.
Note
Allow the analyzer to warm up for at least 30 minutes before you execute any
of the performance tests.
Perform all performance tests in an ambient temperature of 23 6 5 C.
Note
Before performing any tests, make extra copies of the calculation sheet in
Chapter 3 and the performance test record in Chapter 4. These are required
in the test procedure. For an explanation of how to use these records, see the
CALCULATION SHEET AND PERFORMANCE TEST RECORD in Chapter 1.
Performance Tests
2-1
1. FREQUENCY ACCURACY TEST (NA)
Description
This test uses a frequency counter to measure the actual frequency of the 4396B RF OUT signal
when it is tuned to 1 GHz. This test checks the frequency accuracy of the internal frequency
reference (or the high stability frequency reference for Option 1D5).
Specication
Frequency reference accuracy
@2365 C, referenced to 23 C : : : : : : : : : : : : : : : : : : : : : : : : : : : : : : : : : : : : : : : : : : : : : : : <65.5 ppm/year
Precision frequency reference accuracy (option 1D5)
@0 C to 55 C, referenced to 23 C : : : : : : : : : : : : : : : : : : : : : : : : : : : : : : : : : : : : : : : : : :<60.13 ppm/year
Test Equipment
For testing a standard 4396B (not equipped with Opt. 1D5)
Frequency Counter : : : : : : : : : : : : : : : : : : : : : : : : : : : : : : : : : : : : : : : : : : : : : : : : : : : : : : : : : : 5343A Opt. 0011
BNC(m)-BNC(m) cable, 61 cm : : : : : : : : : : : : : : : : : : : : : : : : : : : : : : : : : : : : : : : : : : : : : : : : : : : PN 8120-1839
APC 3.5(m)-APC 3.5(f) adapter2 : : : : : : : : : : : : : : : : : : : : : : : : : : : : : : : : : : : : : : : : : : : : : : : : PN 1250-1866
N(m)-BNC(f) adapter : : : : : : : : : : : : : : : : : : : : : : : : : : : : : : : : : : : : : : : : : : : : : : : : : : : : : : : : : : : : PN 1250-1476
BNC(f)-SMA(f) adapter : : : : : : : : : : : : : : : : : : : : : : : : : : : : : : : : : : : : : : : : : : : : : : : : : : : : : : : : : : PN 1250-0562
For testing an 4396B equipped with Opt. 1D5
Frequency Counter : : : : : : : : : : : : : : : : : : : : : : : : : : : : : : : : : : : : : : : : : : : : : : : : : : : : : : : : : : : : : : : : : : : : : 5343A
Frequency Standard : : : : : : : : : : : : : : : : : : : : : : : : : : : : : : : : : : : : : : : : : : : : : : : : : : : : : : : : : : : : : : : : : : : 5061B 3
BNC(m)-BNC(m) cable, 61 cm : : : : : : : : : : : : : : : : : : : : : : : : : : : : : : : : : : : : : : : : : : : : : : : : : : : PN 8120-1839
BNC(m)-BNC(m) cable, 122 cm : : : : : : : : : : : : : : : : : : : : : : : : : : : : : : : : : : : : : : : : : : : : : : : : : PN 8120-1840
APC 3.5(m)-APC 3.5(f) adapter2 : : : : : : : : : : : : : : : : : : : : : : : : : : : : : : : : : : : : : : : : : : : : : : : : PN 1250-1866
BNC(f)-SMA(f) adapter : : : : : : : : : : : : : : : : : : : : : : : : : : : : : : : : : : : : : : : : : : : : : : : : : : : : : : : : : : PN 1250-0562
1: Option 001 Time Base is not required, when any 10 MHz frequency standard with time base error < 61.9 x
1007 /year is available as an external frequency reference for the frequency counter.
2: This adapter is used to protect the 5343A's APC 3.5(m) input connector, sometimes called \connector saver." In
the test setup, the BNC(m)-SMA(f) adapter is connected to the 5343A's APC 3.5(m) input connector through this
adapter. For more information on microwave connectors and connector care, see MICROWAVE CONNECTOR
CARE (PN 08510-90064).
3: The 5061B can be replaced with any 10 MHz frequency standard with time base error of < 6 1 x 10010 /year.
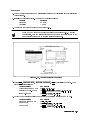
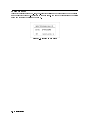
Procedure
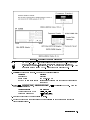
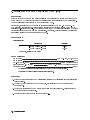
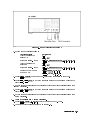
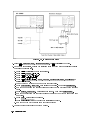
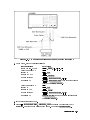
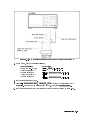
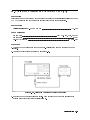
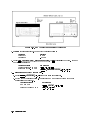
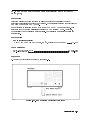
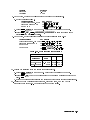
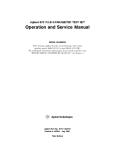
1. Connect the test equipment as shown in Figure 2-1.
For testing a standard 4396B (not equipped with Option 1D5), do not connect any cable to
the EXT REF input connector in the 4396B rear panel.
For testing an 4396B equipped with Option 1D5, connect a BNC(m)-BNC(m) cable between
the EXT REF input connector and the REF OVEN connector on the 4396B rear panel.
Then connect the frequency standard's 10 MHz connector to the frequency counter's EXT
FREQ STD connector as shown in Figure 2-1.
2-2
Performance Tests
Note
Figure 2-1. Frequency Accuracy Test Setup
An APC 3.5(m)-APC 3.5(f) adapter is used between the BNC(f)-SMA(f) adapter
and the 5343A's APC 3.5(m) input connector to protect the 5343A's APC
3.5(m) input connector. In Figure 2-1, the SMA connector of the BNC(f)-SMA(f)
adapter is mated with the APC 3.5 connector of the dierent type.
2. Initialize the frequency counter. Then set the controls as follows:
Controls
Sample Rate
Range Switch
INT/EXT Switch (rear panel)
Settings
Midrange
500 MHz-26.5 MHz
Internal or External (when the frequency standard is
connected)
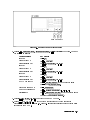
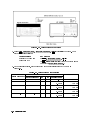
3. Press 4Meas5, ANALYZER TYPE , NETWORK ANALYZER , 4Preset5 to initialize the 4396B. Then set
the controls as follows:
NNNNNNNNNNNNNNNNNNNNNNNNNNNNNNNNNNNNNNNNN
Control Settings
NNNNNNNNNNNNNNNNNNNNNNNNNNNNNNNNNNNNNNNNNNNNNNNNNN
Center Frequency: 1 GHz
Frequency Span: ZERO
Key Strokes
Center5, 415, 4G/n5
4Span5, ZERO SPAN
4
NNNNNNNNNNNNNNNNNNNNNNNNNNNNN
4. Wait for the frequency counter reading to settle.
5. Record the frequency counter reading to 1 Hz resolution in the performance test record
(\Test Result" column).
Performance Tests
2-3
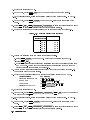
2. SOURCE LEVEL ACCURACY/FLATNESS TEST (NA)
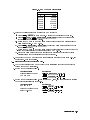
Description
This test uses a power meter and a power sensor to measure the actual power level of the RF
OUT signal at several frequencies from 100 kHz to 1.8 GHz when the signal amplitude is set to
0 dBm. The level accuracy is checked at a frequency 50 MHz. The level atness is calculated
as power deviation from the power reading taken at 50 MHz.
Specication
Level accuracy
@2365 C, 50 MHz, 0 dBm output : : : : : : : : : : : : : : : : : : : : : : : : : : : : : : : : : : : : : : : : : : : : : : : : : : <60.5 dB
Flatness
@2365 C, relative to 50 MHz, 0 dBm output : : : : : : : : : : : : : : : : : : : : : : : : : : : : : : : : : : : : : : : : 61.0 dB
Test Equipment
Power Meter : : : : : : : : : : : : : : : : : : : : : : : : : : : : : : : : : : : : : : : : : : : : : : : : : : : : : 436A Opt. 022, 437B, or 438A
Power Sensor : : : : : : : : : : : : : : : : : : : : : : : : : : : : : : : : : : : : : : : : : : : : : : : : : : : : : : : : : : : : : : : : : : : : : : : : : : : : : : 8482A
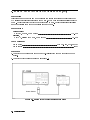
Procedure
1. Connect the power sensor to the power meter. Calibrate the power meter for the power
sensor.
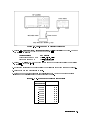
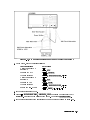
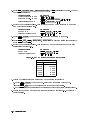
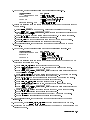
2. Connect the test equipment as shown in Figure 2-2.
Figure 2-2. Source Level Accuracy/Flatness Test Setup
2-4
Performance Tests
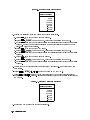
3. Press 4Meas5, ANALYZER TYPE , NETWORK ANALYZER , 4Preset5 to initialize the 4396B. Then set
the controls as follows:
NNNNNNNNNNNNNNNNNNNNNNNNNNNNNNNNNNNNNNNNN
Control Settings
NNNNNNNNNNNNNNNNNNNNNNNNNNNNNNNNNNNNNNNNNNNNNNNNNN
Center Frequency: 50 MHz
Frequency Span: 0 Hz
IF BW: 1 kHz
Key Strokes
Center5, 455, 405. 4M/5
4Span5, ZERO SPAN
4Bw/Avg5, IF BW , 415, 4k/m5
4
NNNNNNNNNNNNNNNNNNNNNNNNNNNNNNNNNNN
NNNNNNNNNNNNNNNNN
The source power now is set to 0 dBm (preset value).
4.
Source Level Accuracy Test
a. Wait for the power meter reading to settle.
b. Record the power meter reading in the performance test record (\Test Result" column for
the level accuracy test).
5.
Source Level Flatness Test
a. Record the test result of the level accuracy test in the calculation sheet (\Power Meter
Reading [ref]" column for the level atness test).
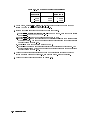
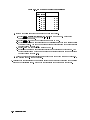
b. Press 4Center5, 415, 405, 405, 4k/m5 to change the 4396B center frequency to the rst atness
test frequency 100 kHz listed in Table 2-1. Table 2-1 lists atness test frequencies.
Table 2-1. Source Level Flatness Test Settings
4396B
Center Frequency
100 kHz
1 MHz
10 MHz
100 MHz
400 MHz
700 MHz
1 GHz
1.3 GHz
1.6 GHz
1.8 GHz
c. Wait for the power meter reading to settle. Then record the reading in the calculation
sheet (\Power Meter Reading" column).
d. Change the 4396B center frequency in accordance with Table 2-1 and repeat step 5-c for
each frequency.
e. Calculate test results using the equation given in the calculation sheet. Record the test
results in the performance test record.
Performance Tests
2-5
3. NON-SWEEP POWER LINEARITY TEST (NA)
Description
This test uses a power meter and a high sensitivity power sensor to measure the actual power
of the 4396B RF OUT signal at several power settings and then calculates the power linearity.
The power linearity is referenced to a power level of 0 dBm.
In this test, the input power to the power sensor is maintained between 060 dBm and 030
dBm using the step attenuator. This reduces measurement uncertainty caused by the power
sensor's non-linearity and noise. The actual power of the RF OUT signal is calculated by adding
the attenuation used and the power meter reading. Therefore, this test requires the calibrated
attenuation values of the step attenuator at 50 MHz.
Specication
Level linearity
Output Power
020 dBm power +20 dBm
040 dBm power < 020 dBm
060 dBm power < 040 dBm
Linearity1
60.7 dB
61.0 dB
61.5 dB
1 : @2365 C, relative to 0 dBm output
Test Equipment
Power Meter : : : : : : : : : : : : : : : : : : : : : : : : : : : : : : : : : : : : : : : : : : : : : : : : : : : : : 436A Opt. 022, 437B, or 438A
Power Sensor : : : : : : : : : : : : : : : : : : : : : : : : : : : : : : : : : : : : : : : : : : : : : : : : : : : : : : : : : : : : : : : : : : : : : : : : : : : : : : 8481D
N(m)-N(m) cable, 61 cm : : : : : : : : : : : : : : : : : : : : : : : : : : : : : : : : : : : : : : : : : : : : : : : 11500B or part of 11851B
Step Attenuator1 , 10 dB Step : : : : : : : : : : : : : : : : : : : : , VSWR 1.02 8496A/G Option 001 and H60
Attenuator driver2 : : : : : : : : : : : : : : : : : : : : : : : : : : : : : : : : : : : : : : : : : : : : : : : : : : : : : : : : : : : : : : : : : : : : : : : 11713A
1: Calibration values for attenuation settings of 10 dB to 50 dB at 50 MHz are required.
2: Required when using a programmable step attenuator 8496G.
Procedure
1. Record the step attenuator 50 MHz calibration values in the calculation sheet (\Calibration
Value" column).
2. Connect the power sensor to the power meter, and calibrate the power meter for the
power sensor.
3. Set the step attenuator to 50 dB before connecting the test equipment. This protects the
power sensor from excess input.
4. Connect the test equipment as shown in Figure 2-3.
2-6
Performance Tests
Figure 2-3. Non-sweep Power Linearity Test Setup
5. Press 4Meas5, ANALYZER TYPE , NETWORK ANALYZER , 4Preset5 to initialize the 4396B. Then set
the controls as follows:
NNNNNNNNNNNNNNNNNNNNNNNNNNNNNNNNNNNNNNNNN
Control Settings
NNNNNNNNNNNNNNNNNNNNNNNNNNNNNNNNNNNNNNNNNNNNNNNNNN
Center Frequency: 50 MHz
Frequency Span: 0 Hz
Key Strokes
Center5, 455, 405, 4M/5
Span5, ZERO SPAN
4
4
NNNNNNNNNNNNNNNNNNNNNNNNNNNNN
6. Press 4Source5, POWER , 405, 4x15 to set the source power to the rst test setting (0 dBm) listed
in Table 2-2.
7. Set the step attenuator to the rst setting (30 dB) listed in the second column of Table 2-2.
8. Wait for the power meter reading to settle.
9. Record the power meter reading in the calculation sheet. Use \Power Meter Reading"
column of the calculation sheet for the reference (0 dBm).
NNNNNNNNNNNNNNNNN
Table 2-2. Non-Sweep Power Linearity Test Settings
4396B
Step Attenuator
Source Power
0 dBm
+20 dBm
+10 dBm
010 dBm
020 dBm
030 dBm
040 dBm
050 dBm
060 dBm
30 dB
50 dB
40 dB
20 dB
10 dB
10 dB
10 dB
10 dB
0 dB
Performance Tests
2-7
10. Change the source power setting and the step attenuator setting in accordance with
Table 2-2. Record the power meter reading in the calculation sheet. Use \Power Meter
Reading" column of the calculation sheet for the non-sweep power linearity test.
11. Calculate the test results using the equations given in the calculation sheet. Record the test
results in the performance test record.
2-8
Performance Tests
4. POWER SWEEP LINEARITY TEST (NA)
Description
This test sets the 4396B to the power sweep mode and then makes a power sweep from 010
dBm to +20 dBm in 5 dB steps. Using a power meter and a high sensitivity power sensor, the
actual power of the 4396B RF OUT signal at each sweep point is measured. Then the power
sweep linearity for a sweep span +20 dB is calculated. The power linearity is specied as
values relative to the stop power. Therefore, the power linearity for stop powers from 05 dBm
to 20 dBm is calculated using each measured power as a stop power.
This test uses a step attenuator to maintain the power sensor input level 030 dBm. This
reduces the measurement uncertainty caused by the power sensor's linearity error. The actual
power of the RF OUT signal is calculated by adding the attenuation used and the power meter
reading. Therefore, this test requires the calibrated attenuation values of the step attenuator at
50 MHz.
Specication
Sweep range : : : : : : : : : : : : : : : : : : : : : : : : : : : : : : : : : : : : : : : : : : : : : : : : : : : : : : : : : : : : : : : : : : : : : : : : : : : : : : 20 dB
Sweep linearity
@2365 C, 50 MHz, relative to stop power : : : : : : : : : : : : : : : : : : : : : : : : : : : : : : : : : : : : : : : : : : : 60.5 dB
Test Equipment
Power Meter : : : : : : : : : : : : : : : : : : : : : : : : : : : : : : : : : : : : : : : : : : : : : : : : : : : : : 436A Opt. 022, 437B, or 438A
Power Sensor : : : : : : : : : : : : : : : : : : : : : : : : : : : : : : : : : : : : : : : : : : : : : : : : : : : : : : : : : : : : : : : : : : : : : : : : : : : : : : 8481D
Step Attenuator1, 10 dB Step , VSWR 1.02 : : : : : : : : : : : : : : : : : : : : 8496A/G Option 001 and H60
Attenuator driver2 : : : : : : : : : : : : : : : : : : : : : : : : : : : : : : : : : : : : : : : : : : : : : : : : : : : : : : : : : : : : : : : : : : : : : : : 11713A
N(m)-N(m) cable, 61 cm : : : : : : : : : : : : : : : : : : : : : : : : : : : : : : : : : : : : : : : : : : : : : : : 11500B or part of 11851B
1: Calibration values for attenuation settings of 40 dB and 50 dB at 50 MHz are required.
2: Required when using a programmable step attenuator 8496G.
Procedure
1. Record the step attenuator 50 MHz calibration values in the calculation sheet (\Calibration
Value" column).
2. Connect the power sensor to the power meter. Then calibrate the power meter for the
power sensor.
3. Set the step attenuator to 40 dB before connecting the test equipment. This protects the
power sensor from excess input.
4. Connect the test equipment as shown in Figure 2-4.
Performance Tests
2-9
Figure 2-4. Power Sweep Linearity Test Setup
5. Press 4Meas5, ANALYZER TYPE , NETWORK ANALYZER , 4Preset5 to initialize the 4396B. Then set
the controls as follows:
NNNNNNNNNNNNNNNNNNNNNNNNNNNNNNNNNNNNNNNNN
Control Settings
NNNNNNNNNNNNNNNNNNNNNNNNNNNNNNNNNNNNNNNNNNNNNNNNNN
Sweep Type: POWER SWEEP
CW Frequency: 50 MHz
Start Power: 010 dBm
Stop Power: +20 dBm
Number of Points: 7
Manual Trigger
Trigger Event: ON POINT
Key Strokes
Sweep5, SWEEP TYPE MENU , POWER SWEEP
4Source5, CW FREQ , 455, 405, 4M/5
4Start5, 4-5, 415, 405, 4x15
4Stop5, 425, 405, 4x15
4Sweep5, NUMBER of POINTS , 475, 4x15
4Trigger5, TRIGGER: [FREE RUN] , MANUAL
4Trigger5, TRIGGER:[MANUAL] ,
4
NNNNNNNNNNNNNNNNNNNNNNNNNNNNNNNNNNNNNNNNNNNNNNN
NNNNNNNNNNNNNNNNNNNNNNNNNNNNNNNNNNN
NNNNNNNNNNNNNNNNNNNNNNN
NNNNNNNNNNNNNNNNNNNNNNNNNNNNNNNNNNNNNNNNNNNNNNNNNN
NNNNNNNNNNNNNNNNNNNNNNNNNNNNNNNNNNNNNNNNNNNNNNNNNNNNNNNNNNN
NNNNNNNNNNNNNNNNNNNN
NNNNNNNNNNNNNNNNNNNNNNNNNNNNNNNNNNNNNNNNNNNNNNNNNN
NNNNNNNNNNNNNNNNNNNNNNNNNNNNNNNNNNNNNNNNNNNNNNNNNNNNNNNNNNNNNNNNN
TRIG EVENT [ON SWEEP] (Then the
softkey label changes to TRIG EVENT [ON POINT] )
NNNNNNNNNNNNNNNNNNNNNNNNNNNNNNNNNNNNNNNNNNNNNNNNNNNNNNNNNNNNNNNNN
6. Press 4Trigger5, SINGLE , TRIGGER:[MANUAL] to start a power sweep and to set the 4396B
power to the rst sweep point of 010 dBm listed in Table 2-3. Table 2-3 lists test settings.
Verify that the step attenuator is set to 40 dB.
NNNNNNNNNNNNNNNNNNNN
NNNNNNNNNNNNNNNNNNNNNNNNNNNNNNNNNNNNNNNNNNNNNNNNNN
Table 2-3. Power Sweep Linearity Test Settings
4396B
Step Attenuator
Source Power
010 dBm
40 dB
05 dBm
40 dB
0 dBm
+5 dBm
+10 dBm
+15 dBm
+20 dBm
2-10
Performance Tests
40 dB
40 dB
40 dB
50 dB
50 dB
7. Wait for the power meter reading to settle.
8. Record the power meter reading in the calculation sheet (\Power Meter Reading" column).
9. Repeat the following steps until a power sweep completed.
a. Press MANUAL to set the source power to the next measurement point listed in Table 2-3.
The sweep indicator moves to the last measurement point on the sweep. (The sweep
indicator indicates the last measurement point on the sweep, not the current point.)
b. Change the step attenuator setting to the next setting in the second column of Table 2-3.
c. Wait for the power meter reading to settle.
d. Record the power meter reading in the calculation sheet.
10. Calculate the test results using the equation given in the calculation sheet. Record the test
results in the performance test record.
NNNNNNNNNNNNNNNNNNNN
Performance Tests
2-11
5. HARMONICS/NON-HARMONIC SPURIOUS TEST (NA)
Description
This test sets the 4396B RF OUT signal power to +15 dBm and uses a spectrum analyzer
to measure the RF OUT signal's second harmonic and non-harmonic spurious at several
frequencies. The RF OUT signal frequency is set to values where harmonics and non-harmonic
spurious are most likely to be observed.
Specication
Spectral Purity Characteristics
Harmonics
@+15 dBm output : : : : : : : : : : : : : : : : : : : : : : : : : : : : : : : : : : : : : : : : : : : : : : : : : : : : : : : : : : : : : : : <030 dBc
Non-harmonics spurious
@+15 dBm output : : : : : : : : : : : : : : : : : : : : : : : : : : : : : : : : : : : : : : : : : : : : : : : : : : : : : : : : : : : : : : : <030 dBc
Test Equipment
Spectrum Analyzer : : : : : : : : : : : : : : : : : : : : : : : : : : : : : : : : : : : : : : : : : : : : : : : : : : : : : : : : : : : : : : : : : : : : : : 8566A/B
N(m)-N(m) cable, 61 cm : : : : : : : : : : : : : : : : : : : : : : : : : : : : : : : : : : : : : : : : : : : : : : : 11500B or part of 11851B
BNC(m)-BNC(m) cable, 122 cm : : : : : : : : : : : : : : : : : : : : : : : : : : : : : : : : : : : : : : : : : : : : : : : : : : : : PN 8120-1840
Procedure
1. Connect the test equipment as shown in Figure 2-5.
Note
2-12
Figure 2-5. Harmonics Test Setup
Connect the spectrum analyzer's 10 MHz frequency reference output to the
4396B EXT REF Input on the rear panel as shown in Figure 2-5. With this
conguration, both the spectrum analyzer and the 4396B are phase locked to
the same reference frequency to eliminate frequency oset errors.
Performance Tests
2. Initialize the spectrum analyzer. When an 8566B is used, perform the FREQ ZERO
calibration in accordance with the spectrum analyzer manual.
3. On the spectrum analyzer, set the controls as follows:
Controls
Settings
Frequency Span
100 kHz
Reference Level
+20 dBm
Input Attenuator
50 dB
4. Press 4Meas5, ANALYZER TYPE , NETWORK ANALYZER , 4Preset5 to initialize the 4396B. Then set
the controls as follows:
NNNNNNNNNNNNNNNNNNNNNNNNNNNNNNNNNNNNNNNNN
Control Settings
NNNNNNNNNNNNNNNNNNNNNNNNNNNNNNNNNNNNNNNNNNNNNNNNNN
Frequency Span: 0 Hz
Source Power: +15 dBm
IF BW: 1 kHz
5.
Key Strokes
Span5, ZERO SPAN
4Source5, POWER , 415, 455, 4x15
4Bw/Avg5, IF BW , 415, 4k/m5
4
NNNNNNNNNNNNNNNNNNNNNNNNNNNNN
NNNNNNNNNNNNNNNNN
NNNNNNNNNNNNNNNNN
|Harmonics Test|
a. On the 4396B, press 4Center5, 415, 405, 405, 4k/m5 to set the center frequency to the rst
center frequency listed in the rst column of Table 2-4. Table 2-4 lists test frequencies.
Table 2-4. Harmonics Test Settings
4396B
Second Harmonic
Center Frequency
Frequency
100 kHz
500 MHz
1.8 GHz
200 kHz
1 GHz
3.6 GHz
b. On the spectrum analyzer, perform the following steps to measure the second harmonic
level of the rst test frequency 100 kHz.
i. Press 4CENTER FREQUENCY5, 415, 405, 405, 4kHz5 to set the center frequency to the same
value as the 4396B center frequency.
ii. Press 4SINGLE5 to make a sweep. Wait for the completion of the sweep.
iii. Press 4PEAK SEARCH5, 415 to move the marker to the peak of the fundamental signal
and to place the delta maker reference at the peak.
iv. Press 4CENTER FREQUENCY5, 425, 405, 405, 4kHz5 to change the center frequency to the
second harmonics frequency listed in the second column of Table 2-4.
v. Press 4SINGLE5 to make a sweep. Wait for the completion of the sweep.
vi. Press 4PEAK SEARCH5 to move the marker to the peak of the second harmonic.
vii. Record the delta marker reading in the performance test record (\Test Result"
column).
c. On the 4396B, press 4Center5, 455, 405, 405, 4M/5 to set the center frequency to the second
test frequency 500 MHz.
d. On the spectrum analyzer, perform the following steps to measure the second harmonic
level.
i. Press 4CENTER FREQUENCY5, 455, 405, 405, 4MHz5.
ii. Press 4SINGLE5 to make a sweep. Wait for the completion of the sweep.
iii. Press 4PEAK SEARCH5, 4NORMAL5, 415.
iv. Press 4CENTER FREQUENCY5, 415, 4GHz5.
v. Press 4SINGLE5 to make a sweep. Wait for the completion of the sweep.
Performance Tests
2-13
vi. Press 4PEAK SEARCH5.
vii. Record the delta marker reading in the performance test record (\Test Result"
column).
e. On the 4396B, press 4Center5, 415, 4.5, 485, 4G/n5 to set the center frequency to the third test
frequency 1.8 GHz.
f. On the spectrum analyzer, perform the following steps to measure the second harmonic
level.
i. Press 4CENTER FREQUENCY5, 415, 4.5, 485, 4GHz5.
ii. Press 4SINGLE5 to make a sweep. Wait for the completion of the sweep.
iii. Press 4PEAK SEARCH5, 4NORMAL5, 415.
iv. Press 4CENTER FREQUENCY5, 435, 4.5, 465, 4GHz5.
v. Press 4SINGLE5 to make a sweep. Wait for the completion of the sweep.
vi. Press 4PEAK SEARCH5.
vii. Record the delta marker reading in the performance test record (\Test Result"
column).
6.
|Non-Harmonic Spurious Test|
a. On the 4396B, press 4Center5, 455, 405, 405, 4M/5 to set the center frequency to the rst
center frequency 500 MHz listed in the rst column of Table 2-5. Table 2-5 lists test
frequencies.
Table 2-5. Non-Harmonic Spurious Test Settings
4396B
Non-Harmonic Spurious
Center Frequency
Frequency
500 MHz
1800 MHz
478.58 MHz
521.42 MHz
1558.58 MHz
258.58 MHz
1778.58 MHz
1821.42 MHz
2058.58 MHz
3858.58 MHz
b. On the spectrum analyzer, perform the following steps to measure the non-harmonic
spurious level of the rst test frequency 500 MHz.
i. Press 4CENTER FREQUENCY5, 455, 405, 405, 4MHz5 to set the center frequency to the same
value as the 4396B center frequency.
ii. Press 4SINGLE5 to make a sweep. Wait for the completion of the sweep.
iii. Press 4PEAK SEARCH5, 4NORMAL5, 415 to move the marker to the peak of the
fundamental signal and to place the delta maker reference at the peak.
iv. Press 4CENTER FREQUENCY5, 445, 475, 485, 4.5, 455, 485, 4MHz5 to change the center
frequency to the rst non-harmonics spurious frequency listed in the second column
of Table 2-5.
v. Press 4SINGLE5 to make a sweep. Wait for the completion of the sweep.
vi. Press 4PEAK SEARCH5 to move the marker to the peak of the non-harmonic spurious.
vii. Record the delta marker reading in the performance test record (\Test Result"
column).
viii. Press 4CENTER FREQUENCY5, 455, 425, 415, 4.5, 445, 425, 4MHz5 to change the center
frequency to the next non-harmonic spurious frequency.
ix. Press 4SINGLE5 to make a sweep. Wait for the completion of the sweep.
2-14
Performance Tests
x. Press 4PEAK SEARCH5.
xi. Record the delta marker reading in the performance test record (\Test Result"
column).
xii. Press 4CENTER FREQUENCY5, 415, 455, 455, 485, 4.5, 455, 485, 4MHz5 to change the center
frequency to the next non-harmonic spurious frequency.
xiii. Press 4SINGLE5 to make a sweep. Wait for the completion of the sweep.
xiv. Press 4PEAK SEARCH5.
xv. Record the delta marker reading in the performance test record (\Test Result"
column).
c. On the 4396B, press 4Center5, 415, 4.5, 485, 4G/n5 to set the center frequency to the second
center frequency 1.8 GHz in the rst column of Table 2-5.
d. On the spectrum analyzer, perform the following steps to measure the non-harmonic
spurious level of the test frequency 1.8 GHz.
i. Press 4CENTER FREQUENCY5, 415, 4.5, 485, 4G/n5.
ii. Press 4SINGLE5 to make a sweep. Wait for the completion of the sweep.
iii. Press 4PEAK SEARCH5, 4NORMAL5, 415.
iv. Press 4CENTER FREQUENCY5, 425, 455, 485, 4.5, 455, 485, 4MHz5.
v. Press 4SINGLE5 to make a sweep. Wait for the completion of the sweep.
vi. Press 4PEAK SEARCH5.
vii. Record the delta marker reading in the performance test record (\Test Result"
column).
viii. Press 4CENTER FREQUENCY5, 415, 475, 475, 485, 4.5, 455, 485, 4MHz5.
ix. Press 4SINGLE5 to make a sweep. Wait for the completion of the sweep.
x. Press 4PEAK SEARCH5.
xi. Record the delta marker reading in the performance test record (\Test Result"
column).
xii. Press 4CENTER FREQUENCY5, 415, 485, 425, 415, 4.5, 445, 425, 4MHz5.
xiii. Press 4SINGLE5 to make a sweep. Wait for the completion of the sweep.
xiv. Press 4PEAK SEARCH5.
xv. Record the delta marker reading in the performance test record (\Test Result"
column).
xvi. Press 4CENTER FREQUENCY5, 425, 405, 455, 485, 4.5, 455, 485, 4MHz5.
xvii. Press 4SINGLE5 to make a sweep. Wait for the completion of the sweep.
xviii. Press 4PEAK SEARCH5.
xix. Record the delta marker reading in the performance test record (\Test Result"
column).
xx. Press 4CENTER FREQUENCY5, 435, 485, 455, 485, 4.5, 455, 485, 4MHz5.
xxi. Press 4SINGLE5 to make a sweep. Wait for the completion of the sweep.
xxii. Press 4PEAK SEARCH5.
xxiii. Record the delta marker reading in the performance test record (\Test Result"
column).
Performance Tests
2-15
6. RECEIVER NOISE LEVEL TEST (NA)
Description
This test measures the 4396B receiver noise levels (noise oor) in the network analyzer mode
at IF BW 10 Hz and 40 kHz. This measures the noise level using the marker statistics function
(mean) when the inputs are terminated.
In this test, the noise level (trace mean value) is measured in linear format [Unit]. Then the
measured values are converted to log magnitude format [dBm]. This is done to avoid skewing
the data with the marker statistics function.
The receiver noise level at IF BW 10 Hz is measured using IF BW 1 kHz. The measured values
are converted (020 dB) to the value of the IF BW 10 Hz. The noise sources depend mainly on
the used signal path within the analyzer. The signal path for IF BW 1 kHz is the same as that
for the IF BW 10 Hz. A digital lter technique is used at both IF BW settings. Therefore, the
receiver noise level at 10 Hz can be calculated mathematically from the noise level at IF BW 1
kHz. The measurement using IF BW 1 kHz reduces the measurement time. The signal path for
IF BW 40 kHz is dierent from that for IF BW 3 kHz. Therefore, the receiver noise level at
IF BW 40 kHz is tested.
Specication
Noise level
Frequency
100 k freq. < 10 MHz
100 k freq. < 10 MHz
10 MHz freq.
10 MHz freq.
Input
R
A, B
R
A, B
Noise Level
@IFBW=10 Hz
<085 dBm
<0110 dBm
<[ 0100 + 3 ] dBm2
<[ 0125 + 3 ] dBm2
f
f
Noise Level
@IFBW=40 kHz1
<050 dBm
<075 dBm
<[ 065 + 3 ] dBm2
<[ 090 + 3 ] dBm2
f
f
1 : Frequency range at IFBW 40 kHz is from 1 MHz to 1.8 GHz.
2 : is measurement frequency (GHz).
f
Test Equipment
50
termination, type-N(m) (three required) : : : : : : : : : : : : : : : : : : 909C Opt 012 or part of 85032B
Procedure
1. Connect the test equipment as shown in Figure 2-6.
2-16
Performance Tests
Figure 2-6. Receiver Noise Level Test Setup
2. Press 4Meas5, ANALYZER TYPE , NETWORK ANALYZER , 4Preset5 to initialize the 4396B. Then set
the controls as follows:
NNNNNNNNNNNNNNNNNNNNNNNNNNNNNNNNNNNNNNNNN
Control Settings
Input: R
Format: LINEAR
Scale/Division: 1 mU
Input: A
Format: LINEAR
Scale/Division: 1 mU
Input: B
Format: LINEAR
Scale/Division: 1 mU
RF OUT Power: OFF
NNNNNNNNNNNNNNNNNNNNNNNNNNNNNNNNNNNNNNNNNNNNNNNNNN
Key Strokes
Meas5, R
4Format5, LIN MAG
4Scale Ref5, SCALE/DIV , 415, 4k/m5
4Meas5, A
4Format5, LIN MAG
4Scale Ref5, SCALE/DIV , 415, 4k/m5
4Meas5, B
4Format5, LIN MAG
4Scale Ref5, SCALE/DIV , 415, 4k/m5
4Source5, RF OUT ON off (Then the softkey label
4
NNNNN
NNNNNNNNNNNNNNNNNNNNNNN
NNNNNNNNNNNNNNNNNNNNNNNNNNNNN
NNNNN
NNNNNNNNNNNNNNNNNNNNNNN
NNNNNNNNNNNNNNNNNNNNNNNNNNNNN
NNNNN
NNNNNNNNNNNNNNNNNNNNNNN
NNNNNNNNNNNNNNNNNNNNNNNNNNNNN
NNNNNNNNNNNNNNNNNNNNNNNNNNNNNNNNNNNNNNNNN
NNNNNNNNNNNNNNNNNNNNNNNNNNNNNNNNNNNNNNNNN
Frequency Span: 0 Hz
Number of Points: 801
Statistics: ON
changes to RF OUT on OFF .)
4Span5, ZERO SPAN
4Sweep5, NUMBER of POINTS 485, 405, 415, 4x15
4Utility5, STATISTICS on OFF (Then the softkey label
changes to STATISTICS ON off .)
NNNNNNNNNNNNNNNNNNNNNNNNNNNNN
NNNNNNNNNNNNNNNNNNNNNNNNNNNNNNNNNNNNNNNNNNNNNNNNNN
NNNNNNNNNNNNNNNNNNNNNNNNNNNNNNNNNNNNNNNNNNNNNNNNNNNNN
NNNNNNNNNNNNNNNNNNNNNNNNNNNNNNNNNNNNNNNNNNNNNNNNNNNNN
3. Press 4Bw/Avg5, IF BW , 415, 4k/m5 to set the 4396B IF BW to 1 kHz.
NNNNNNNNNNNNNNNNN
4. Press 4Center5, 415, 405, 405, 4k/m5 to set the 4396B center frequency to the rst center
frequency 100 kHz listed in Table 2-6. Table 2-6 lists test frequencies for the receiver noise
level test at IF BW 10 Hz.
Performance Tests
2-17
Table 2-6. Receiver Noise Test Settings
4396B
Center Frequency
100 kHz
1 MHz
10 MHz
100 MHz
500 MHz
1.0 GHz
1.4 GHz
1.8 GHz
5. Perform the following steps to measure the receiver noise level.
a. Press 4Meas5, R to set the 4396B input to R input.
b. Press 4Trigger5, SINGLE to make a sweep. Wait for the completion of the sweep.
c. Record the 4396B trace mean value [Unit] in the calculation sheet (\Trace Mean [Unit]"
column). The trace mean value is displayed as a marker statistic (mean) in the upper
right-hand corner of the display.
d. Press 4Meas5, A to set the 4396B to A input.
e. Press 4Trigger5, SINGLE to make a sweep. Wait for the completion of the sweep.
f. Record the 4396B trace mean value [Unit] in the calculation sheet (\Trace Mean [Unit]"
column).
g. Press 4Meas5, B to set the 4396B input to B input.
h. Press 4Trigger5, SINGLE to make a sweep. Wait for the completion of the sweep.
i. Record the 4396B trace mean value [Unit] in the calculation sheet (\Trace Mean [Unit]"
column).
6. Change the 4396B center frequency in accordance with Table 2-6, and repeat step 5 for
each setting.
7. Press 4Bw/Avg5, IF BW , 445, 405, 4k/m5 to set the 4396B IF BW to 40 kHz.
NNNNN
NNNNNNNNNNNNNNNNNNNN
NNNNN
NNNNNNNNNNNNNNNNNNNN
NNNNN
NNNNNNNNNNNNNNNNNNNN
NNNNNNNNNNNNNNNNN
8. Press 4Center5, 415, 4M/5 to set the 4396B center frequency to the rst center frequency 1
MHz listed in Table 2-7. Table 2-7 lists test frequencies for the receiver noise level test at IF
BW 40 kHz.
Table 2-7. Receiver Noise Test Settings 2
4396B
Center Frequency
1 MHz
10 MHz
100 MHz
500 MHz
1.0 GHz
1.4 GHz
1.8 GHz
9. Repeat step 5 to measure the receiver noise level.
2-18
Performance Tests
10. Change the 4396B center frequency in accordance with Table 2-6, and repeat step 5 for
each setting.
11. Convert the unit of the test results from [Unit] to [dBm] using the equation given in the
calculation sheet. Record the test results [dBm] in the performance test record.
Performance Tests
2-19
7. INPUT CROSSTALK TEST (NA)
Description
This test measures the crosstalk (signal leakage interference) between two inputs of the 4396B
R, A, and B inputs when RF OUT signal is supplied to one input and the other is terminated.
Specication
Input crosstalk
@300 kHz
A to/from B : : : : : : : : : : : : : : : : : : : : : : : : : : : : : : : : : : : : : : : : : : : : : : : : : : : : : : : : : : : : : : : : : : : : : : <0100 dB
R to A, B : : : : : : : : : : : : : : : : : : : : : : : : : : : : : : : : : : : : : : : : : : : : : : : : : : : : : : : : : : : : : : : : : : : : : : : : : <0120 dB
A, B to R : : : : : : : : : : : : : : : : : : : : : : : : : : : : : : : : : : : : : : : : : : : : : : : : : : : : : : : : : : : : : : : : : : : : : : : : : : <080 dB
Test Equipment
N(m)-N(m) cable, 61 cm : : : : : : : : : : : : : : : : : : : : : : : : : : : : : : : : : : : : : : : : : : : : : : : 11500B or part of 11851B
50
termination, type-N(m) (two required) : : : : : : : : : : : : : : : : : : : : 909C Opt 012 or part of 85032B
Procedure
1. Press 4Meas5, ANALYZER TYPE , NETWORK ANALYZER , 4Preset5 to initialize the 4396B. Then set
the controls as follows:
NNNNNNNNNNNNNNNNNNNNNNNNNNNNNNNNNNNNNNNNN
NNNNNNNNNNNNNNNNNNNNNNNNNNNNNNNNNNNNNNNNNNNNNNNNNN
Control Settings
Dual Channel: ON
Key Strokes
Display5, DUAL CHAN on OFF (Then the softkey label
4
NNNNNNNNNNNNNNNNNNNNNNNNNNNNNNNNNNNNNNNNNNNNNNNNNN
NNNNNNNNNNNNNNNNNNNNNNNNNNNNNNNNNNNNNNNNNNNNNNNNNN
Start Frequency: 300 kHz
2.
changes to DUAL CHAN ON off .)
4Start5, 435, 405, 405, 4k/m5
|R into A Crosstalk and R into B Crosstalk|
a. Connect the test equipment as shown in Figure 2-7.
2-20
Performance Tests
Figure 2-7. Input Crosstalk Test Setup 1
b. Set the 4396B controls as follows:
Control Settings
Active Channel: CH 1
Input: A/R
Reference Value: 0100 dB
Active Channel: CH 2
Input: B/R
Reference Value: 0100 dB
Source Power: +20 dBm
IF BW: 10 Hz
Key Strokes
Ch 15
Meas5, A/R
4Scale Ref5, REFERENCE VALUE , 4-5, 415, 405, 405, 4x15
4Ch 25
4Meas5, B/R
4Scale Ref5, REFERENCE VALUE , 4-5, 415, 405, 405, 4x15
4Source5, POWER , 425, 405, 4x15
4Bw/Avg5, IF BW , 415, 405, 4x15
4
4
NNNNNNNNNNN
NNNNNNNNNNNNNNNNNNNNNNNNNNNNNNNNNNNNNNNNNNNNNNN
NNNNNNNNNNN
NNNNNNNNNNNNNNNNNNNNNNNNNNNNNNNNNNNNNNNNNNNNNNN
NNNNNNNNNNNNNNNNN
NNNNNNNNNNNNNNNNN
c. Press 4Trigger5, SINGLE to make a sweep. Wait for the completion of the sweep.
NNNNNNNNNNNNNNNNNNNN
d. Press 4Ch 15, 4Search5, MAX to move the channel 1 marker to the maximum point on the
trace (A/R).
e. Record the marker reading in the performance test record (\Test Result" column for R
into A crosstalk).
f. Press 4Ch 25, 4Search5, MAX to move the channel 2 marker to the maximum point on the
trace (B/R).
g. Record the marker reading in the performance test record (\Test Result" column for R
into B crosstalk).
NNNNNNNNNNN
NNNNNNNNNNN
3.
|A into R Crosstalk and A into B Crosstalk|
a. Press 4Source5, POWER , 4-5, 455, 4x15 to set the source power to 05 dBm.
NNNNNNNNNNNNNNNNN
b. Connect the test equipment as shown in Figure 2-8.
Performance Tests
2-21
Figure 2-8. Input Crosstalk Test Setup 2
c. Change the 4396B controls as follows:
Control Settings
Active Channel: CH 1
Input: A
Active Channel: CH 2
Input: A
IF BW: 1 kHz
Key Strokes
Ch 15
Meas5, A
4Ch 25
4Meas5, A
4Bw/Avg5, IF BW , 415, 4k/m5
4
4
NNNNN
NNNNN
NNNNNNNNNNNNNNNNN
d. Press 4Trigger5, SINGLE to make a sweep. Wait for the completion of the sweep.
NNNNNNNNNNNNNNNNNNNN
e. Set the 4396B controls as follows:
Control Settings
Key Strokes
Active Channel: CH 1
Data!Memory
4
Data Math: DATA0MEM
Reference Value: 0100 dB
Input: R
Active Channel: CH 2
Data!Memory
Data Math: DATA0MEM
Reference Value: 0100 dB
2-22
Performance Tests
Ch 15
4Display5, DATA!MEMORY (A beep indicates that the
NNNNNNNNNNNNNNNNNNNNNNNNNNNNNNNNNNNNN
trace is stored.)
4Display5, DATA MATH [DATA] , DATA0MEM
4Scale Ref5, REFERENCE VALUE , 4-5, 415, 405, 405, 4x15
4Meas5, R
NNNNNNNNNNNNNNNNNNNNNNNNNNNNNNNNNNNNNNNNNNNNNNNNNN
NNNNNNNNNNNNNNNNNNNNNNNNNNN
NNNNNNNNNNNNNNNNNNNNNNNNNNNNNNNNNNNNNNNNNNNNNNN
NNNNN
Ch 25
4Display5, DATA!MEMORY (A beep indicates that the
4
NNNNNNNNNNNNNNNNNNNNNNNNNNNNNNNNNNNNN
trace is stored.)
4Display5, DATA MATH [DATA] , DATA0MEM
4Scale Ref5, REFERENCE VALUE , 4-5, 415, 405, 405, 4x15
NNNNNNNNNNNNNNNNNNNNNNNNNNNNNNNNNNNNNNNNNNNNNNNNNN
NNNNNNNNNNNNNNNNNNNNNNNNNNNNNNNNNNNNNNNNNNNNNNN
NNNNNNNNNNNNNNNNNNNNNNNNNNN
Input: B
IF BW: 10 Hz
Meas5, B
4Bw/Avg5, IF BW , 415, 405, 4x15
4
NNNNN
NNNNNNNNNNNNNNNNN
f. Press 4Trigger5, SINGLE to make a sweep. Wait for the completion of the sweep.
NNNNNNNNNNNNNNNNNNNN
g. Press 4Ch 15, 4Search5, MAX to move the channel 1 marker to the maximum point on the
trace (R/Memory).
h. Record the marker reading in the performance test record (\Test Result" column for A
into R crosstalk).
i. Press 4Ch 25, 4Search5, MAX to move the channel 2 marker to the maximum point on the
trace (B/Memory).
j. Record the marker reading in the performance test record (\Test Result" column for A
into B crosstalk).
NNNNNNNNNNN
NNNNNNNNNNN
4.
|B into R Crosstalk and B into A Crosstalk|
a. Connect the test equipment as shown in Figure 2-9.
Figure 2-9. Input Crosstalk Test Setup 3
b. Change the 4396B controls as follows:
Control Settings
Active Channel: CH 1
Input: B
Data Math: DATA
Active Channel: CH 2
Input: B
Data Math: DATA
IF BW: 1 kHz
Key Strokes
Ch 15
4Meas5, B
4Display5, DATA MATH [D0M] , DATA MATH: DATA
4Ch 25
4Meas5, B
4Display5, DATA MATH [D0M] , DATA MATH: DATA
4Bw/Avg5, IF BW , 415, 4k/m5
4
NNNNN
NNNNNNNNNNNNNNNNNNNNNNNNNNNNNNNNNNNNNNNNNNNNNNNN
NNNNNNNNNNNNNNNNNNNNNNNNNNNNNNNNNNNNNNNNNNNNNNN
NNNNN
NNNNNNNNNNNNNNNNNNNNNNNNNNNNNNNNNNNNNNNNNNNNNNNN
NNNNNNNNNNNNNNNNNNNNNNNNNNNNNNNNNNNNNNNNNNNNNNN
NNNNNNNNNNNNNNNNN
Performance Tests
2-23
c. Press 4Trigger5, SINGLE to make a sweep. Wait for the completion of the sweep.
NNNNNNNNNNNNNNNNNNNN
d. Set the 4396B controls as follows:
Control Settings
Active Channel: CH 1
Data!Memory
Data Math: DATA0MEM
Reference Value: 0100 dB
Input: R
Active Channel: CH 2
Data!Memory
Data Math: DATA0MEM
Reference Value: 0100 dB
Input: A
IF BW: 10 Hz
Key Strokes
Ch 15
4Display5, DATA!MEMORY (A beep indicates that the
4
NNNNNNNNNNNNNNNNNNNNNNNNNNNNNNNNNNNNN
trace is stored.)
4Display5, DATA MATH [DATA] , DATA0MEM
4Scale Ref5, REFERENCE VALUE , 4-5, 415, 405, 4x15
4Meas5, R
NNNNNNNNNNNNNNNNNNNNNNNNNNNNNNNNNNNNNNNNNNNNNNNNNN
NNNNNNNNNNNNNNNNNNNNNNNNNNN
NNNNNNNNNNNNNNNNNNNNNNNNNNNNNNNNNNNNNNNNNNNNNNN
NNNNN
Ch 25
Display5, DATA!MEMORY (A beep indicates that the
4
4
NNNNNNNNNNNNNNNNNNNNNNNNNNNNNNNNNNNNN
trace is stored.)
4Display5, DATA MATH [DATA] , DATA0MEM
4Scale Ref5, REFERENCE VALUE , 4-5, 415, 405, 4x15
4Meas5, A
4Bw/Avg5, IF BW , 415, 405, 4x15
NNNNNNNNNNNNNNNNNNNNNNNNNNNNNNNNNNNNNNNNNNNNNNNNNN
NNNNNNNNNNNNNNNNNNNNNNNNNNN
NNNNNNNNNNNNNNNNNNNNNNNNNNNNNNNNNNNNNNNNNNNNNNN
NNNNN
NNNNNNNNNNNNNNNNN
e. Press 4Trigger5, SINGLE to make a sweep. Wait for completion of the sweep.
NNNNNNNNNNNNNNNNNNNN
f. Press 4Ch 15, 4Search5, MAX to move the channel 1 marker to the maximum point on the
trace (R/Memory).
g. Record the marker reading in the performance test record (\Test Result" column for B
into R crosstalk).
h. Press 4Ch 25, 4Search5, MAX to move the channel 2 marker to the maximum point
(A/Memory).
i. Record the marker reading in the performance test record (\Test result" column for B
into A crosstalk).
NNNNNNNNNNN
NNNNNNNNNNN
2-24
Performance Tests
8. INPUT IMPEDANCE TEST (NA)
Description
This test uses a network analyzer and a T/R test set to measure the return losses of the
4396B R, A, and B inputs. One-port full calibration is performed to measured the return loss
accurately.
The 4396B has no capability for making an A/B measurement. The 4396B can measure the
return loss of the B (or A) input using A/R (or B/R) measurement capability of the 4396B.
However, it cannot measure the R input's return loss. Therefore, a network analyzer is used in
this test.
Specication
Return loss
@frequency 500 kHz : : : : : : : : : : : : : : : : : : : : : : : : : : : : : : : : : : : : : : : : : : : : : : : : : : : : : : : : : : : : : : : : >20 dB
Test Equipment
Network Analyzer : : : : : : : : : : : : : : : : : : : : : : : : : : : : : : : : : : : : : : : : : : : : : : : : : : : : : : : : : : : : : : : : : : : : 8753A/B/C
T/R Test Set : : : : : : : : : : : : : : : : : : : : : : : : : : : : : : : : : : : : : : : : : : : : : : : : : : : : : : : : : : : : : : : : : : : : : : : : : : : : : : 85044A
50
Type-N Calibration Kit : : : : : : : : : : : : : : : : : : : : : : : : : : : : : : : : : : : : : : : : : : : : : : : : : : : : : : : : : : : : : 85032B1
APC 7-N(f) adapter : : : : : : : : : : : : : : : : : : : : : : : : : : : : : : : : : : : : : : : : : : : : : : : : : : : 11524A or part of 85032B
N(m)-N(m) cable, 61 cm (four required) : : : : : : : : : : : : : : : : : : : : : : : : : : : : : : 11500B or part of 11851B
1: This calibration kit includes several terminations and adapters. This test requires the OPEN(f),
SHORT(f), LOAD(f) in the calibration kit 85032B.
Procedure
1. Connect the test equipment as shown in Figure 2-10. Don't connect anything to the end of
the test port cable.
Performance Tests
2-25
Figure 2-10. Impedance Test Setup
2. Press 4Meas5, ANALYZER TYPE , NETWORK ANALYZER , 4Preset5 to initialize the 4396B.
NNNNNNNNNNNNNNNNNNNNNNNNNNNNNNNNNNNNNNNNN
NNNNNNNNNNNNNNNNNNNNNNNNNNNNNNNNNNNNNNNNNNNNNNNNNN
3. On the network analyzer, perform the following steps to set the network analyzer controls
to measure the return loss.
a. Press 4Preset5 to initialize the network analyzer.
b. Press 4MENU5, POWER , 4-5, 415, 4x15.
c. Press 4START5, 455, 405, 405, 4k/m5.
d. Press 4STOP5, 415, 4.5, 485, 4G/n5.
e. Press 4CAL5, CAL KIT [7mm] , N 50
, RETURN , CALIBRATION MENU , S11 1-PORT to
initiate a calibration.
f. Connect a type N(f) open to the end of the test port cable.
g. Press (S11):OPENS , OPEN (M) . Wait until a beep sounds. Then press DONE:OPENS .
h. Remove the open from the test port cable and connect a type N(f) short to the test port
cable.
i. Press SHORTS , SHORT (M) . Wait until a beep sounds. Then press DONE:SHORTS .
j. Remove the short from the test port cable and connect a type N(f) 50 load to the test
port cable.
k. Press LOAD . Wait until a beep sounds.
l. Press DONE:1-PORT CAL to complete the calibration sequence.
m. Remove the type N(f) 50 load from the test port cable
4. Connect the test port cable to the 4396B R input.
NNNNNNNNNNNNNNNNN
NNNNNNNNNNNNNNNNNNNNNNNNNNNNNNNNNNNNNNNNN
NNNNNNNNNNNNNNNNNNNNNNNNNNNNNNNNNNN
NNNNNNNNNNNNNNNNNNNN
NNNNNNNNNNNNNNNNNNNNNNNNNN
NNNNNNNNNNNNNNNNNNNNNNNNNNNNN
NNNNNNNNNNNNNN
NNNNNNNNNNNNNNNNNNNNNNNNNNNNNNNNNNNNNNNNNNNNNNN
2-26
Performance Tests
NNNNNNNNNNNNNNNNN
NNNNNNNNNNNNNNNNNNNN
NNNNNNNNNNNNNNNNNNNNNNNNNNNNNNNNNNNNNNNNNNNNNNNNNN
NNNNNNNNNNNNNNNNNNNNNNNNNNNNNNNN
NNNNNNNNNNNNNNNNNNNNNNNNNNNNNNNN
NNNNNNNNNNNNNNNNNNNNNNNNNNNNNNNNNNN
5. On the network analyzer, press 4MENU5, TRIGGER MENU , SINGLE to make a sweep. Wait for
the completion of the sweep.
6. On the network analyzer, press 4MKR FCTN5, MKR SEARCH [OFF] , MAX to move the marker
to the maximum point on the trace.
7. Record the network analyzer's marker reading (with an opposite sign) in the performance
test record (\Test Result" column).
8. Remove the test port cable from the 4396B R input and connect it to the A input.
9. On the network analyzer, press 4MENU5, TRIGGER MENU , SINGLE to make a sweep. Wait for
the completion of the sweep.
10. On the network analyzer, press 4MKR FCTN5, MKR SEARCH [OFF] , MAX to move the marker
to the maximum point on the trace.
11. Record the network analyzer's marker reading (with an opposite sign) in the performance
test record (\Test Result" column).
12. Remove the test port cable from the 4396B A input and connect it to the B input.
13. On the network analyzer, press 4MENU5, TRIGGER MENU , SINGLE to make a sweep. Wait for
the completion of the sweep.
14. On the network analyzer, press 4MKR FCTN5, MKR SEARCH [OFF] , MAX to move the marker
to the maximum point on the trace.
15. Record the network analyzer's marker reading (with an opposite sign) in the performance
test record (\Test Result" column).
NNNNNNNNNNNNNNNNNNNNNNNNNNNNNNNNNNNNNN
NNNNNNNNNNNNNNNNNNNN
NNNNNNNNNNNNNNNNNNNNNNNNNNNNNNNNNNNNNNNNNNNNNNNNNN
NNNNNNNNNNNNNNNNNNNNNNNNNNNNNNNNNNNNNN
NNNNNNNNNNNNNNNNNNNN
NNNNNNNNNNNNNNNNNNNNNNNNNNNNNNNNNNNNNNNNNNNNNNNNNN
NNNNNNNNNNNNNNNNNNNNNNNNNNNNNNNNNNNNNN
NNNNNNNNNNN
NNNNNNNNNNN
NNNNNNNNNNNNNNNNNNNN
NNNNNNNNNNNNNNNNNNNNNNNNNNNNNNNNNNNNNNNNNNNNNNNNNN
NNNNNNNNNNN
Performance Tests
2-27
9. ABSOLUTE AMPLITUDE ACCURACY TEST (NA)
Description
This test measures a test signal amplitude using the 4396B absolute amplitude measurement
function in the network analyzer mode and using a power meter and a power sensor. Then it
compares the 4396B reading with the reading of the power meter. The accuracy of the absolute
amplitude measurement is veried over the entire frequency range.
In this test, the 4396B RF OUT signal is used as the test signal. The RF OUT signal is divided
through a two-way power splitter and applied to an 4396B input and the power sensor input.
Specication
Absolute amplitude accuracy (R, A, B)
@020 dBm input, 2365 C : : : : : : : : : : : : : : : : : : : : : : : : : : : : : : : : : : : : : : : : : : : : : : : : : : : : : : : : : : <61.5 dB
Test Equipment
Power Meter : : : : : : : : : : : : : : : : : : : : : : : : : : : : : : : : : : : : : : : : : : : : : : : : : : : : : 436A Opt. 022, 437B, or 438A
Power Sensor : : : : : : : : : : : : : : : : : : : : : : : : : : : : : : : : : : : : : : : : : : : : : : : : : : : : : : : : : : : : : : : : : : : : : : : : : : : : : : 8482A
Two-way Power Splitter : : : : : : : : : : : : : : : : : : : : : : : : : : : : : : : : : : : : : : : : : : : : : : : : : : : : : : : : : : : : : : : : : 11667A
N(m)-N(m) cable, 61 cm : : : : : : : : : : : : : : : : : : : : : : : : : : : : : : : : : : : : : : : : : : : : : : : 11500B or part of 11851B
N(m)-N(m) adapter : : : : : : : : : : : : : : : : : : : : : : : : : : : : : : : : : : : : : : : : : : : : : : : : : : : : : : : : : : : : : : : : PN 1250-1475
Procedure
1. Connect the power sensor to the power meter. Calibrate the power meter for the power
sensor.
2. Connect the test equipment as shown in Figure 2-11.
2-28
Performance Tests
Figure 2-11. Absolute Amplitude Accuracy Test Setup
3. Press 4Meas5, ANALYZER TYPE , NETWORK ANALYZER , 4Preset5 to initialize the 4396B. Then set
the controls as follows:
NNNNNNNNNNNNNNNNNNNNNNNNNNNNNNNNNNNNNNNNN
NNNNNNNNNNNNNNNNNNNNNNNNNNNNNNNNNNNNNNNNNNNNNNNNNN
Control Settings
Source Power: 014 dBm
IF BW: 100 Hz
Number of Points: 11
Frequency Span: 0 Hz
Statistics: ON
Key Strokes
Source5, POWER , 4-5, 415, 445, 4x15
4Bw/Avg5, IF BW , 415, 405, 405, 4x15
4Sweep5, NUMBER of POINTS , 415, 415, 4x15
4Span5, ZERO SPAN
4Utility5, STATISTICS on OFF (Then the softkey label
4
NNNNNNNNNNNNNNNNN
NNNNNNNNNNNNNNNNN
NNNNNNNNNNNNNNNNNNNNNNNNNNNNNNNNNNNNNNNNNNNNNNNNNN
NNNNNNNNNNNNNNNNNNNNNNNNNNNNN
NNNNNNNNNNNNNNNNNNNNNNNNNNNNNNNNNNNNNNNNNNNNNNNNNNNNN
NNNNNNNNNNNNNNNNNNNNNNNNNNNNNNNNNNNNNNNNNNNNNNNNNNNNN
changes to STATISTICS ON off .)
4. Press 4Meas5, R to set the 4396B to the R input.
NNNNN
5. Perform the following steps to test the absolute amplitude accuracy at the R input.
a. Press 4Center5, 415, 405, 405, 4k/m5 to set the 4396B center frequency to the rst test
frequency 100 kHz listed in Table 2-8. Table 2-8 lists test frequencies.
Performance Tests
2-29
Table 2-8. Absolute Amplitude Accuracy Test Settings
4396B
Center Frequency
100 kHz
1 MHz
10 MHz
50 MHz
100 MHz
1 GHz
1.79 GHz
1.8 GHz
b. Press 4Trigger5, SINGLE to make a sweep. Wait for the completion of the sweep.
c. Record the trace mean value and the power meter reading in the calculation sheet
(\4396B Reading" column and \Power Meter Reading" column, respectively). The trace
mean value is displayed as a marker statistic (mean) in the upper right-hand corner of
the display.
d. Change the 4396B center frequency in accordance with Table 2-8, and repeat steps 5-b
and 5-c for each center frequency.
6. Remove the power splitter from the R input, and connect it directly to the A input.
7. Press 4Meas5, A to set the 4396B to the A input.
NNNNNNNNNNNNNNNNNNNN
NNNNN
8. Repeat step 5 to test the absolute amplitude accuracy at the 4396B A input.
9. Remove the power splitter from the A input, and connect it directly to the B input.
10. Press 4Meas5, B to set the 4396B to the B input.
NNNNN
11. Repeat step 5 to test the absolute amplitude accuracy at the B input.
12. Calculate the test results using the equation given in the calculation sheet. Record the test
results in the performance test record.
2-30
Performance Tests
10. MAGNITUDE RATIO/PHASE DYNAMIC ACCURACY TEST
(NA)
Description
Dynamic accuracy is a measure of how well a receiver measures the magnitude and phase
components of a signal as that signal varies in amplitude over a specied dynamic range.
To measure the dynamic accuracy, this test applies a xed level signal of 035 dBm to the
4396B R input (reference input). At the same time, it applies a signal that varies from 05 dBm
(full scale input level) to 0105 dBm to one of the 4396B's A or B inputs (test input). It then
measures the magnitude ratio from +30 dB to 070 dB and the phase of the signals.
The signal amplitude at the test input is varied by inserting known attenuation values. The
measured magnitude ratio values are then compared to the inserted attenuation's calibrated
values.
The phase dynamic accuracy is measured at 3 MHz (where the phase error contribution by the
individual attenuator segments is small when compared to the test limits).
In this test, a step attenuator with its VSWR 1.02 and two 6 dB xed attenuators with
a VSWR 1.015 are used. Using these attenuators reduces the measurement uncertainties
caused by mismatch error. When they are used, the measurement uncertainties listed in the
performance test record are valid.
Specication
Magnitude ratio/phase dynamic accuracy (A/R, B/R)
Input Level
(relative to full scale input level)1
0 dB
010 dB
020 dB
030 dB
040 dB
050 dB
060 dB
070 dB
080 dB
090 dB
0100 dB
Magnitude Ratio Dynamic
Accuracy2
<60.3 dB
<60.05 dB
<60.05 dB
<60.05 dB
<60.05 dB
<60.05 dB
<60.05 dB
<60.05 dB
<60.1 dB
<60.3 dB
<61.0 dB
Phase Dynamic Accuracy1
<63 deg
<60.6 deg
<60.3 deg
<60.3 deg
<60.3 deg
<60.3 deg
<60.3 deg
<60.3 deg
<60.7 deg
<62 deg
<67 deg
1 : full scale input level = 05 dBm
2 : @2365 C, IFBW = 10 Hz, R input = 035 dBm, Reference power level=035 dBm
Performance Tests
2-31
Test Equipment
Two-way Power Splitter : : : : : : : : : : : : : : : : : : : : : : : : : : : : : : : : : : : : : : : : : : : : : : : : : : : : : : : : : : : : : : : : : 11667A
Step Attenuator1 , 10 dB Step, VSWR 1.02 : : : : : : : : : : : : : : : : : : : : : 8496A/G Option 001 and H60
Attenuator driver2 : : : : : : : : : : : : : : : : : : : : : : : : : : : : : : : : : : : : : : : : : : : : : : : : : : : : : : : : : : : : : : : : : : : : : : : 11713A
6 dB Fixed Attenuation (two required) : : : : : : : : : : : : : : : : : : : : : : : : : : : : : : : : : : : : : : : : : : 8491A Opt 006
6 dB Fixed Attenuation, VSWR 1.015 (two required) : : : : : : : : : : : : : 8491A Opt 006 & Opt H60
N(m)-N(m) cable, 61 cm (three required) : : : : : : : : : : : : : : : : : : : : : : : : : : : : : : 11500B or part of 11851B
N(m)-N(m) adapter : : : : : : : : : : : : : : : : : : : : : : : : : : : : : : : : : : : : : : : : : : : : : : : : : : : : : : : : : : : : : : : : PN 1250-1475
1: Calibration values for attenuation settings of 10 dB to 70 dB at 50 MHz are required.
2: Required when using a programmable step attenuator 8496G.
Procedure
1. Record the step attenuator 50 MHz calibration values in the calculation sheet (\Calibration
Value" column).
2. Press 4Meas5, ANALYZER TYPE , NETWORK ANALYZER , 4Preset5 to initialize the 4396B. Then set
the controls as follows:
NNNNNNNNNNNNNNNNNNNNNNNNNNNNNNNNNNNNNNNNN
Control Settings
Dual Channel: ON
NNNNNNNNNNNNNNNNNNNNNNNNNNNNNNNNNNNNNNNNNNNNNNNNNN
Key Strokes
Display5, DUAL CHAN on OFF (Then the softkey label
4
NNNNNNNNNNNNNNNNNNNNNNNNNNNNNNNNNNNNNNNNNNNNNNNNNN
NNNNNNNNNNNNNNNNNNNNNNNNNNNNNNNNNNNNNNNNNNNNNNNNNN
changes to DUAL CHAN ON off .)
Marker: DISCRETE
4Marker5, MKR [CONT] (Then the softkey label changes
to MKR [DISCRETE] .)
Start Frequency: 3 MHz
4Start5, 435, 4M/5
Stop Frequency: 50 MHz
4Stop5, 455, 405, 4M/5
IF BW: 10 Hz
4Bw/Avg5, IF BW , 415, 405, 4x15
Number of Points: 2
4Sweep5, NUMBER of POINTS , 425, 4x15
Calibration Kit: Type0N, 50 4Cal5, CAL KIT [7mm] , N 50
NNNNNNNNNNNNNNNNNNNNNNNNNNNNNNNN
NNNNNNNNNNNNNNNNNNNNNNNNNNNNNNNNNNNNNNNNNNNN
NNNNNNNNNNNNNNNNN
NNNNNNNNNNNNNNNNNNNNNNNNNNNNNNNNNNNNNNNNNNNNNNNNNN
NNNNNNNNNNNNNNNNNNNNNNNNNNNNNNNNNNNNNNNNN
3.
NNNNNNNNNNNNNNNNN
|A/R Dynamic Accuracy Test (Magnitude Ratio at 50 MHz and Phase at 3 MHz)|
a. Connect the test equipment as shown in Figure 2-12.
2-32
Performance Tests
Figure 2-12. A/R Magnitude Ratio/Phase Dynamic Accuracy Test Setup 1
b. On the 4396B, set the controls as follows:
Control Settings
Source Power: 017 dBm
Active Channel: CH 1
Input: A/R
Format: LOG MAG
Average Factor: 5
Averaging: ON
Key Strokes
Source5, POWER , 4-5, 415, 475, 4x15
4Ch 15
4Meas5, A/R
4Format5, LOG MAG
4Bw/Avg5, AVERAGE FACTOR , 455, 4x15
4Bw/Avg5, AVERAGE on OFF (Then the softkey label
NNNNNNNNNNNNNNNNN
4
NNNNNNNNNNN
NNNNNNNNNNNNNNNNNNNNNNN
NNNNNNNNNNNNNNNNNNNNNNNNNNNNNNNNNNNNNNNNNNNN
NNNNNNNNNNNNNNNNNNNNNNNNNNNNNNNNNNNNNNNNNNNN
NNNNNNNNNNNNNNNNNNNNNNNNNNNNNNNNNNNNNNNNNNNN
Active Channel: CH 2
Input: A/R
Format: PHASE
Average Factor: 5
Averaging: ON
changes to AVERAGE ON off .)
Ch 25
4Meas5, A/R
4Format5, PHASE
4Bw/Avg5, AVERAGE FACTOR , 455, 4x15
4
NNNNNNNNNNN
NNNNNNNNNNNNNNNNN
NNNNNNNNNNNNNNNNNNNNNNNNNNNNNNNNNNNNNNNNNNNN
NNNNNNNNNNNNNNNNNNNNNNNNNNNNNNNNNNNNNNNNNNNN
AVERAGE on OFF (Then the softkey label changes
to AVERAGE ON off .)
NNNNNNNNNNNNNNNNNNNNNNNNNNNNNNNNNNNNNNNNNNNN
c. Set the step attenuator to 0 dB.
d. Press 4Cal5, CALIBRATION MENU , RESPONSE , THRU to perform the response (THRU)
calibration. Wait for the completion of the sweep. Then press DONE:RESPONSE .
NNNNNNNNNNNNNNNNNNNNNNNNNNNNNNNNNNNNNNNNNNNNNNNNNN
NNNNNNNNNNNNNNNNNNNNNNNNNN
NNNNNNNNNNNNNN
NNNNNNNNNNNNNNNNNNNNNNNNNNNNNNNNNNNNNNNNN
Performance Tests
2-33
e. Set the step attenuator to the rst setting 30 dB in the second column of Table 2-9.
Table 2-9. A/R Dynamic Accuracy Test Settings 1
4396B Step Attenuator
4396B
Input Level
Source Power
0 dB
010 dB
020 dB
30 dB
20 dB
10 dB
+13 dBm
+3 dBm
07 dBm
f. On the 4396B, press 4Source5, POWER , 415, 435, 4x15 to set the source power to the rst
setting in the third columns of Table 2-9.
g. Perform the following steps to measure the dynamic accuracy.
i. Press 4Trigger5, NUMBER OF GROUPS , 455, 4x15 to make a sweep. Wait for the completion
of the sweep.
ii. Press 4Marker5, 4*5 to move the channel 1 marker to 50 MHz.
iii. Record the channel 1 marker reading in the calculation sheet for the magnitude ratio
dynamic accuracy. Use the 4396B reading column corresponding to the input level in
the rst column of Table 2-9.
iv. Press 4+5 to move the channel 2 marker to 3 MHz.
v. Record the channel 2 marker reading directly in the performance test record. Use
the test result column of the phase measurement corresponding to the input level in
the rst column of Table 2-9.
h. Change the step attenuator setting and 4396B power setting in accordance with the
second and third columns of Table 2-9, and perform step 3-g for each setting.
i. Change the cable connection as shown in Figure 2-13.
NNNNNNNNNNNNNNNNN
NNNNNNNNNNNNNNNNNNNNNNNNNNNNNNNNNNNNNNNNNNNNNNNNNN
2-34
Performance Tests
Figure 2-13. A/R Magnitude Ratio/Phase Dynamic Accuracy Test Setup 2
j. On the 4396B, set the controls as follows:
Control Settings
Source Power: 017 dBm
Active Channel:
Average Factor:
Active Channel:
Average Factor:
CH 1
10
CH 2
10
Key Strokes
Source5, POWER , 4-5, 415, 475, 4x15
4Ch 15
4Bw/Avg5, AVERAGE FACTOR , 415, 405, 4x15
4Ch 25
4Bw/Avg5, AVERAGE FACTOR , 415, 405, 4x15
4
NNNNNNNNNNNNNNNNN
NNNNNNNNNNNNNNNNNNNNNNNNNNNNNNNNNNNNNNNNNNNN
NNNNNNNNNNNNNNNNNNNNNNNNNNNNNNNNNNNNNNNNNNNN
k. Set the step attenuator to 0 dB.
l. Press 4Cal5, CALIBRATION MENU , RESPONSE , THRU to perform the response (THRU)
calibration. Wait for the completion of the sweep. Then press DONE:RESPONSE .
NNNNNNNNNNNNNNNNNNNNNNNNNNNNNNNNNNNNNNNNNNNNNNNNNN
NNNNNNNNNNNNNNNNNNNNNNNNNN
NNNNNNNNNNNNNN
NNNNNNNNNNNNNNNNNNNNNNNNNNNNNNNNNNNNNNNNN
m. Set the step attenuator to the rst setting 10 dB in the second column of Table 2-10.
Performance Tests
2-35
Table 2-10. A/R Dynamic Accuracy Test Settings 2
4396B Step Attenuator
Input Level
10 dB
040 dB
050 dB
20 dB
060 dB
30 dB
070 dB
40 dB
080 dB
50 dB
090 dB
60 dB
70 dB
0100 dB
n. Perform the following steps to measure the dynamic accuracy.
i. Press 4Trigger5, NUMBER OF GROUPS , 415, 405, 4x15 to make a sweep. Wait for the
completion of the sweep.
ii. Press 4Marker5, 4*5 to move the channel 1 marker to 50 MHz.
iii. Record the channel 1 marker reading in the calculation sheet for the magnitude ratio
dynamic accuracy. Use the 4396B reading column corresponding to the input level in
the rst column of Table 2-10.
iv. Press 4+5 to move the channel 2 marker to 3 MHz.
v. Record the channel 2 marker reading directly in the performance test record. Use
the test result column of the phase measurement corresponding to the input level in
the rst column of Table 2-10.
o. Change the step attenuator setting in accordance with the second column of Table 2-10,
and perform step 3-n for each setting.
NNNNNNNNNNNNNNNNNNNNNNNNNNNNNNNNNNNNNNNNNNNNNNNNNN
4.
|B/R Dynamic Accuracy Test (Magnitude Ratio at 50 MHz and Phase at 3 MHz)|
a. Connect the test equipment as shown in Figure 2-14.
2-36
Performance Tests
Figure 2-14. B/R Magnitude Ratio/Phase Dynamic Accuracy Test Setup 1
b. On the 4396B, set the controls as follows:
Control Settings
Active Channel: CH 1
Input: B/R
Format: LOG MAG
Average Factor: 5
Active Channel: CH 2
Input: B/R
Format: PHASE
Average Factor: 5
Source Power: 017 dBm
Key Strokes
Ch 15
4Meas5, B/R
4Format5, LOG MAG
4Bw/Avg5, AVERAGE FACTOR , 455, 4x15
4Ch 25
4Meas5, B/R
4Format5, PHASE
4Bw/Avg5, AVERAGE FACTOR , 455, 4x15
4Source5, POWER , 4-5, 415, 475, 4x15
4
NNNNNNNNNNN
NNNNNNNNNNNNNNNNNNNNNNN
NNNNNNNNNNNNNNNNNNNNNNNNNNNNNNNNNNNNNNNNNNNN
NNNNNNNNNNN
NNNNNNNNNNNNNNNNN
NNNNNNNNNNNNNNNNNNNNNNNNNNNNNNNNNNNNNNNNNNNN
NNNNNNNNNNNNNNNNN
c. Set the step attenuator to 0 dB.
d. Press 4Cal5, CALIBRATION MENU , RESPONSE , THRU to perform the response (THRU)
calibration. Wait for the completion of the sweep. Then press DONE:RESPONSE .
NNNNNNNNNNNNNNNNNNNNNNNNNNNNNNNNNNNNNNNNNNNNNNNNNN
NNNNNNNNNNNNNNNNNNNNNNNNNN
NNNNNNNNNNNNNN
NNNNNNNNNNNNNNNNNNNNNNNNNNNNNNNNNNNNNNNNN
e. Set the step attenuator to the rst setting 30 dB in the second column of Table 2-11.
Performance Tests
2-37
Table 2-11. B/R Dynamic Accuracy Test Settings 1
4396B Step Attenuator
4396B
Input Level
Source Power
0 dB
010 dB
020 dB
30 dB
20 dB
10 dB
+13 dBm
+3 dBm
07 dBm
f. On the 4396B, press 4Source5, POWER , 415, 435, 4x15 to set the source power to the rst
setting +13 dBm in the third columns of Table 2-11.
g. Perform the following steps to measure the dynamic accuracy.
i. Press 4Trigger5, NUMBER OF GROUPS , 455, 4x15 to make a sweep. Wait for the completion
of the sweep.
ii. Press 4Marker5, 4*5 to move the channel 1 marker to 50 MHz.
iii. Record the channel 1 marker reading in the calculation sheet for the magnitude ratio
dynamic accuracy. Use the 4396B reading column corresponding to the input level in
the rst column of Table 2-11.
iv. Press 4+5 to move the channel 2 marker to 3 MHz.
v. Record the channel 2 marker reading directly in the performance test record. Use
the test result column of the phase measurement corresponding to the input level in
the rst column of Table 2-11.
h. Change the step attenuator setting and 4396B power setting in accordance with the
second and third columns of Table 2-11, and perform step 4-g for each setting.
i. Change the cable connection as shown in Figure 2-15.
NNNNNNNNNNNNNNNNN
NNNNNNNNNNNNNNNNNNNNNNNNNNNNNNNNNNNNNNNNNNNNNNNNNN
2-38
Performance Tests
Figure 2-15. B/R Magnitude Ratio/Phase Dynamic Accuracy Test Setup 2
j. On the 4396B, set the controls as follows:
Control Settings
Source Power: 017 dBm
Active Channel:
Average Factor:
Active Channel:
Average Factor:
CH 1
10
CH 2
10
Key Strokes
Source5, POWER , 4-5, 415, 475, 4x15
4Ch 15
4Bw/Avg5, AVERAGE FACTOR , 415, 405, 4x15
4Ch 25
4Bw/Avg5, AVERAGE FACTOR , 415, 405, 4x15
4
NNNNNNNNNNNNNNNNN
NNNNNNNNNNNNNNNNNNNNNNNNNNNNNNNNNNNNNNNNNNNN
NNNNNNNNNNNNNNNNNNNNNNNNNNNNNNNNNNNNNNNNNNNN
k. Set the step attenuator to 0 dB.
l. Press 4Cal5, CALIBRATION MENU , RESPONSE , THRU to perform the response (THRU)
calibration. Wait for the completion of the sweep. Then press DONE:RESPONSE .
NNNNNNNNNNNNNNNNNNNNNNNNNNNNNNNNNNNNNNNNNNNNNNNNNN
NNNNNNNNNNNNNNNNNNNNNNNNNN
NNNNNNNNNNNNNN
NNNNNNNNNNNNNNNNNNNNNNNNNNNNNNNNNNNNNNNNN
m. Set the step attenuator to the rst setting 10 dB in the second column of Table 2-12.
Performance Tests
2-39
Table 2-12. B/R Dynamic Accuracy Test Settings 2
4396B Step Attenuator
Input Level
10 dB
040 dB
050 dB
20 dB
060 dB
30 dB
070 dB
40 dB
080 dB
50 dB
090 dB
60 dB
70 dB
0100 dB
n. Perform the following steps to measure the dynamic accuracy.
i. Press 4Trigger5, NUMBER OF GROUPS , 415, 405, 4x15 to make a sweep. Wait for the
completion of the sweep.
ii. Press 4Marker5, 4*5 to move the channel 1 marker to 50 MHz.
iii. Record the channel 1 marker reading in the calculation sheet for the magnitude ratio
dynamic accuracy. Use the 4396B reading column corresponding to the input level in
the rst column of Table 2-12.
iv. Press 4+5 to move the channel 2 marker to 3 MHz.
v. Record the channel 2 marker reading directly in the performance test record. Use
the test result column of the phase measurement corresponding to the input level in
the rst column of Table 2-12.
o. Change the step attenuator setting in accordance with the second column of Table 2-12,
and perform step 4-n for each setting.
5. Calculate the test results for the magnitude ratio dynamic accuracy test using the equations
given in the calculation sheet. Record the test results in the performance test record.
NNNNNNNNNNNNNNNNNNNNNNNNNNNNNNNNNNNNNNNNNNNNNNNNNN
2-40
Performance Tests
11. MAGNITUDE RATIO/PHASE FREQUENCY RESPONSE TEST
(NA)
Description
This test applies the RF OUT signal to the 4396B R input and either the A or B input through
a power splitter. It then measures the magnitude ratio and phase of the A/R and B/R
measurements. The magnitude ratio frequency response is measured as the deviation from the
ideal magnitude ratio value of 0 dB. The phase frequency response is measured as the deviation
from linear phase.
In this test, the frequency response is measured at two frequency ranges, from 100 kHz to
1 MHz and from 1 MHz to 1.8 GHz. This is done to measure the frequency response at a
low frequency range using a linear frequency sweep mode. The frequency response at each
frequency range is measured twice while reversing the connections of the power splitter's two
output ports. The connections are reversed to remove the frequency tracking between the
two signal paths (from the power splitter output port to the 4396B input port) from measured
values. The frequency response without the tracking is calculated using equations provided in
the calculation sheet.
Specication
Magnitude ratio accuracy (A/R, B/R)
@020 dBm input, IF BW 3 kHz, 2365 C
@100 k frequency < 1 MHz : : : : : : : : : : : : : : : : : : : : : : : : : : : : : : : : : : : : : : : : : : : : : : : : : : : : : : <61 dB
@frequency 1 MHz : : : : : : : : : : : : : : : : : : : : : : : : : : : : : : : : : : : : : : : : : : : : : : : : : : : : : : : : : : : : : <60.5 dB
Phase frequency response (Deviation from Linear Phase) (A/R, B/R)
@020 dBm input, IF BW 3 kHz, 2365 C
100 k frequency < 1 MHz : : : : : : : : : : : : : : : : : : : : : : : : : : : : : : : : : : : : : : : : : : : : : : : : : : : : : : < 66 deg
frequency 1 MHz : : : : : : : : : : : : : : : : : : : : : : : : : : : : : : : : : : : : : : : : : : : : : : : : : : : : : : : : : : : : : : : < 63 deg
Test Equipment
Two-way Power Splitter : : : : : : : : : : : : : : : : : : : : : : : : : : : : : : : : : : : : : : : : : : : : : : : : : : : : : : : : : : : : : : : : : 11667A
RF cable kit : : : : : : : : : : : : : : : : : : : : : : : : : : : : : : : : : : : : : : : : : : : : : : : : : : : : : : : : : : : : : : : : : : : : : : : : : : : : : 11851B1
N(m)-N(m) adapter : : : : : : : : : : : : : : : : : : : : : : : : : : : : : : : : : : : : : : : : : : : : : : : : : : : : : : : : : : : : : : : : PN 1250-1475
1: Includes three 61 cm N(m)-N(m) cables phase matched. Use two N(m)-N(m) phase matched
cables in this test.
Procedure
1. Press 4Meas5, ANALYZER TYPE , NETWORK ANALYZER , 4Preset5 to initialize the 4396B. Then set
the controls as follows:
NNNNNNNNNNNNNNNNNNNNNNNNNNNNNNNNNNNNNNNNN
NNNNNNNNNNNNNNNNNNNNNNNNNNNNNNNNNNNNNNNNNNNNNNNNNN
Control Settings
Active Channel: CH 2
Statistics: ON
Key Strokes
Ch 25
Utility5, STATISTICS on OFF (Then the softkey label
4
4
NNNNNNNNNNNNNNNNNNNNNNNNNNNNNNNNNNNNNNNNNNNNNNNNNNNNN
NNNNNNNNNNNNNNNNNNNNNNNNNNNNNNNNNNNNNNNNNNNNNNNNNNNNN
Dual Channel: ON
changes to STATISTICS ON off .)
4Display5, DUAL CHAN on OFF (Then the softkey label
changes to DUAL CHAN ON off .)
4Source5, POWER , 4-5, 415, 445, 4x15
NNNNNNNNNNNNNNNNNNNNNNNNNNNNNNNNNNNNNNNNNNNNNNNNNN
NNNNNNNNNNNNNNNNNNNNNNNNNNNNNNNNNNNNNNNNNNNNNNNNNN
Source Power:
014 dBm
NNNNNNNNNNNNNNNNN
Performance Tests
2-41
IF BW: 100 Hz
2.
Bw/Avg5, IF BW , 415, 405, 405, 4x15
NNNNNNNNNNNNNNNNN
4
|A/R Magnitude Ratio/Phase Frequency Response Test|
a. Connect the test equipment as shown in setup 1 of Figure 2-16.
Figure 2-16. A/R Magnitude Ratio/Phase Frequency Response Test Setup
b. Set the 4396B controls as follows:
Control Settings
Active Channel: CH 1
Input: A/R
Format: LOG MAG
Active Channel: CH 2
Input: A/R
Format: PHASE
Start Frequency: 100 kHz
Stop Frequency: 1 MHz
Number of Points: 50
Key Strokes
Ch 15
4Meas5, A/R
4Format5, LOG MAG
4Ch 25
4Meas5, A/R
4Format5, PHASE
4Start5, 415, 405, 405, 4k/m5
4Stop5, 415, 4M/5
4Sweep5, NUMBER of POINTS , 455, 405, 4x15
4
NNNNNNNNNNN
NNNNNNNNNNNNNNNNNNNNNNN
NNNNNNNNNNN
NNNNNNNNNNNNNNNNN
NNNNNNNNNNNNNNNNNNNNNNNNNNNNNNNNNNNNNNNNNNNNNNNNNN
c. Press 4Trigger5, SINGLE to make a sweep. Wait for the completion of the sweep.
NNNNNNNNNNNNNNNNNNNN
d. Set the 4396B controls as follows:
Control Settings
Active Channel: CH 1
Data!Memory
Active Channel: CH 2
Data!Memory
2-42
Performance Tests
Key Strokes
Ch 15
4Display5, DATA!MEMORY (A beep indicates that the
4
NNNNNNNNNNNNNNNNNNNNNNNNNNNNNNNNNNNNN
trace is stored.)
Ch 25
Display5, DATA!MEMORY (A beep indicates that the
4
4
NNNNNNNNNNNNNNNNNNNNNNNNNNNNNNNNNNNNN
trace is stored.)
e. Reverse the cable connections of the 4396B A and R inputs as shown in setup 2 of
Figure 2-16.
f. Press 4Trigger5, SINGLE to make a sweep. Wait for the completion of the sweep.
NNNNNNNNNNNNNNNNNNNN
g. Set the 4396B controls as follows:
Control Settings
Key Strokes
Ch 15
4Display5, DATA MATH [DATA] , DATA+MEM , GAIN ,
4.5, 455, 4x15
Auto Scale
4Scale Ref5, AUTO SCALE
Active Channel: CH 2
4Ch 25
Data Math: G*(DATA+MEM) 4Display5, DATA MATH [DATA] , DATA+MEM , GAIN ,
4.5, 455, 4x15
Auto Scale
4Scale Ref5, AUTO SCALE
Active Channel: CH 1
Data Math: G*(DATA+MEM)
4
NNNNNNNNNNNNNNNNNNNNNNNNNNNNNNNNNNNNNNNNNNNNNNNNNN
NNNNNNNNNNNNNNNNNNNNNNNNNN
NNNNNNNNNNNNNN
NNNNNNNNNNNNNNNNNNNNNNNNNN
NNNNNNNNNNNNNN
NNNNNNNNNNNNNNNNNNNNNNNNNNNNNNNN
NNNNNNNNNNNNNNNNNNNNNNNNNNNNNNNNNNNNNNNNNNNNNNNNNN
NNNNNNNNNNNNNNNNNNNNNNNNNNNNNNNN
h. Press 4Ch 15, 4Search5, MAX and 4Search5, MIN to move the channel 1 marker to the
maximum and minimum points on the trace. Compare the absolute values at the
maximum and minimum points.
i. Record the larger value in the performance test record (\Test Result" column for A/R
magnitude ratio of the frequency range 100 kHz to 1 MHz).
j. Press 4Ch 25, 4Scale Ref5, ELECTRICAL DELAY MENU , ELECTRICAL DELAY . Then press 4*5
or 4+5 and turn the RPG knob to vary the electrical delay until the trace is in the most
horizontal position.
k. Press PHASE OFFSET and enter the trace mean value using numeric keys. The trace
mean value is displayed as a marker statistic (mean) in the upper right-hand corner of
the display.
l. Press 4Search5, MAX and 4Search5, MIN to move the channel 2 marker to the maximum
and minimum points on the trace. Compare the absolute values at the maximum and
minimum points.
m. Record the larger value in the performance test record (\Test Result" column for A/R
phase of the frequency range 100 kHz to 1 MHz).
n. Set the 4396B controls as follows:
NNNNNNNNNNN
NNNNNNNNNNN
NNNNNNNNNNNNNNNNNNNNNNNNNNNNNNNNNNNNNNNNNNNNNNNNNNNNNNNNNNNNNNNNN
NNNNNNNNNNNNNNNNNNNNNNNNNNNNNNNNNNNNNNNNNNNNNNNNNN
NNNNNNNNNNNNNNNNNNNNNNNNNNNNNNNNNNNNNN
NNNNNNNNNNN
Control Settings
Active Channel: CH 1
Data Math: DATA
NNNNNNNNNNN
Key Strokes
Ch 15
Display5, DATA MATH [G*(D+M)] ,
4
4
NNNNNNNNNNNNNNNNNNNNNNNNNNNNNNNNNNNNNNNNNNNNNNNNNNNNNNNNNNN
NNNNNNNNNNNNNNNNNNNNNNNNNNNNNNNNNNNNNNNNNNNNNNN
Active Channel: CH 2
Data Math: DATA
Ch 25
4Display5, DATA MATH [G*(D+M)] ,
4
NNNNNNNNNNNNNNNNNNNNNNNNNNNNNNNNNNNNNNNNNNNNNNNNNNNNNNNNNNN
NNNNNNNNNNNNNNNNNNNNNNNNNNNNNNNNNNNNNNNNNNNNNNN
Electrical Delay: 0 sec
NNNNNNNNNNNNNNNNNNNNNNNNNNNNNNNNNNNNNNNNNNNNNNNNNNNNNNNN
DATA MATH: DATA , DEFAULT GAIN & OFS
NNNNNNNNNNNNNNNNNNNNNNNNNNNNNNNNNNNNNNNNNNNNNNNNNNNNNNNN
DATA MATH: DATA , DEFAULT GAIN & OFS
Scale Ref5, ELECTRICAL DELAY MENU ,
ELECTRICAL DELAY , 405, 4x15
PHASE OFFSET , 405, 4x15
4
NNNNNNNNNNNNNNNNNNNNNNNNNNNNNNNNNNNNNNNNNNNNNNNNNNNNNNNNNNNNNNNNN
NNNNNNNNNNNNNNNNNNNNNNNNNNNNNNNNNNNNNNNNNNNNNNNNNN
Phase Oset: 0
NNNNNNNNNNNNNNNNNNNNNNNNNNNNNNNNNNNNNN
o. Connect the test equipment as shown in setup 1 of Figure 2-16.
p. Set the 4396B controls as follows:
Performance Tests
2-43
Control Settings
Start Frequency: 1 MHz
Stop Frequency: 1.8 GHz
Number of Points: 201
Key Strokes
Start5, 415, 4M/5
Stop5, 415, 4.5, 485, 4G/n5
4Sweep5, NUMBER of POINTS , 425, 405, 415, 4x15
4
4
NNNNNNNNNNNNNNNNNNNNNNNNNNNNNNNNNNNNNNNNNNNNNNNNNN
q. Press 4Trigger5, SINGLE to make a sweep. Wait for the completion of the sweep.
NNNNNNNNNNNNNNNNNNNN
r. Set the 4396B controls as follows:
Control Settings
Key Strokes
Ch 15
Display5, DATA!MEMORY (A beep indicates that the
Active Channel: CH 1
Data!Memory
4
4
NNNNNNNNNNNNNNNNNNNNNNNNNNNNNNNNNNNNN
trace is stored.)
Ch 25
4Display5, DATA!MEMORY (A beep indicates that the
Active Channel: CH 2
Data!Memory
4
NNNNNNNNNNNNNNNNNNNNNNNNNNNNNNNNNNNNN
trace is stored.)
s. Reverse the cable connections of the 4396B A and R inputs as shown in setup 2 of
Figure 2-16.
t. Press 4Trigger5, SINGLE to make a sweep. Wait for the completion of the sweep.
NNNNNNNNNNNNNNNNNNNN
u. Set the 4396B controls as follows:
Control Settings
Key Strokes
Ch 15
4Display5, DATA MATH [DATA] , DATA+MEM , GAIN ,
4.5, 455, 4x15
Auto Scale
4Scale Ref5, AUTO SCALE
Active Channel: CH 2
4Ch 25
Data Math: G*(DATA+MEM) 4Display5, DATA MATH [DATA] , DATA+MEM , GAIN ,
4.5, 455, 4x15
Auto Scale
4Scale Ref5, AUTO SCALE
Active Channel: CH 1
Data Math: G*(DATA+MEM)
4
NNNNNNNNNNNNNNNNNNNNNNNNNNNNNNNNNNNNNNNNNNNNNNNNNN
NNNNNNNNNNNNNNNNNNNNNNNNNN
NNNNNNNNNNNNNN
NNNNNNNNNNNNNNNNNNNNNNNNNN
NNNNNNNNNNNNNN
NNNNNNNNNNNNNNNNNNNNNNNNNNNNNNNN
NNNNNNNNNNNNNNNNNNNNNNNNNNNNNNNNNNNNNNNNNNNNNNNNNN
NNNNNNNNNNNNNNNNNNNNNNNNNNNNNNNN
v. Press 4Ch 15, 4Search5, MAX and 4Search5, MIN to move the channel 1 marker to the
maximum and minimum points on the trace. Compare the absolute values at the
maximum and minimum points.
w. Record the larger value in the performance test record (\Test Result" column for A/R
magnitude ratio of the frequency range 1 MHz to 1.8 GHz).
x. Press 4Ch 25, 4Scale Ref5, ELECTRICAL DELAY MENU , ELECTRICAL DELAY . Then press 4*5
or 4+5 and turn the RPG knob to vary the electrical delay until the trace is in the most
horizontal position.
y. Press PHASE OFFSET and enter the trace mean value using numeric keys. The trace
mean value is displayed as a marker statistic (mean) in the upper right-hand corner of
the display.
z. Press 4Search5, MAX and 4Search5, MIN to move the channel 2 marker to the maximum
and minimum points on the trace. Compare the absolute values at the maximum and
minimum points.
aa. Record the larger value in the performance test record (\Test Result" column for A/R
phase of the frequency range 1 MHz to 1.8 GHz).
bb. Set the 4396B controls as follows:
NNNNNNNNNNN
NNNNNNNNNNN
NNNNNNNNNNNNNNNNNNNNNNNNNNNNNNNNNNNNNNNNNNNNNNNNNNNNNNNNNNNNNNNNN
NNNNNNNNNNNNNNNNNNNNNNNNNNNNNNNNNNNNNN
NNNNNNNNNNN
2-44
Performance Tests
NNNNNNNNNNN
NNNNNNNNNNNNNNNNNNNNNNNNNNNNNNNNNNNNNNNNNNNNNNNNNN
Control Settings
Active Channel: CH 1
Data Math: DATA
Key Strokes
Ch 15
4Display5, DATA MATH [G*(D+M)] ,
4
NNNNNNNNNNNNNNNNNNNNNNNNNNNNNNNNNNNNNNNNNNNNNNNNNNNNNNNNNNN
NNNNNNNNNNNNNNNNNNNNNNNNNNNNNNNNNNNNNNNNNNNNNNN
Active Channel: CH 2
Data Math: DATA
Ch 25
Display5, DATA MATH [G*(D+M)] ,
4
4
NNNNNNNNNNNNNNNNNNNNNNNNNNNNNNNNNNNNNNNNNNNNNNNNNNNNNNNNNNN
NNNNNNNNNNNNNNNNNNNNNNNNNNNNNNNNNNNNNNNNNNNNNNN
Electrical Delay: 0 sec
NNNNNNNNNNNNNNNNNNNNNNNNNNNNNNNNNNNNNNNNNNNNNNNNNNNNNNNN
DATA MATH: DATA , DEFAULT GAIN & OFS
NNNNNNNNNNNNNNNNNNNNNNNNNNNNNNNNNNNNNNNNNNNNNNNNNNNNNNNN
DATA MATH: DATA , DEFAULT GAIN & OFS
Scale Ref5, ELECTRICAL DELAY MENU ,
ELECTRICAL DELAY , 405, 4x15
PHASE OFFSET , 405, 4x15
4
NNNNNNNNNNNNNNNNNNNNNNNNNNNNNNNNNNNNNNNNNNNNNNNNNNNNNNNNNNNNNNNNN
NNNNNNNNNNNNNNNNNNNNNNNNNNNNNNNNNNNNNNNNNNNNNNNNNN
Phase Oset: 0
3.
NNNNNNNNNNNNNNNNNNNNNNNNNNNNNNNNNNNNNN
|B/R Magnitude Ratio/Phase Frequency Response Test|
a. Connect the test equipment as shown in setup 1 of Figure 2-17.
Figure 2-17. B/R Magnitude Ratio/Phase Frequency Response Test Setup
b. Set the 4396B controls as follows:
Control Settings
Active Channel: CH 1
Input: B/R
Format: LOG MAG
Active Channel: CH 2
Input: B/R
Format: PHASE
Start Frequency: 100 kHz
Stop Frequency: 1 MHz
Number of Points: 50
Key Strokes
Ch 15
4Meas5, B/R
4Format5, LOG MAG
4Ch 25
4Meas5, B/R
4Format5, PHASE
4Start5, 415, 405, 405, 4k/m5
4Stop5, 415, 4M/5
4Sweep5, NUMBER of POINTS , 455, 405, 4x15
4
NNNNNNNNNNN
NNNNNNNNNNNNNNNNNNNNNNN
NNNNNNNNNNN
NNNNNNNNNNNNNNNNN
NNNNNNNNNNNNNNNNNNNNNNNNNNNNNNNNNNNNNNNNNNNNNNNNNN
Performance Tests
2-45
c. Press 4Trigger5, SINGLE to make a sweep. Wait for the completion of the sweep.
NNNNNNNNNNNNNNNNNNNN
d. Set the 4396B controls as follows:
Control Settings
Key Strokes
Ch 15
4Display5, DATA!MEMORY (A beep indicates that the
Active Channel: CH 1
Data!Memory
4
NNNNNNNNNNNNNNNNNNNNNNNNNNNNNNNNNNNNN
trace is stored.)
Ch 25
Display5, DATA!MEMORY (A beep indicates that the
Active Channel: CH 2
Data!Memory
4
4
NNNNNNNNNNNNNNNNNNNNNNNNNNNNNNNNNNNNN
trace is stored.)
e. Reverse the cable connections of the 4396B B and R inputs as shown in setup 2 of
Figure 2-17.
f. Press 4Trigger5, SINGLE to make a sweep. Wait for the completion of the sweep.
NNNNNNNNNNNNNNNNNNNN
g. Set the 4396B controls as follows:
Control Settings
Key Strokes
Ch 15
Display5, DATA MATH [DATA] , DATA+MEM , GAIN ,
4.5, 455, 4x15
Auto Scale
4Scale Ref5, AUTO SCALE
Active Channel: CH 2
4Ch 25
Data Math: G*(DATA+MEM) 4Display5, DATA MATH [DATA] , DATA+MEM , GAIN ,
4.5, 455, 4x15
Auto Scale
4Scale Ref5, AUTO SCALE
Active Channel: CH 1
Data Math: G*(DATA+MEM)
4
4
NNNNNNNNNNNNNNNNNNNNNNNNNNNNNNNNNNNNNNNNNNNNNNNNNN
NNNNNNNNNNNNNNNNNNNNNNNNNN
NNNNNNNNNNNNNN
NNNNNNNNNNNNNNNNNNNNNNNNNN
NNNNNNNNNNNNNN
NNNNNNNNNNNNNNNNNNNNNNNNNNNNNNNN
NNNNNNNNNNNNNNNNNNNNNNNNNNNNNNNNNNNNNNNNNNNNNNNNNN
NNNNNNNNNNNNNNNNNNNNNNNNNNNNNNNN
h. Press 4Ch 15, 4Search5, MAX and 4Search5, MIN to move the channel 1 marker to the
maximum and minimum points on the trace. Compare the absolute values at the
maximum and minimum points.
i. Record the larger value in the performance test record (\Test Result" column for B/R
magnitude ratio of the frequency range 100 kHz to 1 MHz).
j. Press 4Ch 25, 4Scale Ref5, ELECTRICAL DELAY MENU , ELECTRICAL DELAY . Then press 4*5
or 4+5 and turn the RPG knob to vary the electrical delay until the trace is in the most
horizontal position.
k. Press PHASE OFFSET and enter the trace mean value using numeric keys. The trace
mean value is displayed as a marker statistic (mean) in the upper right-hand corner of
the display.
l. Press 4Search5, MAX and 4Search5, MIN to move the channel 2 marker to the maximum
and minimum points on the trace. Compare the absolute values at the maximum and
minimum points.
m. Record the larger value in the performance test record (\Test Result" column for B/R
phase of the frequency range 100 kHz to 1 MHz).
NNNNNNNNNNN
NNNNNNNNNNN
NNNNNNNNNNNNNNNNNNNNNNNNNNNNNNNNNNNNNNNNNNNNNNNNNNNNNNNNNNNNNNNNN
NNNNNNNNNNNNNNNNNNNNNNNNNNNNNNNNNNNNNN
NNNNNNNNNNN
2-46
Performance Tests
NNNNNNNNNNN
NNNNNNNNNNNNNNNNNNNNNNNNNNNNNNNNNNNNNNNNNNNNNNNNNN
n. Set the 4396B controls as follows:
Control Settings
Active Channel: CH 1
Data Math: DATA
Key Strokes
Ch 15
4Display5, DATA MATH [G*(D+M)] ,
4
NNNNNNNNNNNNNNNNNNNNNNNNNNNNNNNNNNNNNNNNNNNNNNNNNNNNNNNNNNN
NNNNNNNNNNNNNNNNNNNNNNNNNNNNNNNNNNNNNNNNNNNNNNN
Active Channel: CH 2
Data Math: DATA
Ch 25
Display5, DATA MATH [G*(D+M)] ,
4
4
NNNNNNNNNNNNNNNNNNNNNNNNNNNNNNNNNNNNNNNNNNNNNNNNNNNNNNNNNNN
NNNNNNNNNNNNNNNNNNNNNNNNNNNNNNNNNNNNNNNNNNNNNNN
Electrical Delay: 0 sec
NNNNNNNNNNNNNNNNNNNNNNNNNNNNNNNNNNNNNNNNNNNNNNNNNNNNNNNN
DATA MATH: DATA , DEFAULT GAIN & OFS
NNNNNNNNNNNNNNNNNNNNNNNNNNNNNNNNNNNNNNNNNNNNNNNNNNNNNNNN
DATA MATH: DATA , DEFAULT GAIN & OFS
Scale Ref5, ELECTRICAL DELAY MENU ,
ELECTRICAL DELAY , 405, 4x15
PHASE OFFSET , 405, 4x15
4
NNNNNNNNNNNNNNNNNNNNNNNNNNNNNNNNNNNNNNNNNNNNNNNNNNNNNNNNNNNNNNNNN
NNNNNNNNNNNNNNNNNNNNNNNNNNNNNNNNNNNNNNNNNNNNNNNNNN
Phase Oset: 0
NNNNNNNNNNNNNNNNNNNNNNNNNNNNNNNNNNNNNN
o. Connect the test equipment as shown in setup 1 of Figure 2-17.
p. Set the 4396B controls as follows:
Control Settings
Start Frequency: 1 MHz
Stop Frequency: 1.8 GHz
Number of Points: 201
Key Strokes
Start5, 415, 4M/5
Stop5, 415, 4.5, 485, 4G/n5
4Sweep5, NUMBER of POINTS , 425, 405, 415, 4x15
4
4
NNNNNNNNNNNNNNNNNNNNNNNNNNNNNNNNNNNNNNNNNNNNNNNNNN
q. Press 4Trigger5, SINGLE to make a sweep. Wait for the completion of the sweep.
NNNNNNNNNNNNNNNNNNNN
r. Set the 4396B controls as follows:
Control Settings
Active Channel: CH 1
Data!Memory
Active Channel: CH 2
Data!Memory
Key Strokes
Ch 15
Display5, DATA!MEMORY (A beep indicates that the
4
4
NNNNNNNNNNNNNNNNNNNNNNNNNNNNNNNNNNNNN
trace is stored.)
Ch 25
4Display5, DATA!MEMORY (A beep indicates that the
4
NNNNNNNNNNNNNNNNNNNNNNNNNNNNNNNNNNNNN
trace is stored.)
s. Reverse the cable connections of the 4396B B and R inputs as shown in setup 2 of
Figure 2-16.
t. Press 4Trigger5, SINGLE to make a sweep. Wait for the completion of the sweep.
NNNNNNNNNNNNNNNNNNNN
u. Set the 4396B controls as follows:
Control Settings
Key Strokes
Ch 15
4Display5, DATA MATH [DATA] , DATA+MEM , GAIN ,
4.5, 455, 4x15
Auto Scale
4Scale Ref5, AUTO SCALE
Active Channel: CH 2
4Ch 25
Data Math: G*(DATA+MEM) 4Display5, DATA MATH [DATA] , DATA+MEM , GAIN ,
4.5, 455, 4x15
Auto Scale
4Scale Ref5, AUTO SCALE
Active Channel: CH 1
Data Math: G*(DATA+MEM)
4
NNNNNNNNNNNNNNNNNNNNNNNNNNNNNNNNNNNNNNNNNNNNNNNNNN
NNNNNNNNNNNNNNNNNNNNNNNNNN
NNNNNNNNNNNNNN
NNNNNNNNNNNNNNNNNNNNNNNNNN
NNNNNNNNNNNNNN
NNNNNNNNNNNNNNNNNNNNNNNNNNNNNNNN
NNNNNNNNNNNNNNNNNNNNNNNNNNNNNNNNNNNNNNNNNNNNNNNNNN
NNNNNNNNNNNNNNNNNNNNNNNNNNNNNNNN
v. Press 4Ch 15, 4Search5, MAX and 4Search5, MIN to move the channel 1 marker to the
maximum and minimum points on the trace. Compare the absolute values at the
maximum and minimum points.
NNNNNNNNNNN
NNNNNNNNNNN
Performance Tests
2-47
w. Record the larger value in the performance test record (\Test Result" column for B/R
magnitude ratio of the frequency range 1 MHz to 1.8 GHz).
x. Press 4Ch 25, 4Scale Ref5, ELECTRICAL DELAY MENU , ELECTRICAL DELAY . Then press 4*5
or 4+5 and turn the RPG knob to vary the electrical delay until the trace is in the most
horizontal position.
y. Press PHASE OFFSET and enter the trace mean value using numeric keys. The trace
mean value is displayed as a marker statistic (mean) in the upper right-hand corner of
the display.
z. Press 4Search5, MAX and 4Search5, MIN to move the channel 2 marker to the maximum
and minimum points on the trace. Compare the absolute values at the maximum and
minimum points.
aa. Record the larger value in the performance test record (\Test Result" column for B/R
phase of the frequency range 1 MHz to 1.8 GHz).
NNNNNNNNNNNNNNNNNNNNNNNNNNNNNNNNNNNNNNNNNNNNNNNNNNNNNNNNNNNNNNNNN
NNNNNNNNNNNNNNNNNNNNNNNNNNNNNNNNNNNNNN
NNNNNNNNNNN
2-48
Performance Tests
NNNNNNNNNNN
NNNNNNNNNNNNNNNNNNNNNNNNNNNNNNNNNNNNNNNNNNNNNNNNNN
12. CALIBRATOR AMPLITUDE ACCURACY TEST (SA)
Description
This test uses a power meter and power sensor to measure the actual signal amplitude at 4396B
CAL OUT connector and checks that the level accuracy meets the specication.
Specication
Calibrator accuracy (020 dBm 20MHz)
: : : : : : : : : : : : : : : : : : : : : : : : : : : : : : : : : : : : : : : : : : : : : <60.4 dB
Test Equipment
Power Meter : : : : : : : : : : : : : : : : : : : : : : : : : : : : : : : : : : : : : : : : : : : : : : : : : : : : : 436A Opt. 022, 437B, or 438A
Power Sensor : : : : : : : : : : : : : : : : : : : : : : : : : : : : : : : : : : : : : : : : : : : : : : : : : : : : : : : : : : : : : : : : : : : : : : : : : : : : : : 8482A
N(f)-BNC(m) adapter : : : : : : : : : : : : : : : : : : : : : : : : : : : : : : : : : : : : : : : : : : : : : : : : : : : : : : : : : : : : : : PN 1250-1477
Procedure
1. Connect the power sensor to the power meter. Calibrate the power meter for the power
sensor.
2. Connect the test equipment as shown in Figure 2-18.
Figure 2-18. Calibrator Amplitude Accuracy Test Setup
3. Wait for the power meter reading to settle. Then record the power meter reading in the
performance test record (\Test Result" column).
Performance Tests
2-49
13. DISPLAYED AVERAGE NOISE LEVEL TEST (SA)
Description
This test uses the 4396B marker statistics function to measure the displayed average noise level
in the 4396B spectrum analyzer mode when the 4396B S input is terminated.
In this test, the noise level (trace mean value) is measured in linear format [Watt]. Then the
measured values are converted to log magnitude format [dBm]. This is done to avoid skewing
the data with the marker statistics function.
Specication
Displayed average noise level
@frequency10 MHz, ref. level 040 dBm, att.=0 dB : : : : : : : : <[ 0150+3f(GHz) ] dBm/Hz
@10 kHz frequency <10 MHz, ref. level 040 dBm, att.=0 dB : : : : : : : : : : <0125 dBm/Hz
Test Equipment
50
termination, type-N(m) : : : : : : : : : : : : : : : : : : : : : : : : : : : : : : : : : : : : 909C Opt 012 or part of 85032B
Procedure
1. Connect the test equipment as shown in Figure 2-19.
Figure 2-19. Average Noise Level Test Setup
2. Press 4Meas5, ANALYZER TYPE , SPECTRUM ANALYZER , 4Preset5 to initialize the 4396B. Then set
the controls as follows:
NNNNNNNNNNNNNNNNNNNNNNNNNNNNNNNNNNNNNNNNN
Control Settings
NNNNNNNNNNNNNNNNNNNNNNNNNNNNNNNNNNNNNNNNNNNNNNNNNNNNN
Reference Value: 040 dBm
Input Att.: 0 dB
2-50
Performance Tests
Key Strokes
Scale Ref5, REFERENCE VALUE 4-5, 445, 405, 4x15
4Scale Ref5, ATTEN , 405, 4x15
4
NNNNNNNNNNNNNNNNNNNNNNNNNNNNNNNNNNNNNNNNNNNNNNN
NNNNNNNNNNNNNNNNN
Unit: WATT
Statistics: ON
Format5, WATT
4Utility5, STATISTICS on OFF (Then the softkey label
4
NNNNNNNNNNNNNN
NNNNNNNNNNNNNNNNNNNNNNNNNNNNNNNNNNNNNNNNNNNNNNNNNNNNN
NNNNNNNNNNNNNNNNNNNNNNNNNNNNNNNNNNNNNNNNNNNNNNNNNNNNN
changes to STATISTICS ON off .)
3. Set the controls as follows. (This sets the center frequency, frequency span, and RBW to the
rst settings listed in Table 2-13).
Control Settings
Center Frequency: 10 kHz
RBW: 10 Hz
Frequency Span: 100 Hz
Key Strokes
Center5, 415, 405, 4k/m5
4Bw/Avg5, RES BW , 415, 405, 4x15
4Span5, 415, 405, 405, 4x15
4
NNNNNNNNNNNNNNNNNNNN
Table 2-13. Displayed Average Noise Level Test Settings
4396B
Center Frequency RBW Frequency Span
10 kHz
100 kHz
1 MHz
10 MHz
100 MHz
500 MHz
1.0 GHz
1.4 GHz
1.8 GHz
10 Hz
10 kHz
10 kHz
10 kHz
10 kHz
10 kHz
10 kHz
10 kHz
10 kHz
100 Hz
1 Hz
1 Hz
1 Hz
1 Hz
1 Hz
1 Hz
1 Hz
1 Hz
4. Press 4Trigger5, SINGLE to make a sweep. Wait for the completion of the sweep.
NNNNNNNNNNNNNNNNNNNN
5. Record the 4396B trace mean value [Unit] in the calculation sheet (\Trace Mean [Unit]"
column). The trace mean value is displayed as a marker statistic (mean) in the upper
right-hand corner of the display.
6. Change the center frequency, frequency span, and RBW settings in accordance with
Table 2-13. Then repeat steps 4 and 5 for each setting.
7. Convert the unit of the test results from [Watt] to [dBm] using the equation given in the
calculation sheet. Record the test results [dBm] in the performance test record.
Performance Tests
2-51
14. AMPLITUDE FIDELITY TEST (SA)
Description
This test checks the 4396B amplitude delity at RBWs of 10 kHz and 1 MHz. A 50 MHz CW
signal is applied to the 4396B S input through a step attenuator. The signal amplitude is varied
by inserting known attenuation values. Each signal amplitude [dB] is measured to a reference
value at the attenuator setting of 0 dB. Then the measured values are compared with to the
inserted attenuation's calibrated values.
The amplitude delity performance at RBWs 3 kHz are not tested in this test. The error
sources at RBW 3 kHz are exactly same as those of the magnitude ratio dynamic accuracy in
the 4396B network analyzer mode. Because the dynamic accuracy is tested in the Magnitude
Ratio/Phase Dynamic Accuracy Test, the delity test at the RBW 3 kHz is omitted.
The amplitude delity performance at low signal levels are not tested in this test. That is, the
delity is not checked at signal levels 060 dB (from the reference level) at an RBW of 10 kHz
and at signal levels 050 dB (from the reference level) at an RBW of 1 MHz. These tests are
not necessary because the delity performance at these levels are theoretically determined by
the delity at higher signal levels and the delity at an RBW of 3 kHz.
Two 6 dB xed attenuators with a VSWR of 1.015 are connected to the signal generator
output connector and the 4396B S input, respectively. These xed attenuators are used to
reduce the measurement uncertainties caused by mismatch error. When they are used, the
measurement uncertainties listed in the performance test record are valid.
Specication
Amplitude delity
Log scale
Range
(dB from Ref. Level)
0 dB range 030 dB
030 dB > range 040 dB
040 dB > range 050 dB
050 dB > range 060 dB
060 dB > range 070 dB
070 dB > range 080 dB
1 : @2365 C, 010 dBm [
@1 Hz RBW 3 kHz
60.05 dB
60.07 dB
60.12 dB
60.4 dB
61.2 dB
64 dB
0
ref. level
input att
Amplitude Fidelity1
@10 kHz RBW 300 kHz @1 MHz RBW 3 MHz
60.3 dB
60.3 dB
60.4 dB
60.7 dB
61.5 dB
64.3 dB
61.0 dB
61.0 dB
61.2 dB
61.4 dB
62.2 dB
{
] 050 dBm except for gain compression
Test Equipment
Signal Generator : : : : : : : : : : : : : : : : : : : : : : : : : : : : : : : : : : : : : : : : : : : : : : : : : : : : : : : : : : : : : : : : 8663A or 8642B
Step Attenuator1 , 10 dB step, VSWR 1.02 : : : : : : : : : : : : : : : : : : : : : 8496A/G Option 001 and H60
Attenuator Driver2 : : : : : : : : : : : : : : : : : : : : : : : : : : : : : : : : : : : : : : : : : : : : : : : : : : : : : : : : : : : : : : : : : : : : : : : 11713A
N(m)-N(m) cable, 61 cm (two required) : : : : : : : : : : : : : : : : : : : : : : : : : : : : : : : 11500B or part of 11851B
BNC(m)-BNC(m) cable, 122 cm : : : : : : : : : : : : : : : : : : : : : : : : : : : : : : : : : : : : : : : : : : : : : : : : : : : : PN 8120-1840
6 dB Fixed Attenuation (two required) : : : : : : : : : : : : : : : : : : : : : : : : : : : : : : 8491A Opt 006 & Opt H60
1: Calibration values for attenuation settings of 10 dB to 60 dB at 50 MHz are required.
2: Required when using a programmable step attenuator 8496G.
2-52
Performance Tests
Procedure
1. Record the step attenuator 50 MHz calibration values in the calculation sheet (\Calibration
Value" column).
2. Initialize the signal generator. Then set the controls as follows:
Controls
Settings
Frequency
50 MHz
Amplitude
+2 dBm
3. Connect the test equipment as shown in Figure 2-20.
Note
Connect the signal generator's 10 MHz frequency reference output to the
4396B EXT REF Input on the rear panel as shown in Figure 2-20. With this
conguration, both the signal generator and the 4396B are phase locked to the
same reference frequency to obtain a stable measurement.
Figure 2-20. Amplitude Fidelity Test Setup
4. Press 4Meas5, ANALYZER TYPE , SPECTRUM ANALYZER , 4Preset5 to initialize the 4396B. Then
set the controls as follows:
NNNNNNNNNNNNNNNNNNNNNNNNNNNNNNNNNNNNNNNNN
NNNNNNNNNNNNNNNNNNNNNNNNNNNNNNNNNNNNNNNNNNNNNNNNNNNNN
Control Settings
Center Frequency: 50 MHz
Reference Level: 010 dBm
Input Att.: 10 dB
Key Strokes
Center5, 455, 405, 4M/5
4Scale Ref5, REFERENCE VALUE , 4-5, 415, 405, 4x15
4Scale Ref5, ATTEN , 415, 405, 4x15
4
NNNNNNNNNNNNNNNNNNNNNNNNNNNNNNNNNNNNNNNNNNNNNNN
NNNNNNNNNNNNNNNNN
5. Set the 4396B controls as follows to measure the amplitude delity at RBW 10 kHz.
Control Settings
Frequency Span: 1 MHz
RBW: 10 kHz
VBW: 300 Hz
Key Strokes
Span5, 415, 4M/5
4Bw/Avg5, RES BW , 415, 405, 4k/m5
4Bw/Avg5, VIDEO BW , 435, 405, 405, 4x15
4
NNNNNNNNNNNNNNNNNNNN
NNNNNNNNNNNNNNNNNNNNNNNNNN
Performance Tests
2-53
6. Set the step attenuator to 0 dB.
7. On the 4396B, press 4Search5, MAX to move the marker to the peak of the carrier.
NNNNNNNNNNN
8. On the signal generator, adjust the amplitude until the 4396B marker reads 010 dB 60.1
dB.
9. On the 4396B, press 4Trigger5, SINGLE to make a sweep. Wait for the completion of the
sweep.
10. Press 4Search5, MAX , 4Marker5, 1MODE MENU , FIXED 1MKR to place the delta reference marker
on the peak of the carrier (reference level of the amplitude delity).
11. Set the step attenuator to the rst setting 10 dB in the second column of Table 2-14.
NNNNNNNNNNNNNNNNNNNN
NNNNNNNNNNNNNNNNNNNNNNNNNNNNNNNN
NNNNNNNNNNN
NNNNNNNNNNNNNNNNNNNNNNNNNNNNNNNN
Table 2-14. Amplitude Fidelity Test Settings 1
dB from
Step Attenuator
Reference Level
10 dB
010 dB
20 dB
020 dB
30 dB
030 dB
040 dB
40 dB
050 dB
50 dB
060 dB
60 dB
12. Perform the following steps to measure the amplitude delity.
a. Press 4Trigger5, SINGLE to make a sweep. Wait for the completion of the sweep.
b. Press 4Search5, MAX .
c. Record the delta marker reading in the calculation sheet for the amplitude delity at an
RBW of 10 kHz. Use the \4396B Reading" column corresponding to the dB from the
reference level in the rst column of Table 2-14.
13. Change the step attenuator setting in accordance with the second column of Table 2-14.
Then perform step 12 for each setting.
14. Set the 4396B controls as follows to measure the amplitude delity at RBW 1 MHz.
NNNNNNNNNNNNNNNNNNNN
NNNNNNNNNNN
Control Settings
Frequency Span: 50 MHz
RBW: 1 MHz
VBW: 30 kHz
Trigger: CONTINUOUS
Key Strokes
Span5, 455, 405, 4M/5
4Bw/Avg5, RES BW , 415, 4M/5
4Bw/Avg5, VIDEO BW , 435, 405, 4k/m5
4Trigger5, CONTINUOUS
4
NNNNNNNNNNNNNNNNNNNN
NNNNNNNNNNNNNNNNNNNNNNNNNN
NNNNNNNNNNNNNNNNNNNNNNNNNNNNNNNN
15. Set the step attenuator to 0 dB.
16. On the 4396B, press 4Marker5, 1MODE MENU , 1MODE OFF , 4Search5, MAX to move the marker to
the peak of the carrier.
17. On the signal generator, adjust the amplitude until the 4396B marker reads 010 dB 60.1
dB.
18. On the 4396B, press 4Trigger5, SINGLE to make a sweep. Wait for the completion of the
sweep.
19. Press 4Search5, MAX , 4Marker5, 1MODE MENU , FIXED 1MKR to place the delta reference marker
on the peak of the carrier (reference level of the amplitude delity).
NNNNNNNNNNNNNNNNNNNNNNNNNNNNNNNN
NNNNNNNNNNNNNNNNNNNNNNNNNNNNN
NNNNNNNNNNNNNNNNNNNN
NNNNNNNNNNN
2-54
Performance Tests
NNNNNNNNNNNNNNNNNNNNNNNNNNNNNNNN
NNNNNNNNNNNNNNNNNNNNNNNNNNNNNNNN
NNNNNNNNNNN
20. Set the step attenuator to the rst setting 10 dB in the second column of Table 2-15.
Table 2-15. Amplitude Fidelity Test Settings 2
dB from
Step Attenuator
Reference Level
010 dB
10 dB
020 dB
20 dB
030 dB
30 dB
040 dB
40 dB
50 dB
050 dB
21. Perform the following steps to measure the amplitude delity.
a. Press 4Trigger5, SINGLE to make a sweep. Wait for the completion of the sweep.
b. Press 4Search5, MAX .
c. Record the delta marker reading in the calculation sheet for the amplitude delity
at an RBW of 1 MHz. Use the \4396B Reading" column corresponding to the dB from
reference level in the rst column of Table 2-15.
22. Change the step attenuator setting in accordance with the second column of Table 2-15.
Then perform step 21 for each setting.
23. Calculate the test results using the equations given in the calculation sheet. Record the test
results in the performance test record.
NNNNNNNNNNNNNNNNNNNN
NNNNNNNNNNN
Performance Tests
2-55
15. INPUT ATTENUATOR SWITCHING UNCERTAINTY TEST
(SA)
Description
This test measures the 4396B input attenuator switching uncertainty over the entire range
from 10 dB to 60 dB. The switching uncertainty is referenced to the 10 dB attenuator setting.
In this test, a 50 MHz CW signal is applied to the 4396B S input through a step attenuator. The
signal amplitude is measured at each 4396B input attenuator setting. At each measurement,
the other measurement conditions are kept constant to measure the switching uncertainty
exclusively. The applied signal level is controlled using the step attenuator so as to keep the
signal level input to the rst mixer (the internal circuit stage following the input attenuator)
constant. For example, the step attenuator is decreased by 10 dB, when the 4396B input
attenuator is increased by 10 dB. The 4396B reference level is set to the value of the input
attenuator setting 0 50 dB. This keeps the 4396B internal IF gain constant.
Two 6 dB xed attenuators with a VSWR of 1.015 are connected to the signal generator
output connector and the 4396B S input, respectively. These xed attenuators are used to
reduce the measurement uncertainties caused by mismatch error. When they are used, the
measurement uncertainties listed in the performance test record are valid.
Specication
A input attenuator switching uncertainty
@20 dB to 40 dB, referenced to 10 dB : : : : : : : : : : : : : : : : : : : : : : : : : : : : : : : : : : : : : : : : : : : : : :<61.0 dB
@50 dB to 60 dB, referenced to 10 dB : : : : : : : : : : : : : : : : : : : : : : : : : : : : : : : : : : : : : : : : : : : : : :<61.5 dB
Test Equipment
Signal Generator : : : : : : : : : : : : : : : : : : : : : : : : : : : : : : : : : : : : : : : : : : : : : : : : : : : : : : : : : : : : : : : : 8663A or 8642B
Step Attenuator1 , 10 dB step, VSWR 1.02 : : : : : : : : : : : : : : : : : : : : : 8496A/G Option 001 and H60
Attenuator driver2 : : : : : : : : : : : : : : : : : : : : : : : : : : : : : : : : : : : : : : : : : : : : : : : : : : : : : : : : : : : : : : : : : : : : : : : 11713A
N(m)-N(m) cable, 61 cm (two required) : : : : : : : : : : : : : : : : : : : : : : : : : : : : : : : 11500B or part of 11851B
BNC(m)-BNC(m) cable, 122 cm : : : : : : : : : : : : : : : : : : : : : : : : : : : : : : : : : : : : : : : : : : : : : : : : : : : : PN 8120-1840
6 dB Fixed Attenuation (two required) : : : : : : : : : : : : : : : : : : : : : : : : : : : : : : 8491A Opt 006 & Opt H60
1: Calibration values for attenuation settings of 10 dB to 50 dB at 50 MHz are required.
2: Required when using a programmable step attenuator 8496G.
Procedure
1. Record the step attenuator 50 MHz calibration values in the calculation sheet (\Calibration
Value" column).
2. Set the step attenuator to 50 dB.
3. On the signal generator, initialize the signal generator. Then set the controls as follows:
Controls
Settings
Frequency
50 MHz
Amplitude
+12 dBm
4. Connect the test equipment as shown in Figure 2-21.
2-56
Performance Tests
Note
Connect the signal generator's 10 MHz frequency reference output to the
4396B EXT REF Input on the rear panel as shown in Figure 2-21. With this
conguration, both the signal generator and the 4396B are phase locked to the
same reference frequency to obtain a stable measurement.
Figure 2-21. Input Attenuator Accuracy Test Setup
5. Press 4Meas5, ANALYZER TYPE , SPECTRUM ANALYZER , 4Preset5 to initialize the 4396B. Then
set the controls as follows:
NNNNNNNNNNNNNNNNNNNNNNNNNNNNNNNNNNNNNNNNN
NNNNNNNNNNNNNNNNNNNNNNNNNNNNNNNNNNNNNNNNNNNNNNNNNNNNN
Control Settings
Center Frequency: 50 MHz
Frequency Span: 10 kHz
RBW: 1 kHz
Scale/Division: 5 dB/Div
Key Strokes
Center5, 455, 405, 4M/5
Span5, 415, 405, 4k/m5
4Bw/Avg5, RES BW , 415, 4k/m5
4Scale Ref5, SCALE/DIV , 455, 4x15
4
4
NNNNNNNNNNNNNNNNNNNN
NNNNNNNNNNNNNNNNNNNNNNNNNNNNN
6. Press 4Scale Ref5, REFERENCE VALUE , 4-5, 445, 405, 4x15, 4Scale Ref5, ATTEN , 415, 405, 4x15, to set the
4396B controls to the reference setting for the test.
7. Press 4Trigger5, SINGLE to make a sweep. Wait for the completion of the sweep.
NNNNNNNNNNNNNNNNN
NNNNNNNNNNNNNNNNNNNNNNNNNNNNNNNNNNNNNNNNNNNNNNN
NNNNNNNNNNNNNNNNNNNN
8. Press 4Search5, MAX , 4Marker5, 1MODE MENU , FIXED 1MKR to place the delta reference marker
on the peak of the carrier.
9. Set the 4396B controls as follows. This sets the input attenuator and reference level to the
rst settings listed in Table 2-16.
NNNNNNNNNNN
Control Settings
NNNNNNNNNNNNNNNNNNNNNNNNNNNNNNNN
Input Att.: 20 dB
Reference Level: 030 dBm
NNNNNNNNNNNNNNNNNNNNNNNNNNNNNNNN
Key Strokes
Scale Ref5, ATTEN , 425, 405, 4x15
4Scale Ref5, REFERENCE VALUE , 4-5, 435, 405, 4x15
4
NNNNNNNNNNNNNNNNN
NNNNNNNNNNNNNNNNNNNNNNNNNNNNNNNNNNNNNNNNNNNNNNN
Performance Tests
2-57
Table 2-16. Input Attenuator Switching Uncertainty Test Settings
4396B
Step Attenuator
Input Attenuator Reference Level
40 dB
20 dB
030 dBm
30 dB
30 dB
020 dBm
20 dB
40 dB
010 dBm
50 dB
60 dB
0 dBm
+10 dBm
10 dB
0 dB
10. Set the step attenuator to the rst setting (40 dB) listed in the third column of Table 2-16.
11. Perform the following steps to measure the input attenuator switching uncertainty.
a. Press 4Trigger5, SINGLE to make a sweep. Wait for the completion of the sweep.
b. Press 4Search5, MAX .
c. Record the delta marker reading in the calculation sheet (\4396B Reading" column).
12. Change the 4396B input attenuator setting, the reference level setting, and the step
attenuator setting in accordance with Table 2-16. Repeat step 11 for each setting.
13. Calculate the test results using the equation given in the calculation sheet. Record the test
results in the performance test record.
NNNNNNNNNNNNNNNNNNNN
NNNNNNNNNNN
2-58
Performance Tests
16. RESOLUTION BANDWIDTH ACCURACY/SELECTIVITY TEST
(SA)
Description
This test measures the 3 dB/60 dB bandwidth and calculates the selectivity at resolution
bandwidth (RBW) settings 10 kHz and checks the performance meets the specication.
The bandwidth accuracy and selectivity for resolution bandwidth settings 3 kHz are not
tested because the 4396B uses a digital lter technique on RBW settings 3 kHz. Therefore,
the bandwidth accuracy and selectivity can be calculated mathematically. The calculated
uncertainty is within the specication.
Specication
Resolution bandwidth (RBW)
Accuracy
@RBW 10 kHz : : : : : : : : : : : : : : : : : : : : : : : : : : : : : : : : : : : : : : : : : : : : : : : : : : : : : : : : : : : : : : : : : : : : : <620%
@RBW 3 kHz : : : : : : : : : : : : : : : : : : : : : : : : : : : : : : : : : : : : : : : : : : : : : : : : : : : : : : : : : : : : : : : : : : : : : <610%
Selectivity (60 dB BW / 3 dB BW)
@RBW 10 kHz : : : : : : : : : : : : : : : : : : : : : : : : : : : : : : : : : : : : : : : : : : : : : : : : : : : : : : : : : : : : : : : : : : : : : : : : :<10
@RBW 3 kHz : : : : : : : : : : : : : : : : : : : : : : : : : : : : : : : : : : : : : : : : : : : : : : : : : : : : : : : : : : : : : : : : : : : : : : : : : : <3
Test Equipment
Signal Generator : : : : : : : : : : : : : : : : : : : : : : : : : : : : : : : : : : : : : : : : : : : : : : : : : : : : : : : : : : : : : : : : 8663A or 8642B
N(m)-N(m) cable, 61 cm : : : : : : : : : : : : : : : : : : : : : : : : : : : : : : : : : : : : : : : : : : : : : : : 11500B or part of 11851B
BNC(m)-BNC(m) cable, 122 cm : : : : : : : : : : : : : : : : : : : : : : : : : : : : : : : : : : : : : : : : : : : : : : : : : : : : PN 8120-1840
Procedure
1. Connect the test equipment as shown in Figure 2-22.
Note
Connect the signal generator's 10 MHz frequency reference output to the
4396B EXT REF Input on the rear panel as shown in Figure 2-22. With this
conguration, both the signal generator and the 4396B are phase locked to the
same reference frequency to obtain a stable measurement.
Performance Tests
2-59
Figure 2-22. RBW Accuracy and Selectivity Test Setup
2. Initialize the signal generator. Then set the controls as follows:
Controls
Settings
Frequency
Amplitude
20 MHz
020 dBm
3. Press 4Meas5, ANALYZER TYPE , SPECTRUM ANALYZER , 4Preset5 to initialize the 4396B. Then set
the controls as follows:
NNNNNNNNNNNNNNNNNNNNNNNNNNNNNNNNNNNNNNNNN
NNNNNNNNNNNNNNNNNNNNNNNNNNNNNNNNNNNNNNNNNNNNNNNNNNNNN
Control Settings
Center Frequency: 20 MHz
Reference Level: 015 dBm
4.
Key Strokes
Center5, 425, 405, 4M/5
Scale Ref5, REFERENCE VALUE , 4-5, 415, 455, 4x15
4
NNNNNNNNNNNNNNNNNNNNNNNNNNNNNNNNNNNNNNNNNNNNNNN
4
|Resolution Bandwidth Accuracy Test|
a. Press 4Scale Ref5, SCALE/DIV , 415, 4x15 to set the scale appropriately.
NNNNNNNNNNNNNNNNNNNNNNNNNNNNN
b. Set the 4396B controls as follows. This sets the RBW and frequency span to the rst
settings listed in Table 2-17.
Control Settings
RBW: 10 kHz
Frequency Span: 30 kHz
2-60
Performance Tests
Key Strokes
Bw/Avg5, RES BW , 415, 405, 4k/m5
4Span5, 435, 405, 4k/m5
NNNNNNNNNNNNNNNNNNNN
4
Table 2-17. RBW Accuracy Test Settings
4396B
RBW Frequency Span
10 kHz
30 kHz
100 kHz
300 kHz
1 MHz
3 MHz
30 kHz
90 kHz
300 kHz
900 kHz
3 MHz
9 MHz
c. Perform the following steps to measure the RBW accuracy:
i. Press 4Trigger5, SINGLE to make a sweep. Wait for the completion of the sweep.
ii. Press 4Search5, MAX , 4Marker5, 1MODE MENU , FIXED 1MKR to place the delta marker
reference at the peak of the carrier.
iii. Rotate the RPG knob to move the delta marker to lower frequency points until the
delta marker reads 03 dB 6 0.1 dB.
iv. Press 4Marker5, 1MODE MENU , FIXED 1MKR to place the delta marker reference at the
lower 3 dB frequency.
v. Rotate the RPG knob to move the delta marker to higher frequency points beyond the
peak of the signal until the delta marker reads 0 dB 6 0.1 dB.
vi. Record the delta marker frequency reading in the performance test record (\Test
Result" column for the resolution bandwidth accuracy).
d. Change the 4396B RBW and frequency span settings in accordance with Table 2-17, and
repeat step 4-c for each setting.
NNNNNNNNNNNNNNNNNNNN
NNNNNNNNNNN
NNNNNNNNNNNNNNNNNNNNNNNNNNNNNNNN
5.
NNNNNNNNNNNNNNNNNNNNNNNNNNNNNNNN
NNNNNNNNNNNNNNNNNNNNNNNNNNNNNNNN
NNNNNNNNNNNNNNNNNNNNNNNNNNNNNNNN
|Resolution Bandwidth Selectivity Test|
a. Copy the test results of the RBW accuracy to the calculation sheet (\3dB Bandwidth"
column for the RBW selectivity).
b. Set the 4396B controls as follows.
Control Settings
Scale/Division: 10 dB/Div
VBW: 10 kHz
Key Strokes
Scale Ref5, SCALE/DIV , 415, 405, 4x15
4Bw/Avg5, VIDEO BW , 415, 405, 4k/m5
4
NNNNNNNNNNNNNNNNNNNNNNNNNNNNN
NNNNNNNNNNNNNNNNNNNNNNNNNN
c. Set the 4396B controls as follows. This sets the RBW, span, and input attenuator settings
to the rst settings listed in Table 2-18.
Control Settings
RBW: 10 kHz
Frequency Span: 200 kHz
Input Att.: 10 dB
Key Strokes
Bw/Avg5, RES BW , 415, 405, 4k/m5
4Span5, 425, 405, 405, 4k/m5
4Scale Ref5, ATTEN , 415, 405, 4x15
4
NNNNNNNNNNNNNNNNNNNN
NNNNNNNNNNNNNNNNN
Performance Tests
2-61
Table 2-18. RBW Selectivity Test Settings
4396B
RBW Frequency Span Input Attenuator
10 kHz
30 kHz
100 kHz
300 kHz
1 MHz
3 MHz
200 kHz
600 kHz
2 MHz
6 MHz
20 MHz
30 MHz
10 dB
10 dB
10 dB
10 dB
0 dB
0 dB
d. Perform the following steps to measure the RBW selectivity.
i. Press 4Trigger5, SINGLE to make a sweep. Wait for the completion of the sweep.
ii. Press 4Search5, MAX , 4Marker5, 1MODE MENU , FIXED 1MKR to place the delta marker
reference at the peak of the carrier.
iii. Rotate the RPG knob to move the delta marker to lower frequency points until the
delta marker reads between 060 dB and 060.8 dB.
iv. Press 4Marker5, 1MODE MENU , FIXED 1MKR to place the delta marker reference at the
lower 60 dB frequency.
v. Rotate the RPG knob to move the delta marker to higher frequency points beyond the
peak frequency until the delta marker reads between 0 dB and 00.8 dB.
vi. Record the delta marker frequency in the calculation sheet (\60 dB Bandwidth"
column for the RBW selectivity).
e. Change the RBW, the frequency span, and the input attenuator in accordance with
Table 2-18. Repeat step 5-d for each setting.
f. Calculate the test results for the RBW selectivity using the equation given in the
calculation sheet. Record the test results in the performance test record.
NNNNNNNNNNNNNNNNNNNN
NNNNNNNNNNN
NNNNNNNNNNNNNNNNNNNNNNNNNNNNNNNN
2-62
Performance Tests
NNNNNNNNNNNNNNNNNNNNNNNNNNNNNNNN
NNNNNNNNNNNNNNNNNNNNNNNNNNNNNNNN
NNNNNNNNNNNNNNNNNNNNNNNNNNNNNNNN
17. RESOLUTION BANDWIDTH SWITCHING UNCERTAINTY
TEST (SA)
Description
This test measures the 4396B spectrum amplitude measurement uncertainty caused by
switching the resolution bandwidth (RBW) setting. The uncertainty is tested for switching the
RBW from 3 kHz to each RBW 10 kHz.
The uncertainty of switching the RBW between any two RBWs 3 kHz is not tested. This
is because the 4396B uses a digital lter technique on RBW settings 3 kHz. Therefore,
the uncertainty can be calculated mathematically. The calculated uncertainty is within the
specication.
Specication
RBW switching uncertainty
@SPAN<100 2 RBW for RBW10 kHz, 2365 C, referenced to 10 kHz RBW
: : : : : : <60.5 dB
Test Equipment
BNC(m)-BNC(m) cable, 61 cm : : : : : : : : : : : : : : : : : : : : : : : : : : : : : : : : : : : : : : : : : : : : : : : : : : : : : PN 8120-1839
N(m)-BNC(f) adapter : : : : : : : : : : : : : : : : : : : : : : : : : : : : : : : : : : : : : : : : : : : : : : : : : : : : : : : : : : : : : : PN 1250-1476
Procedure
1. Connect the test equipment as shown in Figure 2-23.
Figure 2-23. RBW Switching Uncertainty Test Setup
Performance Tests
2-63
2. Press 4Meas5, ANALYZER TYPE , SPECTRUM ANALYZER , 4Preset5 to initialize the 4396B. Then set
the controls as follows:
NNNNNNNNNNNNNNNNNNNNNNNNNNNNNNNNNNNNNNNNN
NNNNNNNNNNNNNNNNNNNNNNNNNNNNNNNNNNNNNNNNNNNNNNNNNNNNN
Control Settings
Center Frequency: 20 MHz
Reference Level: 018 dBm
Scale/Division: 1 dB/Div
Key Strokes
Center5, 425, 405, 4M/5
4Scale Ref5, REFERENCE VALUE , 4-5, 415, 485, 4x15
4Scale Ref5, SCALE/DIV , 415, 4x15
4
NNNNNNNNNNNNNNNNNNNNNNNNNNNNNNNNNNNNNNNNNNNNNNN
NNNNNNNNNNNNNNNNNNNNNNNNNNNNN
3. Set the 4396B controls as follows. This sets the 4396B RBW to the reference 10 kHz of the
RBW switching uncertainty test.
Control Settings
RBW: 10 kHz
Frequency Span: 100 kHz
Key Strokes
Bw/Avg5, RES BW , 415, 405, 4k/m5
4Span5, 415, 405, 405, 4k/m5
4
NNNNNNNNNNNNNNNNNNNN
4. Press 4Trigger5, SINGLE to make a sweep. Wait for the completion of the sweep.
NNNNNNNNNNNNNNNNNNNN
5. Press 4Search5, MAX , 4Marker5, 1MODE MENU , FIXED 1MKR to place the delta marker reference
at the peak of the carrier.
6. Set the 4396B controls as follows. This sets the RBW and the frequency span to the rst
settings listed in Table 2-19.
NNNNNNNNNNNNNNNNNNNNNNNNNNNNNNNN
NNNNNNNNNNN
Control Settings
RBW: 3 kHz
Frequency Span: 30 kHz
NNNNNNNNNNNNNNNNNNNNNNNNNNNNNNNN
Key Strokes
Bw/Avg5, RES BW , 435, 4k/m5
4Span5, 435, 405, 4k/m5
4
NNNNNNNNNNNNNNNNNNNN
Table 2-19. RBW Switching Uncertainty Test Settings
4396B
RBW Frequency Span
3 kHz
30 kHz
100 kHz
300 kHz
1 MHz
3 MHz
30 kHz
300 kHz
1 MHz
3 MHz
10 MHz
30 MHz
7. Perform the following steps to measure the RBW switching uncertainty:
a. Press 4Trigger5, SINGLE to make a sweep. Wait for the completion of the sweep.
b. Press 4Search5, MAX to move the delta marker to the peak of the carrier.
c. Record the delta marker reading in the performance test record (\Test Result" column).
8. Change the 4396B RBW and frequency span in accordance with Table 2-19. Repeat step 7
for each setting.
NNNNNNNNNNNNNNNNNNNN
NNNNNNNNNNN
2-64
Performance Tests
18. IF GAIN SWITCHING UNCERTAINTY TEST (SA)
Description
The IF gain is the total gain of the internal path of the IF signal within the 4396B. The 4396B
has twelve IF gain settings from 0 dB to 40 dB. The IF gain is automatically set to the setting
determined by the selected reference level and input attenuator settings.
This test measures the 4396B spectrum amplitude measurement uncertainty caused by
changing the IF gain settings over the entire range. The switching uncertainty is referenced to
the IF gain setting at a reference level of 010 dBm and an input attenuator setting of 10 dB.
In this test, a 50 MHz CW signal is applied to the 4396B S input through two step attenuators:
a 1 dB step and a 10 dB step attenuator. The signal amplitude is measured at several
4396B reference level settings (where the IF gain is varied over the entire range). At each
measurement, the internal measurement settings (other than the IF gain) are kept constant to
measure the switching uncertainty exclusively.
To do this, the input attenuator setting is xed to 10 dB. The applied signal level is controlled
using the step attenuators so as to keep the signal level input to the A/D converter (internal
circuit following the IF signal path) constant. For example, when the reference level is
decreased by 2 dB (while the IF gain setting is increased by 2 dB), the measured signal level is
decreased by 2 dB through the two step attenuators whose total attenuation is increased by 2
dB.
Two 6 dB xed attenuators with a VSWR of 1.015 are connected to the signal generator
output connector and the 4396B S input, respectively. These xed attenuators are used to
reduce the measurement uncertainties caused by mismatch error. When they are used, the
measurement uncertainties listed in the performance test record are valid.
Specication
IF gain switching uncertainty
@ input att. xed, referenced to 020 dBm [ref. level 0 input att ] : : : : : : : : : : : : : : : <60.3 dB
Test Equipment
Signal Generator : : : : : : : : : : : : : : : : : : : : : : : : : : : : : : : : : : : : : : : : : : : : : : : : : : : : : : : : : : : : : : : : 8663A or 8642B
Step Attenuator1, 10 dB step, VSWR 1.02 : : : : : : : : : : : : : : : : : : : : : 8496A/G Option 001 and H60
Step Attenuator2, 1 dB step, VSWR 1.02 : : : : : : : : : : : : : : : : : : : : : : : 8494A/G Option 001 and H60
Attenuator driver3 : : : : : : : : : : : : : : : : : : : : : : : : : : : : : : : : : : : : : : : : : : : : : : : : : : : : : : : : : : : : : : : : : : : : : : : 11713A
6 dB Fixed Attenuation : : : : : : : : : : : : : : : : : : : : : : : : : : : : : : : : : : : : : : : : : : : : : : 8491A Opt 006 & Opt H60
N(m)-N(m) cable, 61 cm (three required) : : : : : : : : : : : : : : : : : : : : : : : : : : : : : 11500B or part of 11851B
BNC(m)-BNC(m) cable, 122 cm : : : : : : : : : : : : : : : : : : : : : : : : : : : : : : : : : : : : : : : : : : : : : : : : : : : : PN 8120-1840
1: Calibration values for attenuation settings of 10 dB to 50 dB at 50 MHz are required.
2: Calibration values for attenuation settings of 2 dB, 4 dB, 6 dB, 8 dB, and 10 dB at 50 MHz are
required.
3: Required when using a programmable step attenuator of the 8494G and the 8496G.
Performance Tests
2-65
Procedure
1. Record the 50 MHz calibration values of the 1 dB step attenuator and the 10 dB step
attenuator in the calculation sheet (\Calibration Value" column).
2. Set the 1 dB step attenuator to 10 dB. Set the 10 dB step attenuator to 10 dB.
3. Initialize the signal generator. Then set the controls as follows:
Controls
Settings
Frequency
50 MHz
Amplitude
+6 dBm
4. Connect the test equipment as shown in Figure 2-24.
Note
Connect the signal generator's 10 MHz frequency reference output to the
4396B EXT REF Input on the rear panel as shown in Figure 2-24. With this
conguration, both the signal generator and the 4396B are phase locked to the
same reference frequency to obtain a stable measurement.
Figure 2-24. IF Gain Switching Uncertainty Test Setup
2-66
Performance Tests
5. Press 4Meas5, ANALYZER TYPE , SPECTRUM ANALYZER , 4Preset5 to initialize the 4396B. Then
set the controls as follows:
NNNNNNNNNNNNNNNNNNNNNNNNNNNNNNNNNNNNNNNNN
NNNNNNNNNNNNNNNNNNNNNNNNNNNNNNNNNNNNNNNNNNNNNNNNNNNNN
Control Settings
Center Frequency: 50 MHz
Frequency Span: 3 kHz
RBW: 300 Hz
Reference Level: 010 dBm
Scale/Division: 5 dB/Div
Input Att.: MANUAL, 10 dB
Key Strokes
Center5, 455, 405, 4M/5
Span5, 435, 4k/m5
4Bw/Avg5, RES BW , 435, 405, 405, 4x15
4Scale Ref5, REFERENCE VALUE , 4-5, 415, 405, 4x15
4Scale Ref5, SCALE/DIV , 455, 4x15
4Scale Ref5, ATTEN AUTO man (Then the softkey label
changes to ATTEN auto MAN ), ATTEN , 415, 405, 4x15
4
4
NNNNNNNNNNNNNNNNNNNN
NNNNNNNNNNNNNNNNNNNNNNNNNNNNNNNNNNNNNNNNNNNNNNN
NNNNNNNNNNNNNNNNNNNNNNNNNNNNN
NNNNNNNNNNNNNNNNNNNNNNNNNNNNNNNNNNNNNNNNNNNN
NNNNNNNNNNNNNNNNNNNNNNNNNNNNNNNNNNNNNNNNNNNN
NNNNNNNNNNNNNNNNN
6. Press 4Trigger5, SINGLE to make a sweep. Wait for the completion of the sweep.
NNNNNNNNNNNNNNNNNNNN
7. Press 4Search5, MAX , 4Marker5, 1MODE MENU , FIXED 1MKR to place the delta marker reference
at the peak of the carrier.
8. Press 4Scale Ref5, REFERENCE VALUE , 405, 4x15 to set the 4396B reference level to the rst
setting listed in the rst column of Table 2-20.
NNNNNNNNNNN
NNNNNNNNNNNNNNNNNNNNNNNNNNNNNNNN
NNNNNNNNNNNNNNNNNNNNNNNNNNNNNNNN
NNNNNNNNNNNNNNNNNNNNNNNNNNNNNNNNNNNNNNNNNNNNNNN
Table 2-20. IF Gain Switching Uncertainty Test Settings
4396B
1 dB
10 dB
Reference Level Step Attenuator Step Attenuator
0 dB
02 dB
04 dB
06 dB
08 dB
012 dB
014 dB
016 dB
018 dB
020 dB
030 dB
040 dB
0 dB
2 dB
4 dB
6 dB
8 dB
2 dB
4 dB
6 dB
8 dB
10 dB
10 dB
10 dB
10 dB
10 dB
10 dB
10 dB
10 dB
20 dB
20 dB
20 dB
20 dB
20 dB
30 dB
40 dB
9. Set the 1 dB step attenuator to the rst setting 0 dB listed in the second column of
Table 2-20.
10. Set the 10 dB step attenuator to the rst setting 10 dB listed in the third column of
Table 2-20.
11. Perform the following steps to measure the IF gain switching uncertainty.
a. Press 4Trigger5, SINGLE to make a sweep. Wait for the completion of the sweep.
b. Press 4Search5, MAX to move the marker to the peak of the carrier.
c. Record the delta marker reading in the calculation sheet (\4396B Reading" column).
12. Change the 4396B reference level, the 1 dB step attenuator, and the 10 dB step attenuator
settings in accordance with Table 2-20. Repeat step 11 for each setting.
NNNNNNNNNNNNNNNNNNNN
NNNNNNNNNNN
Performance Tests
2-67
13. Calculate the test results using the equation given in the calculation sheet. Record the test
results in the performance test record.
2-68
Performance Tests
19. NOISE SIDEBANDS TEST (SA)
Description
This test applies 39 MHz, 10 MHz, 100 MHz, and 1.8 GHz CW frequency signals to the 4396B
S input. Then this measures noise sidebands at osets 61 kHz, 610 kHz, and 61 MHz from
each carrier using a 4396B NOISE FORM function. Using the noise form function and the delta
marker mode, the noise sidebands level is displayed directly in [dBc/Hz].
In this test, the noise sidebands at the 1 kHz oset from the carrier is measured at a 39 MHz
CW frequency signal. The noise sidebands around the 1 kHz oset from the carrier are mainly
determined by the phase noise caused by the fraction N oscillator. The frequency range around
39 MHz is one of the frequencies where the phase noise of the 1 kHz oset is most likely to be
high. Therefore the noise sidebands at the oset 1 kHz is measured only at the 39 MHz CW
frequency signal.
Specication
Noise sidebands
Noise Sidebands1
Oset from Carrier
1 kHz
10 kHz
1 MHz
1 : Center frequency 1 GHz. Add [20log(
frequency(GHz)
<095 dBc/Hz
<0105 dBc/Hz
<0110 dBc/Hz
)] for frequency > 1 GHz.
Test Equipment
Signal Generator : : : : : : : : : : : : : : : : : : : : : : : : : : : : : : : : : : : : : : : : : : : : : : : : : : : : : : : : : : : : : : : : 8663A or 8642B
N(m)-N(m) cable, 61 cm : : : : : : : : : : : : : : : : : : : : : : : : : : : : : : : : : : : : : : : : : : : : : : : 11500B or part of 11851B
BNC(m)-BNC(m) cable, 122 cm : : : : : : : : : : : : : : : : : : : : : : : : : : : : : : : : : : : : : : : : : : : : : : : : : : : : PN 8120-1840
Procedure
1. Initialize the signal generator. Then set the amplitude to 0 dBm.
2. Connect the test equipment as shown in Figure 2-25.
Note
Connect the signal generator's 10 MHz frequency reference output to the
4396B EXT REF Input on the rear panel as shown in Figure 2-25. With this
conguration, both the signal generator and the 4396B are phase locked to the
same reference frequency to obtain a stable measurement.
Performance Tests
2-69
Figure 2-25. Noise Sidebands Test Setup
3. Press 4Meas5, ANALYZER TYPE , SPECTRUM ANALYZER , 4Preset5 to initialize the 4396B. Then
set the controls as follows:
NNNNNNNNNNNNNNNNNNNNNNNNNNNNNNNNNNNNNNNNN
Control Settings
NNNNNNNNNNNNNNNNNNNNNNNNNNNNNNNNNNNNNNNNNNNNNNNNNNNNN
Reference Level: 0 dBm
Noise Form: ON
Key Strokes
Scale Ref5, REFERENCE VALUE , 405, 4x15
4Utility5, NOISE FORM on OFF (Then the softkey label
4
NNNNNNNNNNNNNNNNNNNNNNNNNNNNNNNNNNNNNNNNNNNNNNN
NNNNNNNNNNNNNNNNNNNNNNNNNNNNNNNNNNNNNNNNNNNNNNNNNNNNN
NNNNNNNNNNNNNNNNNNNNNNNNNNNNNNNNNNNNNNNNNNNNNNNNNNNNN
changes to NOISE FORM ON off .)
4. On the signal generator, set the frequency to the rst carrier frequency 39 MHz in
Table 2-21.
Table 2-21. Noise Sideband Test Settings
Signal Generator
4396B
Oset from Carrier
Carrier Frequency Center Frequency RBW VBW Frequency Span
39 MHz
39 MHz 100 Hz 3 Hz
2.5 kHz
61 kHz
10 MHz
10 MHz 1 kHz 10 Hz
25 kHz
610 kHz
2.5 MHz
61 MHz
100 MHz
100 MHz 1 kHz 10 Hz
25 kHz
610 kHz
2.5 MHz
61 MHz
1 GHz
1 GHz 1 kHz 10 Hz
25 kHz
610 kHz
2.5 MHz
61 MHz
1.8 GHz
1.8 GHz 1 kHz 10 Hz
25 kHz
610 kHz
2.5 MHz
61 MHz
2-70
Performance Tests
5. On the 4396B, set the controls as follows (the rst setting in Table 2-21).
Control Settings
Key Strokes
Center Frequency: 39 MHz
4Center5, 435, 495, 4M/5
RBW: 100 Hz
4Bw/Avg5, RES BW , 415, 405, 405, 4x15
VBW: 3 Hz
4Bw/Avg5, VIDEO BW , 435, 4x15
Frequency Span: 2.5 kHz
4Span5, 425, 4.5, 455, 4k/m5
6. Perform the following steps to measure the noise sideband level at 61 kHz oset from the
39 MHz carrier.
a. Press 4Trigger5, SINGLE to make a sweep. Wait for the completion of the sweep.
b. Press 4Search5, MAX , 4Marker5, 1MODE MENU , 1MKR to place the delta marker reference at
the peak of the carrier.
c. Press 4-5, 415, 4k/m5 to move the delta marker to an oset of 01 kHz from the carrier.
d. Record the marker reading in the performance test record.
e. Press 415, 4k/m5 to move the delta marker to an oset of +1 kHz from the carrier.
f. Record the delta marker reading in the performance test record.
7. On the signal generator, set the frequency to the second center frequency 10 MHz in
Table 2-21.
8. On the 4396B, set the controls as follows (the second setting listed in Table 2-21):
NNNNNNNNNNNNNNNNNNNN
NNNNNNNNNNNNNNNNNNNNNNNNNN
NNNNNNNNNNNNNNNNNNNN
NNNNNNNNNNN
Control Settings
NNNNNNNNNNNNNNNNNNNNNNNNNNNNNNNN
Center Frequency: 10 MHz
RBW: 1 kHz
VBW: 10 Hz
NNNNNNNNNNNNNN
Key Strokes
Center5, 415, 405, 4M/5
4Bw/Avg5, RES BW , 415, 4k/m5
4Bw/Avg5, VIDEO BW , 415, 405, 4x15
4
NNNNNNNNNNNNNNNNNNNN
NNNNNNNNNNNNNNNNNNNNNNNNNN
9. Perform the following steps to measure the noise sideband level at 610 kHz and 61 MHz
osets from the carrier of 10 MHz.
a. Press 4Span5, 425, 455, 4k/m5 to set the frequency span to 25 kHz.
b. Press 4Trigger5, SINGLE to make a sweep. Wait for the completion of the sweep.
c. Press 4Search5, MAX , 4Marker5, 1MODE MENU , 1MKR to place the delta marker reference at
the peak of the carrier.
d. Press 4-5, 415, 405, 4k/m5 to move the delta marker at the oset 010 kHz from the carrier.
e. Record the marker reading in the performance test record.
f. Press 415, 405, 4k/m5 to move the delta marker at the oset +10 kHz from the carrier.
g. Record the delta marker reading in the performance test record.
h. Press 4Span5, 425, 4.5, 455, 4M/5 to set the frequency span to 2.5 MHz.
i. Press 4Trigger5, SINGLE to make a sweep. Wait for the completion of the sweep.
j. Press 4Search5, MAX , 4Marker5, 1MODE MENU , 1MKR to place the delta marker reference at
the peak of the carrier.
k. Press 4-5, 415, 4M/5 to move the delta marker at the oset 01 MHz from the carrier.
l. Record the marker reading in the performance test record.
m. Press 415, 4M/5 to move the delta marker at the oset +1 MHz from the carrier.
n. Record the delta marker reading in the performance test record.
10. On the signal generator, set the frequency to the next center frequency 100 MHz in
Table 2-21.
11. On the 4396B, press 4Center5, 415, 405, 405, 4M/5 to set the center frequency to 100 MHz.
12. Repeat step 9 to measure the noise sideband level at 610 kHz and 61 MHz osets from the
carrier of 100 MHz.
NNNNNNNNNNNNNNNNNNNN
NNNNNNNNNNN
NNNNNNNNNNNNNNNNNNNNNNNNNNNNNNNN
NNNNNNNNNNNNNN
NNNNNNNNNNNNNNNNNNNNNNNNNNNNNNNN
NNNNNNNNNNNNNN
NNNNNNNNNNNNNNNNNNNN
NNNNNNNNNNN
Performance Tests
2-71
13. On the signal generator, set the frequency to the next center frequency 1 GHz in
Table 2-21.
14. On the 4396B, press 4Center5, 415, 4G/n5 to set the center frequency to 1 GHz.
15. Repeat step 9 to measure the noise sideband level at 610 kHz and 61 MHz osets from the
carrier of 1 GHz.
16. On the signal generator, set the frequency to the next center frequency 1.8 GHz in
Table 2-21.
17. On the 4396B, press 4Center5, 415, 4.5, 485, 4G/n5 to set the center frequency to 1.8 GHz.
18. Repeat step 9 to measure the noise sideband level at 610 kHz and 61 MHz osets from the
carrier of 1.8 GHz.
2-72
Performance Tests
20. FREQUENCY RESPONSE TEST (SA)
Description
This test measures the amplitude measurement accuracy of the 4396B spectrum measurement
over the entire frequency range. The frequency response is calculated as the accuracy
deviation from the absolute amplitude accuracy at a frequency of 20 MHz.
At frequency ranges 100 kHz, this test applies a CW signal to the 4396B S input and power
meter through a power splitter. The signal level is measured by doing a 4396B spectrum
measurement using a power meter and a power sensor. Then the 4396B reading is compared
with the reading of the power meter to obtain the absolute amplitude accuracy. These tests are
performed twice while reversing connections of the power splitter's two output ports. This is
done to remove the frequency tracking between two output ports of the power splitter.
At low frequencies (< 100 kHz), this test measures the CW signal level of the function
generator using the 4396B spectrum measurement. The function generator's output level is
used as the measurement standard.
Specication
Frequency response
@2365 C, att.= 10 dB, referenced to level at 20 MHz
10 MHz frequency 1.8 GHz : : : : : : : : : : : : : : : : : : : : : : : : : : : : : : : : : : : : : : : : : : : : : : : : : : <60.5 dB
2 Hz frequency < 10 MHz : : : : : : : : : : : : : : : : : : : : : : : : : : : : : : : : : : : : : : : : : : : : : : : : : : : : : :<61.5 dB
Test Equipment
Power Meter : : : : : : : : : : : : : : : : : : : : : : : : : : : : : : : : : : : : : : : : : : : : : : : : : : : : : 436A Opt. 022, 437B, or 438A
Power Sensor : : : : : : : : : : : : : : : : : : : : : : : : : : : : : : : : : : : : : : : : : : : : : : : : : : : : : : : : : : : : : : : : : : : : : : : : : : : : : : 8482A
Signal Generator : : : : : : : : : : : : : : : : : : : : : : : : : : : : : : : : : : : : : : : : : : : : : : : : : : : : : : : : : : : : : : : : 8663A or 8642B
Function Genarator : : : : : : : : : : : : : : : : : : : : : : : : : : : : : : : : : : : : : : : : : : : : : : : : : : : : : : : : : : : : : : : : : : : : : : : 3325A
Two-way Power Splitter : : : : : : : : : : : : : : : : : : : : : : : : : : : : : : : : : : : : : : : : : : : : : : : : : : : : : : : : : : : : : : : : : 11667A
N(m)-N(m) cable, 61 cm : : : : : : : : : : : : : : : : : : : : : : : : : : : : : : : : : : : : : : : : : : : : : : : 11500B or part of 11851B
BNC(m)-BNC(m) cable, 61 cm : : : : : : : : : : : : : : : : : : : : : : : : : : : : : : : : : : : : : : : : : : : : : : : : : : : : : PN 8120-1839
BNC(m)-BNC(m) cable, 122 cm : : : : : : : : : : : : : : : : : : : : : : : : : : : : : : : : : : : : : : : : : : : : : : : : : : : : PN 8120-1840
N(m)-N(m) adapter : : : : : : : : : : : : : : : : : : : : : : : : : : : : : : : : : : : : : : : : : : : : : : : : : : : : : : : : : : : : : : : : PN 1250-1475
N(m)-BNC(f) adapter : : : : : : : : : : : : : : : : : : : : : : : : : : : : : : : : : : : : : : : : : : : : : : : : : : : : : : : : : : : : : : PN 1250-1476
Procedure
1. Connect the power sensor to the power meter. Calibrate the power meter for the power
sensor.
2. Connect the test equipment as shown in Figure 2-26.
Note
Connect the signal generator's 10 MHz frequency reference output to the
4396B EXT REF Input on the rear panel as shown in Figure 2-26. With this
conguration, both the signal generator and the 4396B are phase locked to the
same reference frequency to obtain a stable measurement.
Performance Tests
2-73
Figure 2-26. Frequency Response Test Setup 1
3. Initialize the signal generator. Then set the amplitude to 04 dBm.
4. Press 4Meas5, ANALYZER TYPE , SPECTRUM ANALYZER , 4Preset5 to initialize the 4396B. Then
set the controls as follows:
NNNNNNNNNNNNNNNNNNNNNNNNNNNNNNNNNNNNNNNNN
Control Settings
NNNNNNNNNNNNNNNNNNNNNNNNNNNNNNNNNNNNNNNNNNNNNNNNNNNNN
Frequency Span: 1 kHz
RBW: 100 Hz
Reference Level: 08 dBm
Scale/Division: 1 dB/Div
Input Att.: 10 dB
Key Strokes
Span5, 415, 4k/m5
4Bw/Avg5, RES BW , 415, 405, 405, 4x15
4Scale Ref5, REFERENCE VALUE , 4-5, 485, 4x15
4Scale Ref5, SCALE/DIV , 415, 4x15
4Scale Ref5, ATTEN , 415, 405, 4x15
4
NNNNNNNNNNNNNNNNNNNN
NNNNNNNNNNNNNNNNNNNNNNNNNNNNNNNNNNNNNNNNNNNNNNN
NNNNNNNNNNNNNNNNNNNNNNNNNNNNN
NNNNNNNNNNNNNNNNN
5. On the signal generator, set the frequency to the rst frequency 20 MHz in the rst column
of Table 2-22. Table 2-22 lists the test settings at frequencies 100 kHz.
2-74
Performance Tests
Table 2-22. Frequency Response Test Settings 1
Signal Generator
4396B
Frequency Center Frequency
20 MHz
100 kHz
1 MHz
6 MHz
10 MHz
50 MHz
100 MHz
1 GHz
1.79 GHz
1.8 GHz
20 MHz
100 kHz
1 MHz
6 MHz
10 MHz
50 MHz
100 MHz
1 GHz
1.79 GHz
1.8 GHz
6. On the 4396B, press 4Center5, 425, 405, 4M/5 to set the center frequency to the rst setting 20
MHz in Table 2-22.
7. Perform the following steps to measure the frequency response.
a. Press 4Trigger5, SINGLE to make a sweep. Wait for the completion of the sweep.
b. Press 4Search5, MAX to place the marker at the peak of the carrier.
c. Record the 4396B marker reading and power meter reading in the \4396B Reading
1" and \Power Meter Reading 1" columns of the calculation sheet for the 20 MHz
reference.
8. Change the signal generator frequency and the 4396B center frequency in accordance with
Table 2-22. Then repeat step 7 for each setting. Record the 4396B marker reading and
power meter reading in the \4396B Reading 1" and \Power Meter Reading 1" columns of
the calculation sheet for frequencies 100 kHz.
9. Reverse the power splitter output connections as shown in Figure 2-27.
NNNNNNNNNNNNNNNNNNNN
NNNNNNNNNNN
Performance Tests
2-75
Figure 2-27. Frequency Response Test Setup 2
10. Repeat steps 5 through 8 to remove the power splitter tracking characteristic. Record the
4396B marker reading and power meter reading in the in \4396B Reading 2" and \Power
Meter Reading 2" columns of the calculation sheet.
11. Change the test equipment setup as shown in Figure 2-28.
2-76
Performance Tests
Figure 2-28. Frequency Response Test Setup 3
12. Initialize the function generator. Then set the amplitude to 010 dBm.
13. On the 4396B, press 4Bw/Avg5, RES BW , 415, 4x15 to set the RBW to 1 Hz.
NNNNNNNNNNNNNNNNNNNN
14. On the function generator, set the frequency to the rst test frequency (10 Hz) in the rst
column of Table 2-23. Table 2-23 lists the test settings at frequencies < 100 kHz.
Table 2-23. Frequency Response Test Settings 1
Function Generator
4396B
Frequency
Center Frequency Frequency Span
10 Hz
100 Hz
1 kHz
10 kHz
10 Hz
100 Hz
1 kHz
10 kHz
10 Hz
100 Hz
200 Hz
200 Hz
15. On the 4396B, set the controls as follows (the rst setting in Table 2-23):
Control Settings
Key Strokes
Center Frequency: 10 Hz
4Center5, 415, 405, 4x15
Frequency Span: 10 Hz
4Span5, 415, 405, 4x15
16. Perform the following steps to measure the frequency response at frequencies < 100 kHz.
a. Press 4Trigger5, SINGLE to make a sweep. Wait for the completion of the sweep.
b. Press 4Search5, MAX to place the marker at the peak of the carrier.
c. Record the marker reading in the calculation sheet for frequencies < 100 kHz.
17. Change the function generator frequency, 4396B center frequency, and span frequency in
accordance with Table 2-23. Repeat step 16 for each setting:
18. Calculate the test results using the equation given in the calculation sheet. Record the test
results in the performance test record.
NNNNNNNNNNNNNNNNNNNN
NNNNNNNNNNN
Performance Tests
2-77
21. SECOND HARMONIC DISTORTION TEST (SA)
Description
This test measures the second harmonics level generated within the 4396B at a frequency of 40
MHz in the 4396B spectrum analyzer mode.
This test applies a 40 MHz CW frequency signal to the 4396B S input through a 50 MHz low
pass lter (LPF). The LPF removes the second harmonics included in the applied signal. This
ensures that the harmonics read by the 4396B are internally generated and not coming from
the external signal source.
Specication
Second harmonic distortion
@10 MHz, 035 dBm mixer input
@<10 MHz, 035 dBm mixer input
: : : : : : : : : : : : : : : : : : : : : : : : : : : : : : : : : : : : : : : : : : : : : : : : : <070 dBc
: : : : : : : : : : : : : : : : : : : : : : : : : : : : : : : : : : : : : : : : : : : : : : : : : <060 dBc
Test Equipment
Signal Generator : : : : : : : : : : : : : : : : : : : : : : : : : : : : : : : : : : : : : : : : : : : : : : : : : : : : : : : : : : : : : : : : 8663A or 8642B
Power Meter : : : : : : : : : : : : : : : : : : : : : : : : : : : : : : : : : : : : : : : : : : : : : : : : : : : : : 436A Opt. 022, 437B, or 438A
Power Sensor : : : : : : : : : : : : : : : : : : : : : : : : : : : : : : : : : : : : : : : : : : : : : : : : : : : : : : : : : : : : : : : : : : : : : : : : : : : : : : 8482A
50 MHz Low Pass Filter : : : : : : : : : : : : : : : : : : : : : : : : : : : : : : : : : : : : : : : : : : : : : : : : : : : : : : : : : : : PN 0955-0306
Two-way Power Splitter : : : : : : : : : : : : : : : : : : : : : : : : : : : : : : : : : : : : : : : : : : : : : : : : : : : : : : : : : : : : : : : : : 11667A
BNC(m)-BNC(m) cable, 61 cm (two required) : : : : : : : : : : : : : : : : : : : : : : : : : : : : : : : : : : : : : PN 8120-1839
BNC(m)-BNC(m) cable, 122 cm : : : : : : : : : : : : : : : : : : : : : : : : : : : : : : : : : : : : : : : : : : : : : : : : : : : : PN 8120-1839
BNC(f)-BNC(f) adapter : : : : : : : : : : : : : : : : : : : : : : : : : : : : : : : : : : : : : : : : : : : : : : : : : : : BNC(f)-BNC(f) adapter
N(m)-N(m) adapter : : : : : : : : : : : : : : : : : : : : : : : : : : : : : : : : : : : : : : : : : : : : : : : : : : : : : : : : : : : : : : : : PN 1250-1475
N(m)-BNC(f) adapter (two required) : : : : : : : : : : : : : : : : : : : : : : : : : : : : : : : : : : : : : : : : : : : : : : PN 1250-1476
Procedure
1. Initialize the signal generator. Then set the signal generator controls as follows:
Controls
Settings
Frequency
40 MHz
Amplitude
019 dBm
2. Connect the test equipment as shown in Figure 2-29.
Note
2-78
Connect the signal generator's 10 MHz frequency reference output to the
4396B EXT REF Input on the rear panel as shown in Figure 2-29. With this
conguration, both the signal generator and the 4396B are phase locked to the
same reference frequency to obtain a stable measurement.
Performance Tests
Figure 2-29. Second Harmonics Distortion Test Setup
3. Press 4Meas5, ANALYZER TYPE , SPECTRUM ANALYZER , 4Preset5 to initialize the 4396B. Then set
the controls as follows:
NNNNNNNNNNNNNNNNNNNNNNNNNNNNNNNNNNNNNNNNN
NNNNNNNNNNNNNNNNNNNNNNNNNNNNNNNNNNNNNNNNNNNNNNNNNNNNN
Control Settings
Center Frequency: 40 MHz
Frequency Span: 10 kHz
RBW: 100 Hz
VBW: 10 Hz
Reference Level: 024 dBm
Input Att.: 10 dB
Key Strokes
Center5, 445, 405, 4M/5
Span5, 415, 405, 4k/m5
4Bw/Avg5, RES BW , 415, 405, 405, 4x15
4Bw/Avg5, VIDEO BW , 415, 405, 4x15
4Scale Ref5, REFERENCE VALUE , 4-5, 425, 445, 4x15
4Scale Ref5, ATTEN , 415, 405, 4x15
4
4
NNNNNNNNNNNNNNNNNNNN
NNNNNNNNNNNNNNNNNNNNNNNNNN
NNNNNNNNNNNNNNNNNNNNNNNNNNNNNNNNNNNNNNNNNNNNNNN
NNNNNNNNNNNNNNNNN
4. On the signal generator, adjust the amplitude until the power meter reads 025 6 0.1 dBm.
5. On the 4396B, press 4Trigger5, SINGLE to make a sweep. Wait for the completion of the
sweep.
6. Press 4Search5, MAX , 4Marker5, 1MODE MENU , FIXED 1MKR to place the delta marker reference
at the peak of the carrier.
7. Press 4Center5, 485, 405, 4M/5 to set the 4396B center frequency to 80 MHz.
8. Press 4Trigger5, SINGLE to make a sweep. Wait for the completion of the sweep.
NNNNNNNNNNNNNNNNNNNN
NNNNNNNNNNN
NNNNNNNNNNNNNNNNNNNNNNNNNNNNNNNN
NNNNNNNNNNNNNNNNNNNNNNNNNNNNNNNN
NNNNNNNNNNNNNNNNNNNN
9. Press 4Search5, MAX to move the delta marker to the peak of the second harmonic distortion.
Record the delta marker reading in the performance test record (\Test Result" column).
NNNNNNNNNNN
Performance Tests
2-79
22. THIRD ORDER INTERMODULATION DISTORTION TEST
(SA)
Description
This test measures the spurious level generated by the 4396B's third order intermodulation
distortion at four frequencies; 1 MHz, 10 MHz, 500 MHz, and 1.8 GHz.
In this test, two signals are combined in the directional bridge and applied to the 4396B's S
input. A T/R test set is used as the directional bridge. The frequency of one signal is separated
from the other with 20 kHz. This test measures the level of the spurious products that appear
at a 20 kHz oset from the signals. The power level of the two signals is adjusted to 020 dBm.
Therefore, each signal at the specied power level of 030 dBm is applied to the input mixer
through the 4396B's 10 dB input attenuator.
Specication
Third order inter-modulation distortion
@each input mixer level of two tones = 030 dBm, separation 20 kHz
@10 MHz : : : : : : : : : : : : : : : : : : : : : : : : : : : : : : : : : : : : : : : : : : : : : : : : : : : : : : : : : : : : : : : : : : : : : : : <075 dBc
@<10 MHz : : : : : : : : : : : : : : : : : : : : : : : : : : : : : : : : : : : : : : : : : : : : : : : : : : : : : : : : : : : : : : : : : : : : : : : <065 dBc
Test Equipment
Signal Generator (two required) : : : : : : : : : : : : : : : : : : : : : : : : : : : : : : : : : : : : : : : : : : : : : : : : 8663A or 8642B
Power Meter : : : : : : : : : : : : : : : : : : : : : : : : : : : : : : : : : : : : : : : : : : : : : : : : : : : : : 436A Opt. 022, 437B, or 438A
Power Sensor : : : : : : : : : : : : : : : : : : : : : : : : : : : : : : : : : : : : : : : : : : : : : : : : : : : : : : : : : : : : : : : : : : : : : : : : : : : : : : 8482A
Two-way Power Splitter : : : : : : : : : : : : : : : : : : : : : : : : : : : : : : : : : : : : : : : : : : : : : : : : : : : : : : : : : : : : : : : : : 11667A
T/R Test Set : : : : : : : : : : : : : : : : : : : : : : : : : : : : : : : : : : : : : : : : : : : : : : : : : : : : : : : : : : : : : : : : : : : : : : : : : : : : : : 85044A
50
termination, type-N(m) : : : : : : : : : : : : : : : : : : : : : : : : : : : : : : : : : : : : 909C Opt 012 or part of 85032B
N(m)-N(m) cable, 61 cm (three required) : : : : : : : : : : : : : : : : : : : : : : : : : : : : : 11500B or part of 11851B
BNC(m)-BNC(m) cable, 122 cm (two required) : : : : : : : : : : : : : : : : : : : : : : : : : : : : : : : : : : : : PN 8120-1840
N(m)-N(m) adapter : : : : : : : : : : : : : : : : : : : : : : : : : : : : : : : : : : : : : : : : : : : : : : : : : : : : : : : : : : : : : : : : PN 1250-1475
APC 7-N(f) adapter : : : : : : : : : : : : : : : : : : : : : : : : : : : : : : : : : : : : : : : : : : : : : : : : : : : 11524A or part of 85032B
Tee BNC(m)-(f)-(f) adapter : : : : : : : : : : : : : : : : : : : : : : : : : : : : : : : : : : : : : : : : : : : : : : : : : : : : : : : : : PN 1250-0781
Procedure
1. Connect the test equipment as shown in Figure 2-30.
Note
2-80
Connect the signal generator's 10 MHz frequency reference output to the
4396B EXT REF Input on the rear panel as shown in Figure 2-30. With this
conguration, both the signal generator and the 4396B are phase locked to the
same reference frequency to obtain a stable measurement.
Performance Tests
Figure 2-30. Third Order Intermodulation Distortion Test Setup
2. Initialize both signal generators. Then set their controls as follows:
Controls
Settings
Modulation
OFF
Amplitude
014 dBm
RF Signal
OFF
3. Press 4Meas5, ANALYZER TYPE , SPECTRUM ANALYZER , 4Preset5 to initialize the 4396B. Then
set the controls as follows:
NNNNNNNNNNNNNNNNNNNNNNNNNNNNNNNNNNNNNNNNN
Control Settings
NNNNNNNNNNNNNNNNNNNNNNNNNNNNNNNNNNNNNNNNNNNNNNNNNNNNN
Key Strokes
Span5, 415, 405, 405, 4k/m5
4Bw/Avg5, RES BW , 435, 405, 4x15
4Bw/Avg5, VIDEO BW , 415, 405, 4x15
4Scale Ref5, REFERENCE VALUE , 4-5, 415, 445, 4x15
4Scale Ref5, ATTEN , 415, 405, 4x15
4. On the 4396B, press 4Center5, 415, 4.5, 405, 415, 4M/5 to set the center frequency to the rst
Frequency Span: 100 kHz
RBW: 30 Hz
VBW: 10 Hz
Reference Level: 014 dBm
Input Att.: 10 dB
4
NNNNNNNNNNNNNNNNNNNN
NNNNNNNNNNNNNNNNNNNNNNNNNN
NNNNNNNNNNNNNNNNNNNNNNNNNNNNNNNNNNNNNNNNNNNNNNN
NNNNNNNNNNNNNNNNN
center frequency 1.01 MHz in Table 2-24.
Performance Tests
2-81
Table 2-24. Third Order Intermodulation Test Settings
4396B
Signal Generator 1 Signal Generator 2
Center Frequency
Frequency
Frequency
1.01 MHz
10.01 MHz
500.01 MHz
1800.01 MHz
1 MHz
10 MHz
500 MHz
1800 MHz
1.02 MHz
10.02 MHz
500.02 MHz
1800.02 MHz
5. On signal generator 1, set the frequency to 1 MHz (the rst frequency of signal generator 1
in Table 2-24).
6. On signal generator 2, set the frequency to 1.02 MHz (the rst frequency of signal
generator 2 in Table 2-24.
7. On signal generators 1 and 2, perform the following steps to adjust each generator's signal
amplitude to 020 dBm.
a. On signal generator 1, turn the RF signal on and adjust the amplitude until the power
meter reads 020 dBm 6 0.5 dB.
b. On signal generator 1, turn the RF signal o.
c. On signal generator 2, turn the RF signal on and adjust the amplitude until the power
meter reads 020 dBm 6 0.5 dB.
d. On signal generator 1, turn the RF signal on.
8. On the 4396B, perform the following steps to measure the third order intermodulation
distortion product.
a. Press 4Trigger5, SINGLE to make a sweep. Wait for the completion of the sweep.
b. Press 4Marker5, 415, 4M/5 to move the marker to peak of the signal generator 1's signal.
c. Press 4Marker5, 1MODE MENU , FIXED 1MKR to place the delta marker reference at the
peak of one carrier.
d. Press 4Marker5, 4-5, 425, 405, 4k/m5 to move the marker to the third order intermodulation
distortion products at the lower frequency.
e. Record the marker reading in the calculation sheet (\Lower Frequency" column).
f. Press 4Marker5, 445, 405, 4k/m5 to move the marker to the third order intermodulation
distortion product at the upper frequency.
g. Record the marker reading in the calculation sheet (\Upper Frequency" column).
h. Press 4Marker5, 1MODE MENU , 1MODE OFF .
NNNNNNNNNNNNNNNNNNNN
NNNNNNNNNNNNNNNNNNNNNNNNNNNNNNNN
NNNNNNNNNNNNNNNNNNNNNNNNNNNNNNNN
NNNNNNNNNNNNNNNNNNNNNNNNNNNNNNNN
NNNNNNNNNNNNNNNNNNNNNNNNNNNNN
9. Change the 4396B center frequency and the frequencies of signal generators 1 and 2 in
accordance with Table 2-24. Repeat steps 7 and 8 for each setting.
10. Compare the two marker readings at the lower and upper frequencies in the calculation
sheet. Record the larger value in the performance test record (\Test Result" column).
2-82
Performance Tests
23. OTHER SPURIOUS (SA)
Description
This test measures the level of spurious signals generated by causes other than the second
harmonic distortion and the third order intermodulation distortion.
This test applies several CW frequency signals to the 4396B S input and then measures the
spurious signal level at a frequency range where the spurious signal is most likely to be
observed.
Specication
Other spurious
@030 dBm mixer input, oset 1 kHz
: : : : : : : : : : : : : : : : : : : : : : : : : : : : : : : : : : : : : : : : : : : : <070 dBc
Test Equipment
Signal Generator : : : : : : : : : : : : : : : : : : : : : : : : : : : : : : : : : : : : : : : : : : : : : : : : : : : : : : : : : : : : : : : : 8663A or 8642B
N(m)-N(m) cable, 61 cm : : : : : : : : : : : : : : : : : : : : : : : : : : : : : : : : : : : : : : : : : : : : : : : 11500B or part of 11851B
BNC(m)-BNC(m) cable, 122 cm : : : : : : : : : : : : : : : : : : : : : : : : : : : : : : : : : : : : : : : : : : : : : : : : : : : : PN 8120-1840
Procedure
1. Connect the test equipment as shown in Figure 2-31.
Note
Connect the signal generator's 10 MHz frequency reference output to the
4396B EXT REF Input on the rear panel as shown in Figure 2-31. With this
conguration, both the signal generator and the 4396B are phase locked to the
same reference frequency to obtain a stable measurement.
Figure 2-31. Other Spurious Test Setup
Performance Tests
2-83
2. Press 4Meas5, ANALYZER TYPE , SPECTRUM ANALYZER , 4Preset5 to initialize the 4396B.
NNNNNNNNNNNNNNNNNNNNNNNNNNNNNNNNNNNNNNNNN
NNNNNNNNNNNNNNNNNNNNNNNNNNNNNNNNNNNNNNNNNNNNNNNNNNNNN
3. Initialize the signal generator. Then set the controls as follows.
Controls
Settings
Amplitude
020 dBm
4. On the signal generator, set the frequency to 23.92375 MHz (the rst column of Table 2-25).
Table 2-25. Other Spurious Test Settings
Signal Generator
4396B
Frequency
Center
Frequency RBW VBW
Frequency
Span
23.92375 MHz
23.92075 MHz
99.9985 MHz
100 MHz
99.9924 MHz
100 MHz
100 MHz
110.71 MHz
100 MHz
142.84 MHz
1155.786429 MHz 1155.6734286 MHz
1723.92375 MHz 1723.92075 MHz
5.99 kHz
9.99 kHz
9.99 kHz
9.99 kHz
9.99 kHz
9.99 kHz
5.99 kHz
30 Hz
100 Hz
100 Hz
100 Hz
100 Hz
100 Hz
30 Hz
Spurious
Frequency
10 Hz
23.92075 MHz
10 Hz
100.0045 MHz
10 Hz
100.0048 MHz
10 Hz
110.71 MHz
10 Hz
142.84 MHz
30 Hz 1155.6734286 MHz
10 Hz 1723.92075 MHz
5. On the 4396B, perform the following steps to measure the spurious level. In each step, the
carrier level is measured rst. Then the spurious level is measured.
a. Set the controls as follows to measure the carries level:
Control Settings
Center Frequency: 23.92375
MHz
Frequency Span: 1 MHz
RBW: 3 kHz
Key Strokes
Center5, 425, 435, 4.5, 495, 425, 435, 475, 455, 4M/5
4
Span5, 415, 4M/5
4Bw/Avg5, RES BW , 435, 4k/m5
4
NNNNNNNNNNNNNNNNNNNN
The center frequency is set to the frequency of the signal generator.
b. Press 4Trigger5, SINGLE to make a sweep. Wait for the completion of the sweep.
c. Press 4Search5, MAX , 4Marker5, 1MODE MENU , FIXED 1MKR to place the delta marker
reference at the peak of the carrier.
d. Set the following controls to the settings listed in Table 2-25 (from the second to the
fth columns):
NNNNNNNNNNNNNNNNNNNN
NNNNNNNNNNN
Control Settings
NNNNNNNNNNNNNNNNNNNNNNNNNNNNNNNN
Center Frequency: 23.92075
MHz
Frequency Span: 5.99 kHz
RBW: 30 Hz
VBW: 10 Hz
NNNNNNNNNNNNNNNNNNNNNNNNNNNNNNNN
Key Strokes
Center5, 425, 435, 4.5, 495, 425, 405, 475, 455, 4M/5
4
Span5, 455, 4.5, 495, 495, 4k/m5
4Bw/Avg5, RES BW , 435, 405, 4x15
4Bw/Avg5, VIDEO BW , 415, 405, 4x15
4
NNNNNNNNNNNNNNNNNNNN
NNNNNNNNNNNNNNNNNNNNNNNNNN
e. Press 4Trigger5, SINGLE to make a sweep. Wait for the completion of the sweep.
f. Press 4Marker5, 1MODE MENU , 1MKR SWP PARAM , 425, 435, 4.5, 495, 425, 405, 475, 455, 4M/5 to
move the delta reference marker to the spurious frequency in the sixth column of
Table 2-25.
g. Press 4Marker5, 405, 4x15, to move the delta marker to the spurious frequency.
h. Record the 4396B marker reading in the performance test record (\Test Result" column).
6. Repeat steps 4 and 5 for each setting in Table 2-25.
7. On the signal generator, set the controls as follows:
NNNNNNNNNNNNNNNNNNNN
NNNNNNNNNNNNNNNNNNNNNNNNNNNNNNNN
2-84
Performance Tests
NNNNNNNNNNNNNNNNNNNNNNNNNNNNNNNNNNNNNNNNNNNN
Controls
Settings
Frequency
1.8 GHz
Amplitude
0 dBm
8. On the 4396B, perform the following steps to measure the carrier level.
a. Set the controls as follows.
Control Settings
Key Strokes
Center5, 415, 4.5, 485, 4G/n5
Span5, 415, 4M/5
4Bw/Avg5, RES BW , 435, 4k/m5
Center Frequency: 1.8 GHz
Frequency Span: 1 MHz
RBW: 3 kHz
4
4
NNNNNNNNNNNNNNNNNNNN
b. Press 4Trigger5, SINGLE to make a sweep. Wait for the completion of the sweep.
c. Press 4Search5, MAX , 4Marker5, 1MODE MENU , FIXED 1MKR to place the delta marker
reference at the peak of the carrier.
9. On the 4396B, set the following controls to the rst settings in Table 2-26:
NNNNNNNNNNNNNNNNNNNN
NNNNNNNNNNNNNNNNNNNNNNNNNNNNNNNN
NNNNNNNNNNN
Control Settings
Center Frequency: 1.749 GHz
Frequency Span: 98 MHz
RBW: 30 kHz
VBW: 10 kHz
NNNNNNNNNNNNNNNNNNNNNNNNNNNNNNNN
Key Strokes
Center5, 415, 4.5, 475, 445, 495, 4G/n5
Span5, 495, 485, 4M/5
4Bw/Avg5, RES BW , 435, 405, 4k/m5
4Bw/Avg5, VIDEO BW , 415, 405, 4k/m5
4
4
NNNNNNNNNNNNNNNNNNNN
NNNNNNNNNNNNNNNNNNNNNNNNNN
Table 2-26. Other Spurious Test Settings 2
4396B
Center
Frequency RBW VBW
Frequency
Span
1749 MHz
1798.995 MHz
1799.9945 MHz
98 MHz 30 kHz 10 kHz
1.99 MHz 1 kHz 100 Hz
9 kHz 30 Hz 3 Hz
10. Perform the following steps to measure the spurious level.
a. Press 4Trigger5, SINGLE to make a sweep. Wait for the completion of the sweep.
b. Press 4Search5, MAX to move the delta marker to the maximum spurious product on the
trace.
c. Record the delta marker reading in the performance test record (\Test Result" column).
11. Change the 4396B controls (center frequency, frequency span, RBW and VBW) in
accordance with Table 2-26. Then repeat step 10 for each setting.
NNNNNNNNNNNNNNNNNNNN
NNNNNNNNNNN
Performance Tests
2-85
24. RESIDUAL RESPONSE TEST (SA)
Description
This test connects a 50 terminator to the 4396B's S input and measures the 4396B residual
response at several frequencies where the response is most likely to be observed.
The residual response is any internally generated by mixing the harmonics of the rst/second
local phase-lock-loop oscillators and the related reference signal.
Specication
Residual response
@3 MHz, 0 dB attenuator : : : : : : : : : : : : : : : : : : : : : : : : : : : : : : : : : : : : : : : : : : : : : : : : : : : : : : : <0100 dBm
@1 kHz frequency < 3 MHz, 0 dB attenuator : : : : : : : : : : : : : : : : : : : : : : : : : : : : : : : : : : <090 dBm
Test Equipment
50
termination, type-N(m) : : : : : : : : : : : : : : : : : : : : : : : : : : : : : : : : : : : : 909C Opt 012 or part of 85032B
Procedure
1. Connect the test equipment as shown in Figure 2-32.
Figure 2-32. Residual Response Test Setup
2-86
Performance Tests
2. Press 4Meas5, ANALYZER TYPE , SPECTRUM ANALYZER , 4Preset5 to initialize the 4396B. Then set
the controls as follows:
NNNNNNNNNNNNNNNNNNNNNNNNNNNNNNNNNNNNNNNNN
Control Settings
NNNNNNNNNNNNNNNNNNNNNNNNNNNNNNNNNNNNNNNNNNNNNNNNNNNNN
Frequency Span: 6 kHz
RBW: 30 Hz
Reference Level: 040 dBm
Input Att.: 0 dB;
Key Strokes
Span5, 465, 4k/m5
4Bw/Avg5, RES BW , 435, 405, 4x15
4Scale Ref5, REFERENCE VALUE , 4-5, 445, 405, 4x15
4Scale Ref5, ATTEN , 405, 4x15
4
NNNNNNNNNNNNNNNNNNNN
NNNNNNNNNNNNNNNNNNNNNNNNNNNNNNNNNNNNNNNNNNNNNNN
NNNNNNNNNNNNNNNNN
3. Set the center frequency to the rst frequency 10.71 MHz in Table 2-27.
Table 2-27. Residual Response Test Settings
4396B
Center Frequency
10.71 MHz
17.24 MHz
40 MHz
42.84 MHz
630 MHz
686.19333333333 MHz
1064.99 MHz
1352.9683333333 MHz
1387.278 MHz
1586.775 MHz
4. Perform the following steps to measure the residual response at a frequency 10.71 MHz.
a. Press 4Trigger5, SINGLE to make a sweep. Wait for the completion of the sweep.
b. Press 4Search5, MAX to move the marker to the maximum point on the trace.
c. Record the marker reading in the performance test record \Test Result" column).
5. Change the 4396B center frequency in accordance with Table 2-27. Repeat step 4 for each
setting.
NNNNNNNNNNNNNNNNNNNN
NNNNNNNNNNN
Performance Tests
2-87
3
Calculation Sheet
INTRODUCTION
This chapter contains calculation sheets for each performance test that requires additional
calculations to determine the nal test result.
Use the calculation sheet in this chapter as an aid for recording raw measurement data and
calculating the performance test results.
Calculation sheet entries are provided only for performance tests in which calculations are
required to obtain the test results.
2. SOURCE LEVEL FLATNESS TEST
Frequency Power Meter Reading
[ref1 ]
50 MHz
dBm
1 : is the power meter reading of the
source level accuracy test.
Frequency Power Meter Reading Test Result
[a]
[a0ref]
100 kHz
1 MHz
10 MHz
100 MHz
400 MHz
700 MHz
1 GHz
1.3 GHz
1.6 GHz
1.8 GHz
dBm
dBm
dBm
dBm
dBm
dBm
dBm
dBm
dBm
dBm
dB
dB
dB
dB
dB
dB
dB
dB
dB
dB
Calculation Sheet
3-1
3. NON SWEEP POWER LINEARITY TEST
Step Attenuator Calibration Value at 50 MHz
Attenuation Calibration Value1
dB
10 dB
a1 =
20 dB
dB
a2 =
dB
30 dB
a3 =
dB
40 dB
a4 =
50 dB
dB
a5 =
1 : Incremental attenuation referenced to 0
dB setting.
Reference (0 dBm)
4396B
Power Meter Reading
[b]
Source Power
0 dBm
dBm
Reference
[ref]
b+a3 =
dBm
Non Sweep Power Linearity
Power Meter Reading
4396B
Source Power
[b]
20 dBm
10 dBm
010 dBm
020 dBm
030 dBm
040 dBm
050 dBm
060 dBm
Note
3-2
dBm
dBm
dBm
dBm
dBm
dBm
dBm
dBm
Test Result
b+a50ref020=
b+a40ref010=
b+a20ref+10=
b+a10ref+20=
b+a10ref+30=
b+a10ref+40=
b+a10ref+50=
b0ref+60=
dB
dB
dB
dB
dB
dB
dB
dB
Calculate ref in the calculation sheet for the reference (0 dBm) rst. Then
calculate test results using the equation and the value of ref.
Calculation Sheet
4. POWER SWEEP LINEARITY TEST
Step Attenuator Calibration Value at 50 MHz
Attenuation Calibration Value1
dB
40 dB
a4 =
50 dB
dB
a5 =
[a5-a4]2
dB
1 : Incremental attenuation referenced to 0 dB setting.
2 : a5-a4 appears in equations to calculate the power sweep
linearity. Use this value as a5-a4 of each equation.
Power Meter Reading
4396B
Source Power
dBm
010 dBm b1 =
dBm
05 dBm b2 =
dBm
0 dBm
b3 =
dBm
5 dBm
b4 =
10 dBm
dBm
b5 =
dBm
15 dBm
b6 =
dBm
20 dBm
b7 =
Stop Power Source Power
20 dBm
15 dBm
10 dBm
5 dBm
0 dBm
15 dBm
10 dBm
5 dBm
0 dBm
05 dBm
10 dBm
5 dBm
0 dBm
05 dBm
010 dBm
5 dBm
0 dBm
05 dBm
010 dBm
0 dBm
05 dBm
05 dBm
010 dBm
010 dBm
Test Result
b70b605 =
b70b5+(a50a4)010 =
b70b4+(a50a4)015 =
b70b3+(a50a4)020 =
b60b5+(a50a4)05 =
b60b4+(a50a4)010 =
b60b3+(a50a4)015 =
b60b2+(a50a4)020 =
b50b405 =
b50b3010 =
b50b2015 =
b50b1020 =
b40b305 =
b40b2010 =
b40b1015 =
b30b205 =
b30b1010 =
b20b105 =
dB
dB
dB
dB
dB
dB
dB
dB
dB
dB
dB
dB
dB
dB
dB
dB
dB
dB
Calculation Sheet
3-3
6. RECEIVER NOISE LEVEL TEST
At IF BW 10 Hz
Frequency Input
100 kHz
1 MHz
10 MHz
100 MHz
500 MHz
1 GHz
1.4 GHz
1.8 GHz
R
A
B
R
A
B
R
A
B
R
A
B
R
A
B
R
A
B
R
A
B
R
A
B
Trace Mean
[a]
1 : 102LOG(RBW 1kHz/RBW 10 Hz)
3-4
Calculation Sheet
Unit
Unit
Unit
Unit
Unit
Unit
Unit
Unit
Unit
Unit
Unit
Unit
Unit
Unit
Unit
Unit
Unit
Unit
Unit
Unit
Unit
Unit
Unit
Unit
Test Result
[ 202log(a) 0 20 dB1 ]
dBm
dBm
dBm
dBm
dBm
dBm
dBm
dBm
dBm
dBm
dBm
dBm
dBm
dBm
dBm
dBm
dBm
dBm
dBm
dBm
dBm
dBm
dBm
dBm
At IF BW 40 kHz
Frequency Input
1 MHz
10 MHz
100 MHz
500 MHz
1 GHz
1.4 GHz
1.8 GHz
R
A
B
R
A
B
R
A
B
R
A
B
R
A
B
R
A
B
R
A
B
Trace Mean
[a]
Unit
Unit
Unit
Unit
Unit
Unit
Unit
Unit
Unit
Unit
Unit
Unit
Unit
Unit
Unit
Unit
Unit
Unit
Unit
Unit
Unit
Test Result
[ 202log(a) ]
dBm
dBm
dBm
dBm
dBm
dBm
dBm
dBm
dBm
dBm
dBm
dBm
dBm
dBm
dBm
dBm
dBm
dBm
dBm
dBm
dBm
Calculation Sheet
3-5
9. ABSOLUTE AMPLITUDE ACCURACY TEST
R input
Frequency 4396B Reading Power Meter Reading Test Result
[a]
[b]
[a0b]
100 kHz
1 MHz
10 MHz
50 MHz
100 MHz
1 GHz
1.79 GHz
1.8 GHz
dBm
dBm
dBm
dBm
dBm
dBm
dBm
dBm
dBm
dBm
dBm
dBm
dBm
dBm
dBm
dBm
dB
dB
dB
dB
dB
dB
dB
dB
A input
Frequency 4396B Reading Power Meter Reading Test Result
[b]
[a0b]
[a]
100 kHz
1 MHz
10 MHz
50 MHz
100 MHz
1 GHz
1.79 GHz
1.8 GHz
dBm
dBm
dBm
dBm
dBm
dBm
dBm
dBm
dBm
dBm
dBm
dBm
dBm
dBm
dBm
dBm
dB
dB
dB
dB
dB
dB
dB
dB
B input
Frequency 4396B Reading Power Meter Reading Test Result
[a]
[b]
[a0b]
100 kHz
1 MHz
10 MHz
50 MHz
100 MHz
1 GHz
1.79 GHz
1.8 GHz
3-6
Calculation Sheet
dBm
dBm
dBm
dBm
dBm
dBm
dBm
dBm
dBm
dBm
dBm
dBm
dBm
dBm
dBm
dBm
dB
dB
dB
dB
dB
dB
dB
dB
10. MAGNITUDE RATIO/PHASE DYNAMIC ACCURACY TEST
Step Attenuator Calibration Value at 50 MHz
Attenuationg Calibration Value1
dB
10 dB
a1 =
dB
20 dB
a2 =
dB
30 dB
a3 =
dB
40 dB
a4 =
dB
50 dB
a5 =
dB
60 dB
a6 =
dB
70 dB
a7 =
1 : Incremental attenuation referenced to 0
dB setting.
A/R Measurement
Input Level 4396B Reading
[b]
0 dB
010 dB
020 dB
040 dB
050 dB
060 dB
070 dB
080 dB
090 dB
0100 dB
dB
dB
dB
dB
dB
dB
dB
dB
dB
dB
Test Result
b0a3 =
b0a2 =
b0a1 =
b+a1 =
b+a2 =
b+a3 =
b+a4 =
b+a5 =
b+a6 =
b+a7 =
dB
dB
dB
dB
dB
dB
dB
dB
dB
dB
B/R Measurement
Input Level 4396B Reading
[b]
0 dB
010 dB
020 dB
040 dB
050 dB
060 dB
070 dB
080 dB
090 dB
0100 dB
dB
dB
dB
dB
dB
dB
dB
dB
dB
dB
Test Result
b0a3 =
b0a2 =
b0a1 =
b+a1 =
b+a2 =
b+a3 =
b+a4 =
b+a5 =
b+a6 =
b+a7 =
dB
dB
dB
dB
dB
dB
dB
dB
dB
dB
Calculation Sheet
3-7
13. DISPLAYED AVERAGE NOISE LEVEL TEST
Center
Frequency
10 kHz
100 kHz
1 MHz
10 MHz
100 MHz
500 MHz
1 GHz
1.4 GHz
1.8 GHz
Trace Mean
[a]
Watt
Watt
Watt
Watt
Watt
Watt
Watt
Watt
Watt
1 : 102LOG(RBW10 Hz /RBW 1 Hz)
2 : 102LOG(RBW10 kHz /RBW 1 Hz)
3-8
Calculation Sheet
Test Result
102log(a/0.001)010dB1 =
102log(a/0.001)040dB2 =
102log(a/0.001)040dB2 =
102log(a/0.001)040dB2 =
102log(a/0.001)040dB2 =
102log(a/0.001)040dB2 =
102log(a/0.001)040dB2 =
102log(a/0.001)040dB2 =
102log(a/0.001)040dB2 =
dBm/Hz
dBm/Hz
dBm/Hz
dBm/Hz
dBm/Hz
dBm/Hz
dBm/Hz
dBm/Hz
dBm/Hz
14. AMPLITUDE FIDELITY
Step Attenuator Calibration Value at 50 MHz
Attenuation Calibration Value1
dB
10 dB
a1 =
20 dB
dB
a2 =
dB
30 dB
a3 =
dB
40 dB
a4 =
50 dB
dB
a5 =
dB
60 dB
a6 =
1 : Incremental attenuation referenced to 0
dB setting.
At RBW 10 kHz
dB from
4396B Reading
Reference Level
[b]
010 dB
dB
020 dB
dB
030 dB
dB
040 dB
dB
050 dB
dB
060 dB
dB
Test Result
b+a1 =
b+a2 =
b+a3 =
b+a4 =
b+a5 =
b+a6 =
At RBW 1 MHz
dB from
4396B Reading
Reference Level
[b]
010 dB
dB
dB
020 dB
030 dB
dB
040 dB
dB
050 dB
dB
Test Result
b+a1 =
b+a2 =
b+a3 =
b+a4 =
b+a5 =
Calculation Sheet
3-9
15. INPUT ATTENUATOR SWITCHING UNCERTAINTY TEST
Step Attenuator Calibration Value at 50 MHz
Attenuation Calibration Value1
dB
10 dB
a1 =
20 dB
dB
a2 =
dB
30 dB
a3 =
dB
40 dB
a4 =
50 dB
dB
a5 =
1 : Incremental attenuation referenced to 0
dB setting.
Input Attenuator Switching Uncertainty
4396B
4396B Reading
Input Attenuation
[b]
20 dB
30 dB
40 dB
50 dB
60 dB
3-10
Calculation Sheet
dB
dB
dB
dB
dB
Test Result
b0a5+a4 =
b0a5+a3 =
b0a5+a2 =
b0a5+a1 =
b0a5 =
16. RESOLUTION BANDWIDTH ACCURACY/SELECTIVITY TEST
RBW Selectivity
RBW 3 dB Bandwidth 60 dB Bandwidth Test Result
[a]
[b]
[b/a]
10 kHz
30 kHz
100 kHz
300 kHz
1 MHz
3 MHz
kHz
kHz
kHz
kHz
MHz
MHz
kHz
kHz
kHz
kHz
MHz
MHz
Calculation Sheet
3-11
18. IF GAIN SWITCHING UNCERTAINTY TEST
10 dB Step Attenuator Calibration Value at 50 MHz
Attenuation Calibration Value1
dB
10 dB
a1 =
dB
20 dB
a2 =
dB
30 dB
a3 =
dB
40 dB
a4 =
dB
50 dB
a5 =
1 : Incremental attenuation referenced to 0
dB setting.
1 dB Step Attenuator Calibration Value at 50 MHz
Attenuation
2 dB
4 dB
6 dB
8 dB
10 dB
Calibration Value1
dB
b2 =
dB
b4 =
dB
b6 =
dB
b8 =
dB
b10 =
1 : Incremental attenuation referenced to 0
dB setting.
IF Gain Switching Uncertainty
4396B
4396B Reading
Reference Level
[c]
0 dBm
02 dBm
04 dBm
06 dBm
08 dBm
012 dBm
014 dBm
016 dBm
018 dBm
020 dBm
030 dBm
040 dBm
3-12
Calculation Sheet
dB
dB
dB
dB
dB
dB
dB
dB
dB
dB
dB
dB
Test Result
c0b10 =
c+b20b10 =
c+b40b10 =
c+b60b10 =
c+b80b10 =
c+a2+b20a10b10 =
c+a2+b40a10b10 =
c+a2+b60a10b10 =
c+a2+b80a10b10 =
c+a20a1 =
c+a30a1 =
c+a40a1 =
dB
dB
dB
dB
dB
dB
dB
dB
dB
dB
dB
dB
20. FREQUENCY RESPONSE TEST
Note
Calculate ref rst in the table for the reference at 20 MHz. Then calculate test
results using the equation and the value of ref.
Reference at 20 MHz
4396B
4396B
Frequency Reading 1
[r1]
20 MHz
Power Meter
Reading 1
[r2]
dBm
4396B
Reading 2
[r3]
dBm
Power Meter
Reference
Reading 2
[ref]
[r4]
[(r10r2+r30r4)/2]
dBm
dBm
dB
At Frequencies 100 kHz
4396B
4396B
Frequency Reading 1
[a1]
100 kHz
1 MHz
6 MHz
10 MHz
50 MHz
100 MHz
1 GHz
1.79 GHz
1.8 GHz
Power Meter
Reading 1
[b1]
dBm
dBm
dBm
dBm
dBm
dBm
dBm
dBm
dBm
dBm
dBm
dBm
dBm
dBm
dBm
dBm
dBm
dBm
4396B
Reading 2
[a2]
dBm
dBm
dBm
dBm
dBm
dBm
dBm
dBm
dBm
Power Meter
Reference
Reading 2
[b2]
[(a10b1+a20b2)/20ref]
dBm
dBm
dBm
dBm
dBm
dBm
dBm
dBm
dBm
dB
dB
dB
dB
dB
dB
dB
dB
dB
At Frequencies < 100 kHz
Test Result
Frequency 4396B Reading
[c+10 dBm1 0ref]
[c]
10 Hz
100 Hz
1 kHz
10 kHz
dBm
dBm
dBm
dBm
1 : is 0(010 dBm). 010 dBm is the output level of the
dB
dB
dB
dB
function generator.
Calculation Sheet
3-13
22. THIRD ORDER INTERMODULATION DISTORTION TEST
Frequency
1 MHz
10 MHz
500 MHz
1.8 GHz
3-14
Calculation Sheet
4396B Marker Reading
Test Result
Lower Frequency Upper Frequency
[a]
[b]
[larger of a and b]
dBc
dBc
dBc
dBc
dBc
dBc
dBc
dBc
dBc
dBc
dBc
dBc
4
Performance Test Record
Agilent 4396B NETWORK/SPECTRUM ANALYZER
Date:
Temperature:
Humidity:
Serial No.:
Tested by:
1. FREQUENCY ACCURACY TEST
without Option 1D5
Frequency
Minimum
Limit
1 GHz
999.9945 MHz
Test Result
Maximum
Limit
1000.0055 MHz
Measurement
Uncertainty
6191 Hz
with Option 1D5
Frequency
Minimum
Limit
1 GHz
999.99987 MHz
Test Result
Maximum
Limit
1000.00013 MHz
Measurement
Uncertainty
61.1 Hz
Performance Test Record
4-1
2. SOURCE LEVEL ACCURACY/FLATNESS TEST
Level Accuracy
Minimum Limit Test Result Maximum Limit Measurement
Uncertainty
0.5 dBm
00.5 dBm
60.050 dB
Level Flatness
Frequency Minimum Test Result Maximum Measurement
Limit
Limit Uncertainty
1 dB
100 kHz
60.16 dB
01 dB
1 dB
1 MHz
60.08 dB
01 dB
1 dB
10 MHz
60.07 dB
01 dB
1 dB
100 MHz
60.08 dB
01 dB
1 dB
400 MHz
60.11 dB
01 dB
1 dB
700 MHz
60.11 dB
01 dB
1 dB
1 GHz
60.11 dB
01 dB
1 dB
1.3 GHz
60.11 dB
01 dB
1 dB
1.6 GHz
60.11 dB
01 dB
1 dB
1.8 GHz
60.11 dB
01 dB
3. NON SWEEP POWER LINEARITY TEST
4396B
Minimum Test Result Maximum Measurement
Limit Uncertainty
Power Setting Limit
0.7 dB
20 dBm
60.043 dB
00.7 dB
0.7 dB
10 dBm
60.040 dB
00.7 dB
0.7 dB
010 dBm
60.039 dB
00.7 dB
0.7 dB
60.039 dB
020 dBm
00.7 dB
1.0 dB
030 dBm
60.039 dB
01.0 dB
1.0 dB
040 dBm
60.041 dB
01.0 dB
1.5 dB
050 dBm
60.133 dB
01.5 dB
1.5 dB
060 dBm
60.139 dB
01.5 dB
4-2
Performance Test Record
4. POWER SWEEP LINEARITY TEST
STOP Power Source Minimum Test Result Maximum Measurement
Limit Uncertainty
Power Limit
0.5 dB
20 dBm
60.055 dB
15 dBm 00.5 dB
10 dBm 00.5 dB
0.5 dB
60.043 dB
0.5 dB
5 dBm 00.5 dB
60.052 dB
0.5 dB
0 dBm 00.5 dB
60.043 dB
0.5 dB
15 dBm
60.052 dB
10 dBm 00.5 dB
0.5 dB
5 dBm 00.5 dB
60.060 dB
0.5 dB
0 dBm 00.5 dB
60.052 dB
0.5 dB
05 dBm 00.5 dB
60.060 dB
0.5 dB
10 dBm
60.050 dB
5 dBm 00.5 dB
0.5 dB
0 dBm 00.5 dB
60.040 dB
0.5 dB
60.050 dB
05 dBm 00.5 dB
0.5 dB
010 dBm 00.5 dB
60.042 dB
0.5 dB
5 dBm
60.050 dB
0 dBm 00.5 dB
0.5 dB
05 dBm 00.5 dB
60.058 dB
0.5 dB
010 dBm 00.5 dB
60.051 dB
0.5 dB
60.050 dB
0 dBm
05 dBm 00.5 dB
0.5 dB
010 dBm 00.5 dB
60.042 dB
0.5 dB
60.052 dB
05 dBm 010 dBm 00.5 dB
Performance Test Record
4-3
5. HARMONICS/NON-HARMONIC SPURIOUS TEST
Harmonics
Frequency Harmonics
Frequency
100 kHz
500 MHz
1.8 GHz
200 kHz
1 GHz
3.6 GHz
Test Result
dBc
dBc
dBc
Test Limit Measurement
Uncertainty
< 030 dBc 61.72 dB
< 030 dBc 61.73 dB
< 030 dBc 61.73 dB
Non-Harmonic Spurious
Frequency Non-Harmonic Test Result Test Limit Measurement
Uncertainty
Frequency
< 030 dBc 61.73 dB
500 MHz
478.58 MHz
521.42 MHz
< 030 dBc 61.73 dB
1558.58 MHz
< 030 dBc 61.73 dB
< 030 dBc 61.73 dB
1.8 GHz
258.58 MHz
1778.58 MHz
< 030 dBc 61.73 dB
1821.42 MHz
< 030 dBc 61.73 dB
2058.58 MHz
< 030 dBc 61.73 dB
3858.58 MHz
< 030 dBc 61.73 dB
4-4
Performance Test Record
6. RECEIVER NOISE LEVEL TEST
At IF BW 10 Hz
Frequency Input Test Result
100 kHz
1 MHz
10 MHz
100 MHz
500 MHz
1 GHz
1.4 GHz
1.8 GHz
R
A
B
R
A
B
R
A
B
R
A
B
R
A
B
R
A
B
R
A
B
R
A
B
Test Limit
< 085 dBm
< 0110 dBm
< 0110 dBm
< 085 dBm
< 0110 dBm
< 0110 dBm
< 099.97 dBm
< 0124.97 dBm
< 0124.97 dBm
< 099.7 dBm
< 0124.7 dBm
< 0124.7 dBm
< 098.5 dBm
< 0123.5 dBm
< 0123.5 dBm
< 097 dBm
< 0122 dBm
< 0122 dBm
< 095.8 dBm
< 0120.8 dBm
< 0120.8 dBm
< 094.6 dBm
< 0119.6 dBm
< 0119.6 dBm
Performance Test Record
4-5
At IF BW 40 kHz
Frequency Input Test Result
1 MHz
10 MHz
100 MHz
500 MHz
1 GHz
1.4 GHz
1.8 GHz
4-6
Performance Test Record
R
A
B
R
A
B
R
A
B
R
A
B
R
A
B
R
A
B
R
A
B
Test Limit
< 050 dBm
< 075 dBm
< 075 dBm
< 064.97 dBm
< 089.97 dBm
< 089.97 dBm
< 064.7 dBm
< 089.7 dBm
< 089.7 dBm
< 063.5 dBm
< 088.5 dBm
< 088.5 dBm
< 062 dBm
< 087 dBm
< 087 dBm
< 060.8 dBm
< 085.8 dBm
< 085.8 dBm
< 059.6 dBm
< 084.6 dBm
< 084.6 dBm
7. INPUT CROSSTALK TEST
Measurement
R into A Crosstalk
R into B Crosstalk
A into R Crosstalk
A into B Crosstalk
B into R Crosstalk
B into A Crosstalk
Test Result Test Limit
< 0120 dB
< 0120 dB
< 080 dB
< 0100 dB
< 080 dB
< 0100 dB
8. INPUT IMPEDANCE TEST
Measurement Test Result Test Limit Measurement
Uncertainty
R Return Loss
> 20 dB
61.2 dB
> 20 dB
A Return Loss
61.2 dB
B Return Loss
> 20 dB
61.2 dB
Performance Test Record
4-7
9. ABSOLUTE AMPLITUDE ACCURACY TEST
Input R
Frequency Mimimum Test Result Maximum Measurement
Limit
Limit Uncertainty
1.5 dB
100 kHz 01.5 dB
60.22 dB
1.5 dB
1 MHz 01.5 dB
60.18 dB
10 MHz 01.5 dB
1.5 dB
60.17 dB
1.5 dB
50 MHz 01.5 dB
60.17 dB
1.5 dB
100 MHz 01.5 dB
60.18 dB
1 GHz 01.5 dB
1.5 dB
60.18 dB
1.5 dB
1.79 GHz 01.5 dB
60.18 dB
1.5 dB
1.8 GHz 01.5 dB
60.18 dB
Input A
Frequency Mimimum Test Result Maximum Measurement
Limit Uncertainty
Limit
1.5 dB
100 kHz 01.5 dB
60.22 dB
1.5 dB
1 MHz 01.5 dB
60.18 dB
1.5 dB
10 MHz 01.5 dB
60.17 dB
1.5 dB
50 MHz 01.5 dB
60.17 dB
1.5 dB
100 MHz 01.5 dB
60.18 dB
1.5 dB
1 GHz 01.5 dB
60.18 dB
1.5 dB
1.79 GHz 01.5 dB
60.18 dB
1.5 dB
1.8 GHz 01.5 dB
60.18 dB
Input B
Frequency Mimimum Test Result Maximum Measurement
Limit Uncertainty
Limit
1.5 dB
100 kHz 01.5 dB
60.22 dB
1.5 dB
1 MHz 01.5 dB
60.18 dB
1.5 dB
10 MHz 01.5 dB
60.17 dB
1.5 dB
50 MHz 01.5 dB
60.17 dB
100 MHz 01.5 dB
1.5 dB
60.18 dB
1 GHz 01.5 dB
1.5 dB
60.18 dB
1.79 GHz 01.5 dB
1.5 dB
60.18 dB
1.8 GHz 01.5 dB
1.5 dB
60.18 dB
4-8
Performance Test Record
10. MAGNITUDE RATIO/PHASE DYNAMIC ACCURACY TEST
A/R Measurement
Input
Level
0 dB
010 dB
020 dB
040 dB
050 dB
060 dB
070 dB
080 dB
090 dB
0100 dB
Measurement Minimum Test Result Maximum Measurement
Limit
Limit Uncertainty
0.30 dB
60.0094 dB
Magnitude Ratio 00.30 dB
Phase
3.0
60.043
03.0
0.05 dB
Magnitude Ratio 00.05 dB
60.0090 dB
0.6
60.043
Phase
00.6
0.05 dB
60.0091 dB
Magnitude Ratio 00.05 dB
Phase
00.3
0.3
60.043
0.05 dB
60.0091 dB
Magnitude Ratio 00.05 dB
0.3
60.043
Phase
00.3
0.05 dB
60.0090 dB
Magnitude Ratio 00.05 dB
Phase
0.3
60.043
00.3
0.05 dB
60.0094 dB
Magnitude Ratio 00.05 dB
Phase
0.3
60.043
00.3
0.05 dB
60.0112 dB
Magnitude Ratio 00.05 dB
0.3
60.043
Phase
00.3
0.10 dB
60.0178 dB
Magnitude Ratio 00.10 dB
0.7
60.043
Phase
00.7
0.30 dB
60.0208 dB
Magnitude Ratio 00.30 dB
Phase
2.0
60.043
02.0
1.00 dB
60.0280 dB
Magnitude Ratio 01.00 dB
Phase
7.0
60.043
07.0
Performance Test Record
4-9
B/R Measurement
Input
Level
0 dB
010 dB
020 dB
040 dB
050 dB
060 dB
070 dB
080 dB
090 dB
0100 dB
4-10
Measurement Minimum Test Result Maximum Measurement
Limit Uncertainty
Limit
0.30 dB
60.0094 dB
Magnitude Ratio 00.30 dB
Phase
3.0
60.043
03.0
0.05 dB
60.0090 dB
Magnitude Ratio 00.05 dB
0.6
60.043
Phase
00.6
0.05 dB
60.0091 dB
Magnitude Ratio 00.05 dB
0.3
60.043
Phase
00.3
0.05 dB
60.0091 dB
Magnitude Ratio 00.05 dB
Phase
0.3
60.043
00.3
0.05 dB
60.0090 dB
Magnitude Ratio 00.05 dB
0.3
60.043
Phase
00.3
0.05 dB
60.0094 dB
Magnitude Ratio 00.05 dB
0.3
60.043
Phase
00.3
0.05 dB
60.0112 dB
Magnitude Ratio 00.05 dB
Phase
0.3
60.043
00.3
0.10 dB
60.0178 dB
Magnitude Ratio 00.10 dB
Phase
0.7
60.043
00.7
0.30 dB
60.0208 dB
Magnitude Ratio 00.30 dB
Phase
2.0
60.043
02.0
1.00 dB
60.0280 dB
Magnitude Ratio 01.00 dB
7.0
60.043
Phase
07.0
Performance Test Record
11. MAGNITUDE RATIO/PHASE FREQUENCY RESPONSE TEST
A/R Measurement
Frequency
100 kHz to 1 MHz
1 MHz to 1.8 GHz
Measurement Minimum Test Result Maximum Measurement
Limit
Limit Uncertainty
1 dB
60.105 dB
Magnitude Ratio
01 dB
Phase
6
60.69
06
0.5 dB
60.042 dB
Magnitude Ratio 00.5 dB
3
60.29
Phase
03
B/R Measurement
Frequency
100 kHz to 1 MHz
1 MHz to 1.8 GHz
Measurement Minimum Test Result Maximum Measurement
Limit
Limit Uncertainty
1 dB
60.105 dB
Magnitude Ratio
01 dB
Phase
06
6
60.69
0.5 dB
60.042 dB
Magnitude Ratio 00.5 dB
Phase
3
60.29
03
12. CALIBRATOR AMPLITUDE ACCURACY TEST
Minimum Limit Test Result Maximum Limit Measurement
Uncertainty
019.6 dBm
020.4 dBm
60.082 dB
Performance Test Record
4-11
13. DISPLAYED AVERAGE NOISE LEVEL TEST
Frequency Test Result
10 kHz
100 kHz
1 MHz
10 MHz
100 MHz
500 MHz
1 GHz
1.4 GHz
1.8 GHz
Test Limit
< 0125 dBm/Hz
< 0125 dBm/Hz
< 0125 dBm/Hz
< 0149.97 dBm/Hz
< 0149.7 dBm/Hz
< 0148.5 dBm/Hz
< 0147 dBm/Hz
< 0145.8 dBm/Hz
< 0144.6 dBm/Hz
14. AMPLITUDE FIDELITY TEST
At RBW 10 kHz
dB from
Minimum Limit Test Result Maximum Limit
Reference Level
0.3 dB
010 dB
00.3 dB
0.3 dB
020 dB
00.3 dB
0.3 dB
030 dB
00.3 dB
0.3 dB
040 dB
00.3 dB
0.4 dB
050 dB
00.4 dB
0.7 dB
060 dB
00.7 dB
Measurement
Uncertainty
60.021 dB
60.021 dB
60.021 dB
60.022 dB
60.026 dB
60.028 dB
At RBW 1 MHz
dB from
Minimum Limit Test Result Maximum Limit
Reference Level
1 dB
010 dB
01 dB
1 dB
020 dB
01 dB
1 dB
030 dB
01 dB
1 dB
040 dB
01 dB
050 dB
01.2 dB
1.2 dB
4-12
Performance Test Record
Measurement
Uncertainty
60.021 dB
60.021 dB
60.021 dB
60.022 dB
60.026 dB
15. INPUT ATTENUATOR SWITCHING UNCERTAINTY TEST
Input Minimum Limit Test Result Maximum Limit
Attenuation
1 dB
20 dB
01 dB
30 dB
1 dB
01 dB
1 dB
40 dB
01 dB
1.5 dB
50 dB
01.5 dB
1.5 dB
60 dB
01.5 dB
Measurement
Uncertainty
60.024 dB
60.023 dB
60.023 dB
60.024 dB
60.033 dB
16. RESOLUTION BANDWIDTH ACCURACY/SELECTIVITY TEST
Bandwidth Accuracy
RBW Minimum Limit
10 kHz
30 kHz
100 kHz
300 kHz
1 MHz
3 MHz
8 kHz
24 kHz
80 kHz
240 kHz
0.8 MHz
2.4 MHz
Test Result
Maximum Limit
kHz
kHz
kHz
kHz
MHz
MHz
12 kHz
36 kHz
120 kHz
360 kHz
1.2 MHz
3.6 MHz
Selectivity
RBW Test Result Test Limit
10 kHz
30 kHz
100 kHz
300 kHz
1 MHz
3 MHz
< 10
< 10
< 10
< 10
< 10
< 10
Performance Test Record
4-13
17. RESOLUTION BANDWIDTH SWITCHING UNCERTAINTY
TEST
RBW Minimum Limit Test Result Maximum Limit
0.5 dB
3 kHz
00.5 dB
0.5 dB
30 kHz
00.5 dB
0.5 dB
100 kHz
00.5 dB
0.5 dB
300 kHz
00.5 dB
0.5 dB
1 MHz
00.5 dB
0.5 dB
3 MHz
00.5 dB
18. IF GAIN SWITCHING UNCERTAINTY TEST
Reference Minimum Limit Test Result Maximum Limit
Level
0.3 dB
0 dBm
00.3 dB
0.3 dB
02 dBm
00.3 dB
0.3 dB
04 dBm
00.3 dB
0.3 dB
06 dBm
00.3 dB
0.3 dB
08 dBm
00.3 dB
0.3 dB
012 dBm
00.3 dB
0.3 dB
014 dBm
00.3 dB
0.3 dB
016 dBm
00.3 dB
0.3 dB
018 dBm
00.3 dB
0.3 dB
020 dBm
00.3 dB
0.3 dB
030 dBm
00.3 dB
0.3 dB
040 dBm
00.3 dB
4-14
Performance Test Record
Measuement
Uncertainty
60.032 dB
60.030 dB
60.028 dB
60.027 dB
60.027 dB
60.028 dB
60.027 dB
60.026 dB
60.026 dB
60.026 dB
60.027 dB
60.030 dB
19. NOISE SIDEBANDS TEST
Frequency
39 MHz
10 MHz
100 MHz
1 GHz
1.8 GHz
Test Result
Oset
from Carrier
01 kHz
1 kHz
010 kHz
10 kHz
01 MHz
1 MHz
010 kHz
10 kHz
01 MHz
1 MHz
010 kHz
10 kHz
01 MHz
1 MHz
010 kHz
10 kHz
01 MHz
1 MHz
Test Limit
< 095 dBc/Hz
< 095 dBc/Hz
< 0105 dBc/Hz
< 0105 dBc/Hz
< 0110 dBc/Hz
< 0110 dBc/Hz
< 0105 dBc/Hz
< 0105 dBc/Hz
< 0110 dBc/Hz
< 0110 dBc/Hz
< 0105 dBc/Hz
< 0105 dBc/Hz
< 0110 dBc/Hz
< 0110 dBc/Hz
< 099.9 dBc/Hz
< 099.9 dBc/Hz
< 0104.9 dBc/Hz
< 0104.9 dBc/Hz
Measurement
Uncertainty
60.44 dB
60.44 dB
61.30 dB
61.30 dB
61.30 dB
61.30 dB
61.30 dB
61.30 dB
61.30 dB
61.30 dB
61.30 dB
61.30 dB
61.30 dB
61.30 dB
60.44 dB
60.44 dB
61.30 dB
61.30 dB
Performance Test Record
4-15
20. FREQUENCY RESPONSE TEST
Frequency Minimum Limit Test Result Test Limit Measurement
Uncertainty
1.5 dB
10 Hz
60.21 dB
01.5 dB
100 Hz
1.5 dB
01.5 dB
60.21 dB
1.5 dB
1 kHz
60.21 dB
01.5 dB
1.5 dB
10 kHz
60.21 dB
01.5 dB
1.5 dB
100 kHz
60.102 dB
01.5 dB
1 MHz
1.5 dB
01.5 dB
60.089 dB
1.5 dB
6 MHz
60.090 dB
01.5 dB
0.5 dB
10 MHz
60.090 dB
00.5 dB
0.5 dB
50 MHz
60.093 dB
00.5 dB
0.5 dB
100 MHz
60.107 dB
00.5 dB
0.5 dB
60.101 dB
1 GHz
00.5 dB
0.5 dB
1.79 GHz
60.101 dB
00.5 dB
0.5 dB
1.8 GHz
60.101 dB
00.5 dB
21. SECOND HARMONIC DISTORTION TEST
Test Result Test Limit Measurement
Uncertainty
< 070 dBc 61.47 dB
22. THIRD ORDER INTERMODULATION DISTORTION TEST
Frequency Test Result Test Limit Measurement
Uncertainty
1 MHz
< 065 dBc
60.7 dB
10 MHz
< 075 dBc
63.7 dB
500 MHz
< 075 dBc
63.7 dB
1.8 GHz
< 075 dBc
63.8 dB
4-16
Performance Test Record
23. OTHER SPURIOUS TEST
Spurious
Frequency
23.92075 MHz
100.0045 MHz
100.0048 MHz
110.71 MHz
142.84 MHz
1155.6734286 MHz
1723.92075 MHz
1749 MHz
1798.995 MHz
1799.9945 MHz
Test Result Test Limit Measurement
Uncertainty
< 070 dBc 60.40 dB
< 070 dBc 60.40 dB
< 070 dBc 60.40 dB
< 070 dBc 60.40 dB
< 070 dBc 60.40 dB
< 070 dBc 60.40 dB
< 070 dBc 60.40 dB
< 070 dBc 60.61 dB
< 070 dBc 60.40 dB
< 070 dBc 60.40 dB
24. RESIDUAL RESPONSE TEST
Frequency
10.71 MHz
17.24 MHz
40 MHz
42.84 MHz
630 MHz
686.19333333333 MHz
1064.99 MHz
1352.9683333333 MHz
1387.278 MHz
1586.775 MHz
Test Result Test Limit
< 0100 dBm
< 0100 dBm
< 0100 dBm
< 0100 dBm
< 0100 dBm
< 0100 dBm
< 0100 dBm
< 0100 dBm
< 0100 dBm
< 0100 dBm
Performance Test Record
4-17
A
Manual Changes
Introduction
This appendix contains the information required to adapt this manual to earlier versions or
congurations of the 4396B than the current printing date of this manual. The information in
this manual applies directly to the 4396B serial number prex listed on the title page of this
manual.
Manual Changes
To adapt this manual to your 4396B, see Table A-1 and Table A-2, and make all the manual
changes listed opposite your instrument's serial number and rmware version.
Instruments manufactured after the printing of this manual may be dierent from those
documented in this manual. Later instrument versions will be documented in a manual
changes supplement that will accompany the manual shipped with that instrument. If your
instrument's serial number or ROM version is not listed on the title page of this manual, in
Table A-1, or Table A-2, make changes according to the yellow MANUAL CHANGES supplement.
In additions to information on changes, the supplement may contain information for correcting
errors (Errata) in the manual. To keep this manual as current and accurate as possible,
Agilent Technologies recommends that you periodically request the latest MANUAL CHANGES
supplement.
For information concerning serial number prexes not listed on the title page or in the
MANUAL CHANGE supplement, contact the nearest Agilent Technologies oce.
To conrm the rmware version, turn ON the power for the 4396B or execute *IDN? on the
external controller.
Table A-1. Manual Changes by Serial Number
Serial Prex or Number
Make Manual Changes
Table A-2. Manual Changes by ROM Version
Version
Make Manual Changes
Manual Changes
A-1
Serial Number
Agilent Technologies uses a two-part, ten-character serial number that is stamped on the serial
number plate (see Figure A-1) attached to the rear panel. The rst ve characters are the serial
prex and the last ve digits are the sux.
Figure A-1. Serial Number Plate
A-2
Manual Changes