1
2.1 Reverse Engineering Proprietary CAN
Message IDs
Unlike commercialized standards that run on top of CAN and
leverages the CAN extended format that have well documented
information regarding their component IDs such as SAE J1939,
the Bosch CAN standard format only specifies how the protocol
should work, but remains mute on what values should be used for
particular CAN devices.
The CAN standard format 11 bit message identifier is of interest
to us here because it is the common passenger vehicle application.
The ID is often used to determine how ECUs know what message
to listen to. The CAN standard format does not define which
message IDs are associated with what components, thus leaving
the vehicle manufacture to define their own CAN message IDs to
control various ECUs. Theoretically the standard format can have
up to 2048 unique message IDs present on a CAN network as the
standard format allows for 11 bit message IDs. Most actual
message IDs used by manufactures of passenger vehicles such as
GM, BMW, Ford, Honda, etc. are proprietary and this information
is not made publicly available by automobile manufactures. Thus,
a process is needed to reverse engineer these IDs to tie them to
their actual components.
This data capture ran for 90 seconds during the staged head on
collision involving the Mini Cooper. During that 90 seconds,
about 107,000 CAN messages were recorded off of the CAN bus.
This data was saved as a CSV file which allowed for parsing the
data in several different ways.
With the data log capture in hand, we needed a method to isolate
the CAN message IDs that were of interest to us. Since we were
interested in identifying which message IDs correspond with
displaying vehicle and engine speed to the instrument cluster, we
attempted to identify the IDs responsible for controlling the
speedometer and tachometer. Initial observations of the raw data
revealed that some IDs were present more often than others. That
is, some message IDs are transmitted more frequently across the
CAN bus over the duration of the capture. Initially, we hypnotized
that the message IDs responsible for updating the vehicle and
engine speed display gauges would be updated more frequently
than other devices, thus having a lower message ID compared to
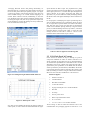
other messages. Running a simple Bash script we parsed the data
to identify only the unique message IDs and how often they were
transmitted over the CAN network (Figure 2-2).
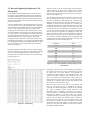
During the staged crash of the Mini Cooper, a CAN data logging
device was used to passively capture all CAN messages traversing
across the network. Information that was captured included a
timestamp, DLC, ID, and the data fields for each CAN messages
(8 bytes) (Figure 2-1).
Figure 2-2: Top 7 most frequently occurring messages on the
CAN data bus
Surprisingly, there were only 15 unique message IDs present on
the CAN bus. Since there were only 15 message IDs on the bus
we inferred that one of these messages was responsible for
controlling the display gauges on the instrument cluster. The
question now became a matter of which message ID, and which
byte, or bit will need to be manipulated in order to achieve our
desired effect? Now that we had an idea of the possible suspect
message IDs, we needed to figure out which byte offsets are used
that contain the vehicle and engine speeds.
Figure 2-1: CAN data log
Each byte holds a value of up to 0xFF or 255 in decimal. The
trick is to find which byte, bit, or combination of bytes are
responsible for controlling the gauges. To do this we use a method
for visually correlating physical system interactions with
identifiable patterns. Essentially, we visualize the data values in
each byte against the corresponding time stamp of the message
throughout the duration of the data capture (90 seconds).
Considering humans are inherently good at recognizing patterns,
plotting each byte against the timestamp helps us identify a
change in speed with the help of a scatter plot line graph. Using
this method we graphed all bytes, individually, to identify
recognizable patterns corresponding to a steady increase in data
values over time, which was indicative of the vehicle speed for
this staged automobile collision.