1
Dispotif de détection de gaz portatif
Hand-Held Gas Detection Device
Manuel de l’utilisateur
IAQ Probe
User Manual
ERP 511403
2/07
Handheld Gas Detection Device
IAQ Probe
User Manual
ERP 511403
2/07
Notices and Trademarks
Copyright by Honeywell International Inc.
Release 511403 February 2007
While this information is presented in good faith and believed to be accurate,
Honeywell disclaims the implied warranties of merchantability for a particular
purpose and makes no express warranties except as may be stated in its
written agreement with and for its customers.
In no event is Honeywell liable to anyone for any indirect, special or
consequential damages. The information and specifications in this document
are subject to change without notice.
Honeywell Analytics
4005 Matte Blvd, Unit G
Brossard, Quebec, J4Y 2P4
511403
2/07
IAQ Probe User Manual
Honeywell
iii
Contacts
World Wide Web
The following Honeywell Websites may be of interest to our customers:
Honeywell Organization
Honeywell Analytics
Corporate
International
WWW Address (URL)
http://www.honeywellanalytics.com
http://www.honeywell.com
http://content.honeywell.com/global/
Telephone
Contact us by telephone at the numbers listed below:
Organization
United States
and Canada
Asia Pacific
Europe
Latin America
Honeywell Internaltional Inc.
Analytics
Honeywell Asia Pacific Inc.
Hong Kong
Honeywell Pace
Brussels, Belgium
Honeywell International Inc.
Sunrise, Florida, U.S.A.
Phone Number
1-800-563-2967
1-450-619-2450
Fax: 1-800-967-9938
(852) 23 31 9133
[32-2]728-2711
(954) 845-2600
Sales Informations
Contact us at [email protected]
511403
2/07
IAQ Probe User Manual
Honeywell
v
Symbol Definitions
The following table lists the symbols used in this document to denote
certain conditions:
Symbol
Definition
ATTENTION: Identifies information that requires
special consideration
TIP: Identifies advice or hints for the user, often
in terms of performing a task
REFERENCE _ INTERNAL: Identifies an
additional source of information within the
bookset.
CAUTION
511403
2/07
Indicates a situation which, if not avoided, may
result in equipment or work (data) on the system
being damaged or lost, or may result in the
inability to properly operate the process.
CAUTION: Indicates a potentially hazardous
situation which, if not avoided, may result in minor
or moderate injury. It may also be used to alert
against unsafe practices.
CAUTION: Symbol on the equipement refers the
user to the product manual for additional
information. The symbol appears next to required
information in the manual.
WARNING: Indicates a potentially hazardous
situation which, if not avoided, could result in
serious injury or death.
WARNING symbol on the equipement refers the
user to the product manual for additional
information. The symbol appears next to required
information in the manual.
IAQ Probe User Manual
Honeywell
vii
Contents
IAQ PROBE HARDWARE .............................................13
General Characteristics ..................................................................... 13
IAQ Probe Features .............................................................................. 13
IAQ Probe Keypad ................................................................................ 14
Battery Installation and Removal ........................................................... 15
User Interface .................................................................................... 15
Initialization ............................................................................................ 15
Display Icons ......................................................................................... 17
Main Menu ............................................................................................. 18
Sensor Calibration ............................................................................. 19
Zero Calibration ..................................................................................... 19
Setting the Calibration Gas Value ......................................................... 20
Calibrating the CO and CO2 Sensor Span ............................................ 20
Configuring Alarms ................................................................................ 22
Selecting Temperature Type ................................................................. 23
Temperature Adjustment ....................................................................... 23
Using the Twa and Stel Menus ............................................................. 24
Activating the Vibration Mode ................................................................ 25
Recharging the Battery .......................................................................... 25
Automatic Shutoff .................................................................................. 25
Troubleshooting ..................................................................................... 26
Specifications ........................................................................................ 27
Datalogger Memory ............................................................................... 27
Periodic Inspections and Calibrations ................................................... 28
511403
2/07
IAQ Probe User Manual
Honeywell
ix
IAQ PROBE SOFTWARE .............................................. 29
Installation .........................................................................................29
Minimum System Requirements ............................................................29
Installing the Infrared Port .....................................................................30
Installing IAQ Probe Software ................................................................31
Checking the Infrared Connection .........................................................31
User Interface ....................................................................................32
Menu Options .........................................................................................32
Main Screens .....................................................................................35
Config Screen ........................................................................................37
Memory Status Section ..........................................................................44
Graph Screen .........................................................................................45
Exiting the IAQ Probe software ..............................................................48
USING THE IAQ PROBE SOFTWARE ......................... 49
Getting Started ..................................................................................49
Connecting a IAQ Probe to the Computer .............................................49
Initializing Acquisition .............................................................................50
Working with the Config Window .......................................................51
Uploading Parameters to the IAQ Probe ...............................................51
Downloading Data from the IAQ Probe ..................................................52
Viewing Acquisition Data .......................................................................55
Acquisition File Viewer ...........................................................................55
Continuous Reading Window .................................................................56
Working with the Graph Window .......................................................57
Displaying graphs ..................................................................................57
Modifying Graph Appearances ..............................................................59
Printing a Graph .....................................................................................67
Deleting a Graph from the Screen .........................................................68
Disconnecting the IAQ Probe ............................................................68
x
IAQ Probe User Manual
Honeywell
511403
2/07
LIMITED WARRANTY ....................................................69
Limited Warranty ................................................................................... 69
Re-Stocking Policy ................................................................................ 69
Exclusions ............................................................................................. 70
Warranty Limitation and Exclusion ........................................................ 70
Disclaimer of Unstated Warranties ........................................................ 71
Limitation of Liability .............................................................................. 71
511403
2/07
IAQ Probe User Manual
Honeywell
xi
IAQ Probe Hardware
General Characteristics
Temperature &
Humidity Sensor
Sensor
Compartment
Alarm Indicator
Battery Charge
Indicator
Display Screen
Up/Down Arrows
Enter Key
On/Off Button
Alarm Buzzer
Mode/Esc Key
IAQ Probe Features
Temperature and
Humidity Sensor:
Sensor
Compartment:
Alarm Indicator:
Battery Charge
Indicator:
Display:
511403
2/07
The sensor resembles an antenna and is flexible
to prevent damage.
The IAQ Probe features two gas detection sensors:
a CO2 (carbon dioxide) sensor and a CO (carbon
monoxide) sensor.
Three red LEDs flash at a frequency of 1 Hertz (once
per second) to indicate a Low Alarm and at 4 Hertz
(four times per second) to indicate a High Alarm.
The green indicator light illuminates when the
battery is being charged and goes off when charging
is complete.
The unit features a high contrast 5.7 cm x 4.8 cm
(2 1/4 in x 1 7/8 in) LCD display with an ultra-bright
backlight for low light conditions. The backlight is
activated with the touch of any key and shuts off
automatically after 5 minutes.
IAQ Probe User Manual
Honeywell
13
Alarm Buzzer:
Indicates that one of the alarms has been
triggered.
Used to connect the
battery charger to the
IAQ Probe
Allows for
communication
between the IAQ Probe
Infrared Port
and a computer
AC Power Connecter
Allows for the
CO calibration port
conveyance of
calibration gas to the
CO2 calibration
sensor
port
Allows for the
conveyance of
calibration gas to the
sensor
Power Connector:
Infrared Port:
CO2 Calibration Port:
CO Calibration Port:
IAQ Probe Keypad
Up/Down Arrows:
Enter Key:
On/Off Button:
Mode/ESC Key:
14
Used for scrolling within the menus, or to
change the unit’s different settings.
Suspends automatic scrolling of the gases on
the main display and confirms your menu
selections.
Turns the unit on and off.
Provides access to the main menu or exits
IrdA mode.
IAQ Probe User Manual
Honeywell
511403
2/07
Battery Installation and Removal
Installing a battery is simple:
1. Open the back battery panel
2. Position the battery (as shown) and slide upward into battery
compartment
3. When the battery clicks into position, close the back battery panel.
1
2
3
The procedure to remove a battery is identical to installation except in
reverse and with the added step of pressing the release button to slide
the battery out.
User Interface
Initialization
When first powered on, the IAQ Probe initializes, automatically detects
its sensors, and verifies active peripherals (such as memory).
The display screen can contain a great deal of information, mostly
presented in icon form.
511403
2/07
IAQ Probe User Manual
Honeywell
15
The screen displays the following information on each line (in order):
(Not all information is displayed on-screen at one time)
Line 1:
Line 2:
Line 3:
Line 4:
Line 5:
Line 6:
Line 7:
16
Gases detected (CO2 and CO) and communication
Concentration level status bar
Concentration, unit of measurement and lock status
Vibration icon and alarm status
Temperature and humidity icon and values
Acqusition status bar (memory used)
Battery status bar (battery power).
IAQ Probe User Manual
Honeywell
511403
2/07
Display Icons
Data Transfer:
Key:
Status bar:
Gas Level
Indicator:
Vibration:
Low and High
Alarm:
Temperature
Humidity:
Acquisition:
Status Bar:
Battery
Indicator:
511403
2/07
Indicates that the IAQ Probe has
established communication with a
computer and that data transfer is in
progress.
Tx will flash while transmitting data to the computer.
Rx will flash while receiving data from the computer.
Indicates that the display is locked on the
gas in progress. The IAQ Probe always
continues to detect other gases even
when they are not displayed. Flashes when powered
on
“noA” is displayed during initialization to
indicate that the IAQ Probe is not in
acquisition mode.
Provides a graphic display of the gas
concentration level. A full segmented bar
indicates the level is at the top end of the
range.
Indicates that vibration during an alarm is
activated.
The Alarm icon is always displayed when
an alarm is activated, LOW or HIGH will
be displayed to the right, depending on
the alarm level activated and only for the gas in
question.
Temperature and humidity levels are
displayed adjacent to this indicator.
Indicates that acquisition is in progress
and
displays the progress of data entry
into the IAQ Probe’s memory.
Indicates the battery power level.
IAQ Probe User Manual
Honeywell
17
Main Menu
You can access the main menu by pressing the Mode/ESC key. The
main menu provides access to all the secondary menus. Press the
Mode/ESC key again to exit the menu.
Main Menu Items
TWA:
STEL:
Zero:
Span:
Gas:
Alarm:
Displays the Time Weighted Average value. This value is
extrapolated from the first eight hours of acquisition.
Displays the Short Time Exposure Limit value. This value is
extrapolated from the first 15 minutes of acquisition.
Allows for the calibration of the sensor zeros.
Allows for the calibration of the sensor readings.
Allows for the regulation of the sensors’ calibration gas
reading.
Allows for the adjustment of the High and Low alarm levels.
Allows for the activation or deactivation of vibration during an
alarm.
This menu will not be displayed if there is no
temperature sensor. It allows for the selection of the
temperature unit of measurement and the calibration of the
temperature and humidity sensors.
Displays briefly when you press the Enter key.
Displays briefly when you press the up or down arrows.
18
IAQ Probe User Manual
Honeywell
511403
2/07
Sensor Calibration
All gas detection sensors require occasional recalibration to ensure
their continued accuracy. The frequency of maintenance and
calibration depends on the type of sensor and operating conditions.
•
Never calibrate the sensors when the IAQ Probe indicates that the
battery is low.
Zero Calibration
Each calibration port is linked to its specific sensor. If you wish to
calibrate the CO2 sensor zero, connect the calibration tubing to the CO2
calibration port (CO calibration port for CO sensor calibration) and
follow these simple instructions:
CAUTION
Never Calibrate the sensor Zero with ambiant air. Always
use Nitrogen (N2)
1
2
Connect the tubing to the desired calibration port
Connect the tubing to the regulator (connected to the appropriate
calibration gas cylinder)
3 Press Mode/Esc to access the main menu.
4 Use the arrow keys to scroll to Zero and press
Enter to select. The screen displays “n2”,
which is the calibration gas type (N2 Nitrogen).
5 Use the arrows keys to display which sensor to
calibrate and press Enter to select. The
following screen requests confirmation (“no” is
displayed)
6 Before starting the calibrate, begin emitting the Nitrogen at the flow
rate indicated on the cylinder.
7 Use the arrows to scroll to “YES” and press
Enter to confirm. CAL is displayed in the screen
to confirm that calibration is in progress.
8 When the calibration is complete, the IAQ
Probe returns to the main menu.
9 Press Mode/Esc to exit the menu.
Repeat for the other sensor if necessary.
511403
2/07
IAQ Probe User Manual
Honeywell
19
Setting the Calibration Gas Value
Before you can proceed to the calibration, you must make sure that the
calibration gas concentration value in the IAQ Probe is the same as
what is indicated on the calibration gas cylinder.
1
2
3
4
5
6
7
Press Mode/Esc to access the main menu.
Use the arrows to scroll to Gas and press Enter to confirm.
Use the arrows to scroll between CO2 or CO and press Enter to
select. The selected sensor concentration is displayed.
Press Enter. The concentration is editable when flashing.
Use the arrows to change the value (increase or decrease
according to the information on the cylinder) Enter to confirm.
Press Mode/ESC to return to the main menu.
Press Mode/ESC to exit the menu.
Calibrating the CO and CO2 Sensor Span
20
IAQ Probe User Manual
Honeywell
511403
2/07
10. Insert the tube connected to the calibration gas cylinder into the gas
calibration port (as shown) and start emitting the calibration gas.
11. Press Mode/Esc to access the main menu.
12. Use the arrow keys to scroll to Span and press Enter to select. The
screen displays SPAn.
13. Use the arrows keys to display which sensor to calibrate and press
Enter to select. The screen requests confirmation (“no” is
displayed)
14. Use the arrows to scroll to “YES” and press Enter to confirm. CAL is
displayed in the screen (CO calibration displays the value, and not
CAL) to confirm that calibration is in progress.
15. Press Mode/Esc to exit the menu.
CAUTION
Do not press the Enter key to confirm your selection
before having emitted the calibration gas for at least one
minute. The gas must continue to be emitted throughout
the calibration process.
Repeat the process for the other sensor if necessary. Remember to
change the position (calibration port) of the tubing before proceeding to
calibrate the next sensor).
Note: Always verify sensor calibration by re-emitting the calibration gas.
If the value displayed is identical to that of the calibration gas,
sensor calibration was successful.
511403
2/07
IAQ Probe User Manual
Honeywell
21
Configuring Alarms
The IAQ Probe is configured with default alarm levels. However, it is
possible to modify the alarm settings to suit specific needs.
1
2
3
4
5
6
7
8
22
Press Mode/ESC to access the main menu.
Use the arrows to scroll to Alarm and press
Enter to select.
Use the arrow keys to display either the CO2
or CO sensor press Enter to select.
Use the arrows to display either LOW or
HIGH and press Enter to select. (The
concentration level flashes to indicate that it may be modified.)
Use the arrows to change the alarm value (increase or decrease)
and press Enter to confirm.
Repeat steps 3 to 5 for the other alarm level.
Repeat steps 3 to 6 for the other sensor.
Press Mode/ESC to exit the menu.
MODE
ALARM
IAQ Probe User Manual
Honeywell
HIGH
Alarm
511403
2/07
Selecting Temperature Type
The IAQ Probe can be set to display temperature readings in either
degrees Farenheit or degrees Celcius:
1. Press Mode/ESC to access the main menu.
2. Use the arrows to scroll to the °C/°F Menu and press Enter to
select.
3. Use the arrows to display either ºC or ºF and press Enter to select.
4. Press Enter to confirm the selection and return to the main menu.
5. Press Mode/ESC to exit the menu.
Temperature Adjustment
The IAQ Probe temperature menu also provides access to both the
humidity sensor controls. This menu allows you to adjust both the
temperature and humidity values:
1
2
3
4
5
6
7
8
Press Mode/ESC to access the main menu.
Use the arrows to scroll to the °C/°F menu and press Enter to
select.
Once in the °C/°F menu, press and hold Enter
for three seconds. Adj will appear on the
screen.
Press Enter to select the adjustment function.
Use the arrows to display either the
temperature or humidity sensor and press
Enter to select. The humidity value is
displayed
Press enter to edit the value (editable when
flashing). Use the arrows to increase or
decrease the value and press Enter to confirm
and save the value.
Repeat steps 2 to 7 for the other sensor, as
required.
Press Mode/Esc to exit the menu.
511403
2/07
%RH
IAQ Probe User Manual
Honeywell
23
Using the Twa and Stel Menus
These menus provide readings for TWA and STEL concentrations.
They are for consultation purposes only and cannot be modified.
MODE
TWA
STEL
TWA
TWA indicates the sensor’s Time Weighted Average. This is the
exposure limit for personnel based on 8 hours per day, 40 hours per
week.
1. Press Mode/ESC to access the main menu.
2. Use the arrows to scroll to TWA and press Enter to select. The
concentration is displayed on screen.
3. Press Mode/Esc to exit the menu.
STEL
STEL indicates the sensors’ Short Time Exposure Limit. Since the
STEL is based on maximum safe exposure over 15 minutes, these
readings are recorded every 15 minutes.
1
2
3
24
Press Mode/ESC to access the main menu.
Use the arrows to scroll to STEL and press Enter to select. The
concentration is displayed on screen.
Press Mode/Esc to exit the menu.
IAQ Probe User Manual
Honeywell
511403
2/07
Activating the Vibration Mode
1. Press Mode/ESC to access the main menu.
2. Use the arrows to scroll to the vibration icon and press Enter to
select.
3. Use the arrows to display either Off or On and press Enter to select
4. Press Mode/Esc to exit the menu.
Recharging the Battery
An audible warning sounds when the battery is low, and the IAQ Probe
will display “batt” on the screen at two-minute intervals. To recharge the
battery, simply connect the IAQ Probe to its charger.
Note: Only use the battery charger supplied with your IAQ Probe. The
use of any other charger may damage the battery.
Automatic Shutoff
When the IAQ Probe’s battery drops below the critical voltage level, the
unit shuts off automatically to prevent battery damage resulting from a
full discharge. In this case, you must recharge the battery before
reusing your IAQ Probe.
The status bar flashes when the battery is low.
The status bar scrolls while the battery is charging.
511403
2/07
IAQ Probe User Manual
Honeywell
25
Troubleshooting
IAQ Probe Error Codes
Table 1: Error Codes
WHEN
CODE
DESCRIPTION
During
calibration
ERR0
The sensor is not
reacting to the gas.
ERR1
The sensor reading is
too high and the IAQ
Probe is unable to
lower it
During
calibration
ERR2
The sensor reading is
too low and the IAQ
Probe is unable to raise
it
During
calibration
ERR3
The sensor Zero
cannot be calibrated.
During
calibration
ERR4
The RTD Zero does not
calibrate.
ERR5
The clock is
malfunctioning upon
initialization.
ERR6
This error is displayed
when attempting to
save a configuration if
the device’s memory is
faulty.
During
calibration
Powering on
Powering on
SOLUTION
Verify that the gas is
properly reaching the
sensor.
The sensor may be
defective or is
approaching its end-of
life and must be
replaced
The sensor reading has
probably deviated and
is now out of range of
the norm.
The sensor may have
been contaminated or
has reached its end-oflife and must be
replaced
In the event of such an
error acquisition will not
work but all other
functions remain
operational.
Note: Each error code will remain displayed until a key is pressed. In
the event of any error, please contact Vulcain’s Technical Support
Department
26
IAQ Probe User Manual
Honeywell
511403
2/07
Specifications
Power Source:
Battery Life:
Sensing Technologies:
Rechargeable lithium battery
16 hours
Electrochemical (CO)
Infrared (CO2)
RTD (temperature)
Capacitive polymer (relative humidity)
High contrast LCD with ultra-bright backlight
85 dB
0% - 95% RH (non-condensing)
Display:
Alarm Intensity:
Operating Humidity
Range:
Operating Temperature
Range:
Default Range:
0°C - 40°C (32°F - 104°F)
CO: 0 – 250 ppm
CO2: 0 – 5000 ppm
RTD:
Capacitive polymer:
Dimensions:
0°C to 40°C
0 - 95% RH
4 cm x 16.5 cm x 8.5 cm
(1.6 in x 6.5 in x 3.3 in)
415 g / 14.65 oz.
Weight:
Datalogger Memory
The IAQ Probe datalogger has 4 Mb of memory. The number of days
that the datalogger can record depends on the number of data types
and frequency (the table below provides a few examples).
Data Types
CO2, T, RH, CO
CO2, T, RH, CO
CO2
CO2
511403
2/07
Frequency
every 10 seconds
every 30 seconds
every 10 seconds
every 30 seconds
IAQ Probe User Manual
Honeywell
Number of
days logged
77
233
312
938
27
Periodic Inspections and Calibrations
This unit requires calibration. The calibration frequency will depend on
operating conditions, including operating under extreme temperatures,
exposure to contaminants or gas concentrations greater than the lower
explosive limits. A calibration inspection must be included as part of a
routine maintenance to ensure proper operation of the gas detection
unit.
When the unit cannot be properly calibrated, the sensor should be
replaced.
28
IAQ Probe User Manual
Honeywell
511403
2/07
IAQ Probe Software
Installation
IAQ Probe Software
Installation
Minimum System Requirements
Your system must meet the following minimum requirements to install
and run the IAQ Probe software:
•
•
•
•
•
•
Pentium II 266 MHz microprocessor
Windows 98 SE/ME/2000/XP operating system
64 MB of RAM (128 MB recommended)
15 MB of free hard disc space
1028 x 768 video adapter with 8 MB of video RAM
One available USB or IrDA port
When you insert the IAQ Probe Software CD into your CD drive, it will
automatically* open the IAQ Probe installation window that contains 4
options:
•
•
•
•
Install IAQ ProbeTM Deluxe
Install USB IrDA Adapter Driver
Windows 2000 IR hotfix
Install Adobe Acrobat Reader 5.05
* If the setup program does not run automatically, open Windows
Explorer (Windows 98, 2000, XP), double click on My Computer,
double click on your CD-ROM drive, and then double click on
SPSInstall.exe.
511403
2/07
IAQ Probe User Manual
Honeywell
29
IAQ Probe Software
Installation
Before proceeding to install the software, you must first install the
Infrared Port:
Installing the Infrared Port
Select the second option in the IAQ Probe Deluxe installation window:
Install IrDA USB Adapter Drivers. A reference warning appears. Click
continue to proceed.
This will open the USB-IrDA Adapter Setup installation wizard; simply
follow the instructions displayed on screen.
Note: Users with laptops that have an integrated infrared port should
skip ahead directly to the IAQ Probe Soft Installation section.
30
IAQ Probe User Manual
Honeywell
511403
2/07
IAQ Probe Software
Installation
Installing IAQ Probe Software
Select the first option in the IAQ Probe Deluxe installation window:
“Install IAQ Probe Deluxe”.
Installation begins the moment you click on the selection, starting the
IAQ Probe Deluxe Setup wizard. Simply follow the instructions until the
final screen and click Finish. The wizard will prompt you to restart your
computer. Restart your computer to complete the installation process.
Checking the Infrared Connection
Before using the software, you must first verify that the Infrared
communication port was correctly installed and is functioning:
•
•
•
•
Open the Control Panel and select Phone and modem options. If no
modem is installed, type your country and area code in the space
provided.
Click on the Modems tab. You
should see Standard Modem over
IR link listed in the Modems
column. If the IAQ Probe is not
positioned in front of the infrared
reader, you should see the
message Not present displayed in
the Attached To column.
When you power on your IAQ
Probe and position it in front of
the infrared reader, you should
hear an audio tone indicating that
the reader has detected new
hardware.
Then, the Not present message
in the Attached To column will change to COM #. This is the number
of the communication port being used. Take note of this number (to
use when configuring the software communication port).
If nothing is displayed, place the operating IAQ Probe directly in front of
the infrared device to enable the unit to be detected.
511403
2/07
IAQ Probe User Manual
Honeywell
31
IAQ Probe Software
User Interface
User Interface
Menu Options
The main IAQ Probe Deluxe screen contains four main menu options,
each of which contain sub-menu options:
File Menu Options
Select Acquisition
File (F1):
Allows you to select a
storage location for acquisition files
Select Log Directory
(F2):
Selects a storage location
for log files.
Parameters:
Lets users select 3 possible options;
connection time limit, introduction and
autorun.
Tech Features (F11):
Password protected section of the software
reserved for qualified technicians.
Quit (F12):
Exits the program.
32
IAQ Probe User Manual
Honeywell
511403
2/07
IAQ Probe Software
User Interface
Graph Menu Options
Appearance:
Lets you define the appearance of the graph.
Graph Tools:
Contains several options that control what
information is shown on the graph. The options
in this menu are identical to the menu buttons
on the right-hand side of the Graph window.
Expanded Tools:
Lets you export an image file (.png format) of
the graph and provides access to the Indicator
Band tool for each acquisition type.
Generate File From
Plot Area Selection
Creates a separate file based on a specific
selection within the graph
Statistics Report:
Displays the statistics for a given acquisition or
log file
Tools Menu Options
Generate Log File:
Generates a separate log file.
Excel Export Tool:
Exports acquired data to an Excel
spreadsheet.
Acquisition File
Viewer:
Displays acquired data in
column view, sorted by selected criteria
511403
2/07
IAQ Probe User Manual
Honeywell
33
IAQ Probe Software
User Interface
Help Menu Options
User’s Guide:
Displays a PDF version of the User Guide.
Web Links:
Provides direct links to Websites.
About IAQ Probe:
Information about IAQ Probe software and
how to contact Vulcain.
34
IAQ Probe User Manual
Honeywell
511403
2/07
IAQ Probe Software
Main Screens
Main Screens
In addition to the menu options, the IAQ Probe has two separate display
windows (selection buttons located in the bottom left portion of the
screen), each with its own subset of functions.
The “Config” screen, which is the default screen, contains several
separate sections of information or functions that will be explained in
this section of the manual:
IAQ Sensors
Event Log Viewer
Air Quality
Humidity
Activate ACQ
511403
2/07
Memory Content
Clear Memory
IAQ Settings
Download Memory
Memory Status
IAQ Probe User Manual
Honeywell
35
IAQ Probe Software
Main Screens
The “Graph” screen contains a viewing section and a section with
numerous functions related to appearance of the graph:
•
•
•
•
•
•
36
Auto Scale
Print Graph
Select axis
Sample selection
Graph Controls
Analysis Tool
IAQ Probe User Manual
Honeywell
511403
2/07
IAQ Probe Software
Main Screens
Config Screen
The Config screen is the primary interface, enabling you to upload and
manage information from your IAQ Probe. It is composed of several
distinct sections:
511403
2/07
IAQ Probe User Manual
Honeywell
37
IAQ Probe Software
Main Screens
Communication Section
This section manages the link between the IAQ Probe and the
software.
COM Port x:
Connect/Refresh:
Disconnect:
38
Drop-down menu lists the possible
communication ports for the infrared device.
Select the port number that corresponds to the
Infrared device installed (see “Verifying
Infrared Connection section).
Enables connection with the IAQ Probe and
the reception of data. (The green light
indicates an active connection).
Terminates data transmission and closes the
connection to the IAQ Probe.
IAQ Probe User Manual
Honeywell
511403
2/07
IAQ Probe Software
Main Screens
IAQ Sensors Section
The Sensors section displays information for each of the sensors within
the IAQ Probe, such as sensor type, measurement unit, Trig and
whether the sensor is in acquisition mode.
Event Log Viewer
The section directly beneath IAQ Sensors displays general hardware
information. This information is refreshed each time a communication
link is established with a IAQ Probe. This area displays:
•
•
•
•
•
IAQ Probe firmware revision number
RTD present or not
Sensor runtime (number of hours of use) and percentage of total
runtime used
Number of days until next sensor calibration.
Date of last calibration
511403
2/07
IAQ Probe User Manual
Honeywell
39
IAQ Probe Software
Main Screens
Air Quality Section
The Air Quality section displays whether
the IAQ Probe is equipped with
temperature ( and whether the
temperature is set at degree Farenheit or
Celcius) and humidity sensors.
The section also contains the “Activate
ACQ” option, which activates the
acquisition of readings (if acquisition is
activated, the box is green. If the box is
red, click to activate.)
Memory Content and Clear Memory Section
This section enables you to manage use of the IAQ Probe’s memory.
Total of blocks:
O/W Enable:
Clear Memory:
40
Displays how many
blocks of memory are
currently in use.
Writes new acquisition
data over existing data, if
checked.
Erases the IAQ Probe’s
memory without
downloading or saving.
IAQ Probe User Manual
Honeywell
511403
2/07
IAQ Probe Software
Main Screens
IAQ Settings Section
The IAQ Settings section lets users display or set specific information in
the IAQ Probe.
Continuous Reading
The continuous reading button
opens the continuous reading
window, which displays
constantly changing readings
from the IAQ Probe (as per set
acquisition intervals).
511403
2/07
IAQ Probe User Manual
Honeywell
41
IAQ Probe Software
Main Screens
Calibration Gas Info
Clicking on View in the Calibration Gas Info section opens the
Calibration Gas Info window.
This window displays:
•Which sensors are
functioning in the IAQ Probe
(green light indicates active
reading)
•The calibration gas type
•The sensor gas concentration
reading.
Set Acq. Time
Clicking this option opens the
Acquisition Interval Delay
winsow, which allows users to
set the acquisition frequency
(intervals) in either seconds or
minutes. The IAQ Probe will
acquire data at the set
intervals.
42
IAQ Probe User Manual
Honeywell
511403
2/07
IAQ Probe Software
Main Screens
Set Time
Clicking on the Set Time option opens the Internal Clock Settings
window that lets you correct the time on the IAQ Probe, ensuring that
there are no discrepancies between acquisition location and hardware
times.
Click Get to display the time
set on the IAQ Probe unit.
If the IAQ Probe time differs
from the actual time, use the
arrows to adjust the time and
click Set to correct the time on
the IAQ Probe.
Clicking on Set opens a
warning window.
•
•
•
Click “Download then set time” if you wish to save the IAQ Probe’s
data and correct it’s clock.
Click “Set time now” if you wish to correct the IAQ Probe’s time and
clear it’s memory without uploading it.
Click Cancel to exit this function without any changes (will not clear
the memory or set the time).
Note: If you select Download then set time and click Cancel within the
“Save data to...” window, the time will not be set and the memory
will be cleared without saving.
511403
2/07
IAQ Probe User Manual
Honeywell
43
IAQ Probe Software
Main Screens
Download Memory
Enables the storage of IAQ Probe data in a file on your computer.
Clicking on the Download Memory button opens a “Save as...” window
that lets you save the unit’s data to a log file (the default filename is
already provided as yyyy-mm-dd-hhmm). If you maintain the default
settings (recommended), you need only click on “Save” to save the
downloaded data.
Memory Status Section
The memory status section displays memory usage bars for both the
PC (green bar) and the IAQ Probe (red bar). These bars let you see
how much memory is being used by these devices.
44
IAQ Probe User Manual
Honeywell
511403
2/07
IAQ Probe Software
Main Screens
Graph Screen
The Graph screen is the second tab and presents a graph view of
acquisition information. This screen contains several tools to control
how graphs are displayed and printed.
511403
2/07
IAQ Probe User Manual
Honeywell
45
IAQ Probe Software
Main Screens
Graph Controls Tool
The clicking on “Graph controls” opens the Graph Controls window that
contains several appearance controls that can be applied to each of the
IAQ Probe’s sensor readings:
Show/Hide:
Grid:
Auto Range:
Fill Base:
Tag:
Marks:
Colors:
Displays or hides graph information for the sensor
When selected, displays the scale grid for the
selected sensor
Adjusts the graph to the viewing area
Fills in the area under the zero curve
Displays information flags (previously selected with
the toolbar)
Indicates each acquisition point on a graph with a
rectangle
Lets you select the display color for each sensor
Auto Scale
Clicking on Auto Scale adjusts the scale for all the graph data in the
viewing area.
46
IAQ Probe User Manual
Honeywell
511403
2/07
IAQ Probe Software
Main Screens
Select Axis
Adjusts the scale for all the graph data in the
viewing area, based on the new axis.
Sample Section
This section is only active when using the cursor tool. When the pointer
is on a specific section on the graph, this section will display details for
the selection. This section also allows you to select a specific date and
time to view.
TWA/STEL mean analysis
This section allows you to create a graph based on the mean TWA/
STEL values calculated by the IAQ Probe. If there is no TWA or STEL
data, none of the selection areas are enabled (as shown).
511403
2/07
IAQ Probe User Manual
Honeywell
47
IAQ Probe Software
Main Screens
Graph Toolbar
Draw: Creates a graph from an acquisition (log) file
Zoom in: Zooms in on a graph
Zoom out: Displays the entire graph in the viewing pane
Cursor: Positions the cursor in the graph
Pan: Moves the graph to the left or right
Move annotation: Repositions annotations within a graph
Name tag: Displays the gas name assigned to a curve
Max: Creates a flag identifying the highest point on a graph
Min: Creates a flag indentifying the lowest point on a graph
Erase: Deletes the displayed graph from the screen
Print: Provides access to print options
Exiting the IAQ Probe software
The Quit button in the lower right portion of the IAQ
Probe software window allows users to exit the
application.
When you click on Quit, a confirmation window appears, asking you to
confirm the quit command. Click Yes to exit the application.
48
IAQ Probe User Manual
Honeywell
511403
2/07
Using the IAQ Probe Software
Getting Started
Using the IAQ Probe Software
Getting Started
When you first start the IAQ Probe software, the Auto Scan Feature
window appears (superimposed) on the main screen, scanning for a
IAQ Probe within range.
If you cancel this command or you are continuing to work (uploading
data from several IAQ Probes) in the Config screen, you can also click
Connect/Refresh to establish a connection.
Since the IAQ Probe software is designed to manage data received
from the IAQ Probe, its functions are disabled when there is no
communication link between software and hardware.
Connecting a IAQ Probe to the Computer
•
Power on the IAQ Probe and wait until it has completed the
initialization sequence (“init” is displayed in the window).
• Position the unit in front of the infrared reader (at a distance of
less than one metre). After a few seconds, an icon appears in
the lower right corner of your computer screen (or a beep is emitted
from the computer speaker) confirming that the IAQ Probe has
been detected by the computer.
• Open the IAQ Probe Software by clicking on Start/Program/
Honeywell/Honeywell IAQ Probe.
Note: Your computer must already be on. If the IAQ Probe was already
in position in front of the infrared port as your computer was
booting up, you may experience problems with the
communication link.
All IAQ Probe software functions are now enabled (“irdA” appears in the
IAQ Probe’s display screen, confirming the communication link.)
511403
2/07
IAQ Probe User Manual
Honeywell
49
Using the IAQ Probe Software
Getting Started
Initializing Acquisition
Once the IAQ Probe is in communication with the software, there are
certain measures to take to ensure an acquisition file free of errors and
representative of the test you wish to conduct:
•
•
•
•
•
Ensure that the date and time settings correspond to the actual
date and time at the acquisition location.
Set the desired acquisition interval.
Be sure to upload and save any previous acquisitions from the IAQ
Probe, if necessary.
Clear the IAQ Probe’s memory in order to start the acquisition at
zero.
Activate the acquisition.
The IAQ Probe is now fully functional and programmed to start
acquisitions.
50
IAQ Probe User Manual
Honeywell
511403
2/07
Using the IAQ Probe Software
Working with the Config Window
Working with the Config Window
The Config window is used mainly to configure the various settings
related to managing the data received from the IAQ Probe and to
upload parameters to the IAQ Probe.
Uploading Parameters to the IAQ Probe
Setting Acquisition Time
The acquisition time is the interval, in seconds or minutes, at which the
IAQ Probe will record sensor data. You can select any number from 1
to 99 and specify whether in minutes or in seconds.
Clicking on Set within the Acquisition Interval Delay window opens a
DAQ warning window.
•
•
•
Click Download then set DAQ time if you wish to save the IAQ
Probe’s data and set the Acquisition Time.
Click Set DAQ time now if you wish to set the Acquisition Time and
clear the IAQ Probe’s memory without uploading it.
Click Cancel to exit this function without any changes (will not clear
the memory or set the acquisition time).
Note: If you select Download then set DAQ time and click Cancel within
the “Save data to...” window, the acquisition time will not be set
and the memory will be cleared without saving.
511403
2/07
IAQ Probe User Manual
Honeywell
51
Using the IAQ Probe Software
Working with the Config Window
Downloading Data from the IAQ Probe
An important function within the Config window is the Download Memory
section, which allows you to download all the data within the IAQ Probe
and save it to s specific folder on your computer.
Saving a File on the Computer
1. Click on the Download Memory button; the Save data to... window
appears.
2. Select a storage location (if different from the default location) and
filename (the default filename is the date and time).
3. Click on Save to store the file. The Download window appears,
indicating the progress.
The resulting file can only be viewed using the IAQ Probe software’s
Acquisition file viewer or in graph format.
Since standard log files can only be viewed using the IAQ Probe
software, you must use either the Generate Log File or the Excel Export
Tool to make it possible for others to view the data.
52
IAQ Probe User Manual
Honeywell
511403
2/07
Using the IAQ Probe Software
Working with the Config Window
Generating Log Files
Generating log files makes acquisition data accessible to others. These
types of log files (semi-colon delimited columnar text) can be viewed
with a variety of standard software, including Microsoft Word, Excel or
Notepad.
•
Click on Tools ans select Generate Log File
•
Click Source File and select the log file to generate (from the
“Generate Log File” window).
Click Target file and type the filename for the new log file
Click Save to create the filename
Click Export to create the log file. The file is now in columnar text
format (with columns for date, acquisition time, gas reading value one column for each gas - and temperature and humidity readings.
•
•
•
511403
2/07
IAQ Probe User Manual
Honeywell
53
Using the IAQ Probe Software
Working with the Config Window
Converting Log Files to Excel
Exporting log files to Excel creates an Excel spreadsheet (that can only
be viewed using Excel).
•
•
•
•
•
54
Click on Tools and select Export to Excel Tool. This opens the Excel
Export Tool
Click Source File and select the log file to convert (from the “Select
File to Export” window).
Click Target file and type the filename for the new Excel file
Click Save to create the filename
Click Export to create the Excel file. The file is now in Excel format
with columns for date, acquisition time, gas reading value (one
column for each gas) and temperature and humidity readings.
IAQ Probe User Manual
Honeywell
511403
2/07
Using the IAQ Probe Software
Working with the Config Window
Viewing Acquisition Data
There are several ways to view acquisition data: in the Acquisition File
Viewer, in Excel or in Word or Notepad. (Since files exported can be
viewed using external software, this section will deal only with the
Acquisition File Viewer.)
Acquisition File Viewer
511403
2/07
IAQ Probe User Manual
Honeywell
55
Using the IAQ Probe Software
Working with the Config Window
The Acquisition file viewer allows users to view unconverted data
directly from the IAQ Probe software. Note that it is only possible to
view one type of acquisition data at a time.
•
•
•
•
•
Click on Tools and select Acquisition File Viewer. The viewer
window opens.
Click on Current loaded file to select the desired acquisition file.
Click on Open File to load the file data for the selected log file.
Click on Acquisition to select acquisition type to display (CO, CO2,
Temperature or Humidity)
Click on Jump to index to view a specific entry number or use the
arrows in Browse file to scroll up or down through all the entries.
Continuous Reading Window
This window enables you to view continuous readings that are
refreshed every second.
If you click to select the Data logging, all information will be logged
(saved to your PC) simultaneously.
56
IAQ Probe User Manual
Honeywell
511403
2/07
Using the IAQ Probe Software
Working with the Graph Window
Working with the Graph Window
The graph window offers a graphical representation of the readings (log
files) obtained by the IAQ Probe. The appearance of the graph can be
modified using the various graph tools.
Displaying graphs
Opening a Graph
Before you can display the graph, you must select the file on which to
base the graph:
1. Click to select the File menu and select Select Acquisition File
2. Select the desired log file from the list and click Load.
3. Click on the DRAW button in the graph toolbar. The graph
appears in the viewing window. You can now change the
appearance of the graph.
Note: Clicking on the DRAW button at any time refreshes the graph and
resets the graph to default settings (as when opened).
Zooming In on a Graph
The zoom tool lets you enlarge a specific portion of the graph:
1. Click on the zoom in button.
2. Click on the image and drag to select the area to enlarge.
Release the mouse button and the graph zooms in on the
specified area.
Viewing an Entire Graph
Click on the zoom out button to display the entire graph in
the viewing pane.
511403
2/07
IAQ Probe User Manual
Honeywell
57
Using the IAQ Probe Software
Working with the Graph Window
Moving the Cursor on a Graph
The cursor button lets you move between fixed setpoints on a graph. In
this mode, the cursor can only move by the intervals at which readings
were recorded.
1. Click on the cursor button.
2. Click and hold the left mouse button and move the cursor
to the desired location.
This option also enables the sample section, which allows you to select
a specific date and time to display in the viewing pane:
Click on GO and the graph will zoom in on the specified timeline.
58
IAQ Probe User Manual
Honeywell
511403
2/07
Using the IAQ Probe Software
Working with the Graph Window
Modifying Graph Appearances
There are many ways to display a graph, depending on what data is
most important to your analysis. The Expanded Tools option in the
Graph menu and the section included below the viewing pane allows
you to change how a graph will appear:
Expanded Tools Option
Selecting Export Graph Image from the Expanded Tools sub menu
opens the “Export Graph Image to...” window. This allows you to export
an image (.png format) of the graph.
Selecting Indicator Band displays a further sub-menu of options (data
types) that lets you select which data to manipulate on the graph.
511403
2/07
IAQ Probe User Manual
Honeywell
59
Using the IAQ Probe Software
Working with the Graph Window
Using the Indicator Band Tool
When you select a data type, two further options are displayed:
Parameters and Enabled (or Disabled, depending on the current
status).
Selecting Parameters opens the data Indicator Band window, which lets
you tailor the following display options:
60
IAQ Probe User Manual
Honeywell
511403
2/07
Using the IAQ Probe Software
Working with the Graph Window
Indicator Band Options:
Enabled:
Inverted:
Activates the indicator band on the graph
Reverses the band settings (settings are applied to
data out of specified band)
Fill Visible:
Activates the fill color for the specified band
Range Area Color:Lets you select a display fill color from a color
selection window.
Dotted:
This drop-down menu lets you select the line pattern
(ex.: dotted, Dash-dot-dot, dash-dot, etc.)
Line Width:
Lets you specify the line width for the selected range
display (does not work with all line patterns)
Line Color:
Lets you select a line color from a color selection
window
Range Area Options:
The Range Area lets you
specify a date and time range to
which to apply the band (see
image at right).
You can also specify the Upper
and Lower limits for the band
(so that any readings outside
the set limits will be more
evident).
511403
2/07
IAQ Probe User Manual
Honeywell
61
Using the IAQ Probe Software
Working with the Graph Window
Graph Controls
The graph controls let you specify what
data to display. The data is presented
on one line, with options listed in
columns that can be selected or
deselected for each data type:
•
•
•
•
•
•
•
Show/Hide
Grid
Auto Range
Fill Base
Tag
Marks
Colors
Show/Hide:
Grid:
Auto Range:
Fill base:
Tag:
62
Excludes or includes the given data from the graph
Displays, or hides, the grid for the specific data
Displays only the range of the readings (rather than
entire range - from 0- 1000)
Creates a filler line between the graph zero and the
actual base reading for the given data. (this option is
best used only for one data type at one time, since
the fill bases will not be individually distinguishable).
Enables the graph to display the data type
name (Gas type, Temperature, Humidity).
This option works in conjunction with the Gas
toolbar button; if the option is selected but the button
is not pressed, no name annotation will appear on
the graph.
IAQ Probe User Manual
Honeywell
511403
2/07
Using the IAQ Probe Software
Working with the Graph Window
Marks:
Colors:
Displays annotations* for minimum and maximum
reading values. This option works in conjunction with
the GAS, MIN and MAX annotation toolbar buttons; if
the option is selected but the button is not pressed, no
reading value annotation will appear on the graph.
Lets you select the line color for the selected data (clicking
on a colored rectangle opens a color selection window).
*Annotations can be moved from their default positions by
selecting the move annotations toolbar button: Click on the
button, then click on the desired annotation (gas, min or max)
and drag the annotation to move it to the desired location.
It is also possible to adjust line thickness by clicking on Graph,selecting
Appearance and selecting Line thickness. Line thickness options range
from 1 (default setting) to 5 (thickest).
Using the Select Axis Option
This function allows you to adjust the zero scale for the selected data
type.
•
•
Select the data type from the drop down
menu (Time axis, CO2, O2, Temp, Rel,
Humidity)
Use the arrows to increase or decrease the
zero value (the lines on the viewing pane
automatically move with each adjustment)
Note: Click on Reset at any time to revert to the original display.
511403
2/07
IAQ Probe User Manual
Honeywell
63
Using the IAQ Probe Software
Working with the Graph Window
Displaying TWA and STEL Data on the Graph
This section is only available if there are reading values for either TWA
or STEL. The controls for TWA and STEL are identical to the central
Graph Controls. To display the values in the viewing pane, simply:
•
•
•
64
Click on Gas Selection,
Select the desired gas and
Click Analyze
IAQ Probe User Manual
Honeywell
511403
2/07
Using the IAQ Probe Software
Working with the Graph Window
Displaying and Printing Statistics
The IAQ Probe Software can also provide detection information in
statistic format. The Statistics Report window can also be modified to
contain supplemental heading information (default values include only
acquisition begin and end times).
•
Click on ADD/EDIT INFO
511403
2/07
IAQ Probe User Manual
Honeywell
65
Using the IAQ Probe Software
Working with the Graph Window
Editing Statistics Report Information
•
•
•
•
66
Type in desired information
Click DONE, when all changes are complete
Click PRINT to print a copy of the statistics
Click CLOSE to exit the statistics Panel
IAQ Probe User Manual
Honeywell
511403
2/07
Using the IAQ Probe Software
Working with the Graph Window
Printing a Graph
The process of printing a graph is identical to printing the Statistics
Report. In the main graph viewing pane, click on the Print icon. This
displays the graph in print format, with the ADD/EDIT INFO option:
•
•
•
•
•
Either select PRINT or ADD/EDIT INFO to add supplemental
information
Modify the information as required and check the items you wish to
print.
Click on DONE to return to the previous window.
Click on PRINT to print the graph displayed on the screen.
Click on CLOSE to close the PRINT window.
511403
2/07
IAQ Probe User Manual
Honeywell
67
Using the IAQ Probe Software
Disconnecting the IAQ Probe
Deleting a Graph from the Screen
Click on the Delete toolbar button. The viewing pane is now
blank.
Disconnecting the IAQ Probe
Before moving the IAQ Probe out of range of the infrared reader, you
must terminate the connection between the device and the computer.
•
Press the Disconnect button to suspend communication.
Note: Withdrawing the IAQ Probe without first disconnecting will affect
all of the unit’s operations. Wait approximately 1 or 2 minutes to
allow the IAQ Probe communication detection to terminate and
the unit to return to its main display. The IAQ Probe software may
also stop responding. If this should occur, you will have to close
the program and restart to continue your work.
68
IAQ Probe User Manual
Honeywell
511403
2/07
Limited Warranty
Limited Warranty
Limited Warranty
Honeywell Analytics, Inc. warrants to the original purchaser and/or
ultimate customer ("Purchaser") of Vulcain products ("Product") that if
any part thereof proves to be defective in material or workmanship
within twelve (12) months, such defective part will be repaired or
replaced, free of charge, at Honeywell Analytics' discretion if shipped
prepaid to Honeywell Analytics at 4005 Matte Blvd., Unit G, Brossard,
Quebec, J4Y 2P4, in a package equal to or in the original container.
The Product will be returned freight prepaid and repaired or replaced if
it is determined by Honeywell Analytics that the part failed due to
defective materials or workmanship. The repair or replacement of any
such defective part shall be Honeywell Analytics' sole and exclusive
responsibility and liability under this limited warranty.
Re-Stocking Policy
The following re-stocking fees will apply when customers return
products for credit:
1. 15% re-stocking fee will be applied if the product is returned within
1 month following the shipping date
2. 30% re-stocking fee will be applied if the product is returned within
3 months following the shipping date
A full credit (less re-stocking fee) will only be issued if the product is in
perfect working condition. (If repairs are required on the returned
product, the cost of these repairs will be deducted from the credit to be
issued.)
No credits will be issued beyond the three month period.
511403
2/07
IAQ Probe User Manual
Honeywell
69
Limited Warranty
Exclusions
a. If Gas sensors are part of the Product, the gas sensor is covered by
a twelve (12) month limited warranty of the manufacturer.
b. If gas sensors are covered by this limited warranty, the gas sensor
is subject to inspection by Honeywell Analytics for extended
exposure to excessive gas concentrations if a claim by the
Purchaser is made under this limited warranty. Should such
inspection indicate that the gas sensor has been expended rather
than failed prematurely, this limited warranty shall not apply to the
Product.
c. This limited warranty does not cover consumable items, such as
batteries, or items subject to wear or periodic replacement,
including lamps, fuses, valves, vanes, sensor elements, cartridges,
or filter elements.
Warranty Limitation and Exclusion
Honeywell Analytics will have no further obligation under this limited
warranty. All warranty obligations of Honeywell Analytics are
extinguishable if the Product has been subject to abuse, misuse,
negligence, or accident or if the Purchaser fails to perform any of the
duties set forth in this limited warranty or if the Product has not been
operated in accordance with instructions, or if the Product
serial number has been removed or altered.
511403
2/07
IAQ Probe User Manual
Honeywell
70
Limited Warranty
Disclaimer of Unstated Warranties
The warranty printed above is the only warranty applicable to this
purchase. All other warranties, express or implied, including, but not
limited to, the implied warranties of merchantability or fitness for a
particular purpose are hereby disclaimed.
Limitation of Liability
It is understood and agreed that Honeywell Analytics’ liability, whether
in contract, in tort, under any warranty, in negligence or otherwise shall
not exceed the amount of the purchase price paid by the purchaser for
the product and under no circumstances shall honeywell analytics be
liable for special, indirect, or consequential damages. The price stated
for the product is a consideration limiting Honeywell Analytics' liability.
No action, regardless of form, arising out of the transactions under this
warranty may be brought by the purchaser more than one year after the
cause of actions has occurred.
511403
2/07
IAQ Probe User Manual
Honeywell
71
Dispositif de détection de gaz portatif
IAQ Probe
Manuel d’utilisateur
ERP 511403
2/07
Avis et marques de commerce
Tous droits réservés par Honeywell International Inc.
Parution 511403 février 2007
Quoique cette information est présentée en bonne foi et est présumée exacte,
Honeywell décline la garantie tacite de la qualité marchande pour un emploi
particulier et offre aucune garantie exprès, à l’exception des conventions écrites
avec et pour ses clients.
Honeywell ne sera, sous aucune circonstance, responsable à qui que ce soit
pour des dommages spéciaux ou indirectes. Les informations et les
spécifications dans ce document sont susceptibles d’être modifiées sans
préavis.
Honeywell Analytics
4005 Matte Blvd, Local G
Brossard, Québec, J4Y 2P4
511403
2/07
Manuel d’utilisateur IAQ Probe
Honeywell
iii
Contactes
Web
Les sites Web suivant d’Honeywell peuvent être utilies pour nos clients :
Organisation Honeywell
Corporate
Life Sciences
International
Adresses WWW (URL)
http:/www.honeywell.com
www.gasalarm.com
http:/content.honeywell.com/global/
Téléphone
Utiliser les numéros de téléphone ci-dessous pour nous contacter :
Organisation
États Unis
et Canada
Asie Pacifique
Europe
Amérique latine
Honeywell Internaltional Inc.
Analytics
Honeywell Asia Pacific Inc.
Hong Kong
Honeywell Pace
Brussels, Belgium
Honeywell International Inc.
Sunrise, Floride, É.U.
Numéro de téléphone
1-800-444-9935
1-913-894-1185
Fax: 1-913-894-1296
(852) 23 31 9133
[32-2]728-2711
(954) 845-2600
Informations des ventes
Nous contacter à [email protected]
511403
2/07
Manuel d’utilisateur IAQ Probe
Honeywell
v
Définitions des symboles
Le tableau suivant contient la liste des symboles utilisés dans ce
document pour indiquer certaine conditions :
Symbole
Définition
ATTENTION: Identifie une information demandant
une attention spéciale
Truc: Identifie un conseil ou un truc pour
l’utilisateur, souvent concernant une tâche
RÉFÉRENCE- INTERNE Indique une source
d’information supplémentaire à l’intérieur du
document.
ATTENTION
511403
2/07
Indique une situation à éviter pouvant entraîner des
dommages au système ou la perte de travail
(documents) ou pouvant prévenir l’opération
normale du système.
ATTENTION : Indique une situation potentiellement
dangereuse qui peut entraîner des blessures
mineures ou modérées si pas évité. Peut
également signaler des actions dangereuses
ATTENTION: Un symbole sur l’équipement qui
réfère l’utilisateur à la documentation pour de plus
amples informations. Ce symbole apparaît à côté
des informations nécessaires dans le manuel.
AVERTISSEMENT : Indique une situation
potentiellement dangereuse qui peut entraîner des
blessures majeures ou la mort si pas évité.
AVERTISSEMENT Un symbole sur l’équipement
qui réfère l’utilisateur à la documentation pour de
plus amples informations. Ce symbole apparaît à
côté des informations nécessaires dans le manuel.
Manuel d’utilisateur IAQ Probe
Honeywell
vii
Table des Matières
Table des Matières
IAQ PROBE MATÉRIEL ................................................11
Caractéristiques générales ................................................................ 11
Caractéristiques IAQ Probe ................................................................... 11
Clavier IAQ Probe ................................................................................. 12
Comment installer et enlever la pile ...................................................... 13
Interface utilisateur ............................................................................ 14
Initialisation ............................................................................................ 14
Icônes d’affichage ................................................................................. 15
Menu principal ....................................................................................... 16
Étalonnage des sondes ..................................................................... 17
Étalonnage du zéro ............................................................................... 17
Configurer la valeur de gaz d’étalonnage .............................................. 18
Étalonner les sondes CO et CO2 .......................................................... 18
Configuration d’alarmes ........................................................................ 20
Choisir l’unité de mesure de température ............................................. 21
Ajustement de température .................................................................. 21
MENUS TWA ET STEL ........................................................................ 22
Activer le mode de vibration .................................................................. 23
Recharger la pile ................................................................................... 23
Interrupteur automatique ....................................................................... 23
Dépannage ............................................................................................ 24
Spécifications .................................................................................... 25
Mémoire de l’enregistreur de données .................................................. 25
Inspections et étalonnages réguliers ..................................................... 26
LOGICIEL IAQ PROBE ................................................27
Installation ......................................................................................... 27
Exigences minimales de système ......................................................... 27
Installation du port infrarouge ................................................................ 28
Vérification de la communication infrarouge ......................................... 29
511403
2/07
Manuel d’utilisateur IAQ Probe
Honeywell
ix
Table des Matières
INTERFACE UTILISATEUR .......................................... 30
Options de menu ...............................................................................30
Écrans principaux ..............................................................................33
Écran Config ..........................................................................................35
Écran Graph ...........................................................................................43
Quitter le logiciel IAQ Probe ...................................................................46
COMMENT UTILISER LE LOGICIEL IAQ PROBE ....... 47
Démarrage .........................................................................................47
Communication entre le IAQ Probe et le logiciel ...................................48
Initialisation de l’acquisition ....................................................................48
Comment utiliser la fenêtre Config ....................................................49
Téléchargement de paramètre au IAQ Probe ........................................49
Téléchargement de données du IAQ Probe ..........................................50
Visionner les données d’acquisition .......................................................53
Fenêtre Continuous Reading .................................................................54
Comment utiliser la fenêtre Graph .....................................................55
Affichage des graphique ........................................................................55
Modifier l’apparence d’un graphique ......................................................57
Imprimer un graphique ...........................................................................65
Supprimer un graphique affiché .............................................................66
Déconnexion du IAQ Probe ...............................................................66
GARANTIE LIMITÉE ...................................................... 67
Garantie limitée ......................................................................................67
Politique de Retour ................................................................................67
Exclusions ..............................................................................................68
Limitation et exclusion de la garantie .....................................................68
Dénégation de responsabilité d’autres garanties ...................................69
Limitation de responsabilité ...................................................................69
x
90DM4 Instruction and Installation Manual
Honeywell
511403
2/07
IAQ Probe matériel
Caractéristiques générales
IAQ Probe matériel
Caractéristiques générales
Lecteur de température
et d’humidité
Compartiment
de sonde
Indicateur
d’alarme
indicateur de
chargement de
pile
Afficheur
Flèches haut/bas
Touche Enter
Touche mise
sous/kors tension
Alarme sonore
Touche Mode/Esc
Caractéristiques IAQ Probe
Capteur de température
et d’humidité :
Compartiment de
sonde :
Indicateur d’alarme :
Indicateur de
Chargement de pile :
511403
2/07
Ce capteur ressemblet une antenne et est
flexible pour éviter de l’endommager.
Le IAQ Probe comporte deux sondes de
détection de gaz, soit : CO2 (Dioxyde de
carbone) et CO (Monoxyde de carbone).
Trois DEL clignotent à une fréquence de 1
Hertz (1 fois par seconde) pour indiquer un
alarme bas et à 4 Hertz (4 fois par secondes)
pour indiquer un alarm haut.
La lumière d’indication verte s’allume lors du
chargement de la pile et s’éteint lorsque la pile
est complètement chargée.
Manuel d’utilisateur IAQ Probe
Honeywell
11
IAQ Probe matériel
Caractéristiques générales
Affichage :
Alarme sonore :
Prise d’alimentation :
Port infrarouge :
Cette unité est munie d’un écran à CL haut
contraste 5.7 cm x 4.8 cm (2 1/4 po x 1 7/8 po)
avec un rétroéclairage surbrillant pour des
conditions à faible niveau de lumière. Le
rétroéclairage est activé lors de la pression sur
une touche et s’éteint automatiquement après
un délais de 5 minutes.
Indique le déclenchement d’un alarme.
Port de connection
pour le chargeur de
pile du IAQ Probe
Permet au IAQ Probe
de communiquer avec
un ordinateur
Port infrarouge
Prise d'alimentation AC
Port d’étalonnage CO2 : Permet d’exposer la
sonde CO2 au gaz
d’étalonnage
Port d’étalonnage CO : Permet d’exposer la
sonde CO au gaz
d’étalonnage
Port d'étalonnage CO
Port d'étalonnage
CO2
Clavier IAQ Probe
Flèches haut/bas :
Touche Enter :
Touche interrupteur :
Touche Mode/ESC :
12
Utilisées pour naviguer les menus, pour
sélectionner ou pour modifier les divers
paramètres.
Arrête le défilement automatique des gaz sur
l’écran et confirme les sélections du menu.
Met l’unité sous tension et hors tension.
Permet d’accéder au menu principal ou de
quitter le mode IrdA.
90DM4 Instruction and Installation Manual
Honeywell
511403
2/07
IAQ Probe matériel
Caractéristiques générales
Comment installer et enlever la pile
L’installation de la pile est simple :
1.
2.
3.
Ouvrir le panneau arrière
Mettre la pile en position (tel qu’illustré) puis glisser vers le haut du
compartiment de pile
Lorsque la pile est en position (le dispositif de verrouillage fait un
« clique »), fermer le panneau arrière.
1
2
3
La procédure pour enlever la pile est identique, mais en ordre inverse
de l’installation. Ne pas oublier d’appuyer sur le bouton pour
déverrouiller la pile.
511403
2/07
Manuel d’utilisateur IAQ Probe
Honeywell
13
IAQ Probe matériel
Interface utilisateur
Interface utilisateur
Initialisation
Le IAQ Probe s’initialise lors de la mise sous tension et vérifie
automatiquement ses sondes et ses périphériques (tels la mémoire).
L’écran peut contenir plusieurs informations, la majorité sous forme
d’icône.
L’écran affiche les informations suivante, en ordre de ligne (ce ne sont
pas toutes les informations qui sont affichées simultanément) :
Ligne 1:
Ligne 2:
Ligne 3:
Ligne 4:
Ligne 5:
Ligne 6:
Ligne 7:
14
Gaz détectés (CO2 et CO) et communication
Barre d’état de niveau de concentration
Concentration, unité de mesure et état de verrouillage
Icône de vibration et statut d’alarme
Icônes et valeurs de température et d’humidité icon
Barre d’état d’acqusition (mémoire utilisée)
Barre d’état de pile (puissance de pile).
90DM4 Instruction and Installation Manual
Honeywell
511403
2/07
IAQ Probe matériel
Interface utilisateur
Icônes d’affichage
Transfert
de données :
Clé :
Statut :
Indicateur de
niveau de gaz :
Vibration :
Alarme Low
et High :
Température
et humidité :
Barre d’état
d’acquisition :
Indicateur de
pile :
511403
2/07
Indique que le IAQ Probe est en
communication avec un ordinateur et
que le transfert de données est en
cours. Tx clignote pendant le transfert de
données à un ordinateur. Rx clignote pendant la
réception de données provenant d’un ordinateur.
Indique que l’affichage est verrouillé sur
le gaz en cours. Le IAQ Probe continue
de détecter les autres gaz, même si
ceux-ci ne sont pas affichés. Cet icône clignote lors
de la mise sous tension.
« noA » est affiché pendant l’initialisation
pour indiquer que le IAQ Probe n’est pas
en mode d’acquisition.
Représentation graphique du niveau de
concentration de gaz. Le plus de
segments affichés, le plus élevé le niveau
de concentration (barre complète indique le
maximum de la plage).
Indique que la vibration sera activée lors
d’un alarme.
Alarm est toujours affiché lorsqu’un
alarme
est configuré. Low ou High sera affiché
selon le niveau d’alarme activé et
seulement pour le gaz en question
Les niveaux de température et
d’humidité sont affichés à côté de cet
icône.
Indique que l’acquisition de données est
en cours et affiche le progrès de
l’enregistrement dans la mémoire
du IAQ Probe
Indique le niveau de puissance de la
pile.
Manuel d’utilisateur IAQ Probe
Honeywell
15
IAQ Probe matériel
Interface utilisateur
Menu principal
La touche Mode/ESC permet d’accéder au menu principal. Ce menu
permet ensuite d’accéder aux menus secondaires. Appuyer sur la
touche Mode/ESC une deuxième fois pour quitter le menu.
Éléments du menu principal
TWA:
STEL:
Zero:
Span:
Gas:
Alarm:
Affiche la valeur Moyenne pondérée dans le temps (Time
Weighted Average). Cette valeur est extrapolée pendant les
huit premières heures d’acquisition.
Affiche la valeur de Limite d’exposition à court terme (Short
Time Exposure Limit). Cette valeur est extrapolée pendant
les 15 premières minutes d’acquisition.
Permet l’étalonnage du zéro des sondes.
Permet l’étalonnage de la lecture (plage) des sondes.
Permet de régler la lecture de gaz d’étalonnage de la sonde.
Permet de modifier les niveaux d’alarme (Low et High).
Permet d’activer ou désactiver la vibration lors d’un alarme.
Ce menu ne sera pas affiché s’il n’y a pas de capteur de
température. Permet de sélectionnner l’unité de mesure
de température et d’étalonner les sondes de température
et d’humidité.
Affiche brièvement lors de l’appui sur la touche Enter.
Affiche brièvement lors de l’appui sur les flèches.
16
90DM4 Instruction and Installation Manual
Honeywell
511403
2/07
IAQ Probe matériel
Étalonnage des sondes
Étalonnage des sondes
Toutes les sondes de détection de gaz nécessitent un étalonnage
périodique pour assurer la précision et le bon fonctionnement. La
fréquence de l’étalonnage, et de l’entretien, dépend du type de sonde
et les conditions d’opération.
•
Ne jamais étalonner les sondes lorsque le IAQ Probe indique une
pile faible.
Étalonnage du zéro
Chaque port d’étalonnage est lié à une sonde. Pour étalonner la sonde
CO2, connecter le tuyau d’étalonnage au port d’étalonnage CO2 (port
d’étalonnage CO pour étalonner la sonde CO) et suivre ces
instructions :
ATTENTION
Ne jamais étalonner le zéro de la sonde à l’air ambiant
seulement. Toujours utiliser l’azote (N2).
1.
2.
Connecter le tuyau au port d’étalonnage désiré
Connecter le tuyau au régulateur (connecté à la bouteille de gas
appropriée)
3. Appuyer sur Mode/Esc pour accéder au menu principal.
4. Utiliser les flèches pour naviguer à Zero puis
appuyer sur Enter pour sélectionner. L’écran affiche
« n2 », le type de gaz d’étalonnage (N2 azote).
5. Utiliser les flèches pour afficher la sonde à
étalonner puis appuyer sur Enter pour sélectionner.
L’écran suivant demande la confirmation (« no » est affiché)
6. Émettre l’azote au débit indiqué sur la bouteille avant de démarrer
l’étalonnage.
7. Utiliser les flèches pour naviguer à « YES » puis
appuyer sur Enter pour confirmer. CAL est affiché
pour confirmer que l’étalonnage est en cours.
8. Lorsque l’étalonnage est terminé, le IAQ Probe
retourne au menu principal.
9. Appuyer sur Mode/Esc pour quitter le menu.
Répéter pour l’autre sonde, si nécessaire.
511403
2/07
Manuel d’utilisateur IAQ Probe
Honeywell
17
IAQ Probe matériel
Étalonnage des sondes
Configurer la valeur de gaz d’étalonnage
Avant de procéder à l’étalonnage d’une sonde, il est essentiel
d’assurer que la valeur de concentration de gaz d’étalonnage du IAQ
Probe soit identique à la valeur indiquée sur la bouteille dde gaz
d’étalonnage.
1.
2.
3.
4.
5.
6.
7.
Appuyer sur Mode/Esc pour accéder au menu principal.
Utiliser les flèches pour naviguer à Gas puis appuyer sur Enter
pour confirmer.
Utiliser les flèches pour naviguer entre CO2 et CO puis appuyer
sur Enter pour sélectionner. La concentration pour la sonde
sélectionnée est affichée.
Appuyer sur Enter. La concentration est modifiable lorsqu’elle
clignote.
Utiliser les flèches pour modifier la valeur (augmenter ou diminuer,
selon les informations sur la bouteille) puis appuyer sur Enter pour
confirmer.
Appuyer sur Mode/ESC pour revenir au menu principal.
Appuyer sur Mode/Esc pour quitter le menu principal.
Étalonner les sondes CO et CO2
18
90DM4 Instruction and Installation Manual
Honeywell
511403
2/07
IAQ Probe matériel
Étalonnage des sondes
1.
2.
3.
4.
5.
6.
Insérer le tube, connecté à la bouteille de gaz d’étalonnage, dans
le port d’étalonnage (tel qu’illustré) et commencer à émettre le gaz.
Appuyer sur Mode/Esc pour accéder au menu principal.
Utiliser les flèches pour naviguer à Span puis appuyer sur Enter
pour sélectionner. L’écran affiche SPAn.
Utiliser les flèches pour afficher la sonde à étalonner puis appuyer
sur Enter pour sélectionner. L’écran suivant demande une
confirmation (« no » est affiché)
Utiliser les flèches pour naviguer à « YES » puis appuyer sur Enter
pour confirmer. CAL est affiché à l’écran (la valeur est affichée
pour l’étalonnage de la sonde CO, et non CAL) pour confirmer que
l’étalonnage est en cours.
Appuyer sur Mode/Esc pour quitter le menu principal.
ATTENTION
Ne pas appuyer sur la touche Enter pour confirmer la
sélection sans émettre le gaz d’étalonnage pendant au
moins une minute avant de débuter. Le gaz doit être émis le
long du processus d’étalonnage.
Répéter le processus pour l’autre sonde, si nécessaire. Ne pas oublier
de changer le tuyau d’étalonnage de place (port d’étalonnage) avant de
procéder à l’étalonnage de l’autre sonde.
Note: Toujours vérifier l’étalonnage en émettant de nouveau le gaz; si la
lecture est identique au gaz d’étalonnage, l’étalonnage a réussi.
511403
2/07
Manuel d’utilisateur IAQ Probe
Honeywell
19
IAQ Probe matériel
Étalonnage des sondes
Configuration d’alarmes
Le IAQ Probe est configuré avec des niveaux d’alarme par défaut.
Cependant, il est possible de modifier la configuration des alarmes au
besoin.
1.
2.
Appuyer sur Mode/Esc pour accéder au
menu principal.
Utiliser les flèches pour naviguer à Alarm
puis appuyer sur Enter pour sélectionner.
Utiliser les flèches pour afficher soit la sonde
CO2 ou la sonde CO puis appuyer sur Enter
pour sélectionner.
Utiliser les flèches pour afficher soit LOW ou HIGH puis appuyer
sur Enter pour sélectionner. (Le niveau de concentration clignote
lorsqu’en mode édition.)
Utiliser les flèches pour modifier la valeur d’alarme (augmenter ou
diminuer) puis appuyer sur Enter pour confirmer.
Répéter les étapes 3 à 5 pour l’autre niveau d’alarme.
Répéter les étapes 3 à 6 pour l’autre sonde.
Appuyer sur Mode/Esc pour quitter le menu principal.
MODE
ALARM
3.
4.
5.
6.
7.
8.
20
90DM4 Instruction and Installation Manual
Honeywell
HIGH
Alarm
511403
2/07
IAQ Probe matériel
Étalonnage des sondes
Choisir l’unité de mesure de température
Le IAQ Probe peut afficher la lecture de température soit en degrés
Farenheit ou en degrés Celcius :
1.
2.
3.
4.
5.
Appuyer sur Mode/Esc pour accéder au menu principal.
Utiliser les flèches pour naviguer au menu °C/°F puis appuyer sur
Enter pour sélectionner.
Utiliser les flèches pour afficher soit ºC ou ºF puis appuyer sur
Enter pour sélectionner.
Appuyer sur Enter pour confirmer la sélection et retourner au menu
principal.
Appuyer sur Mode/Esc pour quitter le menu principal.
Ajustement de température
Le menu de température du IAQ Probe donne également accès aux
commandes d’humidité de la sonde. Ce menu permet d’ajuster les
valeurs de température et d’humidité :
1.
2.
3.
4.
5.
6.
Appuyer sur Mode/Esc pour accéder au menu principal.
Utiliser les flèches pour naviguer au menu °C/°F puis appuyer sur
Enter pour sélectionner.
Dans l’écran du menu °C/°F, appuyer sur la
touche Enter et maintenir enfoncé pendant 3
secondes. L’écran Adj est affiché.
Appuyer sur Enter pour sélectionner la
fonction d’ajustement.
Utiliser les flèches pour afficher soit la
température ou l’humidité puis appuyer sur
Enter pour sélectionner. La valeur est affichée.
Appuyer sur Enter pour modifier la valeur
(clignote lorsqu’en mode édition). Utiliser les
flèches pour augmenter ou diminuer la valeur
puis appuyer sur Enter pour confirmer et
enregistrer la valeur.
Répéter les étapes 2 à 7 pour l’autre sonde,
au besoin.
Appuyer sur Mode/Esc pour quitter le menu principal.
%RH
7.
8.
511403
2/07
Manuel d’utilisateur IAQ Probe
Honeywell
21
IAQ Probe matériel
Étalonnage des sondes
MENUS TWA ET STEL
Ces menus affichent les concentrations de moyennes pondérées dans
le temps (TWA) et de Limite d’exposition de courte durée (STEL). Les
valeurs affichées sont aux fins de consultation seulement et ne peuvent
pas être modifiées.
MODE
TWA
STEL
TWA
TWA indique la moyenne pondérée dans le temps de la sonde. Ceci
est la limite d’exposition pour le personnel, basée sur 8 heures par jour,
40 heures par semaines.
1.
2.
3.
Appuyer sur Mode/Esc pour accéder au menu principal.
Utiliser les flèches pour naviguer au menu TWA puis appuyer sur
Enter pour sélectionner. La concentration est affichée.
Appuyer sur Mode/Esc pour quitter le menu principal.
STEL
STEL indique la limite d’exposition à court terme. Puisque le STEL est
basé sur l’exposition maximum sécuritaire sur une période de 15
minutes, ces données sont enregistrées à toutes les 15 minutes.
1.
2.
3.
22
Appuyer sur Mode/Esc pour accéder au menu principal.
Utiliser les flèches pour naviguer au menu STEL puis appuyer sur
Enter pour sélectionner. La concentration est affichée.
Appuyer sur Mode/Esc pour quitter le menu principal.
90DM4 Instruction and Installation Manual
Honeywell
511403
2/07
IAQ Probe matériel
Étalonnage des sondes
Activer le mode de vibration
1.
2.
3.
4.
Appuyer sur Mode/Esc pour accéder au menu principal.
Utiliser les flèches pour naviguer à l’icône vibration puis appuyer
sur Enter pour sélectionner.
Utiliser les flèches pour afficher soit Off ou On puis appuyer sur
Enter pour sélectionner
Appuyer sur Mode/Esc pour quitter le menu principal.
Recharger la pile
Un alarme sonore sonne lorsque la pile est faible. Le IAQ Probe affiche
« batt » à des intervalles de deux minutes. Simplement connecter le
convertisseur à une prise et au IAQ Probe pour recharger la pile.
Note: Utiliser uniquement le convertisseur d’origine du IAQ Probe.
L’utilisation d’autres convertisseurs peut endommager la pile.
Interrupteur automatique
Lorsque la puissance de la pile du IAQ Probe atteint une faiblesse
critique, l’appareil se met automatiquement hors tension pour éviter les
dommages qui peuvent survenir lors du déchargement complet de la
pile. Le cas échéant, il est nécessaire de complètement recharger la
pile avant d’utiliser le IAQ Probe.
La barre d’état de la pile clignote lorsque la pile est faible.
Les segments de la barre d’état déroulent lors du chargement de la pile.
511403
2/07
Manuel d’utilisateur IAQ Probe
Honeywell
23
IAQ Probe matériel
Étalonnage des sondes
Dépannage
Codes d’erreurs IAQ Probe
QUAND
Pendant
étalonnage
CODE
ERR0
DESCRIPTION
La sonde ne réagit pas
au gaz.
ERR1
La lecture du gaz est
trop élevée et le IAQ
Probe ne peut pas le
diminuer
Pendant
étalonnage
ERR2
La lecture de gaz est
trop basse et le IAQ
Probe ne peut pas
l’augmenter
Pendant
étalonnage
ERR3
Impossible d’étalonner
le zéro de la sonde.
Pendant
étalonnage
ERR4
Impossible d’étalonner
le zéro RTD.
Pendant
étalonnage
Mise sous
tension
Mise sous
tension
ERR5
L’horloge dysfonctionne
lors de l’initialisation.
ERR6
Cette erreur est
affichée lors de
l’enregistrement si la
mémoire du dispositif
fait défaut.
SOLUTION
Vérifier que le gaz
atteint bien la sonde.
La sonde est
possiblement
défectueuse ou atteint
sa fin de vie et doit
être remplacée.
La sonde a
probablement déviée
et est maintenant hors
de la plage normale.
La sonde a
possiblement été
contaminée ou atteint
sa fin de vie et doit
être remplacée
Lors d’une telle erreur,
l’acquisition ne
fonctionnera pas,
cependant toutes
autres fonctions seront
toujours disponibles.
Note: Chaque code d’erreur sera affiché jusqu’à l’appui sur n’importe
quelle touche. Communiquer avec le soutien technique de
Vulcain pour tout code d’erreur.
24
90DM4 Instruction and Installation Manual
Honeywell
511403
2/07
IAQ Probe matériel
Spécifications
Spécifications
Alimentation :
Durée de vie de la pile:
Technologies de détection :
Affichage :
Intensité de l’alarme :
Plage d’humidité
d’opération :
Plage de temperature
d’opération :
Plage par défaut :
Pile au lithium rechargeable
16 heures
Electrochimique (CO)
Infrarouge (CO2)
RTD (température)
Polymère capacitif (humidité relative)
À CL au contraste élevé avec rétroéclairage surbrillant
85 dB
0% - 95% RH (non-condensée)
0°C - 40°C (32°F - 104°F)
CO : 0 – 250 ppm
CO2 : 0 – 5000 ppm
RTD:
Polymère capacitif :
Dimensions:
0°C - 40°C
0 - 95% RH
4 cm x 16.5 cm x 8.5 cm
(1.6 po x 6.5 po x 3.3 po)
415 g / 14.65 oz.
Poids :
Mémoire de l’enregistreur de données
L’enregistreur de données du IAQ Probe comporte 4 Mo de mémoire.
La capacité d’enregistrement, en jours, dépend du nombre de types de
données et de la fréquence d’enregistrement (le tableau ci-dessous
présente quelques exemples).
Types de données
CO2, T, RH, CO
CO2, T, RH, CO
CO2
CO2
511403
2/07
Fréquencye
aux 10 secondes
aux 30 secondes
aux 10 secondes
aux 30 secondes
Nombre de jours
enregistrés
77
233
312
938
Manuel d’utilisateur IAQ Probe
Honeywell
25
IAQ Probe matériel
Spécifications
Inspections et étalonnages réguliers
Cet appareil doit être étalonné. La fréquence d’étalonnage dépend des
conditions spécifiques d’utilisation, tel l’exposition à des températures
extrêmes, à des contaminants ou à des concentrations de gaz élevées.
L’étalonnage doit être inclus dans un programme de prévention visant à
assurer le fonctionnement de l’unité de détection.
ATTENTION
26
Lorsque l’étalonnage ne peut s’effectuer correctement, il est
possible que la sonde ait atteint ou atteindra sa fin de vie et
doit être remplacée.
90DM4 Instruction and Installation Manual
Honeywell
511403
2/07
Logiciel IAQ Probe
Installation
Logiciel IAQ Probe
Installation
Exigences minimales de système
Votre système doit rencontrer les exigences minimales pour
l’installation et l’utilisation du logiciel IAQ Probe.:
•
•
•
•
•
•
Microprocesseur Pentium II 266 MHz
Système d’exploitation Windows 98 SE/ME/2000/XP
RAM minimum 64 MB (128 MB recommandé)
15 MB d’espace libre sur le disque dur
Adapteur vidéo 1028 x 768 avec 8 MB de RAM vidéo
Un port USB ou IrDA disponible
Lorsque le Cédérom d’installation du logiciel IAQ Probe est inséré dans
le lecteur, le système ouvre automatiquement* la fenêtre d’installation
avec quatre options :
•
•
•
•
Install IAQ ProbeTM Deluxe
Install USB IrDA Adapter Driver
Windows 2000 IR hotfix
Install Adobe Acrobat Reader 5.05
* Si le logiciel de montage ne démarre pas automatiquement, ouvrir
Windows Explorer (Windows 98, 2000, XP), double cliquer sur My
Computer, double cliquer sur le lecteur de Cédérom puis double cliquer
sur SPSInstall.exe.
511403
2/07
Manuel d’utilisateur IAQ Probe
Honeywell
27
Logiciel IAQ Probe
Installation
Avant de passer à l’installation du logiciel, il est nécessaire d’installer le
port infrarouge :
Installation du port infrarouge
Sélectionner la deuxième option de la fenêtre d’installation du IAQ
Probe : Install IrDA USB Adapter Drivers. Une fenêtre de référence
apparaît. Cliquer sur CONTINUE pour procéder.
Ceci démarre l’assistant d’installation « USB-IrDA Adapter Setup ».
Simplement suivre les instructions à l’écran.
Note: Pour les utilisateurs d’ordinateur portatif avec port infrarouge
intégré, passez à l’installation du logiciel IAQ Probe.
28
90DM4 Instruction and Installation Manual
Honeywell
511403
2/07
Logiciel IAQ Probe
Installation
INSTALLLER LE LOGICIEL IAQ PROBE
Sélectionner la première option dans la fenêtre d’installation : « Install
IAQ Probe ». L’installation commence aussitôt. Suivre les instructions
de l’assistant de configuration du logiciel jusqu’à la fin. Lorsque
l’assistant recommande de redémarrer l’ordinateur, accepter pour
redémarrer et terminer le processus d’installation.
Vérification de la communication infrarouge
Il est nécessaire de vérifier le bon fonctionnement de la communication
infrarouge avant d’utiliser le logiciel IAQ Probe :
•
•
•
•
Ouvrir le panneau de configuration puis sélectionner Options
téléphone et modem. Si aucun modem n’est installé, inscrire votre
pays et votre code régional dans l’espace fournit à cet effet.
Cliquer sur l’onglet Modems.
Standard Modem over IR link
devrait apparaître dans la
colonne Modem. Si le IAQ
Probe n’est pas face au
lecteur infrarouge, Not present
devrait apparaître dans la
colonne Attached To.
Lorsque le IAQ Probe est en
marche et face au lecteur
infrarouge, un signal sonore
indique que le système a
détecté du nouveau matériel.
L’information dans la colonne
Attached To change de Not
present à COM #. Ceci est le numéro du port de communication
utilisé par la communication infrarouge. Ce numéro est nécessaire
pour la configuration de la communication du logiciel.
Si rien n’est affiché, mettre le IAQ Probe directement devant le dispositif
infrarouge pour faciliter sa détection.
511403
2/07
Manuel d’utilisateur IAQ Probe
Honeywell
29
Interface utilisateur
Options de menu
Interface utilisateur
Options de menu
L’écran principal du IAQ Probe contient 4 options de menu, chacune
avec des options de sous-menu :
Options du menu File
Select Acquisition
File (F1):
Permet d’ouvrir un fichier
d’acquisition.
Select Log Directory
(F2):
Permet de préciser unrépertoire
d’enregistrement de fichier journal.
Parameters:
Permet de configurer 3 options, soit :
connection time limit, introduction et autorun.
Tech Features (F11):
Cette section du logiciel est réservée aux
techniciens qualifiés. Un mot de passe est
nécessaire pour y accéder.
Quit (F12):
Quitte le logiciel.
30
90DM4 Instruction and Installation Manual
Honeywell
511403
2/07
Interface utilisateur
Options de menu
Options du menu Graph
Appearance :
Permet de configurer l’apparence du
graphique.
Graph Tools :
Contient plusieurs options pour préciser
quelles informations seront affichées dans le
graphique
Expanded Tools :
Permet d’exporter un fichier image (format
.png) du graphique et donne accès à l’outil
« Indicator Band » pour chaque type
d’acquisition.
Generate File From
Plot Area Selection
Créé un fichier séparé basé sur une sélection
particulière du graphique
Statistics Report :
Affiche les statistiques d’une acquisition ou
d’un fichier journal
Options du menu Tools
Generate Log File:
Génère un fichier journal séparé.
Excel Export Tool:
Exporte les données à une feuille de calcul
Excel.
Acquisition File
Affiche les données, une à la fois, dans une
fenêtre de visualisation
511403
2/07
Manuel d’utilisateur IAQ Probe
Honeywell
31
Interface utilisateur
Options de menu
Options du menu Help
User’s Guide:
Affiche le manuel de l’utilisateur en format
PDF.
Web Links:
Donne accès direct à des adresses Internet.
About IAQ Probe:
Information concernant le logiciel IAQ Probe
et comment contacter Vulcain.
32
90DM4 Instruction and Installation Manual
Honeywell
511403
2/07
Interface utilisateur
Écrans principaux
Écrans principaux
Le IAQ Probe offre deux fenêtres (onglets) principales, chacune avec
ses propres fonctions.
L’écran « Config » contient plusieurs sections d’information ou de
fonctions qui seront expliquées dans cette section du manuel :
IAQ Sensors
Event Log Viewer
Air Quality
Humidity
Activate ACQ
511403
2/07
Memory Content
Clear Memory
IAQ Settings
Download Memory
Memory Status
Manuel d’utilisateur IAQ Probe
Honeywell
33
Interface utilisateur
Écrans principaux
L’écran « Graph » contient une section de visualisation graphique et
une section comportant plusieurs fonctions reliées aux apparences du
graphique :
•
•
•
•
•
34
Graph Controls
Auto Scale
Offset
Sample selection
TWA/STEL mean analysis
90DM4 Instruction and Installation Manual
Honeywell
511403
2/07
Interface utilisateur
Écrans principaux
Écran Config
L’écran Config est l’interface primaire, permettant de télécharger par
amont les informations du IAQ Probe. Cet écran comporte plusieurs
sections distinctes :
511403
2/07
Manuel d’utilisateur IAQ Probe
Honeywell
35
Interface utilisateur
Écrans principaux
Section communication
Cette section gère le lien entre le IAQ Probe et le logiciel.
COM Port x:
Un menu déroulant affiche les ports de
communication disponibles au dispositf infrarouge
Connect/Refresh: Démarre la connexion avec le IAQ Probe et la
transmission de données. (La lumière verte indique
une connexion active.)
Disconnect:
Arrête la transmission de données et ferme la
connexion au IAQ Probe.
36
90DM4 Instruction and Installation Manual
Honeywell
511403
2/07
Interface utilisateur
Écrans principaux
Section IAQ Sensors
La section sensors (sondes) affiche les informations pour chacune des
sondes du IAQ Probe, telle le type de gaz, l’unité de mesure, le Trig et si
une sonde est en mode d’acquisition.
Event Log Viewer
Cette section, apparaîssant sous la section IAQ Sensors, affiche les
informations du matériel IAQ Probe. Cette information est rafraîchit lors
de chaque nouvelle connection et affiche :
•
•
•
•
•
Version du micrologiciel IAQ Probe
RTD présent ou non
Le temps d’opération de la sonde (nombres d’heures d’utilisation)
et le pourcentage de temps d’opération utilisé.
Nombre de jours jusqu’au prochain étalonnage
Date du dernier étalonnage.
511403
2/07
Manuel d’utilisateur IAQ Probe
Honeywell
37
Interface utilisateur
Écrans principaux
Section Air Quality
La section Air Quality affiche si le IAQ est muni de sondes de
température (et si la température est réglé à degré Farenheit ou dégré
Celcius) et d’humidité.
Cette section contient également l’option Activate ACQ, ce qui démarre
l’acquisition de données (si l’acquisition est active, l’indicateur est vert.
Si l’indicateur est rouge, cliquer pour activer).
Section Memory Content et Clear Memory
Cette section permet de gérer l’utilisation de la mémoire du IAQ Probe.
Total of blocks:
O/W Enable:
Clear Memory:
38
Affiche le nombre de
blocs de mémoire
utilisés.
Enregistre les nouvelles
données et écrase les
anciennes (lorsque
sélectionné).
Efface les informations
de la mémoire du IAQ
Probe, sans télécharger
au sauvegarder.
90DM4 Instruction and Installation Manual
Honeywell
511403
2/07
Interface utilisateur
Écrans principaux
Section IAQ Settings
Cette section permet d’afficher ou de configurer certaines informations
du IAQ Probe.
Continuous reading
Le bouton Continuous
Reading affiche la fenêtre de
lecture continue qui affiche
les valeurs de lectures du
IAQ Probe (selon l’intervalle
d’échantillonnage
configurée).
511403
2/07
Manuel d’utilisateur IAQ Probe
Honeywell
39
Interface utilisateur
Écrans principaux
Calibration Gas Info
Cliquer sur le bouton pour
afficher la fenêtre Calibration
Gas Info. Cette fenêtre affiche:
• Quelles sondes sont
activent dans le IAQ Probe
(indicateur vert indique la
lecture active)
• Le type de gaz d’étalonnage
• La lecture de concentration
de gaz de la sonde.
Set Acq. Time
Cliquer pour afficher la fenêtre
Acquisition Interval Delay.
Cette option permet de
préciser la fréquence
d’enregistrement, soit en
secondes ou en minutes. Le
logiciel acquérira les données
du IAQ Probe aux intervalles
précisées.
40
90DM4 Instruction and Installation Manual
Honeywell
511403
2/07
Interface utilisateur
Écrans principaux
Set Time
La sélection de cette option affiche la fenêtre Internal Clock Settings.
Cette fenêtre permet de corriger l’heure du IAQ Probe, ce qui assure
aucun écart entre l’heure de l’emplacement et du matériel.
Clique Get pour afficher
l’heure du IAQ Probe.
Si l’heure ne correspond pas
à l’heure actuelle de
l’emplacement, utiliser les
flèches pour ajuster l’heure
puis cliquer sur Set pour
effectuer l’ajustement sur le
IAQ Probe.
Une fenêtre de confirmation
ouvre aussitôt.
•
•
•
Cliquer sur « Download then set time » pour enregistrer les
données du IAQ Probe et fixer la nouvelle heure.
Cliquer sur « Set time now » pour fixer la nouvelle heure. Ceci
efface les données du IAQ Probe sans enregistrer.
Cliquer sur « Cancel » pour annuler la demande sans aucun
changement (n’efface pas la mémoire, ne change pas l’heure).
Note: Si « Download » est sélectionné, mais que l’option « Cancel » est
ensuite sélectionnée, l’heure ne sera pas ajustée et la mémoire
sera affacée sans sauvegarde.
511403
2/07
Manuel d’utilisateur IAQ Probe
Honeywell
41
Interface utilisateur
Écrans principaux
Download Memory
Permet d’enregistrer les données du IAQ Probe dans un fichier de
l’ordinateur.
Cliquer sur le bouton « Download Memory » pour afficher la fenêtre
« Save data to... », qui permet d’enregistrer les données de l’unité dans
un fichier journal (le nom du fichier par défaut apparaît ainsi : yyyy-mmdd-hhmm). Pour conserver les valeurs par défaut (recommandé),
cliquer sur « Save » pour enregistrer les données téléchargées.
Section Memory Status
Cette section affiche l’utilisation de mémoire du logiciel (barre verte) et
du IAQ Probe (barre rouge). Ces barres sont une représentation
graphique de la quantité de mémoire utilisée.
42
90DM4 Instruction and Installation Manual
Honeywell
511403
2/07
Interface utilisateur
Écrans principaux
Écran Graph
L’écran Graph, le deuxième onglet, offre un graphique de l’acquisition
ainsi que les outils pour personnaliser l’apparence du graphique.
511403
2/07
Manuel d’utilisateur IAQ Probe
Honeywell
43
Interface utilisateur
Écrans principaux
Outils Graph Controls
Cette section contient plusieur commandes pour personnaliser
l’apparence des informations pour chacune des sondes présentes :
Show/Hide:
Grid:
Auto Range:
Fill Base:
Tag:
Marks:
Colors:
Affiche ou cache les données pour la sonde
Lorsque sélectionné, affiche le quadrillage d’échelle
Ajuste le graphique à la zone de visionnement
Rempli l’espace sous la courbe du zéro
Affiche les annotations (sélectionnées auparavant
dans la barre d’outils)
Identifie chaque point d’acquisition sur le graphique
avec un losenge
Permet de préciser la couleur pour l’affichage
Auto Scale
Ajuste l’échelle de toutes les données dans la zone de
visionnement.
44
90DM4 Instruction and Installation Manual
Honeywell
511403
2/07
Interface utilisateur
Écrans principaux
Select Axis
Ajuste l’échelle des données graphiques dans
la zone de visionnement, selon le nouvel axe.
Section Sample
Cette section est seulement disponible lorsque l’outil pointeur est
sélectionné dans la barre d’outil. Lorsque le pointeur est sur une
section particulière du graphique, cette section affiche les détails de la
sélection. Il est également possible d’utiliser cette section pour préciser
une date et heure précise à afficher.
TWA/STEL mean analysis
Cette section permet d’ajouter au graphique les valeurs de moyennes
TWA et STEL calculé par le IAQ Probe. S’il n’y a pas de données
d’analyse, les champs seront tous désactivés (voir illustration ci-bas)
511403
2/07
Manuel d’utilisateur IAQ Probe
Honeywell
45
Interface utilisateur
Écrans principaux
Barre d’outil graphique
Draw : Crée un graphique depuis un fichier d’acquisition
Agrandir : Agrandi la sélection du graphique
Réduire : Affiche le graphique au complet dans l’espace
Pointeur : Positionne le pointeur sur un point précis
Pan : Déplace les courbes dans le graphique
Déplacer annotation : Permet de déplacer une annotation
Nom : Affiche le nom du gaz assigné à une courbe
Max : Affiche une annotation sur le plus haut point
Min : Affiche une annotation sur le plus bas point
Effacer : Efface le graphique à l’écran
Imprimer : Ouvre la fenêtre d’impression
Quitter le logiciel IAQ Probe
Le bouton Quit de la partie inférieure droite de l’écran
permet de quitter l’application.
Une fenêtre de confirmation apparaît pour confirmer la fermeture de
l’application. Cliquer sur « Yes » pour quitter.
.
46
90DM4 Instruction and Installation Manual
Honeywell
511403
2/07
Comment utiliser le logiciel IAQ Probe
Démarrage
Comment utiliser le logiciel IAQ Probe
Démarrage
Lors du démarrage du logiciel IAQ Probe, la fenêtre Auto Scan Feature
apparaît (superposée) à l’écran principal. Cette fonction balaye pour
trouver un IAQ Probe dans la portée du lecteur.
Si vous annullez cette commande, ou si vous continuez une session
déjà ouverte (téléchargement de données de plusieurs unités), il est
possible de cliquer sur Connect/Refresh pour établir une connexion.
Puisque le logiciel IAQ Probe est conçu pour gérer les données reçues
du IAQ Probe, ses fonctions sont désactivées lorsqu’il n’y a pas de lien
de communication entre logiciel et matériel.
511403
2/07
Manuel d’utilisateur IAQ Probe
Honeywell
47
Comment utiliser le logiciel IAQ Probe
Démarrage
Communication entre le IAQ Probe et le logiciel
•
•
•
Mettre le IAQ Probe sous tension puis attendre la fin de la
séquence d’initialisation (« init » est affiché sur l’écran du IAQ
Probe).
Mettre l’unité devant le lecteur infrarouge (à une distance ne pas
excédant un mètre). Après quelques instants, un icône apparaît
dans la zone de notification (ou un bip est émis du haut parleur
intégré du système) pour confirmer le lien de communication.
Démarrer le logiciel IAQ Probe (Start/Program/BW Technologies/
GasProbe IAQ Soft).
Note: L’ordinateur doit déjà être en fonction. Si le IAQ Probe était
devant le lecteur infrarouge lors du démarrage de l’ordinateur,
ceci peut occasionner des difficultés avec le lien de
communication.
Toutes les fonctions du logiciel IAQ Probe sont activées (« irdA »
apparaît sur l’afficheur du IAQ Probe pour confirmer le lien de
communication.)
Initialisation de l’acquisition
Aussitôt le lien de communication établit, il y a certaines vérifications
nécessaires pour assurer un fichier d’acquisition sans erreurs et
représentatif du but visé des données :
•
•
•
•
•
Assurer que la configuration de la date et heure correspond à celle
de l’emplacement de l’acquisition.
Configurer les intervalles d’acquisition.
Assurer de télécharger et d’enregistrer les données existantes du
IAQ Probe, si nécessaire.
Effacer la mémoire du IAQ Probe pour débuter l’acquisition à zéro.
Activer l’acquisition.
Le IAQ Probe est fonctionnel et configuré pour commencer
l’acquisition.
48
90DM4 Instruction and Installation Manual
Honeywell
511403
2/07
Comment utiliser le logiciel IAQ Probe
Comment utiliser la fenêtre Config
Comment utiliser la fenêtre Config
La fenêtre Config traite principalement la configuration reliée à la
gestion des données reçues du IAQ Probe et pour télécharger les
paramètres au IAQ Probe.
Téléchargement de paramètre au IAQ Probe
Configuration des intervalles d’acquisition
La fenêtre « Acquisition time » permet de configurer l’intervalle
d’acquisition, en secondes ou en minutes. Il est possible de préciser de
1 à 99.
Cliquer sur Set. Une fenêtre de confirmation apparaît.
•
•
•
Cliquer sur Download then set DAQ time pour enregistrer les
données du IAQ Probe et régler l’intervalle d’acquisition.
Cliquer sur Set DAQ time now pour régler l’intervalle d’acquisition
et effacer la mémoire du IAQ Probe sans enregistrer les données.
Cliquer sur Cancel pour quitter cette fonction sans effectuer de
modifications (n’effacera pas la mémoire et ne règlera pas
l’intervalle d’acquisition).
Note: Si vous sélectionnez Download then set DAQ time et cliquez sur
Cancel dans la fenêtre « Save data to... »,l’intervalle d’acquisition
ne sera pas réglée et les données en mémoires seront effacées
sans les enregistrer.
511403
2/07
Manuel d’utilisateur IAQ Probe
Honeywell
49
Comment utiliser le logiciel IAQ Probe
Comment utiliser la fenêtre Config
Téléchargement de données du IAQ Probe
Une fonction importante de la fenêtre Config est l’option Download
Memory qui permet d’enregistrer toutes les données du IAQ Probe
dans un fichier particulier sur un ordinateur.
Enregistrement d’un fichier sur un ordinateur
1. Cliquer sur le bouton Download Memory; la fenêtre « Save data
to... » apparaît.
2. Choisir le répertoire d’enregistrement (si différent du répertoire par
défaut) et le nom du fichier (le nom par défaut est la date et
l’heure)
3. Cliquer sur Save pour enregistrer le fichier. La fenêtre de
téléchargement apparaît et indique le progrès du téléchargement.
Ce fichier peut uniquement être visionner dans le « Acquisition File
Viewer » du logiciel IAQ Probe, ou dans l’écran principal « Graph ».
Puisque les fichiers de journal peuvent uniquement être visionnés dans
le logiciel IAQ Probe, il est nécessaire d’utiliser les fonctions
« Generate Log File » ou « Excel Export Tool » pour pour créer des
fichiers de formats accessibles aux autres.
50
90DM4 Instruction and Installation Manual
Honeywell
511403
2/07
Comment utiliser le logiciel IAQ Probe
Comment utiliser la fenêtre Config
Générer des fichiers journal
La fonction Generate Log File permet de créer un fichier de format
accessible à tous. Ce type de fichier journal (en format de colonne
séparé par des point-virgules) peut être visionné avec de nombreux
logiciels, soit : Microsoft Word, Excel ou Notepad.
•
Cliquer sur Tools puis sélectionner Generate Log File
•
Cliquer sur Source File puis sélectionner le fichier journal à générer
(dans la fenêtre « Generate Log File »).
Cliquer sur Target file puis inscrire le nom de fichier pour le nouveau
fichier journal
Cliquer sur Save pour créer le nom de fichier
Cliquer Export pour générer le fichier journal. Le fichier est
maintenant en format texte (avec des colonnes pour la date, l’heure
de l’acquisition, la valeur de lecture du gaz - une colonne pour
chaque gaz - et les valeurs de lectures de température et
d’humidité.
•
•
•
511403
2/07
Manuel d’utilisateur IAQ Probe
Honeywell
51
Comment utiliser le logiciel IAQ Probe
Comment utiliser la fenêtre Config
Convertir les fichiers journal au format Excel
L’exportation de fichier journal à Excel créé une feuille de calcul Excel.
•
•
•
•
•
52
Cliquer sur Tools puis sélectionner Export to Excel Tool. Ceci
affiche la fenêtre Excel Export Tool
Cliquer sur Source File puis sélectionner le fichier journal à
convertir (depuis la fenêtre « Select File to Export »).
Cliquer sur Target file et inscrire le nom pour le nouveau fichier
Excel
Cliquer sur Save pour créer le fichier
Cliquer Export pour créer le fichier Excel. Le fichier est maitenant
en format Excel avec des colonnes pour la date, les heures
d’acquisition, la valeaur de lecture de gaz (une colonne pour
chaque gaz) et pour les lectures de température et d’humidité..
90DM4 Instruction and Installation Manual
Honeywell
511403
2/07
Comment utiliser le logiciel IAQ Probe
Comment utiliser la fenêtre Config
Visionner les données d’acquisition
Il y a plusieurs façons de visionner les données d’acquisition : avec le
Acquisition File Viewer, avec Excel ou, encore avec Word ou Notepad.
(Puisque les fichiers exportés peuvent être visionner avec des
applications externes, cette section du manuel traite seulement le
Acquisition File Viewer.)
Acquisition File Viewer
511403
2/07
Manuel d’utilisateur IAQ Probe
Honeywell
53
Comment utiliser le logiciel IAQ Probe
Comment utiliser la fenêtre Config
La fenêtre Acquisition file viewer permet de visualiser les données brut
directement dans le logiciel IAQ Probe. Noter qu’il est seulement
possible de visualiser un type de données à la fois.
•
•
•
•
•
Cliquer sur Tools et sélectionner Acquisition File Viewer. La fenêtre
de visionnement apparaît.
Cliquer sur Current loaded file pour sélectionner le fichier
d’acquisition désiré.
Cliquer sur Open File to pour charger les données du fichier
sélectionné.
Cliquer sur Acquisition pour sélectionner les données à afficher
(CO, CO2, Temperature ou Humidity)
Cliquer sur Jump to index pour consulter un numéro d’entrée précis
ou cliquer sur les flèches du champs Browse file pour dérouler dans
la listes de toutes les données.
Fenêtre Continuous Reading
Cette fenêtre permet de visionner les valeurs de lecture
continuellement. Ces données sont rafraîchies à toutes les secondes.
La sélection de l’option Data Logging assure l’enregistrement
simultané des données.
54
90DM4 Instruction and Installation Manual
Honeywell
511403
2/07
Comment utiliser le logiciel IAQ Probe
Comment utiliser la fenêtre Graph
Comment utiliser la fenêtre Graph
La fenêtre Graph offre une représentation graphique des valeurs de
lecture (fichiers journal) du IAQ Probe. Les outils disponibles dans cet
onglet permettent de modifier l’apparence du graphique.
Affichage des graphique
Ouvrir un graphique
D’abord sélectionner un fichier journal à afficher en format graphique :
1. Cliquer pour sélectionner le menu File puis sélectionner Select
Acquisition File
2. Sélectionner le fichier journal désiré puis cliquer sur Load.
3. Cliquer sur le bouton DRAW de la barre d’outils. Le
graphique apparaît dans la fenêtre de visionnement. Il est
maintenant possible de modifier l’apparance du graphique.
Note: Cliquer sur DRAW à n’importe quel moment pour rétablir le
graphique à son apparence originale (apparence par défaut).
Agrandir une section du graphique
L’outil de loupe permet d’agrandir une partie du graphique :
1.
2.
Cliquer sur le bouton loupe
Cliquer sur l’image puis glisser pour sélectionner une
région à agrandir. Relâcher le bouton de la souris et le
graphique s’agrandit à la sélection.
Viisionner un graphique complet
Cliquer sur le bouton « zoom out » pour afficher le
graphique au complet dans la fenêtre de visionnement.
511403
2/07
Manuel d’utilisateur IAQ Probe
Honeywell
55
Comment utiliser le logiciel IAQ Probe
Comment utiliser la fenêtre Graph
Déplacer le curseur dans un graphique
Le bouton curseur permet de déplacer le curseur entre les valeurs de
consignes fixes du graphique. Dans ce mode, le curseur peut
uniquement se déplacer aux intervalles auquelles les valeurs ont été
enregistrées.
1.
2.
Cliquer sur le bouton curseur.
Cliquer le bouton gauche de la souris et maitenir enfoncé
puis glisser le curseur à l’endroit désiré.
Cette option active également la section d’échantillonage qui permet
de sélectionner une date et heure précise à afficher :
56
90DM4 Instruction and Installation Manual
Honeywell
511403
2/07
Comment utiliser le logiciel IAQ Probe
Comment utiliser la fenêtre Graph
Modifier l’apparence d’un graphique
Il existe plusieurs façons d’afficher un graphique, selon les données
nécessaires pour l’analyse. La section de cet onglet sous la fenêtre
d’affichage permet de modifier l’apparence d’un graphique :
Option Expanded Tools
La sélection de l’option « Export Graph Image » depuis le sous menu
Expanded Tools affiche la fenêtre « Export Graph Image to... ». Ceci
permet d’exporter un image du graphique (en format .png).
La sélection de « Indicator Band » affiche un deuxième niveau de sous
menu (type de donnée) permettant de manipuler des données
particulières sur le graphique.
511403
2/07
Manuel d’utilisateur IAQ Probe
Honeywell
57
Comment utiliser le logiciel IAQ Probe
Comment utiliser la fenêtre Graph
Comment utiliser l’outil Indicator Band
Lors de la sélection de type de donnée, deux options supplémentaires
sont affichées: Parameters et Enables (ou Disabled, selon le statut
actuel).
La sélection de Parameters affiche la fenêtre « Indicator Band » pour le
type de donnée, ce qui permet de personnaliser les options d’affichage
suivantes
58
90DM4 Instruction and Installation Manual
Honeywell
511403
2/07
Comment utiliser le logiciel IAQ Probe
Comment utiliser la fenêtre Graph
Options Indicator Band
Enabled:
Actives la bande d’indicateur sur le graphique
Inverted:
Affiche la bande indicatrice à l’inverse (les
spécification de la bande s’appliquent au données
hors de la bande)
Fill Visible:
Affiche la couleur de remplissement pour la bande
Range Area Color:Permet de sélectionner une couleur de remplissage
depuis une fenêtre de sélection.
Dotted:
Ce menu déroulant permet de sélectionner le style
de ligne (ex.: dotted, Dash-dot-dot, dash-dot, etc.)
Line Width:
Permet de préciser la largeur de ligne pour
l’affichage de la plage (ne fonctionne pas avec tout
les styles de lignes)
Line Color:
Permet de sélectionner la couleur de la ligne sepuis
une fenêtre de sélection.
Options Range Area :
L’option Range Area permet de
préciser une date et heure sur
laquelle la bande sera
appliquée (voir image ci-droit).
Il est également possible de
préciser une plage de limite
inférieure et supérieure pour la
bande (les lectures à l’extérieur
des limites précisées seront
plus en évidence).
511403
2/07
Manuel d’utilisateur IAQ Probe
Honeywell
59
Comment utiliser le logiciel IAQ Probe
Comment utiliser la fenêtre Graph
Graph Controls
La section « Graph Controls » permet
de sélectionner les données à afficher.
Les données sont présentées sur une
ligne, avec des colonnes d’options à
sélectionner pour chaque type de
donnée :
•
•
•
•
•
•
•
Show/Hide
Grid
Auto Range
Fill Base
Tag
Marks
Colors
Show/Hide:
Grid:
Auto Range:
Fill base:
Tag:
60
Exclus ou inclus cette données du graphique
Affiche ou cache la grille pour la donnée
Affiche seulement la plage des lectures (plutôt que la
plage complète de 0 - 1000)
Créé une ligne de remplissage entre le zéro du
graphique et la lecture de base actuelle de la donnée
(cette option ne devrait pas être utilisée pour plus
d’une donnée puisqu’il ne sera pas possible de
distinguer les diverses lignes de remplissage).
Permet d’afficher le nom du type de donnée
(type de gaz, température, humidité). Cette
option est utilisée en conjonction avec le
bouton Gas de la barre d’outils;si cette option est
cochée mais le bouton n’est pas activé, aucune
annotation n’est affichée sur le graphique.
90DM4 Instruction and Installation Manual
Honeywell
511403
2/07
Comment utiliser le logiciel IAQ Probe
Comment utiliser la fenêtre Graph
Marks:
Colors:
Affiche les annotations* pour les valeurs de
lecture minimum et maximum. Cette option
est utilisée en conjonction avec les boutons
GAS, MIN et MAX de la barre d’outils; si cette option
est cochée mais le bouton n’est pas activé, aucune
annotation n’est affichée sur le graphique.
Permet de préciser la couleur de la ligne pour cette
donnée (cliquer sur le rectangle de couleur pour
afficher une fenêtre de sélection de couleur).
*Les annotations peuvent être déplacées en sélectionnant le
bouton de la barre d’outils : Cliquer sur le bouton, puis cliquer
sur l’annotation (gas, min ou max) puis glisser l’annotation à
l’endroit désiré.
Il est également possible d’ajuster l’épaisseur des lignes; cliquer sur le
menu Graph,sélectionner Appearance puis Line thickness. Les options
d’épaisseur de lignes sont de 1 (paramètre par défaut) à 5 (plus épais).
Comment utiliser l’option Offset
Cette fonction permet d’ajuster l’échelle du zéro pour la donnée
sélectionnée.
•
•
Sélectionner le type de donnée dans le
menu déroulant
Utiliser les flèches pour augmenter ou
diminuer la valeur du zéro (les lignes dans la
fenêtre de visionnement se déplacent avec
chaque ajustement)
Note: Cliquer sur Reset à n’importe quel moment pour revenir à
l’affichage par défaut.
511403
2/07
Manuel d’utilisateur IAQ Probe
Honeywell
61
Comment utiliser le logiciel IAQ Probe
Comment utiliser la fenêtre Graph
Afficher les données TWA et STEL Data
Cette section est seulement disponible s’il y a des valeurs de lecture
pour soit TWA ou STEL. Les commandes pour TWA et STEL sont
identiques aux commandes de la section « Graph Controls ». Pour
afficher les valeurs dans le graphique, simplement :
•
•
•
62
Cliquer sur Gas Selection,
Sélectionner le gaz désiré, puis
Cliquer sur Analyze
90DM4 Instruction and Installation Manual
Honeywell
511403
2/07
Comment utiliser le logiciel IAQ Probe
Comment utiliser la fenêtre Graph
Afficher et imprimer les statistiques
Le logiciel IAQ Probe Software peut également fournir les données de
détection en format de statistiques. Il est possible d’ajouter des
informations supplémentaires dans l’en-tête de section de la fenêtre
« Statistics » (les valeurs par défaut incluent seulement les heures de
début et de fin d’acquisition).
•
Cliquer sur ADD/EDIT INFO pour ajouter les informations désirées.
511403
2/07
Manuel d’utilisateur IAQ Probe
Honeywell
63
Comment utiliser le logiciel IAQ Probe
Comment utiliser la fenêtre Graph
Édition des informations de la fenêtre Statistics Report
•
•
•
•
64
Inscrire les informations désirées (nom de compagnie, etc.)
Cliquer sur DONE lorsque les modifications sont complétées
Cliquer PRINT pour imprimer une copie des statistiques
Cliquer CLOSE pour quitter la fenêtre des statistiques
90DM4 Instruction and Installation Manual
Honeywell
511403
2/07
Comment utiliser le logiciel IAQ Probe
Comment utiliser la fenêtre Graph
Imprimer un graphique
Le processus pour imprimer un graphique est identique à l’impression
des statistiques. Dans la fenêtre de visionnement du graphique, cliquer
sur l’icône Print. Ceci affiche le graphique en format d’impression, avec
le bouton d’option ADD/EDIT INFO :
•
•
•
•
•
Cliquer soit sur PRINT ou sur ADD/EDIT INFO pour ajouter des
informations supplémentaires
Modifier ou ajouter les informations au besoin.
Cliquer sur DONE pour revenir à l’écran précédent.
Cliquer sur PRINT pour imprimer le graphique affiché à l’écran.
Cliquer sur CLOSE Pour fermer la fenêtre d’impression.
511403
2/07
Manuel d’utilisateur IAQ Probe
Honeywell
65
Comment utiliser le logiciel IAQ Probe
Déconnexion du IAQ Probe
Supprimer un graphique affiché
Cliquer sur le bouton Delete de la barre d’outils. La fenêtre de
visionnement est maintenant remis à blanc.
Déconnexion du IAQ Probe
Avant de déplacer le IAQ Probe hors la portée du lecteur infrarouge, il
est nécessaire de fermer la connexion entre l’appareil et l’ordinateur.
•
Cliquer sur le bouton Disconnect pour terminer la communication.
Note: Si l’appareil est retiré sans le déconnecter, ceci aura un impacte
sur toutes les opérations de l’unité. Attendre 1 ou 2 minutes pour
permettre au IAQ Probe de terminer la session de
communication et revenir à son écran d’affichage principal. Le
logiciel IAQ Probe peut également cesser de fonctionner. Le cas
échéant, il est nécessaire de fermer le logiciel et de redémarrer
avant de continuer.
66
90DM4 Instruction and Installation Manual
Honeywell
511403
2/07
Garantie limitée
Garantie limitée
Garantie limitée
Honeywell Analytics, Inc. garantie à l’Acheteur d’origine et/ou au client
final (« Acheteur ») de produits Vulcain (« Produit ») que si une pièce
quelconque du produit s’avère défectueuse , soit en matériel ou en
main d’oeuvre, dans les douze (12) mois, cette pièce sera réparée ou
remplacer, sans frais, à la discrétion d’Honeywell Analytics si expédié,
port payé, à Honeywell Analytics at 4005 Matte Blvd., Unit G, Brossard,
Quebec, J4Y 2P4, dans l’emballage d’origine ou l’équivalent. Le Produit
sera retourné au client port payé si Honeywell Analytics détermine que
la pièce est défectueuse en raison de défaut matériel ou de main
d’oeuvre. La réparation ou le remplacement d’une telle pièce
défectueuse représente la seule et exclusive responsabilité
d’Honeywell Analytics sous cette garantie limitée.
Politique de Retour
Les frais suivants seront applicables lors de retour de produit pour
crédit :
•
Des frais de retour de 15% seront appliqués lorsque le produit est
retourné dans le 1er mois suivant la date d’expédition
•
Des frais de retour de 30% seront appliqués lorsque le produit est
retourné dans les 3 mois suivant la date d’expédition
Un crédit total (moins les frais de retour) sera uniquement appliqué si le
produit est en parfait état de fonctionnement. Si des réparations sont
nécessaires sur le produit retourné, les frais de cette réparation seront
déduit du crédit.
Auncuns crédits ne seront appliqués pour les retours après les 3 mois
suivant la date d’expédition.
511403
2/07
Manuel d’utilisateur IAQ Probe
Honeywell
67
Garantie limitée
Exclusions
A. Si des capteurs de gaz font partie du Produit, le capteur est
couvert par une garantie limitée de douze (12) mois du fabricant.
B. Si les capteurs de gaz sont couverts par cette garantie limitée,
le capteur sera assujeti à l’inspection par Honeywell Analytics pour
l’exposition prolongée à des concentrations de gaz élevées si
l’Acheteur fait une réclamation sous cette garantie limitée. SI
l’inspection indique que la cause de la défectuosité est l’épuisement du
capteur plutôt qu’un défaut, cette garantie ne s’appliquera pas au
Produit.
C. Cette garantie limitée ne s’applique pas au produits
consommables, tels les piles, ou les articles sujets à l’usure ou au
remplacement régulier, incluant les lampes, les fusibles, les valves, les
aubes, les élements de sonde, les cartouches ou les éléments de
filtres.
Limitation et exclusion de la garantie
Honeywell Analytics n’aura aucun autre responsabilité sous cette
garantie limitée. Toutes responsabilités de garantie d’Honeywell
Analytics sont annulées si le Produit a subi des abus, de la
négligeance, un accident ou si l’Acheteur est en défaut de ses
obligations tels que décrit dans cette garantie ou si le Produit n’a pas
été utilisé selon les instructions ou si le numéro de série du Produit été
enlevé ou modifié.
511403
2/07
Manuel d’utilisateur IAQ Probe
Honeywell
68
Garantie limitée
Dénégation de responsabilité d’autres garanties
La garantie ci-haut est la seule garantie applicable à cet achat. Toutes
autres garanties, soit implicites ou exprès, incluant mais pas limité à,
les garanties tacites de qualité marchande ou de l’aptitude à un emploi
particulier sont dénéguées par le présent document.
Limitation de responsabilité
Il est entendu que la responsabilité d’Honeywell Analytics, soit en
contrat, en délit civil, sous n’importe quelle garantie de responsabilité,
en négligence ou autrement n’excédera pas le prix d’achat payé par
l’Acheteur pour le produit. Honeywell Analytics ne sera pas
responsable, sous aucune circonstance, pour des dommages spéciaux
ou indirectes. Le prix déclaré pour le produit est une considération
limitant la responsabilité d’Honeywell Analytics. Aucune action, en
quelle forme que soit, survenant des transactions sous cette garantie
peuvent être entreprises par l’Acheteur plus d’un an après l’occurence
de la cause de ces actions.
511403
2/07
Manuel d’utilisateur IAQ Probe
Honeywell
69


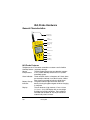
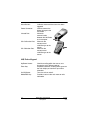
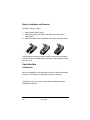
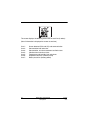
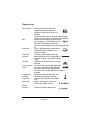
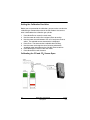
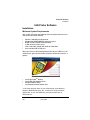
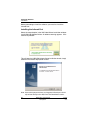
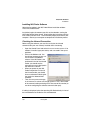
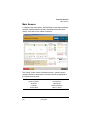
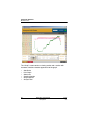
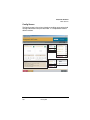
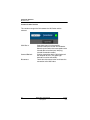
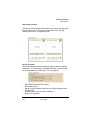
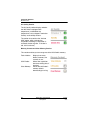
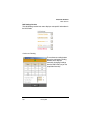
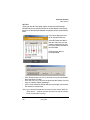
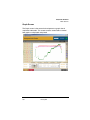
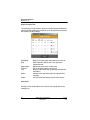
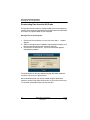
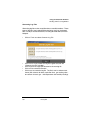

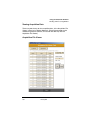
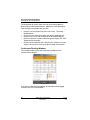
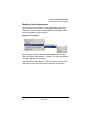
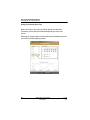
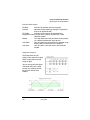
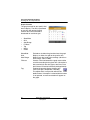
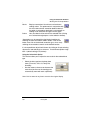
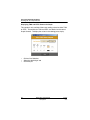
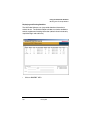
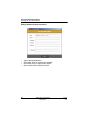
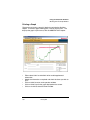


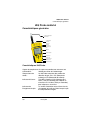
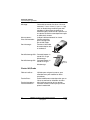
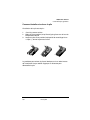
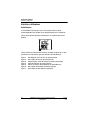
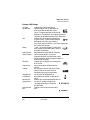
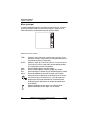
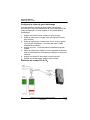
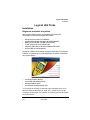
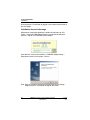
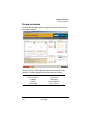
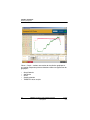
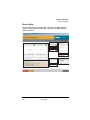
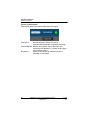
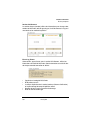
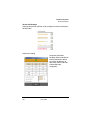
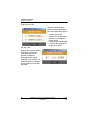
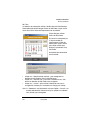
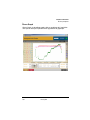
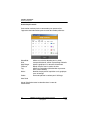
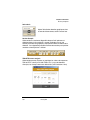
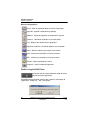
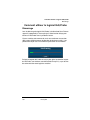
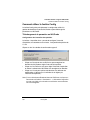
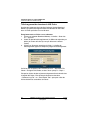
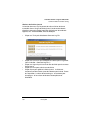
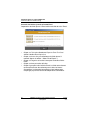
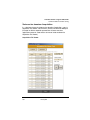
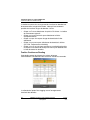
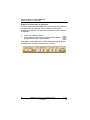
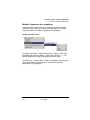
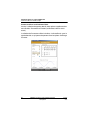
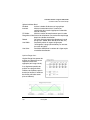
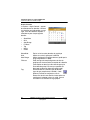
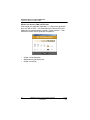
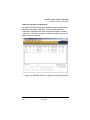
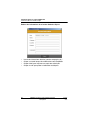
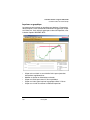


![MSC-Advantage BSC Operating Instructions [FR]](http://vs1.manualzilla.com/store/data/006345908_1-59a52274b0702e7418929ea76f30630b-150x150.png)