1
Pspug.book Page 84 Tuesday, May 16, 2000 1:17 PM
Chapter 2 Simulation examples
Parametric analysis
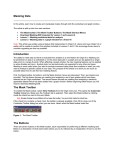
This example shows the effect of varying input resistance
on the bandwidth and gain of the clipper circuit by:
•
Changing the value of R1 to the expression {Rval}.
•
Placing a PARAM part to declare the parameter Rval.
•
Setting up and running a parametric analysis to step
the value of R1 using Rval.
Figure 22 Clipper circuit with global parameter Rval.
This example produces multiple analysis runs, each with
a different value of R1. After the analysis is complete, you
can analyze curve families for the analysis runs using
PSpice A/D.
84
Pspug.book Page 85 Tuesday, May 16, 2000 1:17 PM
Parametric analysis
Setting up and running the parametric analysis
To change the value of R1 to the expression {Rval}
1
In Capture, open CLIPPER.OPJ.
2
Double-click the value (1k) of part R1 to display the
Display Properties dialog box.
3
In the Value text box, replace 1k with {Rval}.
4
Click OK.
PSpice interprets text in curly braces as an
expression that evaluates to a numerical
value. This example uses the simplest form
of an expression—a constant. The value of
R1 will take on the value of the Rval
parameter, whatever it may be.
To add a PARAM part to declare the parameter Rval
1
From Capture’s Place menu, choose Part.
2
In the Part text box, type PARAM (from the PSpice
library SPECIAL.OLB) , then click OK.
3
Place one PARAM part in any open area on the
schematic page.
4
Double-click the PARAM part to display the Parts
spreadsheet, then click New.
5
In the Property Name text box, enter Rval (no curly
braces), then click OK.
Note For more information about using
the Parts spreadsheet, see the Orcad
Capture User’s Guide.
This creates a new property for the PARAM part, as
shown by the new column labeled Rval in the
spreadsheet.
6
Click in the cell below the Rval column and enter 1k
as the initial value of the parametric sweep.
7
While this cell is still selected, click Display.
8
In the Display Format frame, select Name and Value,
then click OK.
9
Click Apply to update all the changes to the PARAM
part.
10 Close the Parts spreadsheet.
11 Select the VP marker and press D to remove the
marker from the schematic page.
This example is only interested in the
magnitude of the response.
12 From the File menu, choose Save to save the design.
85
Pspug.book Page 86 Tuesday, May 16, 2000 1:17 PM
Chapter 2 Simulation examples
To set up and run a parametric analysis to step the value of R1
using Rval
1
From Capture’s PSpice menu, choose
New Simulation Profile.
The New Simulation dialog box appears.
The root schematic listed is the schematic
page associated with the simulation profile
you are creating.
2
In the Name text box, type Parametric.
3
From the Inherit From list, select AC Sweep, then click
Create.
The Simulation Settings dialog box appears.
4
Click the Analysis tab.
5
Under Options, select Parametric Sweep and enter the
settings as shown below.
This profile specifies that the parameter
Rval is to be stepped from 100 to 10k
logarithmically with a resolution of 10
points per decade.
The analysis is run for each value of Rval.
Because the value of R1 is defined as
{Rval}, the analysis is run for each value of
R1 as it logarithmically increases from
100Ω to 10 kΩ in 20 steps, resulting in a
total of 21 runs.
Figure 23 Parametric simulation settings.
86
6
Click OK.
7
From the PSpice menu, choose Run to start the
analysis.
Pspug.book Page 87 Tuesday, May 16, 2000 1:17 PM
Parametric analysis
Analyzing waveform families
Continuing from the example above, there are 21 analysis
runs, each with a different value of R1. After PSpice
completes the simulation, the Available Sections dialog
box appears, listing all 21 runs and the Rval parameter
value for each. You can select one or more runs to display.
To display all 21 traces
1
In the Available Sections dialog box, click OK.
All 21 traces (the entire family of curves) for VDB(Out)
appear in the Probe window as shown in Figure 24.
To select individual runs, click each one
separately.
To see more information about the section
that produced a specific trace, double-click
the corresponding symbol in the legend
below the x-axis.
Figure 24 Small signal response as R1 is varied from 100Ω
to 10 kΩ
2
Click the trace name to select it, then press D to
remove the traces shown.
You can also remove the traces by
removing the VDB marker from your
schematic page in Capture.
87
Pspug.book Page 88 Tuesday, May 16, 2000 1:17 PM
Chapter 2 Simulation examples
To compare the last run to the first run
press I or
You can avoid some of the typing for the
Trace Expression text box by selecting
V(OUT) twice in the trace list and inserting
text where appropriate in the resulting
Trace Expression.
1
From the Trace menu, choose Add Trace to display the
Add Traces dialog box.
2
In the Trace Expression text box, type the following:
Vdb(Out)@1 Vdb(Out)@21
3
Click OK.
Note
4
press I or
The difference in gain is apparent. You can also plot the difference
of the waveforms for runs 21 and 1, then use the search commands
to find certain characteristics of the difference.
Plot the new trace by specifying a waveform
expression:
a
From the Trace menu, choose Add Trace.
b
In the Trace Expression text box, type the
following waveform expression:
Vdb(Out)@1-Vdb(OUT)@21
c
5
The search command tells PSpice to search
for the point on the trace where the x-axis
value is 100.
88
Click OK.
Use the search commands to find the value of the
difference trace at its maximum and at a specific
frequency:
a
From the Trace menu, point to Cursor and choose
Display.
b
Right-click then left-click the trace part (triangle)
for Vdb(Out)@1 - Vdb(Out)@21. Make sure that
you left-click last to make cursor 1 the active
cursor.
c
From the Trace menu, point to Cursor and choose
Max.
d
From the Trace menu, point to Cursor and choose
Search Commands.
e
In the Search Command text box, type the
following:
search forward x value (100)
f
Select 2 as the Cursor to Move option.
Pspug.book Page 89 Tuesday, May 16, 2000 1:17 PM
Parametric analysis
g
Click OK.
Figure 25 shows the Probe window with cursors
placed.
Figure 25 Small signal frequency response at 100 and 10 kΩ
input resistance.
Note that the Y value for cursor 2 in the cursor box is
about 17.87. This indicates that when R1 is set to 10 kΩ,
the small signal attenuation of the circuit at 100Hz is
17.87dB greater than when R1 is 100Ω.
6
From the Trace menu, point to Cursor and choose
Display to turn off the display of the cursors.
7
Delete the trace.
Finding out more about parametric analysis
To find out more about this...
See this...
parametric analysis
Parametric analysis on
page 12-382
using global parameters
Using global parameters and
expressions for values on
page 3-107
89