1
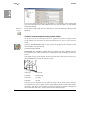
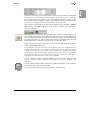
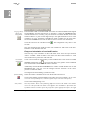
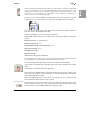
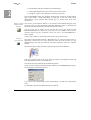
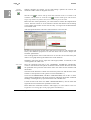
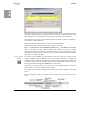
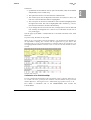
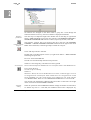
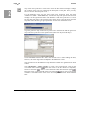
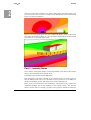
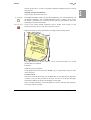
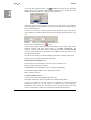
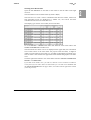
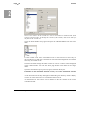
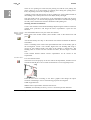
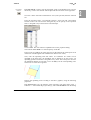
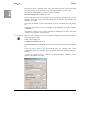
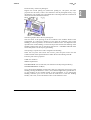
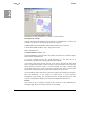
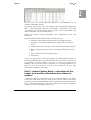
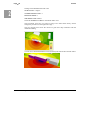
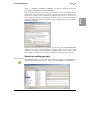
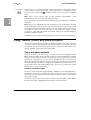
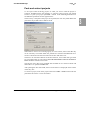
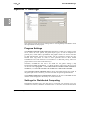
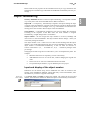
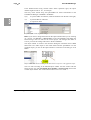
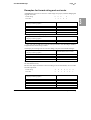
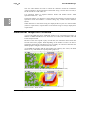
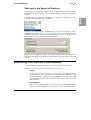
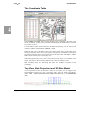
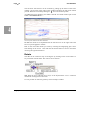
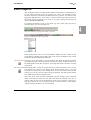
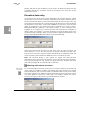
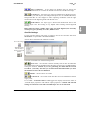
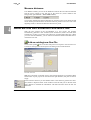
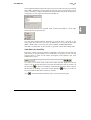
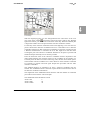
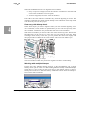
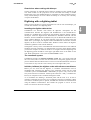
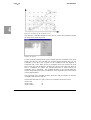
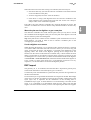
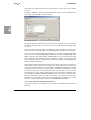
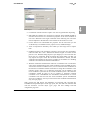
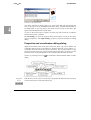
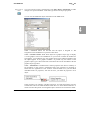
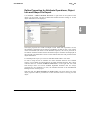
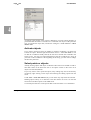
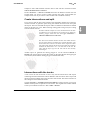
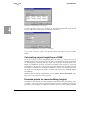
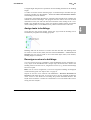
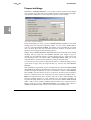
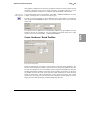
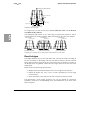
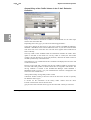
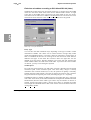
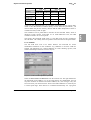
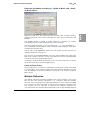
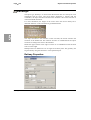
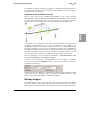
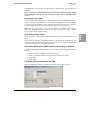
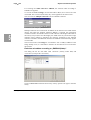
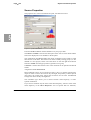
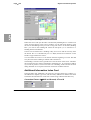
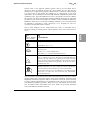
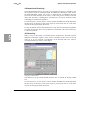
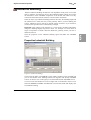
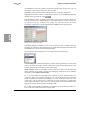
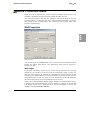
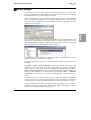
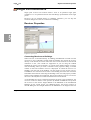
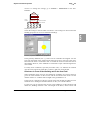
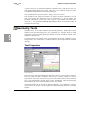
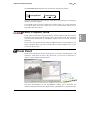
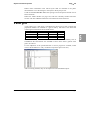
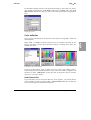
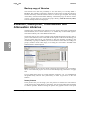
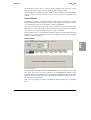
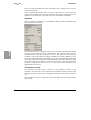
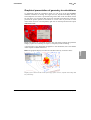
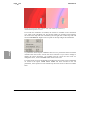
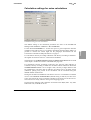
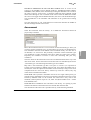
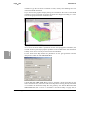
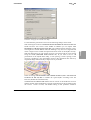
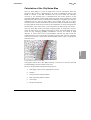
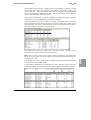
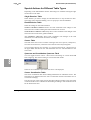
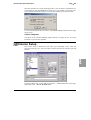
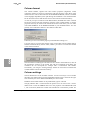
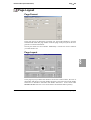
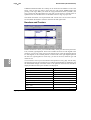
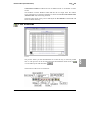
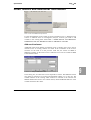
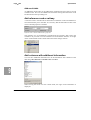
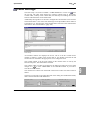
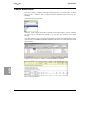
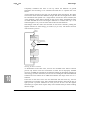
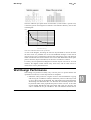
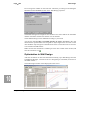
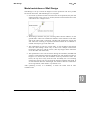
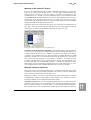
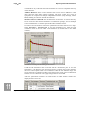
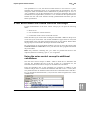
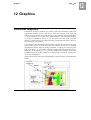
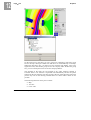
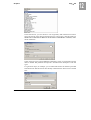
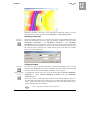
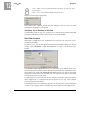
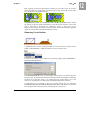
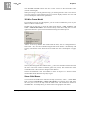
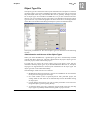
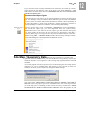
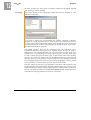
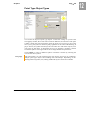
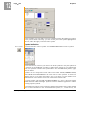
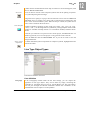
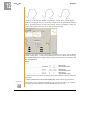
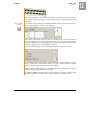
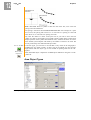
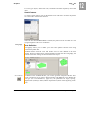
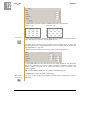
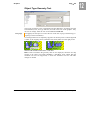
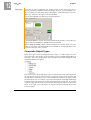
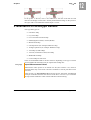
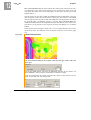
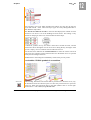
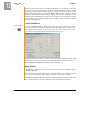
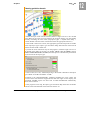
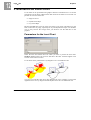
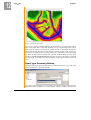
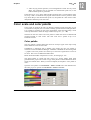
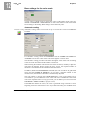
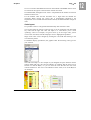
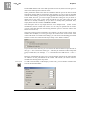
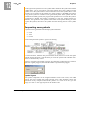
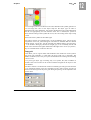
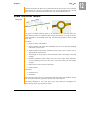
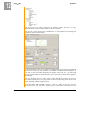
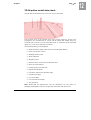
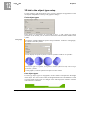
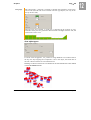
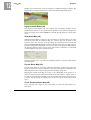
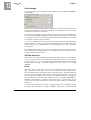
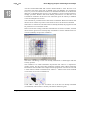
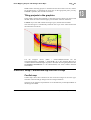
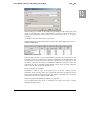
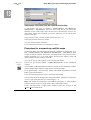
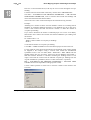
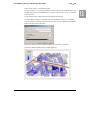
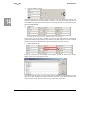
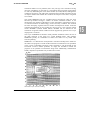
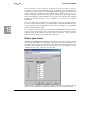
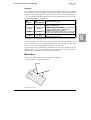
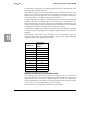
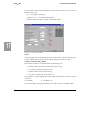
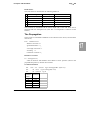
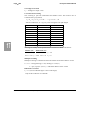
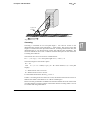
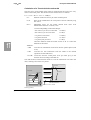
Page • 377
Graphics
Hint: Some printers allow the calibration of colors to the screen; please refer to the
printer handbook.
Color scale
When results are presented with a color scale, the scale is normally generated
automatically from the values found in the map. The colors are taken from the
project-color palette, with the start color defined under PARAMETER -> BASE
SETTINGS used as the beginning of the color sequence.
Section layout
A scale can contain 2 text sizes (title and standard text) which you can customize
under the symbol button SECTION LAYOUT. When entering a title, <return> starts a
new line and <Ctrl + return> starts a new paragraph.
The scale intervals are generated as a table. You can enlarge columns by left
clicking the column header after the cursor is displayed as the splitter cursor. Use
the splitter cursor with the left mouse button pressed to change the column width to
the desired size.
Insert text lines, You can also insert data and text lines in the scale to mark additional intervals and
delete lines, enter include comments in the scale. This could be done to indicate from which level the
data lines
noise limit has been exceeded. Use the symbol ‘delete line’ to delete both text and
data lines.
,
,
When the number of columns in a scale or the width of the scale is increased, use
ADAPT BOX TO CONTENT to resize the box around the scale. With nested elements,
however, this may force you to rearrange some of the elements or to resize the scale
again. If you do not click „adapt,” the box will remain its original size. If the content
is bigger than the box, the remaining part is truncated.
Use ZOOMFAKTOR (Zf) to enlarge the scale for editing.
SoundPLAN Manual
Color scale and color palette
12