1
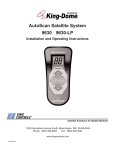
Developer MagicTM: Debugger User’s Guide
Figure 62. Process Meter
The Process Meter contains its own menu bar that contains the Admin,
Charts, Scale, and Help menus. The Admin menu is the same as that
described in Section A.3.1.1, page 217. The Help menu is the same as that
described in Section A.1.10, page 205. The other menus are described in the
following sections.
A.2.4.1 Charts Menu
The Charts menu contains a set of toggles that allow you to choose which
charts are displayed in the Process Meter window. You can display as many
charts simultaneously as you wish. The following choices are available:
• User/Sys Time (the default)
• Major/Minor Faults
• Context Switches
• Bytes Read/Written
• Read/Write Sys Calls
• Other Sys Calls
• Total Sys Calls
• Signals
• Process Size
214
007–2579–005