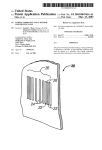
1
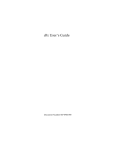
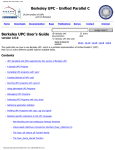
Debugger Reference [A]
Surface rendering
Point rendering
Bar chart rendering
Multiple line rendering
Figure 95. Array Browser Graphic Modes
A.6.1.5 Scale Menu
Note: The Scale tear-off menu is available only if you are have a Silicon
Graphics workstation with Open Inventor installed on it.
If the Scale menu is grayed out when the Array Browser window first
opens, select the Surface option of the Render menu.
The Scale menu provides options for changing the ratio of the z-dimension,
which represents the value of the element. The number on the left represents
the value of the x and y-dimensions (which are always the same as each other).
The number on the right is the z-dimension.
Manipulating the z-dimension affects the ease of spotting differences in values.
If your data is scattered over a narrow range of values, you may wish to
heighten the graph by selecting 10:1 as your scale; this exaggerates the values
in the z-dimension. If your data is in a wide range, selecting 1:2 or 1:10 as
the scale will minimize the differences, flattening the graph.
007–2579–005
265