1
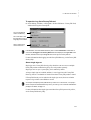
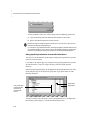
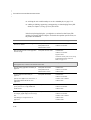
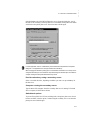
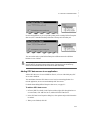
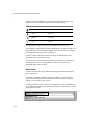
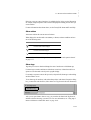
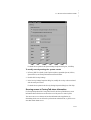
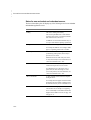
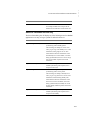
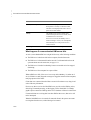
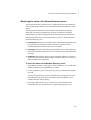
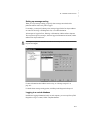
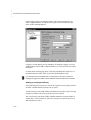
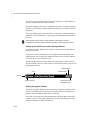
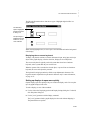
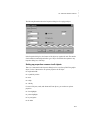
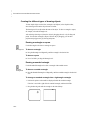
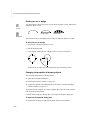
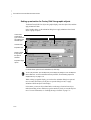
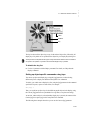
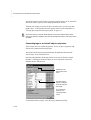
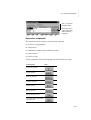
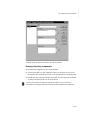
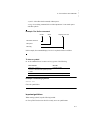
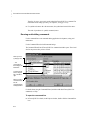
• • • • • 16 • CREATING GRAPHIC OBJECTS Creating gauges Gauge tool In the Gauge Properties dialog box, specify the maximum and minimum values of the gauge, and the tag or expression the gauge is connected to. For details about options in the Properties dialog box, click Help. At run time, the gauge indicates the value of the tag or expression in relation to the gauge’s minimum and maximum values. Creating bar graphs Use the Bar Graph tool to create a graph that represents a numeric value by filling and emptying as the value rises and falls. Bar Graph tool In the Bar Graph Properties dialog box, specify the maximum and minimum values of the bar graph, and the tag or expression the graph is connected to. For details about options in the Properties dialog box, click Help. At run time, the graph shows the value of the tag or expression in relation to the graph’s minimum and maximum values. Creating scales Use the Scale tool to create a scale for a bar graph. Scale tool In the Scale Properties dialog box, specify the appearance of the scale. For details about options in the Properties dialog box, click Help. To place values on the scale as a legend, use text objects. Because the scale doesn’t change at run time, you don’t need to connect it to a tag. Using key objects to simulate keyboard functions In the FactoryTalk View Graphics editor, the term ‘key’ can mean any of the following: Key animation links a graphic object or display to a keyboard key or mouse button, so that an operator can perform an action by pressing the key or mouse button. For more information, see “Associating objects and displays with keys” on page 17-18. The on-screen keyboard lets touch screen users type numbers or text in input objects without the need for a hardware keyboard. To make the on-screen keyboard available at run time, in the Behavior tab of the Display Settings dialog box, select the check box Display on-screen keyboard. For details, see “Setting up the run-time behavior of a graphic display” on page 15-42. 16–29 16 • Placeholder Use the Gauge tool to represent a numeric value using a needle on a dial.