1
Human-centred Pedestrian
Safety Evaluation Program:
User Guide for
Technical Tools
A technical user’s guide for the analytical tools developed
for setting investment priorities in pedestrian safety in the
City of Ottawa.
January 2010
User Guide for Technical Tools
TABLE OF CONTENTS
1
INTRODUCTION ................................................................................................................................. 1
1.1
1.2
1.3
1.4
2
PRIORITIZATION TOOL USER GUIDE ........................................................................................ 5
2.1
2.2
2.3
2.4
2.5
3
BACKGROUND .................................................................................................................................. 1
THE CITY OF OTTAWA CONTEXT...................................................................................................... 1
GOALS AND OBJECTIVES .................................................................................................................. 2
THE PEDESTRIAN SAFETY EVALUATION PROCESS.............................................................................. 2
BACKGROUND .................................................................................................................................. 5
KEY STEPS ........................................................................................................................................ 6
DATA REQUIREMENTS AND INPUT VARIABLES .................................................................................. 7
OUTPUT AND RESULTS ...................................................................................................................... 8
STARTING A NEW YEAR .................................................................................................................. 10
THE COUNTERMEASURE SELECTION TOOL ......................................................................... 11
3.1
3.2
3.3
3.4
INTRODUCTION ............................................................................................................................... 11
KEY STEPS ...................................................................................................................................... 13
DATA REQUIREMENTS AND INPUT VARIABLES ................................................................................ 13
OUTPUT AND RESULTS .................................................................................................................... 17
LIST OF FIGURES
FIGURE 1: PEDESTRIAN SAFETY EVALUATION PROCESS .................................................................................... 4
FIGURE 2: TYPICAL INTERSECTION AND LOCATION FOR CROSSING OF INTEREST .............................................. 8
FIGURE 3: PRIORITIZATION TOOL – SAMPLE INPUT SHEET ................................................................................. 9
FIGURE 4: PRIORITIZATION TOOL – SAMPLE OUTPUT SHEET............................................................................ 10
FIGURE 5: THE COUNTERMEASURE SELECTION PROCESS ................................................................................ 12
FIGURE 6: COUNTERMEASURE SELECTION TOOL - SAMPLE INPUT SHEET ........................................................ 17
FIGURE 7: COUNTERMEASURE SELECTION TOOL – TABULATED RESULTS SUMMARY SHEET ............................ 17
LIST OF TABLES
TABLE 1: PED ISI PRIORITIZATION TOOL INPUT VARIABLE DEFINITIONS ........................................................... 7
TABLE 2: COUNTERMEASURE SELECTION TOOL SITE-SPECIFIC CHARACTERISTIC INPUTS................................ 13
TABLE 3: COUNTERMEASURE SELECTION TOOL SAFETY RISK INPUTS (I.E. PERFORMANCE OBJECTIVES) ......... 14
TABLE 4: CATEGORIZED COUNTERMEASURES CONSIDERED IN TOOL .............................................................. 16
Delphi- MRC
ii
User Guide for Technical Tools
1
INTRODUCTION
1.1 Background
Pedestrians, and other vulnerable road users, represent an important part of the overall
road safety picture. Vulnerable road user1 fatalities in Canada claimed 567 lives in the
year 2000 – a figure that represents almost 20% of all road fatalities in our country. Of
these, 367 involved pedestrians. In addition, over 13,700 people suffered some level of
personal injury.
Almost 70% of the pedestrian fatalities took place in urban areas, and two-thirds were
killed at intersections. Even though crash involvement rates for persons 65 years of age
and over are lower than for most other age groups, seniors are much more vulnerable to
serious injury or death when struck by a motor vehicle than younger pedestrians2. In
Canada, over one-third of all pedestrian fatalities involve a senior citizen. This
constitutes a substantial over-representation of this group.
In its “Pedestrian Crossing Control Manual”, the Transportation Association of Canada
(TAC) states:
Pedestrian crossings present one of the greatest challenges for
the traffic and safety engineering communities. 3
Kenneth Ogden, in his seminal work on road safety engineering, further reinforces this
view:
Pedestrians, bicyclists, and other vulnerable road users require
specific consideration in traffic design and management,
particularly from a road safety viewpoint. 4
1.2 The City of Ottawa Context
The walking mode of travel represents an important component of overall travel demand
in the City of Ottawa. Estimates of walking trip activity prepared for the City as part of
another project indicate that in 2001, pedestrians accounted for over 81 million person
trips in the course of the year, or almost 12% of all travel demand in the City. The vast
majority of these trips took place in the urbanized area of the City, with about 40%
occurring in the peak periods and almost 58% happening in off-peak times.5 This figure
approaches the 15% daily mode share captured by public transit in the City. Given this
1
Vulnerable road users (VRU) include pedestrians, cyclists, and in-line skaters. In addition, within the
pedestrian group, special consideration is usually necessary in dealing with the needs of seniors, persons
with disabilities (including manual and motorized wheelchair users), and children.
2
Zegeer, CV. Seiderman, C. Lagerwey, P. Cynecki, M. Ronkin, M. Schneider, R. “Pedestrian Facilities
Users Guide: Providing Safety and Mobility”. Federal Highway Administration. McLean. VA. 2001.
p.12.
3
Transportation Association of Canada. “Pedestrian Crossing Control Manual”. Ottawa. Canada. 1998.
p. 1.
4
Ogden, KW. “Safer Roads: A Guide to Road Safety Engineering”. Avebury Technical. Aldershot,
England. 1996. p. 365.
5
Projections based on City of Ottawa data and prepared for the 2003 Cost of Travel update project.
Delphi- MRC
1
User Guide for Technical Tools
fact, it is not surprising that community interest in pedestrian safety issues is significant
in the City.
1.3 Goals and Objectives
The overall goal of the work proposed in this document is to help improve the ability of
the City to address pedestrian road safety issues, and in particular, to identify highpriority locations based on readily available, easily collected data and input from
members of the community. The prioritization methodology contained herein helps to
define a process that can be used for programming pedestrian safety investments
explicitly and proactively in a consistent and defensible manner, without necessarily
relying on reactive responses to pedestrian collisions or public complaints. The process
is taken a step further by providing a tool to help city staff identify candidate
countermeasures and obtain guidelines for the application of these countermeasures as
part of a detailed engineering study carried out at locations identified through the
prioritization and public consultation process.
More specifically, the objectives of this project include the need to:
•
Improve the understanding of the relationship of pedestrian needs and safety
issues in the context of signalized and non-signalized intersection operations;
•
Develop an overall approach to programming road safety improvements oriented
specifically to pedestrian needs at signalized and non-signalized intersections,
and providing – as part of its structure – a vehicle for community-based,
proactive input to the identification of intersections requiring detailed study;
•
Help identify candidate countermeasures at intersections slotted for pedestrian
safety improvements based on design and operational characteristics and
provide heuristic guidance on the appropriate application of those
countermeasures.
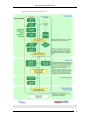
1.4 The pedestrian safety evaluation process
The pedestrian safety evaluation process has been designed as two separate work
streams to be carried out by city staff and community committees, respectively. The
work streams are generally carried out independently and concurrently, with pre-defined
interfaces to maintain communications between the two parties and to ensure the needs
of each are being satisfied.
Responsibilities of city staff include the following:
•
Maintaining and expanding the database of intersections under consideration;
•
Collecting, inputting, and updating the required data for each intersection as
necessary;
•
Programming pedestrian safety improvements based on budget allocations, the
calculated Pedestrian Safety Index from the prioritization tool, collision history,
public input, political pressure, and any other considerations that may be
necessary;
Delphi- MRC
2
User Guide for Technical Tools
•
Identifying candidate countermeasures and conducting detailed engineering
studies for the programmed intersections to determine the most appropriate and
most effective improvements on a site-by-site basis;
•
Design and implement the improvements.
Responsibilities of community committees include the following:
•
Supplement the data collection efforts of the city;
•
Review the list of improvement priorities identified by city staff and provide input
regarding sites that may have been overlooked;
•
With detailed guidance in the form of a prompt list or formal document, conduct a
review of pedestrian and driver needs for the intersections programmed for
improvements within their community in upcoming years;
•
Provide feedback to the city regarding proposed countermeasures and design
improvements.
The complete human-centered pedestrian safety evaluation process is demonstrated
graphically in Figure 1 on the following page.
Delphi- MRC
3
User Guide for Technical Tools
Figure 1: Pedestrian safety evaluation process
Delphi- MRC
4
User Guide for Technical Tools
2
PRIORITIZATION TOOL USER GUIDE
2.1 Background
The City of Ottawa pedestrian safety evaluation process utilizes a prioritization
methodology developed by the U.S. Department of Transportation Federal Highway
Administration (FHWA) that is known as the Pedestrian Intersection Safety Index (Ped
ISI). This methodology calculates a safety index value for each crossing at an
intersection, enabling users to identify intersections and intersection approach legs that
are likely to be a safety concern for pedestrians and should therefore receive priority for
undergoing pedestrian-oriented safety improvements. Using observable characteristics
such as traffic control, land use, speeds, volumes, and cross-section design, the
methodology produces a safety index score with higher scores indicating a greater
priority and need for further investigation.
The tool has been designed to prioritize intersections based on the composite safety
index of the intersection as a whole, however supplemental indices for individual
crossings within each intersection leg provide an indication of how each crossing is
expected to operate from a pedestrian safety perspective. In addition, the capacity to
document a 5-year collision history of both fatal and injury pedestrian collisions at each
intersection was added to the process. While this collision history does not directly
impact the mathematical prioritization process – a process that is based on a regression
analysis of a number of design and operational characteristics of the intersection and
their impact on pedestrian safety performance – it provides users of the tool with a
means to compare the historical pedestrian collision performance of each intersection
with the calculated safety index and adjust priorities to account for extenuating
circumstances not captured by the model, if one feels this is appropriate. Pedestrian
collisions tend to be relatively rare occurrences leading to sporadic data with very small
sample sizes which in turn limits the ability of a practitioner to draw collisions based on
collisions alone, however the incorporation of this additional collision information (if
available) will provide city staff with value-added data with which to make decisions.
The Ped ISI was developed using data from urban and suburban intersections with the
following characteristics:
•
3-leg and 4-leg intersections;
•
Signalized, 4-way stop, and 2-way stop controlled intersections;
•
Traffic volumes ranging from 600 to 50,000 vehicles per day;
•
One-way and two-way roadways;
•
One to four through lanes per approach;
•
Posted speed limits from 15 to 45 mph (24.1 and 72.4 km/h).
The Ped ISI is applied most appropriately at intersections that meet the above criteria.
Safety index values that are produced for intersections with characteristics outside these
ranges should only be used with the understanding that the models were not developed
using intersections of that type.
Delphi- MRC
5
User Guide for Technical Tools
2.2 Key steps
The City of Ottawa Ped ISI prioritization tool is quite straightforward and easy to use.
An input data sheet is provided where the user enters the required data for each
intersection, a series of internal calculations are performed, and an output sheet
summarizes the results and allows the user to sort based on a variety of criteria. One
needs only to determine what intersections will be evaluated in the process, gather
and input the data, review and sort the resulting Ped ISI values, compare Ped ISI
values with collision history (if desired), and set the final priorities for the pedestrian
safety improvement program. More direction on the individual steps is provided below.
Select sites to evaluate – Due to time and resource constraints and the extensive
number of signalized and unsignalized intersections within the jurisdiction of the City
of Ottawa, it is obviously impractical to include all intersections in the Ped ISI
prioritization process. A decision must be made by the City regarding which
intersections to include initially upon launching the program, and what criteria would
be used to expand the inclusion of intersections considered in future years. One
recommendation would be to initially evaluate all intersections that have experienced
fatal or injury pedestrian collisions in the latest 5 years for which data is available.
Community input, public complaints, Council suggestions, and ongoing collision
occurrences could then dictate which intersections are added to the list in subsequent
years of the program.
Gather data – Users of the Ped ISI tool will need to gather data on geometric and
operational characteristics of each intersection and crosswalk. This can be done
either through historical databases, GIS or digital mapping, design drawings, or brief
field visits. A list of specific data requirements is provided in Section 2.3.
Calculate Ped ISI index values – The City of Ottawa Ped ISI tool is spreadsheetbased and the administrator of the tool will ensure that the most up-to-date data
available is entered into the “master” version of the tool for each intersection
(subordinate or “rover” versions of the tool may be made to facilitate data entry for
field crews and must not be confused with the master version). Upon input of the data,
the Ped ISI is automatically calculated for each approach leg of each intersection and
for each intersection as a whole based on the regression model. A safety index value
of 1.0 represents a relatively low-risk intersection and an index value of 6.0 represents
a high-risk intersection.
Prioritize sites – The City of Ottawa Ped ISI prioritization tool allows the user to sort by
Ped ISI values and by a combination of community name and Ped ISI values. Sites
with the highest Ped ISI value generally indicate the highest pedestrian safety risk and
require further investigation. Users are cautioned, however, that a high Ped ISI does
not necessarily indicate a high risk location and a low Ped ISI does not necessarily
indicate a low risk location. No model can account for all factors and interaction of
factors nor the full extent of extenuating circumstances that may exist at particular
intersections and the use of local knowledge, collision history, and engineering
judgement is encouraged to further refine the prioritization process. The City of
Ottawa Ped ISI tool simply provides a way to prioritize locations that may warrant
further investigation.
Delphi- MRC
6
User Guide for Technical Tools
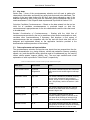
2.3 Data requirements and input variables
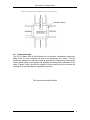
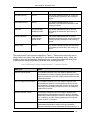
A list of data required for the Ped ISI tool is shown in Table 1 and an illustration of a
typical intersection showing the crossing of interest is shown in Figure 2.
Table 1: Ped ISI prioritization tool input variable definitions
Data Input
Data Format
Notes
Signal controlled
crossing
0 = no
1 = yes
This variable is 1 if movements of vehicles and
pedestrians at the crossing of interest are
controlled by a traffic signal.
Stop-controlled
crossing
0 = no
1 = yes
This variable is 1 if vehicle traffic on the leg with
the crossing of interest must stop for a stop sign.
Number of lanes
1, 2, 3, 4, etc.
This variable is the number of through lanes in
both directions on the street being crossed at
the crossing of interest, not including exclusive
turn lanes. At the stem of 3-leg T-intersections
which has no through lanes in one or both
directions, turning lanes are included.
Speed
85th percentile
operating speed and
posted speed limit
(km/h)
This variable is the 85th percentile operating
speed of vehicles approaching the crossing of
interest. If different operating speeds are
recorded in opposing directions, an average
value should be input for both directions /
crossings of interest. In the absence of
operating speed information, the posted speed
limit or an estimate of the 85th percentile speed
is used.
Traffic Volume
Average daily traffic
volume
This variable is the ADT on the street being
crossed, in both directions of travel. Average 24hour volumes for each turning movement from
City of Ottawa count sheets should be used to
derive an ADT for each approach leg
individually, as ADT can vary substantially
between two opposing intersection legs on the
same street, especially if one is one-way and
the other is two-way.
Land Use
0 = residential area
1 = commercial area
This variable is 1 if the predominant land use of
the surrounding area is commercially developed.
Commercial development is defined as retail
shops, banks, restaurants, gas stations, and
other service oriented businesses that tend to
generate high pedestrian volumes.
Delphi- MRC
7
User Guide for Technical Tools
Figure 2: Typical intersection and location for crossing of interest
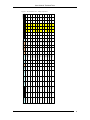
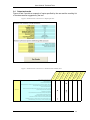
2.4 Output and results
The City of Ottawa Ped ISI prioritization tool will produce a pedestrian intersection
safety index for every crosswalk as well as an intersection as a whole. This will
provide an indication of high-risk crossings and high-risk intersections that warrant
further review based on the design and operational characteristics addressed in the
model. Figures 3 and 4 provide an example of inputs specified by the user and the
resulting list of countermeasures suggested by the tool.
This space intentionally left blank
Delphi- MRC
8
Delphi- MRC
Bridle Path Dr
Prince of Wales Dr
Albiod Rd
Baseline Rd
Bronson Ave
Crestway Dr
Jeanne D'Arc Blvd
Kent St
King Edward Ave
King Edward Ave
Richmond Rd
Richmond Rd
Woodroffe Ave
Gloucester-Southgate
River
Capital
Gloucester-South Nepean
Orleans
Somerset
Rideau-Vanier
Rideau-Vanier
Kitchissippi
Bay
Knoxdale-Merivale
Slack Rd
McEwan Ave
Churchill Ave
Rideau St
Laurier Ave
Albert St
OR 174 EB Ramps
Cresthaven Dr
University Rd
Bank St
Albert St
Street 2
Somerset
Intersection
Street 1
Community
Map Location
ID
X Coord
Y Coord
0
0
1
1
1
1
1
0
0
0
Baseline Rd
Heron Rd
Prince of Wales Dr
Prince of Wales Dr
Bronson Ave
Bronson Ave
University Rd
Sunnyside Ave
Crestway Dr
Crestway Dr
Cresthaven Dr
Cresthaven Dr
Jeanne D'Arc Blvd
Jeanne D'Arc Blvd
OR 174 EB Off-Ramp
OR 174 EB On-Ramp
Kent St
Kent St
Albert St
Albert St
King Edward Ave
King Edward Ave
Laurier Ave
Laurier Ave
King Edward Ave
King Edward Ave
Rideau St
Rideau St
Richmond Rd
Richmond Rd
Churchill Ave
Churchill Ave
Richmond Rd
Richmond Rd
McEwen Ave
Woodroffe Ave
Woodroffe Ave
Slack Rd
N
S
E
Name
Albert St
Albert St
Bank St
Bank St
Albion Rd
Albion Rd
Bridle Path Dr
W
E
N
S
N
S
W
E
W
E
N
S
N
S
W
E
N
S
W
E
N
S
W
E
N
S
W
E
W
E
N
S
W
E
N
Intersection
*Commercial
Control
Area?
Crosswalk
(City Database)
E
W
1
N
S
N
S
0
W
0
0
0
0
0
0
0
0
0
0
0
0
0
0
0
0
0
0
0
0
0
0
0
0
0
0
0
0
0
0
0
0
0
0
0
0
0
0
1
1
1
1
1
1
1
1
1
1
1
1
1
1
1
1
1
1
1
1
1
1
1
1
1
1
1
1
1
1
1
1
1
1
1
1
1
1
4
4
4
6
6
4
4
6
6
2
2
2
2
2
2
4
4
3
1
4
4
3
3
2
2
4
4
4
4
4
4
2
2
2
2
2
2
2
19,870
21,789
7,079
28,599
36,318
22,181
17,288
41,389
38,914
8,246
4,805
6,330
4,139
3,688
2,541
17,636
22,533
11,111
2,102
10,663
10,997
8,328
7,994
11,580
12,317
9,608
7,751
19,537
12,553
13,191
11,195
12,457
10,077
13,298
8,514
14,480
14,052
2,882
ADT (vpd)
6,097
6,360
2,831
3,158
8,962
10,186
5,992
Street Crossed / Intersection Approach
*Signal
# Through
*Stop
Lanes
Controlled? Controlled?
0
1
3
0
1
3
0
1
2
0
1
2
0
1
2
0
1
2
0
1
3
2009
2009
2008
2009
2009
2009
2009
2009
2009
2009
2009
2009
ADT Count
Year
91
91
47
47
56
56
85
85
81
81
60
60
60
60
70
70
70
70
40
40
40
40
60
60
60
60
50
50
50
50
50
50
50
50
50
50
50
50
50
50
50
50
50
50
50
50
80
80
80
Speed (km/h)
85th
Posted
Percentile
Speed
50
50
50
50
68
50
68
50
50
To
To
From
To
From
To
From
To
From
To
From
To
From
To
From
To
From
To
From
To
From
0.00
0.00
0.00
0.00
0.00
0.00
0.00
0.00
0.00
0.00
2.99
3.00
2.79
3.60
3.64
2.65
2.62
3.72
3.70
2.01
1.99
1.84
1.83
1.65
1.64
2.86
2.89
2.49
1.77
2.71
2.71
2.36
2.36
2.04
2.05
2.70
2.69
2.76
2.72
2.72
2.71
2.02
2.00
2.06
2.03
1.82
1.82
1.75
2.92
1.80
2.03
2.73
2.37
2.53
2.50
1.74
2.86
3.13
Pedestrian Safety
Index
5-year Pedestrian Collision History
Collisions / Crossing Intersection
Fatal
Injury
Year
Ped ISI
Ped ISI
2.35
2.35
0.00
2.17
1.99
1.99
1.99
2.00
0.00
2.03
2.11
Period
From
1999
To
2004
From
User Guide for Technical Tools
Figure 3: Prioritization tool – sample input sheet
9
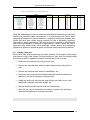
User Guide for Technical Tools
Figure 4: Prioritization tool – sample output sheet
Community
Bay
Capital
Gloucester-South Nepean
Gloucester-Southgate
Kitchissippi
Knoxdale-Merivale
Orleans
Rideau-Vanier
Rideau-Vanier
River
Somerset
Somerset
Intersection
Street 1
Street 2
Richmond Rd
McEwan Ave
Bronson Ave
University Rd
Crestway Dr
Cresthaven Dr
Albiod Rd
Bridle Path Dr
Richmond Rd
Churchill Ave
Woodroffe Ave
Slack Rd
Jeanne D'Arc Blvd
OR 174 EB Ramps
King Edward Ave
Rideau St
King Edward Ave
Laurier Ave
Baseline Rd
Prince of Wales Dr
Kent St
Albert St
Albert St
Bank St
Map Location
ID
X Coord
Y Coord
ADT Count
Year
2009
2009
2009
2009
2008
2009
2009
2009
2009
2009
2009
2009
Collisions / Year
While this methodology provides a consistent and defensible framework for prioritizing
locations for pedestrian safety improvements, it is reiterated that the Ped ISI index
values have limitations as they are based on a regression model that considers only
factors that have been shown through research to have a statistically significant
relationship to safety performance. This index should not constitute an indiscriminate
and concrete prioritization of locations for improvement – rather it should be used in
conjunction with detailed study, local knowledge, collision history, and engineering
judgement to produce a finalized program of prioritized safety improvement locations.
2.5 Starting a new year
At the end of each year the priority list will require updating. The manager of the program
must archive a copy of the “master” file from the previous year. Next, the following steps
will have to be taken to update the “master” file at the start of the new year:
•
Retain all the intersections from the previous year;
•
Remove the sites that were subject to safety improvement in the previous
year;
•
Remove the sites that were subject to rehabilitation, etc.;
•
Review the most recent collision statistics and add sites that experienced
fatalities (if they are not already on the priority list);
•
Update the priority list with new site data such as new traffic counts, lane
configuration changes, new traffic signals, etc.;
•
Execute the priority tool to get an initial list of ranked sites;
•
Meet with the various community committees to discuss the preliminary
ranked list and gather their comments and input.
Delphi- MRC
10
Intersection PSI
1.80
2.86
1.74
2.03
2.03
2.92
2.50
2.73
2.37
3.13
2.53
2.17
User Guide for Technical Tools
3
THE COUNTERMEASURE SELECTION TOOL
3.1 Introduction
Once a practitioner has carried out a detailed engineering study, reviewed information
submitted by the community group (based on the pedestrian and driver needs
assessment), and diagnosed the issues, the countermeasure selection tool can be used
to generate a list of candidate countermeasures. The City of Ottawa countermeasure
selection tool concept is based on the countermeasures and application guidelines
provided in FHWA’s PEDSAFE Pedestrian Safety Guide and Countermeasure Selection
System and other similar resources. PEDSAFE has a strong technical foundation, uses
readily available data as input to the tool, and lends easily to a spreadsheet-based
program. We have enhanced the tool by including additional countermeasures gleaned
from an extensive literature search carried out on behalf of the City of Ottawa. In total,
over 60 pedestrian-oriented safety countermeasures are considered by this tool. The
complete database of countermeasures and their respective categories are shown in
Table 4.
The FHWA’s PEDSAFE considers two types of data inputs upon generating candidate
countermeasures for a given site – crash type groups and performance objectives.
Crash type groups represent the prevalent types of pedestrian-vehicle collisions and are
analogous to vehicle collision configurations. Examples include multiple threat, turning
vehicle, through vehicle, bus-related, etc. Performance objectives relate to diagnosed
problems with design or operational characteristics at the intersection, which are
expected to emerge from a detailed engineering study and through a pedestrian and
vehicle needs assessment. Examples include excessive vehicle speed, poor right-of-way
compliance, poor visibility and sightlines, etc. Due to the sparsity of pedestrian collision
data and the general lack of details regarding events leading up to pedestrian collisions
in collision databases, we have elected to focus on performance objectives in the City of
Ottawa countermeasure selection system. A complete list of the potential performance
objectives are outlined in Table 3.
Within the tool, we have supplemented the performance objective inputs used to help
narrow down the list of appropriate countermeasures from the database of potential
countermeasures with site-specific operational and design characteristic inputs specified
by the user. These site-specific characteristics, which are outlined in detail in Table 2,
help to eliminate countermeasures that are not appropriate given the configuration of the
site. For example, many traffic calming measures may not be appropriate on high speed,
high volume streets; signal-related countermeasures do not apply at unsignalized
intersections, etc. The “performance objective criteria” and the design and operational
“exclusion criteria” are based on a combination of the heuristic guidelines for each
countermeasure in the literature, situations to which particular countermeasures are
generally applied in practice, and expert judgement. Upon discussion with city officials
and throughout ongoing application of the tool, it may be desirable to modify these
criteria in keeping with city policies and best practices.
To use the tool, the practitioner fills in the requisite characteristics about the road,
intersection, and crossing of interest on the input sheet. The user then defines the key
performance objectives or risk factors that exist at the intersection – in other words, the
undesirable design and operational factors that may exist at the site and towards which
countermeasures should be targeted. A single performance objective or multiple
objectives may be selected. The tool is then run and a series of countermeasures are
Delphi- MRC
11
User Guide for Technical Tools
suggested on a results summary sheet. The countermeasures are listed based on
category groupings of countermeasures so that similar countermeasures are reported
together. A separate list of countermeasures is generated for each performance
objective specified. In some cases where multiple performance objectives are specified,
the same countermeasure may appear more than once, suggesting that the
countermeasure may be appropriate for helping to address several different risks
present.
Once again it is stressed that these lists of countermeasures represent those that
appear most appropriate to the site based on the characteristics and performance
objectives specified after being filtered from the full list of pedestrian countermeasures in
the database. Careful consideration of each countermeasure is still necessary to
determine its appropriateness in context with the site and other countermeasures being
considered. Also, the fact that a given countermeasure is not suggested does not
necessarily mean that it can not be applied effectively to the site. In any case,
compatible systems of countermeasures should be developed and implemented
according to the detailed application guidelines that are provided in the documentation
accompanying this tool. The lists of countermeasures provided by this tool are intended
to provide a starting point for this process.
Figure 5: The countermeasure selection process
Delphi- MRC
12
User Guide for Technical Tools
3.2 Key steps
Gather data – Users of the countermeasure selection tool will need to gather site
characteristic information and identify key safety risks that need to be addressed. The
majority of the input data for the tool will likely have been gathered as part of the
detailed engineering study (DES) and the community group’s pedestrian and driver
needs assessment. A list of specific data requirements is provided in Section 5.3.3.
Calculate Candidate Countermeasures – Based on the data entered into the tool an
initial list of candidate countermeasures is produced based on both the
countermeasures’ appropriateness for the site characteristics and the risks that need
to be addressed.
Detailed Consideration of Countermeasures – Starting with the initial lists of
countermeasures provided by the tool, a practitioner gives careful consideration to each,
considers other countermeasures if necessary, and develops a final system of
countermeasures that are compatible with the site and with each other that will be
designed and implemented based on the application heuristics provided in the
documentation and best practices of the industry.
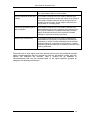
3.3 Data requirements and input variables
The countermeasure selection tool requires user inputs from two perspectives: the sitespecific characteristics (e.g. design features, vehicle and pedestrian volumes, operating
speeds, etc.) and site-specific safety risks that need to be addressed (e.g. the need to
reduce vehicle speeds, improve visibility, etc.). The user input variables and a brief
explanation of each is provided in Tables 2 and 3, respectively.
Table 2: Countermeasure selection tool site-specific characteristic inputs
Data Input
Data Format
Notes
Type of traffic control
Signalized,
Unsignalized
This variable indicates whether the intersection
traffic control is with a traffic signal or with stop
signs.
Pedestrian volume
High, Low
This variable indicates the pedestrian crossing
volume at the intersection and crossing of
interest. A high volume is categorized as more
than 1,200 per day, and low is less than 1,200
per day.
Vehicle volume
High, Low
This variable indicates whether the vehicular
volume on the main street at the crossing of
interest is high or low.
Operating speed
High, Low
This variable indicates whether the 85th
percentile operating speed of vehicles on the
main street at the crossing of interest is high
(70km/h or more) or low (less than 70km/h).
Number of lanes
<4, 4+
This variable indicates whether the number of
through lanes on the main street at the crossing
of interest is less than four, or four or more
Delphi- MRC
13
User Guide for Technical Tools
lanes, considering both directions of travel.
On-street parking
Yes, No
This variable identifies whether or not there is
on-street parking upstream of the crossing of
interest.
Illumination present
Yes, No
This variable identifies whether or not
illumination is provided at the intersection and
crossing of interest.
Land use
Commercial CBD,
Residential, Other
This variable indicates the type of land use
surrounding the intersection and crossing of
interest.
Target population
All pedestrians,
Elderly/children,
Special needs
This variable identifies whether or not any
vulnerable pedestrian groups are expected to be
routinely using the intersection and crossing of
interest.
School area
Yes, No
This variable indicates whether the intersection
and crossing of interest are in the vicinity of a
school.
The second set of user inputs are identified in Table 3. These inputs require the user to
simply select the safety risks identified in the detailed engineering study. While any
number of risks can be specified, identifying the two or three most important safety risks
or performance objectives generally yields the most meaningful results.
Table 3: Countermeasure selection tool safety risk inputs (i.e. performance objectives)
Data Input
Notes
Reduce vehicle speeds
This variable is selected if the user needs to address risks
associated with excessive operating speeds. Examples include
reducing intersection curb radii or traffic calming treatments like
raised intersections.
Improve sightlines and visibility
This variable is selected if the user needs to address risks
associated with limited or blocked sightlines between drivers
and pedestrians. Example treatments include curb extensions,
removing on-street parking and street furniture, and installing
median refuge islands.
Reduce vehicular volume
This variable is selected if the user needs to address risks
associated with inappropriately high traffic volumes. Example
treatments include reducing the number of through travel lanes
(i.e. a road diet), or traffic calming treatments such as speed
humps, chokers, or chicanes.
Reduce pedestrian exposure
This variable is selected if the user needs to address risks
associated with pedestrian exposure at long crosswalks.
Example treatments include signalization enhancements (i.e. a
Delphi- MRC
14
User Guide for Technical Tools
scramble or exclusive pedestrian phase), or a pedestrian refuge
(i.e. channelization island or centre median).
Improve pedestrian access and
mobility
This variable is selected if the user needs to address risks
associated with pedestrian access and mobility in the vicinity of
a crosswalk. Example treatments include enhancements to
crossing signals and signs, proper design of sidewalks and
refuge areas, or a crossing guard.
Vehicle and pedestrian right-ofway compliance
This variable is selected if the user needs to address risks
associated with right-of-way compliance issues where drivers
don’t yield to pedestrians or pedestrians disregard crossing
signals. Example treatments include improved crosswalk
markings or improved enforcement activities.
Reduce high risk behaviour
This variable is selected if the user needs to address risks
associated with unnecessary or inappropriate risk-taking by
pedestrians or drivers. Example treatments include automatic
pedestrian detection (as opposed to push buttons), or adding
pedestrian signals and markings at unmarked crosswalks being
used by pedestrians.
Once both sets of user inputs have been entered into the tool, the pedestrian-oriented
safety countermeasures that are common to both the site-specific criteria and sitespecific risk objectives are returned. Table 4 outlines the full database of
countermeasures that may be returned based on the inputs specified, grouped by
categories for reporting convenience.
Delphi- MRC
15
User Guide for Technical Tools
Table 4: Categorized countermeasures considered in tool
Category
Signals & signs
Pedestrian facility
design
Intersection design
Roadway design
Traffic calming /
speed management
Traffic management
Maintenance /
awareness /
education /
enforcement
Delphi- MRC
1
2
3
4
5
6
7
8
9
10
11
12
13
14
15
16
17
18
19
20
21
22
23
24
25
26
27
28
29
30
31
32
33
34
35
36
37
38
39
40
41
42
43
44
45
46
47
48
49
50
51
52
53
54
55
56
57
58
59
60
61
62
63
Countermeasure
Install a traffic signal at an unsignalized intersection
Install pedestrian signal heads
Install countdown pedestrian signal heads
Increase pedestrian signal symbol size (for crossing distances greater than 30m increase symbol height)
Increase signal phase time (assume a reduced walking speed of 0.9m/s)
Implement a scramble pedestrian phase
Implement an exclusive pedestrian phase (pedestrian "walk" indication with no concurrent vehicle "green" phase)
Implement a leading pedestrian interval (LPI) signal phase
Implement two-stage / partial crossing
Ensure pedestrian push buttons and related signage is located appropriately (if applicable)
Install accessible pedestrian signals (APS) & push buttons
Implement automatic pedestrian detection at signalized crossings
Provide advance left turn phase for vehicles (with "don't walk" indication for pedestrians)
Install supplementary signage (e.g. additional crossing info, watch for pedestrians, look both ways, etc.)
Install supplementary signage at school crossings (e.g. advance warning, flashing beacons)
Install raised pedestrian crosswalk
Install texturized / coloured crosswalk pavement
Install enhanced crosswalk pavement markings (e.g. zebra, ladder, zig zag)
Provide advance yield markings at crosswalks or increase the setback
Add or enhance illumination at crosswalk area
Install curb extensions / bulb outs
Install median refuge island
Prohibit pedestrian crossing (physical barrier)
Ensure pedestrian sidewalk / refuge at ends of crosswalk is adequate
Ensure sidewalk continuity to/from crosswalk location is adequate
Install properly designed mountable curb-cut ramps
Install neighbourhood mini-circle roundabout
Install a raised intersection
Install a modern roundabout at intersection
Provide illumination at intersection
Reduce curb radii at intersection
Install turn lane channelization and refuge ("pork chop") islands
Improve right turn slip lane design
Remove sightline obstructions (e.g. vegetation, utility poles, street furniture)
Remove curb parking adjacent to crosswalk
Relocate transit stop to far-side of intersection
Reduce lane widths
Reduce number of lanes on roadway (e.g. road diets, redistribute right-of-way to suit needs of all road users)
Install bicycle lanes (provides buffer, improves visibility, and may reduce speed due to narrower lanes)
Introduce on-street parking ("side friction" may reduce vehicle speeds)
Address access management concerns at/adjacent to crosswalk
Convert one-way street to two-way flow (may reduce vehicle speeds)
Convert two-way street to one-way flow (simplifies pedestrian workload)
Install speed hump/table on approach to crosswalk
Install chicanes on approach to crosswalk
Install chokers on approach to crosswalk
Install serpentine street on approach to crosswalk
Implement woonerf (street for living)
Install neighbourhood gateway/identity treatment
Implement landscaping/streetscape improvements
Implement special street paving treatments to reduce speed
Install traffic diverters
Prohibit right-turn-on-red
Prohibit vehicle turning movements
Implement a partial street closure at an intersection leg (i.e. make one-way at intersection)
Implement a full closure at an intersection leg (i.e. convert 4-leg intersection to 3-leg, consider pedestrian street)
Install red light cameras
Install speed monitoring feedback signs
Increase enforcement
Implement a crossing guard
Relocate parent pick-up/drop-off areas away from school crosswalks
Maintain crosswalk pavement markings
Sidewalk and crosswalk maintenance
16
User Guide for Technical Tools
3.4 Output and results
Figures 4 and 5 provide an example of inputs specified by the user and the resulting list
of countermeasures suggested by the tool.
Figure 6: Countermeasure selection tool - sample input sheet
Install a traffic signal at an unsignalized intersection
Install pedestrian signal heads
√
Install countdown pedestrian signal heads
pedestrian signal symbol size (for crossing distances greater than 30m increase symbol height from 150mm/6in to 225mm/9in)
Increase signal phase time (assume a reduced walking speed of 0.9m/s)
Implement a scramble pedestrian phase
Implement an exclusive pedestrian phase (pedestrian "walk" indication with no concurrent vehicle "green" phase)
Signals & signs
Implement a leading pedestrian interval (LPI) signal phase
√
√
√
Implement two-stage / partial crossing
Ensure pedestrian push buttons and related signage is located appropriately (if applicable)
Install accessible pedestrian signals (APS) & push buttons
Implement automatic pedestrian detection at signalized crossings
Provide advance left turn phase for vehicles (with "don't walk" indication for pedestrians)
Install supplementary signage (e.g. additional crossing info, watch for pedestrians, look both ways, etc.)
√
Install supplementary signage at school crossings (e.g. advance warning, flashing beacons)
Delphi- MRC
17
iou
r
isk
Be
ha
v
Hi
gh
R
Re
du
ce
&
P
Wa edes
y C tria
om n R
plia igh
nc t-O
e
f-
Ve
hic
le
&
pr
ov
eP
ed
es
t
Mo rian
bil
A
ity cce
ss
Im
e
Pe
de
str
ian
Ex
po
su
re
olu
m
Re
du
ce
Ve
hic
ula
rV
Re
du
ce
tlin
es
a
Im
pr
ov
eS
igh
Re
du
ce
Ve
hic
le
S
pe
ed
s
nd
Vis
ibi
lity
Figure 7: Countermeasure selection tool – tabulated results summary sheet
User Guide for Technical Tools
Managing the electronic files that are produced over the course of a year for each
community will require a strict protocol to prevent the loss of data. The tool is intended to
be executed for each site and there may be more than one version for a given site.
Therefore the file naming convention will be important and we suggest – as a starting
point – that the two street names be included in the file name as well as a community
name/code and year. All of the files should be archived electronically and it is suggested
that hard copies of the input/output sheets for each site also be filed in a common
location.
Delphi- MRC
18


![Umted State Patent [19] [11] 4,142,232](http://vs1.manualzilla.com/store/data/005874596_1-c39d4064b00ab778afe28c128abc9f97-150x150.png)