1
User Manual
Version 7.6
Townsend Analytics, Ltd.
100 South Wacker Drive Suite 2040
Chicago, Illinois 60606-4004 USA
800.827.0141 main office
800.997.9630 tech support
This RealTick User Manual and the software described in it are copyrighted with all rights reserved. Under the copyright laws,
neither the documentation nor the software may be copied, photocopied, reproduced, translated, or reduced to any electronic
medium or machine readable form in whole or in part, without the prior written consent of Townsend Analytics, Ltd. The
information contained in this manual is subject to change without notice. No title or ownership of intellectual property rights in
and to the software and/or documentation or any copy, translation, compilation or other derivative works are transferred to the
end user or any third party hereunder.
The software and documentation are provided “as is” and without any express or implied warranties including, without limitation,
any warranties as to accuracy, functionality, performance, or merchantability. Townsend Analytics makes no representation,
warranty or covenant concerning the accuracy, completeness, sequence, timeliness or availability of the software and/or
documentation or any other information or the likelihood of profitable trading using the software and/or documentation. The user
assumes the entire risk of using the software and/or documentation and accepts full responsibility for any investment decisions or
stock transactions made by the user using the software and/or documentation. Townsend Analytics shall have no liability for any
loss or expense whatsoever relating to the accuracy of the information furnished herein or for the use thereof or for omissions
therein. The user agrees to hold Townsend Analytics harmless from and against any such losses or expenses arising from
provision or use of the software and/or documentation, regardless of cause or form of action, whether in contract, tort, strict
liability, statutory liability or otherwise.
© 2002 Townsend Analytics, Ltd. All rights reserved. RealTick, RealTrade and TA_SRV are registered trademarks and
NewsSrv, TradeSrv, PermSrv, and RealTrade are trademarks of Townsend Analytics, Ltd.
®
®
®
®
®
Microsoft , Windows NT, 95 , 98 , and 2000 names and logos are registered trademarks of the Microsoft Corporation.
All other product names and logos are either trademarks or registered trademarks of their respective owners.
This manual was last revised December 5, 2002.
Page ii
Contents
Contents
ABOUT THIS MANUAL........................................................................................................1
Sections in this Manual........................................................................................1
Conventions in the Manual ..................................................................................2
RECOMMENDED READING ........................................................................................3
GETTING ADDITIONAL HELP FOR REALTICK ............................................................3
Manual.................................................................................................................4
Online Help..........................................................................................................4
Context Sensitive Help .........................................................................................5
Technical Support................................................................................................5
CHAPTER 1: INTRODUCTION ...........................................................................................6
WELCOME TO REALTICK ..........................................................................................6
Who Uses RealTick? ............................................................................................6
How Does RealTick Work?..................................................................................6
What Can I Do With RealTick? ...........................................................................7
PERMISSIONS ..........................................................................................................10
CHAPTER 2: REALTICK INSTALLATION ....................................................................11
SYSTEM REQUIREMENTS ........................................................................................11
Hardware Requirements ....................................................................................11
Internet Requirements........................................................................................12
Screen Display Requirements ............................................................................12
Software .............................................................................................................12
INSTALLATION PROCEDURES ..................................................................................13
Download Installation from RealTick.com .................................................................13
Install RealTick ...........................................................................................................16
Files Installed ....................................................................................................17
CHAPTER 3: GETTING AROUND IN REALTICK ........................................................20
WINDOWS® FEATURES IN REALTICK .....................................................................20
Column Widths ..................................................................................................20
Change the Width of a Column...................................................................................21
Right Mouse Button ...........................................................................................21
Drop-Down Lists ...............................................................................................24
Option Buttons ...................................................................................................24
RealTick Control Menu......................................................................................25
REALTICK MENU BAR ............................................................................................25
REALTICK TOOLBAR ..............................................................................................46
REALTICK STATUS BAR .........................................................................................48
Contents
Page iii
CHAPTER 4: BASIC FEATURES...................................................................................... 50
STARTING REALTICK ............................................................................................. 50
Log On to RealTick ....................................................................................................50
Change Your Password...............................................................................................51
RealTick Pages.................................................................................................. 52
Create a Page ................................................................................................. 53
Open a Page ................................................................................................................53
View Next or Previous Page .......................................................................................54
Save a New Page.........................................................................................................54
Save an Existing Page.................................................................................................54
Drag and Drop a Page .................................................................................................55
Using the Page Manager .................................................................................. 55
Open the Page Manager Dialog Box...........................................................................55
Add a New Page .........................................................................................................56
Rename a Page............................................................................................................56
Delete a Page ..............................................................................................................57
Create a Page Hotkey..................................................................................................58
Moving a Page in the Page Manager Dialog Box .......................................................58
TAL MAIL ............................................................................................................. 59
Open TAL Mail ..........................................................................................................59
Changing Your TAL Mail Password ..........................................................................59
Add a Sound Alert to TAL Mail .................................................................................60
Add a Mail Alert in the Status Bar..............................................................................60
Open E-mail Message .................................................................................................60
Close TAL Mail ..........................................................................................................60
Delete E-mail Message ...............................................................................................60
Print E-Mail Message .................................................................................................61
PRINTING ............................................................................................................... 61
Print the RealTick Page ..............................................................................................61
Print RealTick Windows.............................................................................................61
Print One RealTick Window.......................................................................................62
Print the Windows Desktop ........................................................................................62
Save a RealTick Picture as Graphic File .....................................................................62
Print a Window ...........................................................................................................63
Print All the Windows ................................................................................................63
FAVORITES ............................................................................................................ 63
Using RealTick’s Favorites............................................................................... 64
Open a Favorite...........................................................................................................66
Create a Window Using the Chain Symbol Lists........................................................66
Using Your Own Favorites ............................................................................... 66
Add to Favorites..........................................................................................................67
Change a Favorite .......................................................................................................67
Organize Your Favorites Menu...................................................................................69
Delete a Favorite .........................................................................................................69
CHILD -> POPUP ..................................................................................................... 70
Move a Window Outside of RealTick.........................................................................70
Move a Window Back to RealTick .............................................................................70
LINKING WINDOWS ............................................................................................... 70
Page iv
Contents
Link RealTick Windows .............................................................................................70
SERVERS .................................................................................................................71
Monitoring Servers ............................................................................................71
Change the Server for a RealTick Window.................................................................72
LOAD AND SEARCH FOR SYMBOLS .........................................................................72
Load a Symbol File .....................................................................................................72
Search for Symbols .....................................................................................................73
SYMBOL GUIDE ......................................................................................................74
Search for Symbols .....................................................................................................74
Symbology ..................................................................................................................75
Month Code for Futures ..............................................................................................76
Create a RealTick Window with a Symbol in the Symbol Guide ...............................77
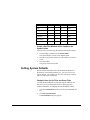
SETTING SYSTEM DEFAULTS ..................................................................................77
Change Colors for Up Ticks and Down Ticks.............................................................77
Set a Startup Page .......................................................................................................78
Set Page Hot Keys.......................................................................................................79
Set the Price Display for RealTick ..............................................................................79
Set Page Defaults ........................................................................................................80
Set General RealTick Options.....................................................................................80
Set Default Servers......................................................................................................80
CHANGING THE DISPLAY OF A WINDOW ................................................................81
Change the Window Color of a Window ....................................................................81
Change the Window Font............................................................................................82
CHAPTER 5: GATHERING MARKET DATA ..................................................................84
TAL ALARMS.........................................................................................................84
Create an Alarm ..........................................................................................................85
Add a Sound Alert to an Alarm...................................................................................88
TAL Alerts..........................................................................................................89
Open TAL Alerts ........................................................................................................89
Create an Alert ............................................................................................................89
Delete an Alert ............................................................................................................92
Turn Off a Beeping Alarm ..........................................................................................92
Drag and drop a symbol from Tal Alerts.....................................................................92
CORPORATE ACTIONS.............................................................................................93
Perform a Corporate Actions Search...........................................................................94
FIXED PAGE NEWS .................................................................................................94
View a Story ...............................................................................................................95
Search for a News Story..............................................................................................95
Copy News Data for Another Application ..................................................................96
Change the View of the Fixed Page News Window....................................................96
FOREX ....................................................................................................................97
Create a Forex Window ..............................................................................................97
Using Currencies ...............................................................................................99
Add a Currency ...........................................................................................................99
Move Around in Forex.......................................................................................99
INDICATIONS ........................................................................................................100
Contents
Page v
Create an Indications Window ..................................................................................100
View Details of a Specific Indication .......................................................................102
Changing the Display of Indications............................................................... 102
Change the Color of Indications ...............................................................................102
Add Columns to the IOI Client Window ..................................................................103
MARKETMAKER .................................................................................................. 104
Create a MarketMaker Window................................................................................104
Set an Alarm for Updates..........................................................................................107
Configuring Quote Sources............................................................................. 107
View Data from a Single Source...............................................................................107
View Data from all Sources ......................................................................................108
View NASDAQ Stock Quotes from all Sources.......................................................108
View NASDAQ Stock Quotes from ECNs only.......................................................109
View NASDAQ Stock Quotes from all Sources except ECNs .................................109
View Data from a Single Exchange ..........................................................................109
View Data from all Exchanges .................................................................................110
Include/Exclude a Market Maker..............................................................................110
Changing the Display of a MarketMaker........................................................ 111
Adding and Removing Panels...................................................................................111
Change the Color for ECNs ......................................................................................112
Add a Price Tier........................................................................................................113
Delete a Price Tier ....................................................................................................113
Change the Color of a Price Tier...............................................................................114
MARKETMINDER ................................................................................................. 114
Create a Standard MarketMinder ..............................................................................115
Create a ChainMinder ...............................................................................................116
Add a Symbol to an Existing MarketMinder ............................................................116
Quickly create a BasketMinder from your Positions.................................................116
Using MarketMinder....................................................................................... 117
Convert Currency......................................................................................................117
Access the Alerts and Alarms ...................................................................................118
Group Symbols .........................................................................................................118
Multiple Selections in a MarketMinder ....................................................................119
Changing the Display of MarketMinder ......................................................... 119
Change the Column Layout ......................................................................................119
Configure Column Layout ........................................................................................120
Save a Column Layout..............................................................................................121
Custom Sort a MarketMinder ...................................................................................121
Additional Settings to Custom Sort your Minder......................................................122
Change the Window Font for MarketMinder............................................................122
Change the Table Display .........................................................................................123
MULTIQUOTE ...................................................................................................... 124
Create a new MultiQuote ..........................................................................................125
Open a MultiQuote Window Layout.........................................................................125
NEWS ................................................................................................................... 126
News Stories.................................................................................................... 126
View News Stories....................................................................................................127
Open a Story .............................................................................................................127
Search for stories about a symbol .............................................................................127
Page vi
Contents
Search by Keyword ...................................................................................................127
Changing the Display of News.........................................................................128
Add columns to the News Window...........................................................................128
Navigate News ..........................................................................................................128
Copying News...........................................................................................................129
Set an Alarm for News .....................................................................................129
Printing News ..................................................................................................129
Print Stories Automatically .......................................................................................129
Configure and Print a Story Group............................................................................129
Configure and Send a Story Group to a File .............................................................131
Add a Story to the Scheduled Print Jobs ...................................................................131
NEWS ALERT ........................................................................................................132
Create a News Alert ..................................................................................................132
Close a News Alert....................................................................................................133
STOCKS ................................................................................................................133
View Stocks ..............................................................................................................134
Change the Tab Font in a Stocks Window ................................................................135
TABLE ..................................................................................................................135
Create a Table ...........................................................................................................135
Add a Symbol ...........................................................................................................137
Change the Type of Table .........................................................................................137
Using Tables ....................................................................................................138
Calculate Volume Weighted Average Price..............................................................138
Transferring Data to other Applications....................................................................139
Changing the Display of Tables.......................................................................140
Change the Display of a Table ..................................................................................140
Change a Column in a Table .....................................................................................141
TICKER .................................................................................................................142
Display a Ticker ........................................................................................................142
Configuring a Quote Source ............................................................................143
View Data from a Specific Exchange .......................................................................143
View Composite Data ...............................................................................................144
View Data from a Specific Market Maker ................................................................144
Remove Data from a Specific Market Maker............................................................145
View a Ticker from a Single Source .........................................................................146
Changing the Display of a Ticker ....................................................................146
Change the Window Color of a Ticker......................................................................146
TIME & SALES ......................................................................................................147
Create a Time and Sales Report ................................................................................148
Configuring Quote Sources .............................................................................150
View Data from Selected Exchanges ........................................................................150
View Composite Exchange Data...............................................................................150
Using Time & Sales .........................................................................................150
Calculate Volume Weighted Average Price..............................................................150
Edit data in a Time & Sales Window ........................................................................151
Copy Time & Sales Data for Another Application ...................................................152
Configuring the Display of Time & Sales ........................................................152
Contents
Page vii
Change the Print Color for Times & Sales................................................................152
Add or Remove Columns..........................................................................................153
TURBOOPTIONS™ ............................................................................................... 153
Create a TurboOptions Window ...............................................................................154
Select an Exchange ...................................................................................................154
Using TurboOptions........................................................................................ 155
Set Interest Rates ......................................................................................................155
Change Calculation Parameters ................................................................................156
Quickly Change the Fixed Volatility Percent............................................................157
Reset Primary Tickers...............................................................................................157
View Details in a TurboOptions Window.................................................................157
Sizing Columns................................................................................................ 157
Change the Width of a Column in TurboOptions .....................................................157
WEB BROWSER .................................................................................................... 158
Open a Web Browser Window .................................................................................158
Navigate in a Web Browser Window........................................................................159
Links to Web Sites ....................................................................................................159
Open a Link ..............................................................................................................159
Zacks Brokerage Research Center ............................................................................160
Earnings Calendar.....................................................................................................161
Industry Search .........................................................................................................161
Earnings Surprises.......................................................................................... 162
Market Guide .................................................................................................. 163
To View Data for a Specific Symbol ........................................................................163
CHAPTER 6: CHARTS & TECHNICAL ANALYSIS ................................................... 164
USING CHARTS .................................................................................................... 164
Create a Chart ...........................................................................................................167
Add a Symbol to an Existing Chart...........................................................................168
Replace a Symbol in a Chart.....................................................................................169
Change the Type of Chart .........................................................................................169
Quickly Change the Chart Interval............................................................................171
Changing the Display of a Chart .................................................................... 171
Change the Display of a Chart ..................................................................................171
Change a Series in a Chart ........................................................................................174
Hide the Chart Title (Legend) ...................................................................................175
Viewing Data in a Chart ................................................................................. 175
Scale a Chart .............................................................................................................175
Options to Scale a Chart ...........................................................................................176
Quick Scale a Chart ..................................................................................................176
Move Around in a Chart ...........................................................................................177
Vertical Zooming a Chart .........................................................................................177
Enlarge a Chart Region .................................................................................. 177
Restore a Chart to Original Size................................................................................177
View the Statistics in a Chart ....................................................................................177
View a Statistic at a Specific Position on a Chart .....................................................178
Using Annotations........................................................................................... 178
Add an Annotation....................................................................................................178
Page viii
Contents
Change an Annotation...............................................................................................179
Delete an Annotation.................................................................................................179
Using Trend Lines............................................................................................180
Draw a Trend Line ....................................................................................................180
Move a Trend Line....................................................................................................181
Move a Group of Trend Lines...................................................................................181
Copy a Trend Line ....................................................................................................181
Resize a Trend Line ..................................................................................................182
Delete a Trend Line...................................................................................................182
Using Pivot Lines.............................................................................................182
Adding Pivot Lines ...................................................................................................183
Spreads ............................................................................................................183
Create a Chart Multiplier...........................................................................................183
TECHNICAL ANALYSIS..........................................................................................183
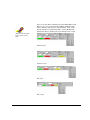
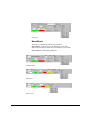
Study Availability Table...................................................................................184
Add a Technical Analysis to a Chart.........................................................................185
Add a Technical Analysis to a Table.........................................................................185
Accessing the Parameters Dialog Box ......................................................................186
Price Studies ....................................................................................................186
Moving Averages (MA) ............................................................................................186
Moving Linear Regression (MLR)............................................................................189
Upper Envelope/ Lower Envelope (UP/DN).............................................................191
Oscillators .......................................................................................................196
Momentum Oscillator (MOM)..................................................................................196
Acceleration (ACC) ..................................................................................................197
Moving Average Oscillator (MAO) ..........................................................................199
Moving Average Momentum (MAM).......................................................................201
Moving Average Convergence Divergence (MACD) ...............................................202
Signal Line (SIG) ......................................................................................................204
MACD Oscillator (CDO).................................................................................205
Rate of Change in Prices (RCP) ................................................................................206
Volatility (VO)..........................................................................................................208
Volatility Ratio (VOR)..............................................................................................209
Commodity Channel Index (CCI) ....................................................................210
Stochastics .......................................................................................................212
K Fast (%K) ..............................................................................................................212
D Fast (%D) ..............................................................................................................213
D Slow (%Ds) ...........................................................................................................215
D Averaged (%Da)....................................................................................................215
Stochastics Parameters ..............................................................................................216
Williams' Percentage Range (%R) ............................................................................216
Relative Strength Index (RSI) ...................................................................................218
Moments...........................................................................................................219
Mean .........................................................................................................................220
Monthly Average (AVG) ..........................................................................................220
Variance (VAR) ........................................................................................................220
Standard Deviation (SD) ...........................................................................................222
Skew (SKW) .............................................................................................................223
Contents
Page ix
Kurtosis (KUR).........................................................................................................225
Volume and Open Interest............................................................................... 226
Tick Count (TCT) .....................................................................................................226
Volume (VOL)..........................................................................................................226
Open Interest (OI) .....................................................................................................227
On Balance Volume (OBV) ......................................................................................227
Price and Volume Studies ............................................................................... 227
Williams' Accumulation Distribution (WAD) ..........................................................228
Arms' Ease of Movement (EMV) .............................................................................229
Money Flow (FLO)...................................................................................................230
Parabolic Price/Time Study ............................................................................ 231
Directional Movement Indicators (PDI, MDI, DX, ADX)............................... 233
CHAPTER 7: PLACING ORDERS .................................................................................. 235
ORDER TYPES ...................................................................................................... 235
Market Order .................................................................................................. 235
Limit Order ..................................................................................................... 235
Stop Market Order .......................................................................................... 236
Stop Limit Order ............................................................................................. 237
Trailing Stop ................................................................................................... 237
PostNoPreference ........................................................................................... 238
Preference ....................................................................................................... 238
Discretionary (Proactive) ............................................................................... 239
Passive Discretionary ..................................................................................... 239
Discretion Limit .............................................................................................. 239
Best Bid or Offer (BBO).................................................................................. 240
Midpoint (MID)............................................................................................... 240
BID.................................................................................................................. 241
Offer ................................................................................................................ 241
TOP................................................................................................................. 242
Short................................................................................................................ 242
Conditional Order........................................................................................... 243
Basket Order ................................................................................................... 243
Reserve Order ................................................................................................. 244
Random Reserve.............................................................................................. 244
Staged Order................................................................................................... 245
Tracking Order ............................................................................................... 245
Cross Order .................................................................................................... 246
Inside Limit ..................................................................................................... 246
Pegging Orders ............................................................................................... 246
VOLUME .............................................................................................................. 248
All or Nothing (AON)...................................................................................... 248
Partial ............................................................................................................. 248
Sweep Reserve................................................................................................. 248
EXPIRATIONS ....................................................................................................... 248
Page x
Contents
Day ..................................................................................................................248
Day +...............................................................................................................249
Good Until Canceled (GTC)............................................................................249
Immediate or Cancel (IOC) .............................................................................249
NOW℠ .............................................................................................................249
Market Order Auction (MOA) .........................................................................250
SUITABILITY .........................................................................................................250
REALTICK WINDOWS WITH ORDER ENTRY ..........................................................251
Order Entry Screen (OES)...............................................................................251
Order Book ......................................................................................................251
MarketMaker ...................................................................................................252
MarketMinder ..................................................................................................253
TurboOptions...................................................................................................254
Stocks ...............................................................................................................254
PLACING ORDERS .................................................................................................254
Buy from the Order Entry Screen in Order Book......................................................254
Sell from the Order Entry Screen in MarketMaker ...................................................256
Place a Deferred Order from the Order Book............................................................257
Place a Conditional Order from MarketMaker..........................................................258
Load a Conditional Order..........................................................................................260
Place a Reserve Order ...............................................................................................261
Place a Track Bid or a Track Offer ...........................................................................262
Place a Cross Order...................................................................................................263
Place a Market or Limit Order Auction Order...........................................................264
Place a Sweep Reserve Order....................................................................................264
Place an Inside Limit Order ......................................................................................265
Place a Passive Discretionary Order..........................................................................265
Select a Discretion Limit Range................................................................................266
Place a Basic Pegging Order .....................................................................................267
Random Reserve Order....................................................................................268
Set the Random Reserve ...........................................................................................268
Place a Random Reserve Order.................................................................................269
BasketMinder...................................................................................................270
Setup the Basket Order Entry Window .....................................................................270
Configure a Standard BasketMinder Order ...............................................................271
Advanced Nasdaq Configuration ..............................................................................272
Advanced Listed Configuration ................................................................................273
Customize Order Parameters.....................................................................................274
Basket Quantity/Execution........................................................................................274
Limit Market Exposure .............................................................................................275
USING ACCOUNTS ................................................................................................276
Show Account Balance .............................................................................................276
Trade with Another Account.....................................................................................276
CANCELING ORDERS ............................................................................................277
Quick Double-Click Cancel ......................................................................................277
Cancel Using Cancel Now!!......................................................................................278
Contents
Page xi
Cancel Using Cancel Order.......................................................................................278
Confirm All Trades ...................................................................................................279
SETTING ORDER ENTRY DEFAULTS FOR QUICK TRADING ................................... 280
Set General Order Entry Defaults .............................................................................280
Change the Spin Button Defaults..............................................................................282
Set Keypad to Configure the Volume .......................................................................283
Set Reserve Order Defaults.......................................................................................283
Set an Alarm for an Order Event...............................................................................284
Set Warnings to Display after a Specific Action.......................................................285
Setting Button Colors................................................................................................286
Setting Order Status Colors.......................................................................................287
SETTING ORDER ALERTS ..................................................................................... 288
Add a Sound Alert to a Conditional Order................................................................288
Set a Price Warning ..................................................................................................288
CREATING HOT KEYS .......................................................................................... 289
Create a Buy Hot Key ...............................................................................................289
Create a Sell Hot Key ...............................................................................................291
Create a Bid Hot Key ................................................................................................292
Create an Offer Hot Key ...........................................................................................293
Create a Cancel Orders (Symbol) Hot Key ...............................................................294
Create a Close Position (Symbol) Hot Key...............................................................294
Create a Cancel Orders (Account) Hot Key..............................................................295
Create a Close Position (Account) Hot Key..............................................................296
Interact with Order View ..........................................................................................297
Create an Actionless Hot Key ...................................................................................298
Create a Change Order Action Hot Key....................................................................299
Create a “Bump” Hot Key ........................................................................................299
Clone a Hot Key .......................................................................................................300
Edit a Hot Key ..........................................................................................................300
Delete a Hot Key.......................................................................................................301
Create the Hot Key Action Bar .................................................................................301
CHAPTER 8: TRACKING POSITIONS AND ACCOUNT BALANCES .................... 304
POSITIONMINDER............................................................................................. 304
Create a PositionMinder ...........................................................................................305
Select an Account .....................................................................................................305
Change the Column Layout ......................................................................................306
ORDERMINDER .................................................................................................... 307
Create an OrderMinder .............................................................................................307
Multiple Selections in an OrderMinder.....................................................................308
View the Order Transaction Summary......................................................................308
Link a MarketMinder to an OrderMinder .................................................................310
TICKETMINDER ................................................................................................... 310
Display Ticketed Orders ...........................................................................................310
MULTIQUOTE................................................................................................... 311
Configure the MultiQuote Window to View Your Positions ....................................312
Configure the MultiQuote Window to View Your Account Balance........................312
Select an Account .....................................................................................................312
Page xii
Contents
ORDER BOOK .......................................................................................................313
View Your Account Balance.....................................................................................313
CHAPTER 9: USING ADVANCED FEATURES ............................................................315
COMMIT CHANGES ...............................................................................................315
Edit & Save Data in a Chart ......................................................................................315
Edit & Save Data in a Table......................................................................................316
SCRIPTS ................................................................................................................316
Designing.........................................................................................................316
Design a Script ..........................................................................................................316
Executing .........................................................................................................318
CHAPTER 10: TROUBLESHOOTING............................................................................319
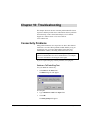
CONNECTIVITY PROBLEMS ...................................................................................319
Perform a TalTrade Ping Test ...................................................................................319
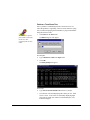
Perform an Internet Connectivity Test ......................................................................320
Perform a TraceRoute Test .......................................................................................321
DATA OUTAGES AND DATA INTEGRITY ................................................................322
CHAPTER 11: REALTICK ADD-ONS ............................................................................323
HOTTREND™........................................................................................................323
Display Hottrend .......................................................................................................323
Access Hottrend through the MarketMinder Favorite...............................................323
Link Hottrend RealTime Radar to another RealTick Window ..................................325
Display a Symbol in the Linked Window .................................................................325
Drag and drop a symbol from the Hottrend Favorite.................................................325
View the Day Summary ............................................................................................325
HOTTREND SMART ALERTS ..................................................................................326
Access Hottrend Smart Alerts ...................................................................................326
Setup an Alert............................................................................................................326
OZ SCANNER ........................................................................................................326
Usual Suspects Scan ........................................................................................326
Knock Down Scan............................................................................................326
Power Trader Scan ..........................................................................................327
New Kid on the Block Scan..............................................................................327
Gapper Scan ....................................................................................................327
Bottom Fisher Scan..........................................................................................327
Sky Scraper Screen ..........................................................................................327
10 ½ Weeks Scan .............................................................................................327
9 ½ Weeks Scan ...............................................................................................327
Access an Oz Scanner ...............................................................................................328
MARKETGAUGE ...................................................................................................329
Access MarketGauge ................................................................................................329
BARRA RISK FACTOR ...........................................................................................330
Access Barra Risk Factor ..........................................................................................330
Display Barra Risk Factors for a Stock .....................................................................330
Contents
Page xiii
GLOSSARY......................................................................................................................... 311
Absolute .......................................................................................................... 311
Ask................................................................................................................... 311
All or None (AON) .......................................................................................... 311
Annotation....................................................................................................... 311
Arms’ Ease of Movement ................................................................................ 311
Basket Order ................................................................................................... 311
Best Bid or Offer (BBO).................................................................................. 311
Bid................................................................................................................... 311
Bollinger Bands .............................................................................................. 312
Broker/Dealer ................................................................................................. 312
Buy .................................................................................................................. 312
Call.................................................................................................................. 312
Cancel Order .................................................................................................. 312
Candlestick Charts.......................................................................................... 312
Commodity ...................................................................................................... 312
Conditional Order........................................................................................... 312
Currency ......................................................................................................... 313
Daily................................................................................................................ 313
D Averaged ..................................................................................................... 313
D Fast ............................................................................................................. 313
D Slow............................................................................................................. 313
Day.................................................................................................................. 313
Day + .............................................................................................................. 313
Deferred Order ............................................................................................... 313
Delta................................................................................................................ 313
Depth of Market .............................................................................................. 314
Differential...................................................................................................... 314
Discretionary Order........................................................................................ 314
Discretionary Price......................................................................................... 314
Dividend.......................................................................................................... 314
DOW ............................................................................................................... 314
Downtick ......................................................................................................... 314
ECN................................................................................................................. 315
Exchange......................................................................................................... 315
Expiration ....................................................................................................... 315
Futures ............................................................................................................ 315
Good Til Cancel.............................................................................................. 315
Grid Lines ....................................................................................................... 315
Interest Rate .................................................................................................... 315
Intraday........................................................................................................... 315
Investment ....................................................................................................... 315
Initial Public Offering..................................................................................... 316
Immediate or Cancel (IOC) ............................................................................ 316
Page xiv
Contents
K Fast ..............................................................................................................316
Kurtosis............................................................................................................316
LAN..................................................................................................................316
Level II.............................................................................................................316
Limit Order ......................................................................................................316
Limit Price .......................................................................................................316
Listed ...............................................................................................................316
MACD Oscillator.............................................................................................316
Market..............................................................................................................317
Market Maker ..................................................................................................317
Market Order ...................................................................................................317
Mean ................................................................................................................317
MID..................................................................................................................317
Moments...........................................................................................................317
Monthly............................................................................................................317
Monthly Average..............................................................................................317
Momentum Oscillator ......................................................................................317
Moving Average...............................................................................................318
Moving Average Convergence Diversion ........................................................318
Moving Average Oscillator..............................................................................318
Moving Linear Regression...............................................................................318
NASDAQ..........................................................................................................318
New York Stock Exchange ...............................................................................318
NOW ................................................................................................................318
Offer.................................................................................................................318
On Balance Volume .........................................................................................318
Online Trading.................................................................................................319
Open Interest ...................................................................................................319
Option ..............................................................................................................319
Order ...............................................................................................................319
Oscillators .......................................................................................................319
Parabolic Price/Time.......................................................................................319
Partial..............................................................................................................319
Percent Offset ..................................................................................................319
Position............................................................................................................320
Post No Preference ..........................................................................................320
Preference........................................................................................................320
Price ................................................................................................................320
Put....................................................................................................................320
Quote ...............................................................................................................320
Rate of Change in Prices .................................................................................320
Ratio ................................................................................................................320
Real Time.........................................................................................................321
Relative Strength Index....................................................................................321
Contents
Page xv
Reserve Order ................................................................................................. 321
Route ............................................................................................................... 321
Scaling ............................................................................................................ 321
Security ........................................................................................................... 321
Sell .................................................................................................................. 321
Server .............................................................................................................. 321
Short................................................................................................................ 322
Signal Line ...................................................................................................... 322
Skew ................................................................................................................ 322
Staged Order................................................................................................... 322
Standard Deviation ......................................................................................... 322
Stochastic ........................................................................................................ 322
Stock................................................................................................................ 322
Stop and Reverse............................................................................................. 323
Stop Limit Order ............................................................................................. 323
Stop Market Order .......................................................................................... 323
Stop Price........................................................................................................ 323
Strike Price...................................................................................................... 323
Symbol............................................................................................................. 323
Target.............................................................................................................. 323
TA_SRV........................................................................................................... 324
Ticker .............................................................................................................. 324
Tick Count....................................................................................................... 324
Tier.................................................................................................................. 324
TOP................................................................................................................. 324
Trade............................................................................................................... 324
Trading Session............................................................................................... 324
Trailing Stop ................................................................................................... 324
Trend Lines ..................................................................................................... 324
Uptick.............................................................................................................. 325
Variance.......................................................................................................... 325
Volatility.......................................................................................................... 325
Volatility Ratio ................................................................................................ 325
Volume ............................................................................................................ 325
Weekly ............................................................................................................. 325
Williams’ Accumulation Distribution.............................................................. 325
Williams Percentage Range ............................................................................ 325
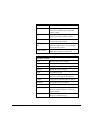
CONTENTS...........................................................................................................................III
INDEX.................................................................................................................................... 18
Page xvi
Contents
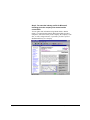
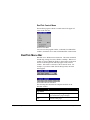
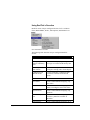
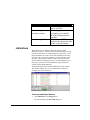
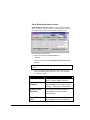
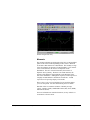
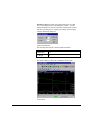
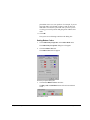
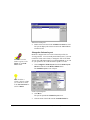
About This Manual
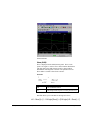
This manual is intended to help you learn the features in
RealTick® version 7.6.
It describes in detail the functionality of RealTick, including order
types and technical analysis. It provides you with the decision
support you need to trade effectively.
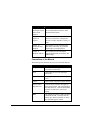
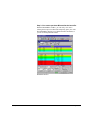
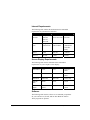
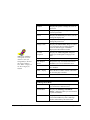
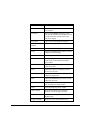
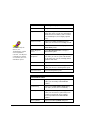
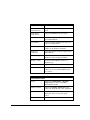
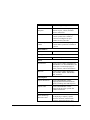
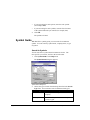
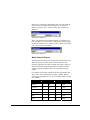
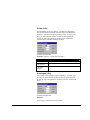
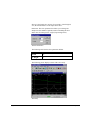
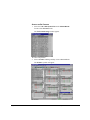
Sections in this Manual
Chapter
About This Manual
Description
Chapter 1:
Introduction
This chapter provides a brief description
of RealTick, its users, its capabilities,
and permissions.
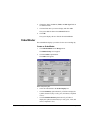
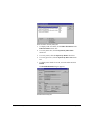
Chapter 2:
Installing
RealTick
This chapter provides installation
procedures and describes the contents of
the Townsend Analytics, Ltd. (TAL)
directory.
Chapter 3: Getting
Around in
RealTick
This chapter describes the RealTick
menu bar, toolbar, and status bar.
Chapter 4: Using
Basic RealTick
Features
This chapter describes basic features in
RealTick, including how to log on,
change passwords, TAL Mail, print data,
load symbols, and set defaults.
Chapter 5:
Gathering Market
Data
This chapter describes why and how to
use certain RealTick features to monitor
the market.
Chapter 6:
Charts &
Technical
Analysis
This chapter provides a special emphasis
on Charts, including Technical Analysis.
Chapter 7: Placing
Orders
This chapter describes order types, and
why and how to use certain RealTick
features to sell and purchase stock.
Page 1
Chapter
Description
Chapter 8:
Tracking Positions
and Account
Balances
This chapter describes why and how to
use certain RealTick features to track
positions and accounts.
Chapter 9: Using
Advanced
Features
This chapter describes advanced
activities, such as how to design and
execute a script to automate a variety of
tasks.
Chapter 10:
Troubleshooting
RealTick
This chapter provides troubleshooting
procedures concerning any problems
connecting to or using RealTick.
Chapter 11:
RealTick Add-ons
This chapter provides information
concerning Hottrend, OZ Scanner, and
MarketGauge.
Conventions in the Manual
The following table describes the text styles used in this manual.
Convention
Page 2
Description
1. Type the . . .
Numbered text are steps you must follow
to perform a certain task.
Click
Click means to press your left mouse
button once.
Double-click
Quickly press your left mouse button
twice.
Choose
Click an item with your left mouse button.
Choose from a
drop-down list
Click the arrow located to the right of a
drop-down list field. The system displays
the drop-down list. Click the information
from the list and release your mouse
button.
Bold
The manual lists buttons, fields, and menu
commands in bold. You must click the
button, type data into the field, or choose
the menu that appears in bold.
About This Manual
Convention
Italics
Description
The manual occasionally lists data you
must type in italics.
This manual is intended to instruct users in how to use RealTick
and its features. It is not intended to teach users how to trade. Any
references to particular stock symbols or corporations appear by
way of example only and do not represent an endorsement of
Townsend Analytics.
Recommended Reading
There are numerous books and web sites available to teach you
about the stock market and how to trade. The following table lists
reference material you may want to review.
Name of Reference
Author
Rules of the Trade
David Nassar
The Neatest Little Guide to Stock
Market Investing
Jason Kelly
How To Take Money from Wall
Street – Learn to Profit in Bull
and Bear Markets
Tony Oz
Electronic Day Trader:
Successful Strategies for OnLine Trading
Marc Freidfertig
The Four Biggest Mistakes In
Option Trading
Jay Kaeppel
Getting Started In Futures
Todd Lofton
Getting Started In Stocks
Alvin D. Hall
www.investorwords.com
WebFinance, Inc
Getting Additional Help for RealTick
You can get additional help for RealTick through the online help
files, through the www.realtick.com web site, and by calling the
Townsend Analytics, Ltd. technical support team.
About This Manual
Page 3
Manual
The rtuserman.pdf file is located on the RealTick web site at
www.realtick.com. You can print additional copies of this manual
or quickly review a section of the manual. You must have Adobe
Acrobat Reader to view the document.
RealTick Manual
With the rtuserman.pdf file, you can use the bookmarks on the left
side of the window to quickly access a section in the manual.
Click the bookmark of the section you want to access, and the
section appears on the right side of the window. See the online
help for Adobe Acrobat Reader for more information.
Online Help
The fastest way to get assistance while using RealTick is to look in
the online help. With the RealTick online help, all the information
you need is available right on your window. Simply click Help
Topics from the Help menu to access the online help.
Page 4
About This Manual
RealTick Online Help
Context Sensitive Help
RealTick 7.6 includes Context Sensitive Help. Click a Help button
on any dialog box in RealTick and a help screen will appear
explaining each attribute of the dialog box. Also included in the
Help screens are links to further information relative to the dialog
box.
Technical Support
You can either contact the vendor that you purchased RealTick
from, or contact the Townsend Analytics, Ltd. Technical Support
team through the RealTick web site, www.realtick.com. From the
web site, you can e-mail the technical support team, or you can call
Townsend Analytics, Ltd. Technical Support at 1-800-997-9630.
About This Manual
Page 5
Chapter 1: Introduction
Welcome to RealTick
Welcome to RealTick – the industry standard in online trading
from Townsend Analytics, Ltd.
RealTick integrates real-time quote displays, technical analysis,
and direct access trading, merging information and utility to give
you infinite trading insight. Therefore, you can take fast action on
market opportunities – as they happen.
Who Uses RealTick?
RealTick is a robust application meeting the needs of many
different types of traders all over the world, including Individual
Traders, Broker/Dealers, and Institutional customers. With the
flexibility of RealTick, for example, an Institution can notify
another Institution of a large order they’re considering placing, a
Broker/Dealer can keep track of a customer’s account, and an
Individual trader can trade with RealTick through his/her
Broker/Dealer.
How Does RealTick Work?
RealTick is a highly configurable tool that requires access to
servers, data, and features. These are assigned to you by your
administrator.
When you launch RealTick, you are presented with a login dialog
box where you enter your user name, domain, and password. The
system then notifies RealTick who you are and what servers, data,
and features of RealTick you are authorized to use.
Your RealTick may connect to quote servers for quotes and charts,
news servers for news, and trade servers for placing orders and
receiving execution reports. RealTick communicates with each of
these servers in real-time to give you the most accurate and up-todate information available.
Page 6
Chapter 1: Introduction
What Can I Do With RealTick?
With RealTick, you can monitor the market, place orders, and
research companies. If you own stock, you can use RealTick to
manage your intraday portfolio. For example, let’s pretend you’re
interested in purchasing Microsoft®.
Step 1: You want to know how Microsoft stock has
reacted in the market for the last 5 years.
You can view the history of Microsoft’s prices with a chart. By
creating a Monthly chart for the last 5 years, you can view the
information at a glance.
Chart Window
Chapter 1: Introduction
Page 7
Step 2: You want the industry profile for Microsoft,
including when the company was started and the
current CEO.
You can gather this information using Market Guide. Market
Guide is a corporation that gathers details about publicly traded
companies, such as the history of the company, the company’s cash
flow, revenue, and growth rates. It provides you with 5 years of
fundamental history of a company.
Market Guide
Page 8
Chapter 1: Introduction
Step 3: You want to purchase Microsoft at the best offer.
With the MarketMaker window, you can easily view who is
offering the best price for Microsoft and quickly place your order.
The MarketMaker displays Level II data and ECN book data, so
you can see the depth of the market.
MarketMaker Window
Chapter 1: Introduction
Page 9
Step 4. You want to track your shares.
With a MarketMinder window, you can create a PositionMinder to
track your stocks in the market. The PositionMinder offers many
data fields, including Scalped P&L, Net Position, and Total Profit.
The PositionMinder tracks your profit and loss on each of your
positions.
PositionMinder Window
As demonstrated with our Microsoft example, RealTick has
numerous features to help you make the best decisions, place
trades quickly, and monitor events.
Permissions
The feature-rich design of RealTick offers the most
comprehensive, dynamic analytics package available, extending
itself to many different types of users, including Individual
Traders, Broker/Dealers, and Institutions. Its ability to meet the
needs of such a broad audience of traders requires customer
permissions.
Certain features in RealTick are only available for certain
customers. If you do not have a particular feature, you are not
permissioned for it. If you have any questions or concerns
regarding your RealTick permissions, please contact your RealTick
vendor.
Page 10
Chapter 1: Introduction
Chapter 2: RealTick Installation
This chapter discusses system requirements and installation
procedures for RealTick.
System Requirements
The RealTick program requires the proper hardware and operating
systems.
Hardware Requirements
A slow connection can hamper RealTick's performance, so please
compare your computer’s processor, memory (RAM), and
operating system as well as the equipment and speed of your
Internet connectivity to the suggested specifications listed here.
Active users should have the equipment listed in the "Best" column
to ensure top performance.
The following table contains the minimum and recommended
requirements for your computer to run RealTick.
Minimum
Chapter 2: RealTick Installation
Recommended
Best
Processor
Pentium Pro
180 MHz
Pentium III
700 MHz
Pentium III
700 MHz
or better
RAM
64 MB
(Physical)
128 MB
(Physical)
256 MB
(Physical)
or better
Hard Drive
2 GB
4 GB or better
4 GB or
better
Operating
System
Windows 95,
98, or 2000, ME
(Y2K
compliant)
Windows NT
Workstation 4.0
with Service
Pack 4 or
greater or
Windows 2000
Windows
2000
Modem
56.6 Kbps
ISDN or
Broadband
Broadband
Or Direct
Line
Page 11
Internet Requirements
The following table contains the minimum and recommended
requirements for your Internet connection.
Recommended
Best
Connectivity
Provider
Any
Internet
Service
Provider
Minimum
A Local Online
Service Provider
Backbone
Provider
Connection
Line
Single,
Shared Line
ISDN, DSL or
Cable modem
Dedicated
(leased) line
Or Frame
Relay
Speed
56K
<250 ms
<100 ms
Services
E-mail
E-mail
E-mail
Screen Display Requirements
The following table lists the minimum and recommended
requirements for your computer screen display.
Minimum
Recommended
Best
Screen Size
15 in.
17 in.
19 in. or
better
Video Card
512 KB
2 MB
4 MB or
better
Resolution
640 x 480
800 x 600
1024 x 768
Refresh
Rate
60 Hz
72 Hz
85 Hz
Color
Depth
4-bit/16
colors
8-bit/256 colors
16-bit/65,536
colors
Software
The following table lists the software we recommend you purchase
for your web browser, E-mail, and for other RealTick features.
These programs are optional.
Page 12
Chapter 2: RealTick Installation
Program
Use
Microsoft Internet
Explorer
It is required you use Microsoft Internet
Explorer for your web browser.
Microsoft Outlook
It is recommended you use Microsoft
Outlook as your E-mail program.
Adobe Acrobat
Reader
It is recommended you install Adobe
Acrobat Reader version 4.0. The
RealTick web site posts updated versions
of manuals and training guides in .pdf
format. To review these materials, you
must have a copy of Adobe Acrobat
Reader which is a free program provided
by Adobe.
Installation Procedures
You can download the latest version of RealTick from the web
site, www.realtick.com.
Download Installation from RealTick.com
1.
Start your Internet browser. It is recommended you use
Microsoft Internet Explorer.
2.
In the Web Address field, enter www.realtick.com.
The RealTick web site appears.
RealTick Web Site
3.
Chapter 2: RealTick Installation
Click Download.
Page 13
The Download Center page will appear.
Download Center
4.
Click Download.
The Download Options page appears.
5.
Click one of the download options.
Download
Option
Description
HTTP
For a standard download, use the HTTP
connection.
FTP
If for security reasons you are unable to
download files from the web, use the FTP
download.
Multiple
Files
If you have a slow, intermittent Internet
connection, you may prefer to download multiple
files. However, the multiple file download is more
complicated and will take longer than the standard,
single-file download. You will need at least 30
minutes.
Instructions for installing RealTick will appear.
6.
Click the Realnet link.
The File Download dialog box appears.
Page 14
Chapter 2: RealTick Installation
File Download Dialog Box
7.
Click Save.
The Save File As dialog box appears.
Save As Dialog Box
8.
Choose a directory to download the file to, and click Save.
When the download is finished, the Download complete
dialog box appears.
9.
Click Close.
You are now ready to install RealTick.
Chapter 2: RealTick Installation
Page 15
Install RealTick
Once you are finished downloading the latest version of RealTick,
you must install the program.
1.
Access the directory you downloaded the RealNet.exe file to,
and double-click the file.
The system unpacks the installation program and displays the
Setup dialog box.
Setup Dialog Box
The installer program then displays the Welcome dialog box.
Welcome Dialog Box
2.
Click Next.
The Choose Destination Location dialog box appears.
Page 16
Chapter 2: RealTick Installation
Note: You can change the
directory by clicking the
Browse button and
searching for a new
directory. Once you
choose the directory, the
installation occurs.
Choose Destination Location Dialog Box
3.
Click Next to accept the default installation destination.
The installation occurs and the Information dialog box
appears.
Information Dialog Box
4.
Click OK.
You have successfully installed RealTick.
Files Installed
When you finish installing RealTick, you will have a new TAL
directory on your computer.
Chapter 2: RealTick Installation
Page 17
TAL Directory
The TAL directory contains .dll files, .exe files, and other files
necessary for RealTick to run. The TAL directory also contains
sub-directories that are described in the table below.
Sub-Directory
Description
The Data directory contains your activities
for a particular day.
The Favorites directory contains your saved
favorites – preconfigured windows.
The Help directory contains the online help
system for RealTick.
The Pages directory contains all your saved
RealTick pages – layouts of preferred
window arrangements.
The Parm directory contains all the symbol
lists, and MarketMinder and MultiQuote
layouts.
Page 18
Chapter 2: RealTick Installation
Sub-Directory
Description
The Sounds directory contains all the sound
files to use with RealTick’s Alarms and
Alerts feature.
Chapter 2: RealTick Installation
Page 19
Chapter 3: Getting Around in RealTick
This chapter discusses the RealTick Title bar, Menu bar, Toolbar,
and standard Microsoft® Windows® operating system features
you can use to navigate through RealTick.
Windows® Features in RealTick
RealTick is a Windows-based application. You can resize and
navigate through RealTick using standard Microsoft Windows
operating system features.
The following table describes the different Windows features you
can use in RealTick.
Note: The Minimize,
Restore Down,
Maximize, and Close
buttons are also on the
Title bar of the windows
within RealTick, so these
same features apply to a
Chart or a
MarketMinder window
as well.
Feature
Functionality
Window Border
Click and drag the window border to resize the
window. When in the correct position, the
pointer is a double-headed arrow.
Minimize Button
Click the Minimize button to minimize
RealTick to a button on the Windows Taskbar.
Restore Down
Click the Restore Down button to decrease the
size of the RealTick window.
Maximize
Button
Click the Maximize button to maximize
RealTick to fit the entire screen.
Close Button
Click the Close button to shutdown RealTick.
Column Widths
Some windows in RealTick resemble spreadsheets. These
windows contain both columns and rows for displaying data. You
can easily change the size of a column.
Page 20
Chapter 3: Getting Around in RealTick
.
Change the Width of a Column
You can resize columns.
MarketMinder Window
1.
2.
Move the cursor to the column line that divides the field.
The cursor changes to a double-arrow.
Click and hold the left mouse button down while moving right or
left to expand or contract the column.
The system adjusts the column width.
Right Mouse Button
You can use the right button on your mouse to quickly access
commands also listed in the menu bar. For example, instead of
clicking Setup from the Chart menu on the menu bar to access the
Setup window, you can click your right mouse button on the Chart
window. The system will display the Chart menu commands. You
can choose Setup from this list to display the Setup window.
Chapter 3: Getting Around in RealTick
Page 21
Right-Mouse-Button Menu for the Chart Window
You can access the menu commands much faster by right-clicking
a window than by clicking the Menu bar.
For some RealTick windows, there are certain commands only
available on the Menu bar, and other commands only available on
the right-mouse-button menu. For example, you can monitor a
specific quote by choosing Monitor from the right-mouse-button
menu in MarketMaker. The monitor feature is only available
through the right-mouse-button menu.
On some RealTick windows, when you click your right mouse
button on a different area of the window, you access a different
menu. For example, when you click your right mouse button on
the MarketMontage area of the MarketMaker window, you
access a different menu than if you click on the MultiQuote
section of the window.
Page 22
Chapter 3: Getting Around in RealTick
.
MarketMontage Right-Mouse-Button Menu
MultiQuote Right-Mouse-Button Menu
Chapter 3: Getting Around in RealTick
Page 23
Drop-Down Lists
You choose data for many fields from drop-down lists. A dropdown list contains a down arrow to the right of the field.
Drop-Down List for Data Period Field
When you click on the down arrow, a list of choices for the field
appears.
Drop-Down List for Data Period Field
You can only choose the data available in the list for the field. For
example, when you create a chart, you must choose the type of
chart you want to create from the list of options available.
Option Buttons
Option buttons are either small, round, radio buttons or small,
square, check boxes. With the radio buttons, you can only choose
one of the options listed. The chosen button contains a black dot.
Radio Button
You can choose one, all, or none of the check boxes. The chosen
boxes contain black check marks.
Check Box
Page 24
Chapter 3: Getting Around in RealTick
.
RealTick Control Menu
The RealTick program contains a control menu in the upper left
corner of the Title bar.
RealTick Control Menu
You can resize the program window, set defaults for all RealTick
windows, and check server status with the RealTick Control menu.
RealTick Menu Bar
RealTick uses a Windows-based menu bar. The menu commands
include Page, Design, Favorites, Window, and Help. Whenever a
window is selected, RealTick displays a menu option on the menu
bar next to the Design menu that only applies to the selected
window. This menu is referred to as the “Function” menu. For
example, if you choose Chart from the Design menu, the Chart
menu appears.
RealTick Menu Bar without Chart Menu
RealTick Menu Bar with Chart Menu
The following table describes the complete menu bar on the
RealTick window.
Menu Command
Functionality
Page Menu
Chapter 3: Getting Around in RealTick
Open
Displays the Open Page dialog box where
you can choose a page to display.
New
Creates a new page.
Page 25
Menu Command
Functionality
Save As
Displays the Save As dialog box where you
can name and save a page not yet saved, or to
rename a saved page.
Save
Saves any changes you made to a page.
Page Manager
Displays the Page Manager dialog box
where you can rename, re-order, add, delete,
and open pages.
Next Page
Or
Previous Page
Navigates through pages.
Print
Prints the active window.
Print All
Prints all the windows on the RealTick page.
Print Screen
Displays the Print Configuration dialog box
where you can configure the print job or save
the window capture as a Bitmap.
Design Script
Displays the Script Design dialog box where
you can create a script.
Execute Script
Opens a RealTick Script file.
Toolbars
Hides the toolbar.
Design Toolbar
Hides the Design Toolbar buttons.
Function Toolbar
Hides toolbar buttons specific to a window,
such as Charts.
Status Bar
Hides the status bar.
Change Password
Displays the Change Password dialog box
where you can change your login password.
Display Alerts
Displays the TAL Alerts dialog box where
you can configure a price alert.
Menu Command
Functionality
Design Menu
Show TAL Mail
Displays the TAL Mail window where you
can view your mail.
Page 26
Chapter 3: Getting Around in RealTick
.
Menu Command
Chapter 3: Getting Around in RealTick
Functionality
Show News Alert
Displays the News Alerts window where
you can configure news alerts.
Chart
Displays the Chart Setup dialog box where
you can configure the data to display in a
graph.
Table
Displays the Table Setup dialog box where
you can configure the data to display in a
table.
Ticker
Displays the Setup Ticker dialog box where
you can configure the real-time price and
volume information to display.
News
Displays the Quick Search Criteria dialog
box where you can configure the news
headlines and stories to display.
Fixed Page News
Click Fixed Page News to read daily
updated news stories.
Forex
Displays the Currency Menu dialog box
where you can configure currency cash
prices to view.
TurboOptions
Displays the Setup Turbo Options dialog
box where you can configure option data to
display.
MarketMinder
Displays the Minder Setup dialog box
where you can configure virtually any type
of quote information to display.
MarketMakers
Displays the MarketMaker / Regional
Setup dialog box where you can configure
Level II data to display.
Time & Sales
Displays the Setup Time and Sales dialog
box where you can select a symbol to display
its time and price information.
MultiQuote
Displays the Open dialog box where you can
select a layout to display different sets of
fundamental data, price data, and account
(margin) information.
Order Book
Displays the Order Book window where
Page 27
Menu Command
Functionality
you can trade.
Stocks
Displays the Stocks Setup dialog box where
you can configure several different RealTick
windows in one composite window.
Web Browser
Displays the Browser Setup dialog box
where you can view sites on the World Wide
Web.
Corporate Actions
Displays the Corporate Actions Setup
dialog box where you can configure a search
to track a company’s activity, such as
dividends, stock splits, and initial public
offerings.
TAL Alarms
Displays the Alarms Setup dialog box
where you can configure a notification for
when a certain event occurs.
Indications
Displays the IOI Setup window where you
can configure filters to view indications.
Menu Command
Functionality
Chart Menu
Setup
Displays the Chart Setup dialog box where
you can modify a chart window.
Add/Replace
Symbol
Displays the New Symbol dialog box where
you can add or replace a symbol to the chart.
Setup Studies
Displays the Select Studies dialog box
where you can add or remove a technical
study.
Display
Displays the Chart Display Options dialog
box where you can change the font, color, or
layout of the chart.
Scaling
Displays the Chart Scaling dialog box
where you can alter the scale of both the
horizontal and vertical axis of the chart.
Style
Displays the Chart Type dialog box where
you can change the chart’s calculation type.
Choose between Normal, Ratio, Differential,
Page 28
Chapter 3: Getting Around in RealTick
.
Menu Command
Functionality
or Percent Change.
Chapter 3: Getting Around in RealTick
Attributes
Click Attributes for quick access to options
to scale a chart and to change the display.
Auto Scale
Click Auto Scale to scale the chart so the
visible data uses all of the available screen
space.
Snap to Window
Click Snap to Screen to scale the chart so all
the visible data uses the entire screen space.
Display Price
Tracking Window
Display a specific point’s price information.
Grid
Show grid lines.
Annotation
Displays the Chart Annotation dialog box
where you can write a note.
Candlestick
Change to a candlestick chart.
Show Pivot Lines
Show pivot lines.
Calculate VWAP
Displays the Calculate VWAP dialog box
where you can calculate the Volume
Weighted Average Price for a specified time
range.
Commit Changes
Save data changes. Only available for LAN
customers.
Change Colors
Change the display colors.
Screen Font
Displays the Screen Font dialog box where
you can change the display font.
Printer Font
Displays the Font dialog box where you can
change the printer font.
Print
Prints the chart window.
Info Tool
Display a specific point’s price information.
Select Tool
Move, copy, size, or delete trend lines.
Trend Tool
Create a trend line.
Zoom Tool
Enlarge a section of a chart.
Crosshair Tool
View the data of one specific point on a
Page 29
Menu Command
Functionality
chart.
Favorites
Access the favorites.
Add to Favorites
Displays the Save Favorite dialog box
where you can save a chart layout.
List of Favorites
Saved Chart layouts.
Menu Command
Functionality
Table Menu
Setup
Displays the Table Setup dialog box where
you can modify the table display.
Add/Replace
Symbol
Displays the New Symbol dialog box where
you can add or replace a symbol.
Setup Studies
Displays the Select Studies dialog box
where you can add or remove technical
studies.
Calculate VWAP
Displays the Calculate VWAP dialog box
where you can calculate the Volume
Weighted Average Price for a specified time
range.
Display
Displays the Table Display Options dialog
box where you can change the font, color, or
layout.
Style
Displays the Chart Type dialog box where
you can configure the calculation type.
Commit Changes
Save data changes. Only available for LAN
customers.
Change Colors
Displays the Color Setup dialog box where
you can change the display colors.
Screen Font
Displays the Font dialog box where you can
change the display font.
Printer Font
Displays the Font dialog box where you can
change the printer font.
Print
Displays the Print dialog box where you can
print the table window.
Page 30
Chapter 3: Getting Around in RealTick
.
Menu Command
Functionality
Ticker Menu
Hint: You can choose
to view data from all
available exchanges
(composite data) or
from a selected
exchange(s).
Setup
Displays the Setup Ticker dialog box where
you can modify the Ticker window.
Exchanges
Displays the Select Regional Exchanges
dialog box where you can select a single
exchange or to select composite data.
NASDAQ Quote
Sources
Displays the Quote Sources to Display
dialog box where you can select quote
sources.
Colors
Displays the Ticker Color Selection dialog
box where you can change the display colors.
Font
Displays the Font dialog box where you can
change the display font.
Cascade
Toggle your Ticker display between Jet
(horizontal scrolling) and Cascade (vertical
scrolling).
New Line on Top
Display the newest quote information on the
first line of the window.
Clear
Clear all the quotes currently displayed on
the window.
Child -> Popup
Move the Ticker window outside of
RealTick or from one page to another.
Popup -> Child
Return the Ticker window to a RealTick
page.
Menu Command
Functionality
News Menu
Chapter 3: Getting Around in RealTick
Search Criteria
Displays the Quick Search Criteria dialog
box where you can modify the search
criteria.
Find Headline
Displays the Find dialog box where you can
search for keywords amongst the headlines.
Go To
Displays the Go To dialog box where you
Page 31
Menu Command
Functionality
can view specific news stories not included
in the headline list.
Note: By default, the
previous and next
story is selected by
number, but you can
choose to select it by
story or headline.
Go To Last Story
Re-open the last viewed news story.
Configure
Displays the Configure dialog box where
you can change the display and behavior of
the News window.
Copy Headlines
Copy headline(s) to the Windows clipboard.
Copy Story
Copy the current story from the story
window to the Windows clipboard.
Toggle Panes
Move among the standard split pane, the
headline pane, and the story pane.
Hide Scrollbars
Remove or restore the scroll bars.
Next Story Page
Move from the current story to the next story.
Previous Story
Page
Move from the current story to the previous
story.
Print
Displays the options to print the headline
panel or print the story displayed in the lower
panel of the active window.
Setup
Displays the Print dialog box where you can
configure the print settings.
Headlines
Prints the headlines.
Story
Prints the story.
Automatically
Print Stories
Send every story you request to the printer
immediately.
Add Story to Print
Scheduler
Create a group of stories you can either print
or export to a text file.
Setup Print
Scheduler
Displays the Scheduled Story
Configuration dialog box where you can
add stories to the print list, choose a file
name for export, and set the time for printing
or exporting of the chosen stories.
Font
Displays the options to change the headline
or story font.
Page 32
Chapter 3: Getting Around in RealTick
.
Menu Command
Note: Alert headlines
will appear in red (or
whatever color you
designated for Alerts in
the Colors window).
The “HOT” category is
an Alert category by
default.
Functionality
Headline
Displays the options to change the screen or
print font.
Story
Displays the options to change the story
screen or print font.
Screen
Displays the Font dialog box where you can
change the display font.
Printer
Displays the Font dialog box where you can
change the printer font.
Change Colors
Displays the Select Colors dialog box where
you can choose the text and background
color for different types of headlines
displayed in the headline window.
Set Alert
Categories
Displays the Alert Categories dialog box
where you can designate a category as an
alert.
Newest At Top
Display the newest headline at the top.
Auto Request
Stories
Request the story associated with each new
headline as it is received from the server.
Alarm
Set an audible alert for the arrival of each
new headline.
Child -> Popup
Move the News window outside of RealTick
or from one page to another.
Popup -> Child
Return the News window to a RealTick page.
Menu Command
Functionality
Fixed Page News Menu
Chapter 3: Getting Around in RealTick
Choose Server
Displays the Select Server dialog box where
you can choose a different server.
Find Headline
Displays the Find Page in $NEWS$ Fixed… dialog box where you can search for
a particular headline.
Go To
Displays the Go To dialog box where you
can search headlines by Source and Page
number rather than by the usual search
Page 33
Menu Command
Functionality
criteria.
Go Back
Go back to the previous story visible in the
story window.
Configure
Displays the Configure dialog box where
you can add columns to the headline tree and
set other parameters relating to the Fixed
Page News display.
Copy Story
Copy a story to the Windows Clipboard.
Maximize Story
Window
Maximize the story window.
Print
Displays the options to print.
Setup
Displays the Print dialog box where you can
configure the print settings.
Story
Print a story.
Font
Displays the options to change the fonts and
printer fonts for the headline list and the
story window.
Headline
Displays the option to change the font for the
screen or for print.
Story
Displays the options to change the font for
the screen or for print.
Screen
Displays the Font dialog box where you can
change the display font.
Print
Displays the Font dialog box where you can
change the print font.
Colors
Displays the Select Colors dialog box where
you can change the display colors.
Close
Close the Fixed Page News window.
Child ->Popup
Move the Fixed Page News outside of
RealTick or from one page to another.
Popup -> Child
Return the Fixed Page News window to a
RealTick page.
Toggle Scrollbars
Remove or restore the scroll bars to the
Page 34
Chapter 3: Getting Around in RealTick
.
Menu Command
Functionality
selected news window.
Split Window
Menu Command
Display the headline tree and the story panel
at the same time.
Functionality
Forex Menu
Note: The Fonts you
choose here apply to the
Forex window and will
be used by the printer if
you select the Print
command.
Setup Fields
Displays the Setup Forex dialog box where
you can select the exchange rate information
to be displayed.
Setup Currencies
Displays the Currency Menu dialog box
where you can select currencies.
Fonts
Displays the Font dialog box where you can
change the display font.
Colors
Displays the Select Colors dialog box where
you can change the display colors.
Print Preview
View the Forex window, as it will appear
when printed.
Print
Print the Forex window.
Toggle Scrollbars
Remove or restore the scroll bars.
Menu Command
Functionality
TurboOptions Menu
Chapter 3: Getting Around in RealTick
Setup
Displays the Setup TurboOptions window
where you can modify the TurboOptions
window.
Exchange
Displays the Select Regional Exchange
window where you can specify the regional
exchange.
Print
Displays the Print dialog box where you can
print the TurboOptions window.
Font
Displays the Font dialog box where you can
change the display font.
Color
Displays the Select Colors screen where you
Page 35
Menu Command
Functionality
can change the display colors.
Note: Normally the
data in your
TurboOptions window
will be updated in
real-time. The Refresh
command is a manual
override that forces an
immediate refresh.
Refresh
Request new data from the Server.
Option Root Info
Displays the Option Root Settlement Info
dialog box where you can view information
about each series available, such as contract
size and multiplier (for US Equity Options
only).
Select Account
Displays the Select Account dialog box
where you can choose a new trading account.
Show Order View
Click Show Order View to display the
Order Entry fields.
Show Regional
View
Click Show Regional View to display a
MarketMaker panel.
Order Entry
Properties
Displays the Order Entry Properties dialog
box where you can set system wide defaults
for the order entry system, including default
quantities and routes.
Favorites
Displays the favorites.
Add to Favorites
Displays the Save Favorite dialog box
where you can save a TurboOptions layout.
List of Favorites
Saved TurboOptions layouts.
Menu Command
Functionality
MarketMinder Menu
Setup
Displays the Minder Setup dialog box
where you can modify a MarketMinder
window.
Quick Setup
Displays the Quick Futures Setup dialog
box where you can select a commodity.
Load Symbols
Displays the Load Symbols dialog box
where you can choose a symbol file (list of
symbols) to replace the list of symbols
previously loaded in the MarketMinder
window.
Save Symbols
Displays the Save Symbols dialog box
Page 36
Chapter 3: Getting Around in RealTick
.
Menu Command
Functionality
where you can create a new symbol file from
the list of symbols in the MarketMinder.
Note: Multi-layered
sorting can help you to
grasp the market
situation at one
glance. Simple sorts
organize the database
on one value. The
default sort organizes
the data by symbol in
alphabetical order.
Chapter 3: Getting Around in RealTick
Links
Displays the Select Window to Link dialog
box where you can link other windows to the
MarketMinder
Column Layout
Choices
Displays column layout options.
Configure Column
Layout
Displays the Column Layout dialog box
where you can choose columns.
Load Column
Layout
Displays the Column Layout dialog box
where you can open pre-configured column
layouts.
Save Column
Layout
Save changes to the column layouts.
Save Column
Layout As
Displays the Save Layout dialog box where
you can save a new column layout or to
rename a column layout.
Set Default
Layouts
Displays the Set Default Layouts dialog box
where you can change the default layout for
each type of MarketMinder window: the
Standard MarketMinder, the PositionMinder,
or the OrderMinder.
Display Options
Displays the Display Options dialog box
where you can configure text, color, and
highlighting.
Custom Sort
Displays the Custom Sort dialog box where
you can sort or organize data in a column.
Show Ticker
Displays a Ticker.
Select Account
Displays the Select Account dialog box
where you can view data or place trades with
another account.
Order Entry
Properties
Displays the Order Entry Properties dialog
box where you can set system wide defaults
for the order entry system, including default
quantities and routes.
Show Order Entry
Displays the OES.
Page 37
Menu Command
Functionality
Screen
Show Market
Making Screen
Displays the Market Making order entry
panel.
Show Basket
Order Screen
Displays the Basket order entry panel.
Load a Basket
Displays the Open dialog box where you can
open a BasketMinder.
Save Basket
Displays the Save As dialog box where you
can save a BasketMinder.
Copy to Clipboard
Copy information from the MarketMinder
window to the Windows Clipboard.
Paste from
Clipboard
Copy data from the Windows Clipboard into
MarketMinder.
Child -> Popup
Move the MarketMinder window outside of
RealTick or from one page to another.
Popup -> Child
Return the MarketMinder window to a
RealTick page.
Favorites
Access MarketMinder favorites.
Add to Favorites
Displays the Save Favorite dialog box
where you can save a MarketMinder layout
as a favorite.
Menu Command
Functionality
MarketMakers Menu
Setup
Displays the MarketMaker / Regional
Setup dialog box where you modify a
MarketMaker window.
Display Options
Displays the Display Options dialog box
where you change the font, color, and layout.
Quote Sources
Displays the Quote Sources to Display
dialog box where you select the quote
source.
Exclude Closed
Exclude all closed quotes.
Page 38
Chapter 3: Getting Around in RealTick
.
Menu Command
Note: The Market
Montage displays the
total bids, asks, and sizes
of the trades in the same
range level.
Chapter 3: Getting Around in RealTick
Functionality
Show Irregular
Trades
Display all irregular trades.
Alert on Updates
RealTick will beep every time it receives an
update from the server.
Show Windows
Displays the window options you can
display.
MultiQuote
Remove or restore the MultiQuote display.
Range Bar
Remove or restore the Range Bar.
Market Montage
Add a Market Montage.
Order Entry Screen
Add the Order Entry fields.
Ticker
Add a Ticker.
Select Account
Displays the Select Account dialog box
where you can select an account for trading.
Order Entry
Properties
Displays the Order Entry Properties dialog
box where you can set system wide defaults
for the order entry system, including default
quantities and routes.
Next MarketMaker
Move between multiple MarketMaker
windows on a RealTick page.
Child to Popup
Move the MarketMaker window outside of
RealTick or from one page to another.
Popup to Child
Return the MarketMaker window back to a
RealTick page.
Favorites
Access MarketMaker favorites.
Add to Favorites
Displays the Save Favorite dialog box
where you can save a MarketMaker layout as
a favorite.
Page 39
Menu Command
Functionality
Time & Sales Menu
Setup
Displays the Setup Time And Sales dialog
box where you can modify a Time & Sales
window.
Add/Replace
Symbol
Displays the New Symbol dialog box where
you can add or replace symbols.
Rgnl Exchanges
Displays the Select Regional Exchanges
window where you can select an exchange.
Calculate VWAP
Displays the Calculate VWAP dialog box
where you can calculate the volume
weighted average price for a specified price
range.
Change Colors
Displays the Color Setup dialog box where
you can change the display color.
Screen Font
Displays the Font dialog box where you can
choose a display font.
Printer Font
Displays the Font dialog box where you can
choose a font for print.
Print
Displays the Print dialog box where you can
print the Time & Sales window.
Copy to ClipBoard
Copy data from the Time & Sales window to
the Windows Clipboard.
Child -> Popup
Move the Time & Sales outside of RealTick
or from one page to another.
Popup -> Child
Return the Time & Sales window to a
RealTick page.
Menu Command
Functionality
MultiQuote Menu
Setup
Displays the MultiQuote Setup dialog box
where you can modify the MultiQuote
window.
Open Layout
Displays the Open dialog box where you can
Page 40
Chapter 3: Getting Around in RealTick
.
Menu Command
Functionality
choose a layout to open.
Chapter 3: Getting Around in RealTick
Save Layout
Save any changes to a layout.
Save Layout As
Displays the Save As dialog box where you
can rename an existing layout.
Edit Mode
This option is not available.
Links
Displays the Select Window to Link dialog
box where you can link the MultiQuote
window to another window in RealTick.
Set Properties
Displays the Properties dialog box where
you can enter a description, a title, your
name, and additional comments about a
particular MultiQuote window.
Toggle
Background
Toggle between different backgrounds.
Background
Bitmap
Displays the Open dialog box where you can
add or change a bitmap picture to the
background.
Background Color
Displays the Color dialog box where you can
select a background color.
Default Font
Displays the Font dialog box where you can
change the font of a MultiQuote window.
Select Account
Displays the Select Account dialog box
where you can select a new account.
Print Preview
View how your MultiQuote window will
appear on the printed page.
Print
Displays the Print dialog box where you can
print the MultiQuote window.
Child -> Popup
Click Child -> Popup to move MultiQuote
outside of RealTick or from one page to
another.
Popup -> Child
Click Popup -> Child to return the
MultiQuote window to a RealTick page.
Favorites
Access MultiQuote favorites.
Add to Favorites
Displays the Save Favorite dialog box
h
li
l
Page 41
Menu Command
Functionality
where you can save a MultiQuote layout as a
favorite.
Menu Command
Functionality
Order Book Menu
Setup
Displays the OrderBook Setup dialog box
where you can modify the OrderBook
window.
Select Account
Displays the Select Account dialog box
where you can choose a new account.
Order Entry
Properties
Displays the Order Entry Properties dialog
box where you can set system wide defaults
for the order entry system, including default
quantities and routes.
Put Managed
Orders in Separate
Panel
Displays a separate panel for managed
orders, such as Conditional orders and
Deferred orders.
Show Account
Balance
Displays the account balance.
Show Order Entry
Screen
Displays the order entry fields.
Show Order Price
Summary
Displays fills aggregated at each price level.
Copy to Clipboard
Copy data from the OrderBook window to
the Windows Clipboard.
Menu Command
Functionality
Stocks Menu
Setup
Displays the Stocks Setup dialog box where
you can modify the Stocks window.
Next Window
Scrolls forward through the tabs.
Previous Window
Scrolls backwards through the tabs.
Select Tab Font
Displays the Font dialog box where you can
change the style, size, and color of the text
Page 42
Chapter 3: Getting Around in RealTick
.
Menu Command
Functionality
on the window tabs.
Configure Tabs
Displays the Configure Tabs dialog box
where you can add or remove tabs to the
Stocks window.
Open Tab Layouts
Displays the Open dialog box where you can
open a specific type of Stocks window.
Save Tab Layout
Displays the Save As dialog box where you
can save the Stocks window.
Configure Active
Tab
Displays the Setup dialog box for the
particular window where you can configure
the tab currently opened.
Select Account
Displays the Select Account dialog box
where you can choose a new account.
Menu Command
Functionality
Web Browser Menu
Chapter 3: Getting Around in RealTick
Back
Displays the previous web page.
Forward
Displays the next page.
Stop
Terminates a downloading web page.
Refresh
Reload the current web page.
Home
Load the home page.
Setup
Displays the Browser Setup dialog box
where you can modify the Web Browser.
Toolbar
Toggle the navigational toolbar on and off.
Status Bar
Toggle the status bar on and off.
Favorites
Access Browser favorites.
Child to Popup
Click Child -> Popup to move Web
Browser outside of RealTick or from one
page to another.
Popup to Child
Click Popup -> Child to return Web
Browser to a RealTick page.
Page 43
Menu Command
Functionality
Corporate Actions Menu
Setup
Displays the Corporate Actions Setup
dialog box where you can modify the
Corporate Actions window.
Font
Displays the Font dialog box where you can
choose the font.
Background Color
Displays the Color dialog box where you can
choose a standard or custom color for the
background.
Menu Command
Functionality
TAL Alarms Menu
Setup
Displays the Alarm Setup dialog box where
you can modify TAL Alarms.
Display Alerts
Displays the TAL Alerts dialog box where
you can create, change, delete, and turn off
an alert.
Font
Displays the Font dialog box where you can
change the font.
Clear
Clears all the quotes displayed on the
window.
Menu Command
Functionality
Indications Menu
Setup
Displays the IOI Setup dialog box where
you can modify the IOI Client window.
Show Order Entry
Screen
Add Order Entry fields.
Detail for IOI
Display the details for a specific indication
listed in the IOI Client window.
Page 44
Chapter 3: Getting Around in RealTick
.
Menu Command
Functionality
Favorites Menu
Add to Favorites
Displays the Save Favorite As dialog box,
where you can name, configure, save, and
add the window to the Favorites list.
Edit Favorites
Displays the Edit Favorites dialog box
where you can choose a favorite you would
like to edit.
List of Favorites
Chart, MarketMinder, MarketMaker,
MultiQuote, Stocks, TurboOptions, Web
Browser
Menu Command
Functionality
Window Menu
Tile
Arrange the windows on the page vertically,
side by side in columns.
Tile Horizontally
Arrange the windows on a page horizontally,
one on top of the other.
Cascade
Arrange the windows on the page. It will
stack windows one on top of another.
Arrange Icons
Align the window icons along the bottom of
the RealTick screen.
Close All
Close all the windows open on the RealTick
page.
Save Defaults
Saves the font and color settings of your
active window for all new windows of the
same type.
List of Windows
List of the open windows.
Menu Command
Functionality
Help Menu
Chapter 3: Getting Around in RealTick
Help Contents
Open the on-line help.
Symbol Guide
Displays the Symbol Search dialog box
where you can search for a ticker symbol or a
Page 45
Menu Command
Functionality
company’s name.
Jump to our Home
Page
Display the RealTick home page.
About RealTick
Open the Version dialog box containing the
RealTick Module versions.
RealTick Toolbar
You can quickly create any RealTick window by using the
RealTick toolbar. Some RealTick windows also have their own
toolbar buttons. For example, if you create a Chart window,
additional Chart icons (also known as the Function menu) are
added to the toolbar.
The RealTick toolbar is dockable. You can configure the toolbar
vertically or horizontally.
RealTick Toolbar without the Chart Function Menu
RealTick Toolbar with the Chart Function Menu
The following table describes the complete toolbar on the RealTick
window.
Icon
Description
Show Help Topics
Click this toolbar button and the help menu
will appear.
TAL Mail
Click this toolbar button and the TAL Mail
dialog box will appear.
Chart
Move the mouse over the toolbar button
without clicking and the Chart favorites will
appear, or click the button and configure a
Chart window.
Page 46
Chapter 3: Getting Around in RealTick
.
Chapter 3: Getting Around in RealTick
Table
Move the mouse over the toolbar without
clicking and the Table favorites will appear,
or click the button and configure a Table
window.
Ticker
Move the mouse over the toolbar button
without clicking and the Ticker favorites will
appear, or click the button and configure a
Ticker window.
News
Move the mouse over the toolbar button
without clicking and the News favorites will
appear, or click the button and configure a
search for news.
Fixed Page News
Move the mouse over the toolbar button
without clicking and the Fixed Page News
favorites will appear, or click the button and
the Fixed Page News window appears.
Forex
Move the mouse over the toolbar button
without clicking and the Forex favorites will
appear, or click the button and configure a
Forex window.
TurboOptions
Move the mouse over the toolbar button
without clicking and the TurboOptions
favorites will appear, or click the button and
configure a TurboOptions window.
MarketMinder
Move the mouse over the toolbar button
without clicking and the MarketMinder
favorites will appear, or click the button and
configure a Minder window.
MarketMaker
Move the mouse over the toolbar button
without clicking and the MarketMaker
favorites will appear, or click the button and
configure a MarketMaker window.
Time & Sales
Move the mouse over the toolbar button
without clicking and the Time & Sales
favorites will appear, or click the button and
configure a Time & Sales window.
Page 47
MultiQuote
Move the mouse over the toolbar button
without clicking and the MultiQuote
favorites will appear, or click the button and
configure a MultiQuote window.
Stocks
Move the mouse over the toolbar button
without clicking and the Stocks favorites will
appear, or click the button to configure a
Stocks window.
Web Browser
Move the mouse over the toolbar without
clicking and the Web Browser favorites will
appear, or click the button to configure a
Web Browser.
Corporate Actions
Move the mouse button over the toolbar
button without clicking and the Corporate
Actions favorites will appear, or click the
button to configure a Corporate Actions
window.
TAL Alarms
Move the mouse over the toolbar button
without clicking and the TAL Alarms
favorites will appear, or click the button to
configure TAL Alarms.
Indications
Move the mouse over the toolbar button
without clicking and the Indications favorites
will appear, or click the button to configure
an Indications window.
RealTick Status Bar
The RealTick status bar is displayed on the bottom of the RealTick
program window. With this bar, you can view your name and
domain, server connection status, and time.
RealTick connects to different servers via the Internet for quote
and order data. When you are connected to the servers, the system
displays three green lights in the status bar.
RealTick Status Bar
The first light is for the Price Server connection, the middle light is
for the News Server, and the light on the right is for the Trade
Server connection.
Page 48
Chapter 3: Getting Around in RealTick
.
When you lose connections to any of the servers, the system
displays a red light on the status bar for the server.
RealTick Status Bar displaying a connection error
A yellow light indicates a potential problem with a server, such as
data queuing, or no response from a server.
No light indicates there is no feed or data available.
The following table describes the information displayed on the
RealTick status bar.
Feature
Chapter 3: Getting Around in RealTick
Description
Name and Domain
The Name and Domain displays your login
name and domain.
Status Lights
The Status Lights displays your connection.
Server Button
The Server Button opens the Select Server
dialog box where you can select the server
you would like to point to.
Time
The Time displays the time in hours,
minutes, and seconds.
Page 49
Chapter 4: Basic Features
This chapter discusses the basic features of RealTick, including
TAL Mail.
Starting RealTick
When you purchased RealTick, your RealTick vendor should have
supplied you with a user name, domain name, and password to log
on to RealTick. Once you’re in RealTick, you can change your
password.
RealTick icon.
Log On to RealTick
1.
Select RealTick from the Start menu.
The Enter Your User Information dialog box appears.
Enter Your User Information Dialog Box
2.
3.
Type your name in the User Name field.
Type the domain name (supplied to you by your RealTick vendor)
in the Domain Name field.
NOTE: After the first time you log on to RealTick, you will only
need to type your password.
Note: Your password
is case sensitive.
4.
5.
Page 50
Type your password (supplied to you by your RealTick vendor) in
the Password field.
Click OK.
The Enter TAL Mail Password dialog box will appear.
Chapter 4: Basic Features
Enter TAL Mail Password Dialog Box
6.
7.
Type your TAL Mail password.
Click OK.
The RealTick window appears.
RealTick Window
Change Your Password
After you start RealTick, you can change your password.
1.
Click Change Password on the Page menu.
The program displays the Change Password dialog box.
Change Password Dialog Box
2.
Chapter 4: Basic Features
Type your new password in the New Password field.
Page 51
3.
4.
5.
Type your new password again in the Confirm new password
field.
Type your old password in the Current Password field.
Click OK.
The system changes your password, and closes the window.
RealTick Pages
Note: Fixed-page
users cannot modify
their pages.
A Page is a collection of related windows that are opened and
closed at the same time. Whenever a new window is created, it is
added to the current page. When a window is closed, it is deleted
from the current page. Before opening a new page or closing the
current page, RealTick gives you the option of saving the changes
you have made to the page.
RealTick Page Displaying Data for Microsoft
Page 52
Chapter 4: Basic Features
RealTick Page Displaying Data for IBM
Create a Page
You can create numerous pages for all your trading needs.
o
Click New on the Page menu.
A blank page appears with the word “Untitled” in the title bar.
Open a Page
You can open any page you created.
1.
Hint: If the page you
want to open is saved
in a different location
than the Pages
directory, choose the
location from the Look
in field.
Click Open on the Page menu.
The Open Page dialog box appears.
Open Page Dialog Box
2.
Chapter 4: Basic Features
Choose the page you want to open.
Page 53
3.
Click Open.
The system displays the page.
View Next or Previous Page
Hint: You can also
toggle between pages
using the plus (+) and
minus (-) keys on your
number keypad.
To toggle between different pages, use the Next or Previous Page
feature in RealTick.
o
To view the last page you displayed, click Previous Page on
the Page menu.
o
To view the next page, click Next Page on the Page menu.
Save a New Page
After you have added data to a page (see chapters 5, 6, and 7), you
can save the page.
1.
Click Save As on the Page menu.
The Save Page As dialog box appears.
Note: RealTick saves
all pages to the
TAL/Pages directory,
unless you specify
another location. You
can choose a different
location from the Save
in field.
Save Page As Dialog Box
2.
3.
Type a name for the page in the File name field.
Click Save.
The system saves the page and closes the Save Page As dialog
box.
Save an Existing Page
You can save a page any time you make a change.
o
Click Save on the Page menu.
The system saves the page.
Page 54
Chapter 4: Basic Features
Drag and Drop a Page
You can drag and drop a page into RealTick.
o
Click the page and drop it into RealTick.
The page will open.
Using the Page Manager
The Page Manager feature provides you a way to organize and
manage your pages. It is an alternative to the Page/Open menu
command (which just shows you the page files on your computer’s
hard drive). Whenever a page is opened, RealTick adds it to the
Page Manager, if it is not already present.
Through Page Manager, you can delete, rename, and add pages.
For example, if someone e-mails you a page you would like to add
to RealTick, all you need to do is save it to your disk, open Page
Manager, and click Add Pages. The Page Manager is also useful
in LAN environments where users may want to share pages from a
network drive in addition to each user’s personal pages on his own
machine.
Open the Page Manager Dialog Box
o
Click Page Manager on the Page menu.
The Page Manager dialog box appears.
Hint: You can set
RealTick to
automatically open
Page Manager after
you log on. Check the
Show this dialog on
startup field, and
RealTick will open this
dialog box after you log
on.
Page Manager Dialog Box
Chapter 4: Basic Features
Page 55
Add a New Page
You can add more pages to your RealTick program. Use this
feature if someone sends you a page you want saved to your
RealTick.
Note: To add a page
someone sends you in email, save the page in the
Pages directory.
1.
2.
Click Page Manager on the Page menu.
The Page Manager dialog box appears.
Click Add Pages.
The Select Pages to Add dialog box appears.
Select Pages To Add Dialog Box
3.
4.
5.
6.
7.
Enter the location of the page in the Look in field.
Click the drop-down list and double-click the drive and directory
of the page.
Click the name of the page when it appears in the Select Pages to
Add dialog box.
Click Open.
The Page Manager window appears with the name of the page
added to your list.
To view the page, click the name of the page and click Open.
The system displays the page.
Rename a Page
You can also rename a page without changing any other
information on the page.
1.
Page 56
Click Page Manager on the Page menu.
The Page Manager dialog box appears.
Chapter 4: Basic Features
2.
3.
Click the name of the page you want to rename.
Click Rename.
The Rename Page File dialog box appears.
Rename Page File Dialog Box
4.
5.
6.
Type the new name for the page in the New Filename field.
Click Rename.
The program renames the page and displays the Page Manager
dialog box.
Click OK.
The program saves all changes and closes the Page Manager
dialog box.
Delete a Page
Warning: When you
delete a page, it is
permanently removed
from your computer not just from RealTick!
The Delete function allows you to remove a page from the Page
Manager’s list. When you delete a page, you have the option to
delete the page from your drive as well.
1.
2.
3.
Click Page Manager on the Page menu.
The Page Manager dialog box appears.
Click the name of the page you want to delete.
Click Delete.
The Remove Page from List dialog box appears.
Remove Page From List Dialog Box
4.
Chapter 4: Basic Features
Click Yes to permanently delete the page.
Click No if you just want to remove it from Page Manager.
Page 57
Create a Page Hotkey
Assign a page a hotkey for quick access. You can type a letter and
the page will appear. You must set the system defaults for hotkeys.
See Setting System Defaults in this chapter.
1.
Note: Once you create a
hotkey, you must set the
system defaults for hotkeys.
See the Setting System
Defaults section in this
chapter.
2.
3.
4.
5.
6.
Click Page Manager on the Page menu.
The Page Manager dialog box appears.
Click the page you would like to assign a hotkey.
Click Rename.
The Rename Page File dialog box will appear.
Type the letter you would like to use for the hotkey in the Hotkey
field.
Click Rename.
The Page Manager dialog box appears with the hotkey letter next
to the page.
Click OK.
The hotkey is created.
Moving a Page in the Page Manager Dialog Box
You can move a commonly used page up the list of pages in the
Page Manager. As a result, you will not have to scroll through a
list of pages to the page you most commonly use. You can also
move a page down the list.
1.
Click Page Manager on the Page menu.
The Page Manager dialog box appears.
Page Manager Dialog Box
2.
Page 58
Click the page you want to move.
Chapter 4: Basic Features
3.
4.
5.
Click Move Up or Move Down.
Continue clicking Move Up or Move Down until the page is in the
location you want.
Click OK.
The system saves all changes and closes the Page Manager dialog
box.
TAL Mail
TAL Mail is RealTick’s e-mail program that Townsend Analytics,
Ltd. or your broker dealer will use to contact you.
Open TAL Mail
o
To open TAL Mail, click Show TAL Mail on the Design
menu.
Your mailbox will appear.
TAL Mail
Changing Your TAL Mail Password
1.
2.
3.
4.
5.
Chapter 4: Basic Features
Click Change Mail Password on the File menu of the TAL Mail
window.
The TAL Mail: Change Password box will appear.
Type your current password in the Current Password field.
Type your new password in the New Password field.
Type it again in the Re-enter New Password field.
Click OK.
The password is changed.
Page 59
Add a Sound Alert to TAL Mail
1.
2.
3.
4.
5.
6.
7.
8.
Click Sound Alert Properties on the File menu of the TAL Mail
window.
Click the Use Sound when receiving new mail. check box.
Click the ellipse (…) button.
Select a .wav file.
Click Open.
Click Test.
Click OK.
The alarm is set.
Add a Mail Alert in the Status Bar
RealTick will display a letter icon in your RealTick status bar to
notify you when you receive an e-mail through TAL Mail.
o
Select Alert in Status bar on the TAL Mail File menu.
The alert is set.
Open E-mail Message
When you receive a new message, your mailbox will automatically
appear to display the message (only if RealTick is open, and
regardless of any other program you may be using at the time you
receive the message). You can review these messages as often as
you like.
1.
2.
In your mailbox, double click the message.
The message will open.
After you’re finished reading the message, click the Close button
on the Title bar to close the message.
Close TAL Mail
o
To close TAL Mail, click the Close button on the Title bar.
Delete E-mail Message
1.
2.
Page 60
In your mailbox, click the message you would like to delete.
Click Delete on the Edit menu.
The message is deleted.
Chapter 4: Basic Features
Print E-Mail Message
1.
2.
To print an E-mail message, double click the message you would
like to print.
The message will open.
Click Print on the File menu.
Printing
You can print a page, a window on a page, or a screen shot of the
entire computer screen, including all of RealTick and other open
applications.
RealTick’s Print Screen feature can be used to print the visible
contents of any window in RealTick. In addition to this, many
windows have their own native printing logic, which allows you to
print data that is not currently visible on the screen.
Print the RealTick Page
1.
Hint: Best Fit
maintains the
proportions of the
window you are
printing. Snap to
Printer fills the entire
page area, changing
the proportions of the
windows and its
contents.
Click Print Screen on the Page menu.
The Print Screen Configuration dialog box appears.
Print Screen Configuration Dialog Box
2.
3.
4.
Click RealTick - All from the Window to Print area.
Choose your scaling option from the Printer Scaling.
Click OK.
RealTick prints the entire page.
Print RealTick Windows
Hint: You can scale a
window to print on one
sheet of paper.
Print the RealTick windows without having to print the entire
RealTick page. This option will not print the Menu Bar or the
Toolbar.
1.
2.
Chapter 4: Basic Features
Click Print Screen on the Page menu.
The Print Screen Configuration dialog box appears.
Click RealTick - Client Only from the Window to Print area.
Page 61
3.
4.
Choose your scaling option from the Printer Scaling area.
Click OK.
RealTick prints the windows.
Print One RealTick Window
You can print one of the RealTick windows.
1.
2.
3.
4.
5.
Click the window you want to print.
Click Print Screen on the Page menu.
The Print Screen Configuration dialog box appears.
Click Active Study from the Window to Print area.
Choose your scaling option from the Printer Scaling area.
Click OK.
RealTick prints the window.
Print the Windows Desktop
You can print your entire RealTick page, plus any other Windows
applications you have open.
1.
2.
3.
4.
Click Print Screen on the Page menu.
The Print Screen Configuration dialog box appears.
Click Windows Desktop from the Window to Print area.
Choose your scaling option from the Printer Scaling area.
Click OK.
RealTick prints your Windows desktop.
Save a RealTick Picture as Graphic File
In addition to printing a picture of a RealTick window, you can
save the picture as a bitmap.
1.
2.
3.
4.
5.
6.
Page 62
Click Print Screen on the Page menu.
The Print Screen Configuration dialog box appears.
Choose what to print from the Windows to Print area.
Choose your scaling option from the Printer Scaling area.
Check the Output to File field.
The program activates the File field.
Type the name and location for the bitmap in the File field, or
choose the location by clicking the File button.
Click OK on the Print Screen Configuration Dialog box.
Chapter 4: Basic Features
RealTick prints the window and saves the bitmap picture.
Print a Window
You can print ALL the data in a window by using the Print
Selection option.
1.
2.
Click the window you want to print.
Click Print on the Page menu.
The standard Windows Print dialog box appears.
Print Dialog Box
3.
4.
Click Selection from the Print range area.
Click OK.
The system prints the data from the RealTick window.
Print All the Windows
You can print all the windows on the RealTick page separately.
The Print All option will print all the data in each window on
separate pages.
o
Click Print All on the Page menu.
The program prints all the data for each RealTick window on
separate pages.
Favorites
Favorites are preconfigured windows saved in RealTick that are
available for quick access. RealTick contains favorites of the most
commonly used windows.
Chapter 4: Basic Features
Page 63
Using RealTick’s Favorites
RealTick comes with pre-configured favorites for five windows:
Chart, MarketMinder, Stocks, TurboOptions, and Web Browser.
Pre-Loaded RealTick Favorites
The following table describes each pre-configured RealTick
favorite.
Favorite
Description
Chart
Moving Avg on
Volume and Money
Flow
Create a Chart displaying moving
averages on volume and the money flow.
Line Graph of Close
with Volume
Create an Intraday, Candlestick Chart
with price tracking and a volume display.
CandleStick with
MACD and SP
Create an Intraday, Candlestick Chart
with the S & P Index and a MACD
study.
MarketMinder
Page 64
Live Orders
Create a MarketMinder displaying only
live orders.
Order Details
Create a MarketMinder displaying live
orders, including the status of the order.
Open Positions
Create a MarketMinder displaying only
positions.
TAL Chain Symbol
List
Create a MarketMinder displaying a list
of all the symbol files available in
RealTick.
Chain Display
Create a MarketMinder displaying all of
Chapter 4: Basic Features
Favorite
Description
Defaults
the NASDAQ percent gainers.
TAL Market Guide
Snapshot
Create a MarketMinder displaying 26
columns of price, volume, and other
numeric information.
Market Statistics
Create a MarketMinder displaying a list
of all the symbol files available in
RealTick, including the last price
available for the symbol file.
Index Component
Chains
Create a MarketMinder displaying a list
of all the index symbol files available in
RealTick.
MarketMakers
Small MarketMaker
Create a mini MarketMaker.
MultiQuote
MarketIndices
Create a MultiQuote with Market Indices.
Stocks
Account Info
Create a Stocks window containing two
OrderMinders, two PositionMinders, and
a Multiquote window displaying live
orders, positions, and account balances.
Research
Create a Stocks window displaying a
Daily, Intraday, Market, and Monthly
chart, and News.
TurboOptions
Options Watch List
Create a MarketMinder window
displaying detailed information about
options, including strike and bid prices.
Option Chain
Create a MarketMinder window
displaying all the option symbol files
available in RealTick.
Web Browser
Zack’s Brokerage
Research Center
Chapter 4: Basic Features
Create a Web Browser with Zack’s web
site displaying a company’s profile,
consensus estimates, annual income
statement, and annual balance sheet.
Page 65
Favorite
Earnings Calendar
Industry Search
Earnings Surprises
Market Guide
TAL TraceRoute
Description
Create a Web Browser with Zack’s web
site displaying the brokerage research
data for a period other than the current
day, for a future or past date.
Create a Web Browser with Zack’s web
site displaying the brokerage’s research
data of a particular industry.
Create a Web Browser with Zack’s
information displaying the top surprises
in the market for the current day.
Create a Web Browser displaying the
stock reports and ratio reports for a
specific symbol.
This program tests your connectivity
speed. Use when RealTick seems slow.
Open a Favorite
1.
2.
3.
Click Favorites on the RealTick menu bar.
Move your mouse to the favorite you want to open.
Click the favorite.
The window appears.
Create a Window Using the Chain Symbol Lists
1.
2.
Click TAL Chain Symbol List on the MarketMinder submenu
of the Favorites menu.
The TAL Chain Listing window will appear.
Click a symbol list and drag it to a window you would like to
create.
The symbols are displayed in the window.
Using Your Own Favorites
Create, change, and delete your own favorites in RealTick. You
can save a commonly used layout you create as a favorite.
For example, if you often create a MarketMinder window that
displays the 52 week percentage change, the 52 week high, the 52
week low, last price, change last, and volume, you can save the
layout as a favorite. Then the next time you create a
MarketMinder window, you can just click the favorite.
Page 66
Chapter 4: Basic Features
Add to Favorites
After you create a window, you can set the layout as a favorite.
1.
2.
Click the window you want to save as a favorite.
Click Add to Favorites on the Favorites menu.
The Save Favorite dialog box appears.
Save Favorite Dialog Box
3.
4.
5.
6.
7.
Type or choose a name for the favorite in the Please select a name
for this favorite field.
Check Save Position if you want your favorite to appear in the
same place on any page every time you open it. For example, if
you want to see your chart in the lower right hand corner, it will
appear there even if you placed it somewhere else the last time you
had the favorite opened.
Check Setup After Opening if you want the window’s Setup
dialog to appear every time you open your favorite. With this
option, the favorite acts as a template.
This feature is useful with windows that primary view singlesymbols, such as Charts, Tables, and MarketMaker windows.
Check Use As Default if you want this favorite to be used when
you create a new window of this type from the toolbar.
Click OK.
The system saves your favorite.
Change a Favorite
You can change any of the favorites you created.
1.
Chapter 4: Basic Features
Click Edit Favorites on the Favorites menu.
The Edit Favorites dialog box appears.
Page 67
Edit Favorites Dialog Box
2.
3.
4.
Select the window from the Window Type drop-down list.
Click the favorite you want to change in the Favorites box.
Click Edit.
The Save Favorite dialog box appears.
Save Favorite Dialog Box
5.
Change the name for the favorite in the field labeled Please select
a name for this favorite. You can type a new name or choose an
existing name.
6. Check Save Position if you want your favorite to appear in the
same place on any page every time you open it. If this option is
not selected, RealTick will use its default window-positioning
logic.
7. Check Setup After Opening if you want the window’s Setup
dialog to appear every time you open your favorite.
8. Check Use As Default if you plan to use the window frequently,
regardless of the page you're viewing.
9. Click OK.
The system saves your favorite and closes the Save As dialog box.
10. Click Make As Default if you want to set the favorite as a default
for all RealTick pages.
11. Click OK.
The system saves the favorite and closes the Edit Favorites dialog
box.
Page 68
Chapter 4: Basic Features
Organize Your Favorites Menu
1.
Select Edit Favorites on the Favorites menu.
The Edit Favorites dialog box appears.
Edit Favorites Dialog Box
2.
3.
Select a favorite.
Click Move Up or Move Down to put your favorite in order.
Delete a Favorite
You can permanently delete any favorite you created.
1.
Click Edit Favorites on the Favorites menu.
The Edit Favorites dialog box appears.
Edit Favorites Dialog Box
2.
3.
4.
Chapter 4: Basic Features
Select the window from the Window Type list.
Click the favorite you want to delete in the Favorites box.
Click Delete.
The system deletes the favorite.
Page 69
5.
Click OK.
The system saves all changes and closes the Edit Favorites dialog
box.
Child -> Popup
RealTick offers a Child -> Popup command that changes a window
to a popup window independent of RealTick. A popup window
can move from page to page and/or outside of RealTick. This
functionality is included with windows Ticker, News, FixedPage
News, MarketMinder, MarketMaker, Time & Sales, MultiQuote,
Order Entry, and Web Browser.
Move a Window Outside of RealTick
o
Click Child -> Popup on the window’s function menu.
The window will become independent of RealTick, and the
window’s function menu will disappear.
Move a Window Back to RealTick
o
Click Popup -> Child on the window’s function menu. You
can only access the window’s function menu by right-clicking
the window.
The window will return to RealTick.
Linking Windows
When you link windows, you can enter a symbol in one window
and RealTick will update the linked windows with the same
symbol. For example, you might link the MultiQuote window to a
Chart window and a News window. When you enter a symbol in
the MultiQuote window, the Chart window will build a chart for
the symbol, and the News window will show headlines about the
same symbol. The Links option is available in MarketMinder and
MultiQuote.
Link RealTick Windows
1.
Page 70
Click Links on the MultiQuote or MarketMinder menu.
The Select Window to Link dialog box will open, displaying the
list of windows available for linking.
Chapter 4: Basic Features
Select Window to Link Dialog Box
2.
3.
Click the window(s) you would like to link. To choose multiple
windows with the mouse, hold down the CTRL key.
Click OK.
The windows are linked.
Servers
Monitoring Servers
The status bar at the bottom of the RealTick window displays the
time, the default price server, and your user name and domain. It
also contains the status window, which displays the function of a
toolbar button.
Note: See the Set
System Defaults
section in this chapter
to learn how to change
a server for all of
RealTick.
Chapter 4: Basic Features
Status Bar
The Prices Button, which displays the default price server, allows
you to change servers.
The server status lights show the status of your server connection.
In order from left to right, the lights represent your connections to
the price server (TA_SRV), the news server, and the order server.
Hold your mouse pointer over a light to see a popup window with
summary information about the relevant server. A green light
indicates a working connection. Yellow indicates a possible
problem. Red means the connection has been lost, and gray means
the service is not in use. Click any server status light to call up the
Server Status Monitor screen.
Page 71
Server Status Monitor Screen
If you do not see the status bar, check your Set Defaults screen.
The Show Status Bar function may be turned off.
Change the Server for a RealTick Window
With most of the windows in RealTick, you can change the server
they collect their data from. When you change the server from a
RealTick window, it affects only that window.
Hint: On some Setup
windows, the Server
button is titled Select
Server.
You can change the server from most of the window’s Setup
Screen.
1.
2.
3.
Click the Server button on the window’s Setup screen.
The Select Server screen will appear.
Select the server.
Click OK.
The server is selected.
Load and Search for Symbols
There are several RealTick windows where you can load a symbol
file or search for symbols.
Load a Symbol File
Note: Some setup dialog
boxes will not have the
command Select, but rather
Symbol File or Load.
Page 72
1.
In the Symbol File box, click Select.
The Load Symbols dialog box will appear.
Chapter 4: Basic Features
Note: Some setup dialog
boxes will not have the
drop-down list Type, but
rather Security.
Load Symbols Dialog Box
2.
3.
Click the symbol file you would like to open.
Click Open.
The symbol file will open.
Search for Symbols
1.
Note: Some setup dialog
boxes will have a
Search drop-down list,
where you can select the
type of pattern you will
be searching.
Select the type of security you are searching for in the Type drop
down list. For example, you can search for a stock, future, or
mutual fund.
Type Drop-Down List
2.
Select the exchange from the Exch drop-down list.
Exch Drop-Down List
3.
Type a symbol pattern in the Pattern field.
Pattern field
o
Chapter 4: Basic Features
If you are looking for futures or futures options, enter the
future root preceded by a forward slash (for example, /NG).
Page 73
o
If you are looking for stock options, enter the stock symbol
(for example, IBM).
o
If you are looking for stock symbols, enter the first few letters
of the symbol followed by an asterisk (for example, IB*)
4.
Click OK.
The symbols will load.
Symbol Guide
With RealTick’s symbol guide, you can search for an unknown
symbol. You can search by symbol name, company name, or type
of symbol.
Search for Symbols
You can search for a symbol based on numerous criteria. The
more specific your criteria, the fewer the search results.
1.
Click Symbol Guide on the Help menu.
The Symbol Guide dialog box appears.
Symbol Search Dialog Box
2.
Choose the type of search from the drop-down list in the Search
Type field. You can choose from six different search types.
Search Type
Page 74
Description
Name
Search by name or the partial name of a
company.
Ticker Symbol
Search for all symbols that match the pattern
you have typed.
Chapter 4: Basic Features
Hint: You can change
the server that provides
data to the Symbol
Guide window by
clicking the Select button
in the Symbols Search
Server area. For
example, if you would
like to search for an
options root, change the
server to options.
Commodity Roots
Search for a future based on the product or
commodity name.
Root Search
Return all symbols associated with the
specified root. This search type can be used
for futures, options, and symbol chains.
Futures
List the futures symbols for the commodity
root you have entered.
Futures – Night
Search for night session futures symbols.
3.
Type the full or partial company name, symbol, commodity root,
or future you are searching for in the Pattern field. Check Upper
Case if you want to search for upper case symbols only.
Note: Use Wildcards to help with the search. See the next section
for further details.
4.
5.
6.
7.
Check Expand Roots if you want to search for both daytime and
nighttime symbols. This field is available only if you choose
Commodity Roots from the Search Type field.
Choose the type of security to search for from the Security Type
field. This field is available only if you choose Name or Ticker
Symbol from the Search Type field.
Select an Exchange. For example, search for all symbols listed on
the New York Stock Exchange.
Click Search.
The system displays a list of search results.
Symbology
This symbology is specific to RealTick. Use these symbols when
performing a symbol search with the Symbol Guide.
Type of Symbol
Root
Index
Preceded by $ and followed by (usually,
not always) .X
Chain Index
Preceded by $ and followed by .CH
Options
Preceded by + or -
Futures
Preceded by / and followed by the symbol,
month code, and year.
There are two wildcards you can use to search: * and ?. Use these
wildcards within the root of a symbol. For example, you know the
Chapter 4: Basic Features
Page 75
index root is preceded by a $ and followed by the symbol and .X,
so perform a ticker symbol search using $*.X. A long list of
indices will appear. The * searches for any type or number of
characters.
Symbol Search Dialog Box
The ? will search for one particular character. For example, you
know the future root is preceded by / and followed by the symbol,
month code, and the year, so perform a ticker symbol search using
/??1. A list of futures will appear.
Symbol Search Dialog Box
Month Code for Futures
The following table includes the month codes used in a future root.
While the day session codes are the same for both TAL and
PCQuote hyperfeeds, the syntax for night, aka Globex, symbols is
different. Instead of using a different letter to indicate a Globex
symbol, PCQuote symbology adds a "G" to the end of the day
symbol.
For example, the TAL day symbol for the June 2001 Nasdaq 100
futures is the same as the PCQuote symbol -- /NDM1. When it
comes to the overnight, however, TAL uses /NDI1 while PCQuote
uses /NDM1G.
Service Bureau
Day
Globex
Month
Page 76
Day
Hyperfeed
Globex
January
F
A
F
F#G
February
G
B
G
G#G
March
H
C
H
H#G
April
J
D
J
J#G
May
K
E
K
K#G
June
M
I
M
M#G
Chapter 4: Basic Features
Service Bureau
Day
Globex
Month
Day
Hyperfeed
Globex
July
N
L
N
N#G
August
Q
O
Q
Q#G
September
U
P
U
U#G
October
V
R
V
V#G
November
X
S
X
X#G
December
Z
T
Z
Z#G
Create a RealTick Window with a Symbol in the
Symbol Guide
You can create a window using the symbols in the Symbol Guide.
1.
2.
3.
Click and drag a symbol from the Symbol Guide.
The system displays a circle with a diagonal slash.
Drag the cursor to the toolbar icon of the window you want to
create.
Drop the symbol.
The system creates the window.
Setting System Defaults
System defaults in RealTick affect all the RealTick Windows, or
the behavior of the RealTick framework. You can set your own
system defaults. For example, you can select what page will open
when you first log on to RealTick.
Change Colors for Up Ticks and Down Ticks
Currently, RealTick displays up tick data in green and down tick
data in red. You can change the colors for all the pages and
windows in RealTick by changing the System Defaults setting.
1.
2.
Chapter 4: Basic Features
Click the Control Menu on the left corner of the RealTick title
bar.
Click Set System Defaults.
The Set Defaults dialog box appears.
Page 77
Set Defaults Dialog Box
3.
4.
5.
Click the up or down Up tick arrows to select the up tick color.
The word Up tick changes colors.
Click the up or down Down tick arrows to select the down tick
color.
The word Down tick changes colors.
Click OK.
The system saves the color change and closes the Set Defaults
dialog box.
Set a Startup Page
You can determine what page RealTick will open after you first
startup the program.
1.
2.
3.
Click the Control Menu on the left corner of the RealTick title
bar.
Click Set System Defaults.
The Set Defaults dialog box appears.
Select the page in the On Startup box. You can choose from four
options.
Option
Page 78
Description
Show Page
Manager
Click this option if you want the Page
Manager dialog box to appear when you
open RealTick.
Load First Page
Click this option to automatically open the
first page you have listed in Page Manager
when you log on to RealTick.
Load Recent
Page
Click this option if you want the last page
you used to appear when you open
RealTick.
Chapter 4: Basic Features
No Default Page
4.
Click this option if you do not want
RealTick to load a saved page when you
start the program.
Click OK.
The system saves the startup page setting and closes the Set
Defaults dialog box.
Set Page Hot Keys
When you assign a hotkey to a page, you must set the system
defaults for page hotkeys.
1.
2.
3.
Click Set System Defaults on the Control menu.
The Set Defaults dialog box appears.
Click the Page Hotkeys check box in the Pages box.
Click OK.
The system defaults includes page hotkeys.
Set the Price Display for RealTick
You can choose to display prices as fractions, decimals, or
exponentially.
1.
2.
3.
4.
5.
Note: RealTick can
automatically save
your page before you
shutdown.
Chapter 4: Basic Features
Click the Control Menu on the left corner of the RealTick title
bar.
Click Set System Defaults.
The Set Defaults dialog box appears.
Check Display Fractional Prices as LCD to reduce fraction
prices to the least common denominator. For example, 4/16th
becomes 1/4th.
Check No Points or Carets if you do not want points or carets in
prices. For example, if you choose this option RealTick will
display 7865 instead of 78^65.
Click OK.
The system saves the startup page setting, and closes the Set
Defaults dialog box.
Page 79
Set Page Defaults
You can set defaults for all RealTick pages. For example, you can
set RealTick to save a page before you exit the program.
1.
2.
3.
4.
5.
Click the Control Menu on the left corner of the RealTick title
bar.
Click Set System Defaults.
The Set Defaults dialog box appears.
Check Snap to page if you want all windows on a RealTick page
to proportionally adjust their size to fit the program window.
Check Save Page on Shutdown if you want RealTick to
automatically save all pages before you exit the program.
Click OK.
The system saves the page defaults, and closes the Set Defaults
dialog box.
Set General RealTick Options
Enter symbols in upper case regardless of your keyboard setting
and hide the page name from the title bar.
1.
2.
3.
4.
5.
Note: You can change
the server that supplies
data to an individual
window through the
window’s Setup dialog
box. It will only affect
that window.
Page 80
6.
Click the Control Menu on the left corner of the RealTick title
bar.
Click Set System Defaults.
The Set Defaults dialog box appears.
Check Upper Case Symbols if you want all symbols to be in
upper case regardless of how you type them. Do not set this option
if you plan to use symbols in lower case.
Check Dynamic Title if you want the name of the current page to
be displayed in the title bar. If this is turned off, the system only
displays the word RealTick in the caption.
Check No Captions if you want to remove the names of the
studies from each window. By using this option, you can save
space on your RealTick page.
Click OK.
The system saves all changes, and closes the Set Defaults dialog
box.
Set Default Servers
Determine what server will supply data to your RealTick program.
This will affect all of RealTick.
Chapter 4: Basic Features
1.
2.
3.
Click the Control Menu on the left corner of the RealTick title
bar.
Click Set System Defaults.
The Set Defaults dialog box appears.
Click Servers.
The Select Servers dialog box appears.
Select Server Dialog Box
4.
5.
6.
7.
Click Price from the Service list.
The names of the servers appear in the Available Server
Machines list.
Click the machine you want as the default from the Available
Server Machines list.
Click Make Default.
The system saves the default.
Click OK.
The system closes the Select Server dialog box.
Changing the Display of a Window
Change the window font and color to help better display data.
Most windows contain a standard Windows Font and Color dialog
box where you change the display. However, some windows with
more complicated graphical displays have their own color
configuration screens where multiple colors attributes can be
specified at the same time. See Chapter 5 for more information or
visit the online help.
Change the Window Color of a Window
This is the standard procedure for all the windows in RealTick.
1.
Chapter 4: Basic Features
Click Colors on the window menu.
A standard Windows Color dialog box will appear.
Page 81
Note: A window menu
appears on the Menu bar
after you have opened a
window from the Design
menu. For example, click
MultiQuote on the Design
menu, and MultiQuote will
appear on the Menu Bar.
You can access the Color
command from this window
menu.
Color Dialog Box
2.
3.
Select the color for the window background.
Click OK.
The window background color will change.
Change the Window Font
1.
Click Font on the window menu.
A standard Windows Font dialog box will appear.
Windows Font Dialog Box
2.
Page 82
Choose the font style.
Chapter 4: Basic Features
3.
Chapter 4: Basic Features
Click OK.
The system updates the font style.
Page 83
Chapter 5: Gathering Market Data
This chapter discusses different windows and tools in RealTick
you can use to gather market data. It will tell you the primary
function of each window and how to use it.
Note: Charts is discussed in Chapter 6.
TAL Alarms
TAL Alarms displays data for the current day and/or for the past
52 weeks (year). If it displays data for the past 52 weeks, the data
will end with the day before the current day. It can display the
highs and lows of securities today and/or the high and low of
securities of the past 52 weeks. It can also display securities
within a specified price range, for either the current day and/or for
the past 52 weeks.
You can use TAL Alarms to notify yourself when something
occurs in the market. Much like an alarm clock, you can set
alarms to alert you when a certain stock reaches or drops to a
certain price, or when a certain security’s last price, net change,
bid, offer, high, low, volume, new high, or new low falls below,
falls to, rises to, or rises above a value you specify.
Note: This window
displays the highs and
lows of intraday, the
current day.
TAL Alarms Window
The TAL Alarms window features numerous colors. Each color
has a different meaning. This is the default setting:
Page 84
Chapter 5: Gathering Market Data
Color
Description
White
Symbol name, and what is displayed (New High, New
Low) for either intraday or 52 weeks
Red
Intraday new low
Green
Intraday new high
Yellow
52 week high
Blue
52 week low
Create an Alarm
1.
Click TAL Alarms on the Design menu.
The Alarm Setup dialog box appears.
Alarms Setup Dialog Box
2.
Click Symbol Criteria to choose the symbols to monitor.
3.
Click the Exch arrow and select an exchange.
4.
Click the Type arrow and select a security, or load a Symbol
File.
See Chapter 4 for more information on how to load a symbol
file.
5.
Chapter 5: Gathering Market Data
Click the Filter Parameters tab.
Page 85
Alarm Setup Dialog Box
6.
Select the Intraday High check box to display today’s new
high value.
7.
Select the Intraday Low check box to display today’s new
low value.
8.
Select the 52 Week High check box to display the new high
value of the past 52 weeks.
9.
Select the 52 Week Low check box to display the new low
value of the past 52 weeks.
10. Select the Minimum Price check box to limit the values
displayed on the TAL Alarms window.
This will enable the Minimum Price box to the right.
11. Type the minimum value you want to display in the
Minimum Price box, or use the arrows. The window will
only display the equities that are equal to or higher than the
value you enter.
12. Select the Maximum Price check box to limit the values
displayed on the TAL Alarms window.
This will enable the Maximum Price box to the right.
13. Type the maximum value you want to display in the
Maximum Price box, or use the arrows. The window will
only display the equities that are equal to or lower than the
value you enter.
Page 86
Chapter 5: Gathering Market Data
14. Type the minimum value you want to display in the Min High
Count box, or use the arrows. It displays only the equities
that are equal to or higher than the value you enter.
15. Enter the minimum value you want to display in the Min Low
Count box, or use the arrows. It displays only the equities
that are equal to or lower than the value you enter.
16. Click the General Settings tab.
The General Settings tab appears.
Alarm Setup Dialog Box
17. Select the Newest Entry on Top check box to display the
values for the newest data on the first line on the top of the
TAL Alarms window. If you do not choose this option, the
system displays the newest data on the bottom of the window.
18. Select the One Entry Per Line check box to display the
values for each symbol on a separate line. If you do not
choose this option, the system displays two symbols per line.
19. Select the Verbose Mode check box to display the filter data
you choose from the Filter tab. It will display words like
“New High for,” or “New Low for,” before each entry. If you
do not choose this option, the system displays only the symbol
name and the color-coded price.
20. Click OK.
The system closes the Alarm Setup dialog box and displays
the TAL Alarms window.
Chapter 5: Gathering Market Data
Page 87
Add a Sound Alert to an Alarm
Use a sound alert to notify yourself when something occurs in the
market.
1.
Click Setup on the Alarms menu.
2.
Click the Sounds tab on the Alarm Setup dialog box.
The Sounds tab will appear.
Alarm Setup Dialog Box
3.
Click the Use Sound Alert check box.
4.
Click the ellipse button (…).
The Select Sound File dialog box will appear.
Select Sound File Dialog Box
5.
Select the .wav file.
6.
Click Open.
The .wav file path will appear in the field.
Page 88
Chapter 5: Gathering Market Data
7.
Click the Test button to test the sound of the alarm.
8.
Click OK.
The alarm is set.
TAL Alerts
Use TAL Alerts to create an alarm. You can access TAL Alerts
from the Alarms menu, Page menu, and from MarketMinder.
TAL Alerts Window
Open TAL Alerts
o
To open TAL Alerts, click Display Alerts on the Page menu.
The TAL Alerts window will open.
Create an Alert
1.
If you have a TAL Alarms window open, choose Display
Alerts on the Alarms menu. If you do not have a TAL
Alarms window open, choose Display Alerts on the Page
menu.
The TAL Alerts window will open.
2.
Click Configure.
The TAL Alerts Configuration dialog box will open.
Chapter 5: Gathering Market Data
Page 89
TAL Alerts Configuration Dialog Box
Note: See Chapter 4
for more information
concerning how to
load a symbol file.
3.
Type the symbol you want to monitor in the Symbols field or
load a SLF File.
4.
Click Add.
The symbol will add to the Symbols list.
5.
Select the Link Upper and Lower Ranges check box to link
the values in the Upper and Lower Range fields.
6.
Select the Upper Range check box to limit the value ranges to
their percentage points.
This will enable the Upper Range box to the right.
7.
Type the upper range value in the Upper Range box, or use
the arrows. The system notifies you when the symbol rises
within the percentage of the current value. For example, if
you enter 2 in the Upper Range box, the system will notify
you when the symbol reaches two points more than the current
value.
8.
Select the Lower Range check box to limit the value ranges to
their percentage points.
This will enable the Lower Range box to the right.
9.
Page 90
Type the lower range value in the Lower Range box, or use
the arrows. The system notifies you when the symbol falls
within the percentage of the current value. For example, if
you enter three in the Lower Range box, the system will
notify you when the symbol falls three points under the
current value.
Chapter 5: Gathering Market Data
10. Click Apply to Selected Symbols. The system applies the
ranges you entered in the Upper Range and Lower Range
fields, and lists the configuration in the Alerts for Selected
Symbol field.
11. Choose the value for the alert from the first drop-down list
available in the Alerts for Selected Symbol box. You can
place alerts on the Last Price, Net Change, Bid, Offer, High,
or Low values of a symbol. For example, if you want to
monitor a bid for a particular symbol, choose Bid.
12. Choose the action for the alert from the second drop-down list
available in the Alerts for Selected Symbol box. You can
place an alert when a value falls below, falls to, rises above, or
rises to a specific amount. For example, if you want to
monitor a symbol to see if it falls to a specific amount, choose
Falls To.
13. Type the amount that will start the alert in the numeric field
available in the Alerts for Selected Symbol box.
14. Click Add/Change.
The system lists the alert configuration in the Alerts for
Selected Symbol field.
15. Select the Sound check box to sound an alarm.
16. Choose the sound from the drop-down list available in the
Sound field.
Note: Test the sound by clicking Test Sound.
17. Select the Show all Alerts check box to display all the alerts
you configured on the TAL Alerts window.
18. Select the Show Acknowledged Alerts check box to display
only the alerts you turned off.
19. Click OK.
The system redisplays the TAL Alerts window.
20. Click Close.
The alert is set.
Chapter 5: Gathering Market Data
Page 91
Delete an Alert
1.
If you have a TAL Alarms window open, choose Display
Alerts on the Alarms menu. If you do not have a TAL
Alarms window open, choose Display Alerts on the Page
menu.
The system displays the TAL Alerts dialog box.
2.
Click the alert you want to delete from the list of alerts.
3.
Click Delete button.
4.
Click Close.
The system deletes the alert.
Turn Off a Beeping Alarm
When an alarm sounds, the system displays the TAL Alerts
window. If you do not see the TAL Alerts window, you can open
it.
1.
If you do not have a TAL Alarms window opened, choose
Display Alerts from the Page menu.
The TAL Alarms window opens.
2.
Click Display Alerts on the Alarms menu.
The TAL Alerts dialog box opens.
3.
Click the alert that contains a No in the Acknowledged field.
4.
Click Acknowledge.
The system stops the alarm.
5.
Click Close.
The window closes.
Drag and drop a symbol from Tal Alerts
Page 92
1.
Click a symbol in the TAL Alerts window.
2.
Drag and drop the symbol into a MarketMinder, MultiQuote,
News, MarketMaker, TurboOptions, Order Book, Chart, or
Enlist window.
Chapter 5: Gathering Market Data
TAL Alerts Drag & Drop
The symbol displays.
Corporate Actions
Use Corporate Actions to track stock activity, such as dividends,
stock splits, and initial public offerings. The Corporate Actions
window displays the symbol, the date of the action, and the
description of the action.
Corporate Actions Window
Chapter 5: Gathering Market Data
Page 93
Perform a Corporate Actions Search
1.
Click Corporate Actions on the Design menu.
The Corporate Actions Setup dialog box appears.
Note: There are three
different dates you can
choose: Today, All
available dates, or From
and to. The Today
option will search the
current day. The All
available dates option
will search from today
back through the
system’s memory, and
the From and to option
will search a specified
time period.
Corporate Actions Setup Dialog box
2.
Type a symbol in the Symbol field.
3.
Click a Type of Action you would like to search.
4.
In the Select Dates box on the Corporate Actions Setup
dialog box, click the button for the appropriate date criteria.
5.
If you select From and to, type the time period you would like
the system to search. Be sure to use the proper format
MM/DD/YYYY.
6.
Click Search.
The server will search for the action.
o
o
If the server does not contain a record of any actions matching
your search parameters, you will see the message, “No
matching records found. Ready.”
If your search found information, click Close to close the
Corporate Actions Setup dialog box and view the
information.
Fixed Page News
The Fixed Page News window offers news stories, such as the
most active stocks, gainers and losers, and the historical news
headlines from the News Server's database with the current story in
the story window.
The headline panel of a Fixed Page News window contains a
nested series of folder and paper icons with various news sources,
news subjects, and actual fixed-page news stories called a headline
tree. The structure and content of the headline tree is defined
according to the standard stories distributed by your news sources.
Page 94
Chapter 5: Gathering Market Data
Fixed Page News Window
View a Story
1.
Click Fixed Paged News on the RealTick Design menu.
The Fixed Paged News window appears.
2.
Open the folders in the headline tree by double-clicking until
you reach the lowest level.
Actual stories will be displayed with page icons instead of
folder icons.
3.
Double-click the story headline or the page icon.
The story will replace the headline tree in the window.
Search for a News Story
You cannot search the whole heading structure at one time. Before
searching, you must choose a news source in the headline tree.
The Find Headline command will then search the individual stories
available from this source.
Chapter 5: Gathering Market Data
1.
Choose the news source you wish to search (one of the second
level headings).
2.
Click Find Headline on the Fixed Page News menu.
Page 95
Find Page in $NEWS$ - fixed Dialog Box
3.
Type the search keyword in the Find Headline dialog box.
4.
Click Match Case if you would like the search to be casesensitive.
5.
Click Find.
Every headline containing the keyword will be displayed in
the headline tree.
6.
Click the Close button to close the Find Headline dialog box.
Copy News Data for Another Application
o
Click Copy Story on the News menu.
The story is copied to the clipboard.
Change the View of the Fixed Page News Window
Use these commands on the Fixed Page News menu to change the
Fixed Page News window display.
Page 96
Option
Description
Maximize Story Window
Enlarge a story
Split Window when the
Maximize Story Window is not
selected
Change the screen into a split
window
Go Back
View a previous story
Chapter 5: Gathering Market Data
Forex
The Forex command gathers and displays detailed information
about foreign exchange rates. You can choose the currencies to
track and the fields to display, such as Bid, Ask, and Symbol.
Forex Window
When a symbol is not available for the reverse exchange rate,
RealTick calculates the value and inserts the original symbol
preceded by a caret ("^").
Forex information is displayed in primary and secondary columns.
Each row represents one currency. Each primary column also
represents one currency.
Within each primary column are secondary columns, representing
different information fields (Ask, Bid, Close, High, Low, Open,
Settle, and/or Symbol). Each cell in the Forex table contains
exchange rate information corresponding to the currencies in the
row and primary column, for the information field in the secondary
column.
Create a Forex Window
1.
Click Forex on the RealTick Design menu.
The Currency Menu dialog box will appear.
Chapter 5: Gathering Market Data
Page 97
Currency Menu Dialog Box
2.
Accept or remove the currencies in the Selected Currencies
field.
3.
Click OK.
A Forex window with all available currencies will appear.
Each currency pair will display only one column, Last (the
most recent price).
4.
Click Setup Fields on the Forex menu.
The Setup Forex dialog box will appear.
Setup Forex Dialog Box
Page 98
5.
Choose the secondary columns.
6.
Click OK.
Chapter 5: Gathering Market Data
The Forex window appears with the currency rates.
Using Currencies
Convert a currency and monitor another currency you are using to
trade.
Add a Currency
1.
Click Setup Currencies on the Forex menu.
The system displays the Currency Menu dialog box.
Currency Menu Dialog Box
2.
Click the currency from the Available Currencies field you
want to add.
3.
Click the add (>) button.
The system moves the name of the currency to the Selected
Currencies field.
4.
Click OK.
The system updates the Forex window.
Move Around in Forex
The following table describes how to navigate a Forex window.
Chapter 5: Gathering Market Data
To
Then
Scroll through the
primary column
Move your mouse to the
right or left of a table
heading, depending the
Page 99
To
Then
Scroll through the
secondary column
Scroll through fields
direction you would like to
move, and click.
Click the appropriate side of
a secondary title until the
desired column position is
reached.
Hold down the CTRL key
and click the appropriate side
of the secondary column.
Indications
The Indications server handles a FIX-type message called
Indication of Interest. These messages enable institutions to notify
each other when they are considering placing a large order. Some
larger institutions may want to notify other institutions when they
are going to buy or sell a large quantity of stock before they place
the order. The Indications window requires special permissions
from the industry sending the message. Townsend Analytics, Ltd.
cannot give permissions for the Indications option without the
consent of participating industries.
The RealTick application contains an Indications Client window.
This window enables users to view and search for indication
messages sent to their institution.
IOI Client Window
Create an Indications Window
1.
Click Indications on the Design menu.
The system displays the IOI Setup dialog box.
Page 100
Chapter 5: Gathering Market Data
IOI Setup Dialog Box
2.
Enter the date for the indications in the Date field. You can
enter any past date.
3.
Check the Time option button.
The system activates the Time frame.
4.
Click either the Open option button or the Minutes Back
option button in the Begin Time field.
o
If you choose Open, the system displays all the information
from the opening of the specific date.
If you choose Minutes Back, the system activates the numeric
field to the right. You can enter when to start viewing data.
o
5.
Click either the Now option button or the hh:mm option
button in the End Time field.
o
If you choose Now, the system displays all the information to
the current time.
If you choose hh:mm, the system activates the numeric field
to the right. You can enter when to stop viewing data.
o
6.
To view expired IOI’s, check the Show expired IOI’s also
option button.
7.
To view buy or sell IOI’s, check the Only option button.
The system activates the drop-down list field to the left.
8.
Choose Buys or Sells from the drop-down list.
9.
To view by symbol, check the Symbol option button.
The system activates the text field to the right.
Chapter 5: Gathering Market Data
Page 101
10. Type the name of the symbol in the text field.
11. Click OK.
The system closes the dialog box and redisplays the IOI
Client window.
View Details of a Specific Indication
You can view the details of any indication listed on the IOI Client
window.
1.
Right-click an indication you want further details about in the
IOI Client window.
The Indications menu will appear.
2.
Click Details for IOI.
The system displays the dialog box with Indication of
Interest Details.
Changing the Display of Indications
Change the Color of Indications
1.
Click Setup on the Indications menu.
The system displays the IOI Setup dialog box.
2.
Click the Display Options tab.
The system displays the Display Options dialog box.
IOI Display Options Tab
3.
Page 102
Click Color Buys, Color Sells, or Color Expired to change
the color of the buy, sell, or expired information, respectively.
Chapter 5: Gathering Market Data
4.
Click the Select Color button.
A standard Windows Color dialog box appears.
5.
Select a color.
6.
Click OK.
The system returns to the Display Options dialog box.
7.
Click OK.
The system updates the IOI window.
Add Columns to the IOI Client Window
You can view additional information about each indication by
adding columns to the IOI Client window.
1.
Click Setup on the Indications menu.
The system displays the IOI Setup dialog box.
2.
Click the Columns tab.
The system displays the Columns tab.
IOI Setup Dialog Box
3.
Check the option buttons of each column you want to add to
the window.
4.
Click OK.
The system updates the IOI window.
Chapter 5: Gathering Market Data
Page 103
MarketMaker
The MarketMaker window displays each market maker’s bid and
ask price, either NASDAQ or regional (OTC). It sorts and colorcodes each price to indicate each price level according to their
placement in the inside market.
MarketMaker Window
The top panel contains a MultiQuote window showing
fundamental data on the stock being tracked. The middle panel is
a Range Bar showing the relative sizes of the bid/ask ranges. The
side panel contains the ticker, showing the trade prices for the
stock being tracked. The bottom panel displays an abbreviated
Order Entry window to allow quick and easy trading access.
Create a MarketMaker Window
Hint: To create a new
MarketMaker, drag
and drop a symbol into
the MarketMaker
window.
Page 104
1.
Click MarketMakers on the RealTick Design menu.
The system displays the MarketMakers/Regional Setup
dialog box.
Chapter 5: Gathering Market Data
Market Maker / Regional Setup Dialog Box
2.
Type a symbol in the Symbol field.
3.
Select Market Makers, Regional, or Auto-Detect.
Data Properties
Description
Market Makers
Receive data from all market
makers.
Regional
Receive regional bid/ask data
only.
Auto-Detect
Determines whether to choose a
MarketMaker display with
NASDAQ data or a display of the
regional exchanges, based on the
symbol you enter.
4.
Enter an exchange to monitor in the Monitor field. You can
highlight a specific broker in a MarketMaker window.
5.
If you want the width of the range bar according to the number
of participants, click the # Participants option button.
6.
If you want the width of the range bar according to the size of
the bid, click the Bid/Offer Size option button.
7.
Click the Show only tiers checkbox and enter the number of
tiers you want to view in the Show only tiers field.
8.
Click the Tier aggregation option button.
The system activates the Tier aggregation frame.
Chapter 5: Gathering Market Data
Page 105
9.
Change the aggregation size in the Decimal Quotes and
Fractional Quotes spin boxes.
10. Click the User Interface Settings tab.
The system displays the User Interface Settings tab.
MarketMaker / Regional Setup Dialog Box
11. Check the names of the columns you want on the
MarketMaker window in the Columns to Display field.
12. Check any additional settings you want to add from the
Miscellaneous Settings field.
Miscellaneous Settings
Note: When the
Show Orders in
Level 2 check box
is selected, your
live order will
appear in the
Level 2 panel as
Page 106
Description
Show Orders in Level 2
Display your live orders in the Level
2 panel as My Order.
Exclude Preferenced
Exclude all preferenced Market
Makers.
Inside Market Double-Click
Double-click inside the
MarketMaker window to access
OES.
Show Volume in Lots
Display the bid/ask sizes in lots.
Sort Tiers by Size
Sort bids and asks with the same
price by volume, with the largest
bids and asks at each price level at
the top.
Chapter 5: Gathering Market Data
Set Route from ECN ID
Double-click a quote in the Level 2
panel and the route will display in
the Route field.
Exclude Closed
Exclude closed quotes.
13. Choose the properties for the ticker from the Ticker
Properties field.
Ticker Properties
Description
New Line on Top
Display the latest tick on the top of
the Ticker as opposed to the bottom.
Buy/Sell Coloring
Use RealTick’s color-coding for the
prices.
Show Irregular Trades
View irregular trades.
14. Click OK.
The system displays your MarketMaker window.
Set an Alarm for Updates
You can have the MarketMakers window alert you when the quote
data changes for a stock.
o
Click the Alert on Updates option on the MarketMaker
menu.
The system displays a check mark next to the option. When
the quote data changes, the system will sound an alarm.
Configuring Quote Sources
You can include or exclude ECNs and Market Makers to focus on
who is influencing the price movement, or as part of your trading
preference.
View Data from a Single Source
Remove the ECN books to help reduce the amount of data you are
receiving.
1.
Click Quote Sources on the MarketMaker menu.
The system displays the Quote Sources to Display dialog
box.
Chapter 5: Gathering Market Data
Page 107
Quote Sources to Display Dialog Box
2.
Click the Show Selected Sources Only option button.
3.
Choose a source from the Quote Source list.
4.
Click OK.
The system updates the MarketMaker window.
View Data from all Sources
View all the markets.
1.
Click Quote Sources on the MarketMaker menu.
The system displays the Quote Sources to Display dialog
box.
2.
Click the Show All Quote Sources option button.
3.
Click OK.
The system updates the MarketMaker window.
View NASDAQ Stock Quotes from all Sources
1.
Click Quote Sources on the MarketMaker menu.
The system displays the Quote Sources to Display dialog
box.
2.
Click the Show All option button under the NASDAQ Stock
Quotes frame.
3.
Click OK.
The system updates the MarketMaker window.
Page 108
Chapter 5: Gathering Market Data
View NASDAQ Stock Quotes from ECNs only
Remove Nasdaq quote sources and view ECN data during pre and
post market.
1.
Click Quote Sources on the MarketMaker menu.
The system displays the Quote Sources to Display dialog
box.
2.
Click the ECNs Only option button under the NASDAQ
Stock Quotes frame.
3.
Click OK.
The system updates the MarketMaker window.
View NASDAQ Stock Quotes from all Sources
except ECNs
Exclude ECNs if you would like to view just the market
participants who are influencing the price movement.
1.
Click Quote Sources on the MarketMaker menu.
The system displays the Quote Sources to Display dialog
box.
2.
Click the Exclude ECNs option button under the NASDAQ
Stock Quotes frame.
3.
Click OK.
The system updates the MarketMaker window.
View Data from a Single Exchange
1.
Click Quote Sources on the MarketMaker menu.
The system displays the Quote Sources to Display dialog
box.
2.
Click the Select Exchanges button.
The system displays the Select Regional Exchanges dialog
box.
Chapter 5: Gathering Market Data
Page 109
Select Regional Exchanges Dialog Box
3.
Click the Show Selected Exchange Data Only option button.
4.
Click the name of the exchange from the Exchange list.
5.
Click the OK button.
The system redisplays the Quote Sources to Display dialog
box.
6.
Click OK.
The system updates the MarketMaker window.
View Data from all Exchanges
1.
Click Quote Sources from the MarketMaker menu.
The system displays the Quote Sources to Display dialog
box.
2.
Click the Select Exchanges button.
The system displays the Select Regional Exchanges dialog
box.
3.
Click the Show Composite Data option button.
4.
Click the OK button.
The system redisplays the Quote Sources to Display dialog
box.
5.
Click OK.
The system updates the MarketMaker window.
Include/Exclude a Market Maker
1.
Click Quote Sources on the MarketMaker menu.
The Quote Sources to Display box will appear.
Page 110
Chapter 5: Gathering Market Data
2.
Click Custom.
The Select button will activate.
3.
Click Select.
The Include/Exclude MarketMakers dialog box will appear.
Include/Exclude Market Makers Dialog Box
4.
To include only certain Market Makers, click Include only
these Market Makers.
5.
To exclude certain Market Makers, click Exclude these
Market Makers.
6.
Type the Market Makers you want to include or exclude in the
Market Makers to Include/Exclude box.
7.
Click Add.
8.
Click OK.
The system includes or excludes the Market Makers.
Changing the Display of a MarketMaker
Adding and Removing Panels
Add or remove different panels to include or exclude market
information. Just click any of the following options on the
MarketMaker menu to include or exclude the information
described in the table below.
Option
MultiQuote
Chapter 5: Gathering Market Data
Description
Add or remove the MultiQuote
panel where you can enter a new
symbol.
Page 111
Option
Range Bar
Market Montage
Order Entry
Screen
Ticker
Description
Add or remove the Range Bar,
which displays the sizes of the
Bid/Ask ranges.
Add or remove the Market Montage,
which displays the total bids, asks,
and sizes of the trades.
Add or remove the Order Entry
panel where you can place a trade.
Add or remove the Ticker panel,
which shows the price/sizes
associated with the symbol you have
chosen.
Change the Color for ECNs
1.
Click Display Options on the MarketMaker menu.
The system displays the Display Options dialog box.
Display Options Dialog Box
2.
Click the Use Separate Color option button available in the
ECN Options frame.
This will enable the Set ECN Color button.
3.
Click the Set ECN Color button in the Miscellaneous Colors
frame.
The system displays the standard Windows Color dialog box.
Page 112
Chapter 5: Gathering Market Data
4.
Click the color.
5.
Click OK.
The system closes the Color dialog box. You can view the
new color of the ECNs in the Sample frame in the Display
Options dialog box. The system only changes the color of the
text, not the row.
6.
Click OK.
The system updates the MarketMaker window.
Add a Price Tier
Add a price tier to view the depth of the market.
1.
Click Display Options on the MarketMaker menu.
The system displays the Display Options dialog box.
2.
Click the Add New Tier button available in the Price Tier
Colors frame.
The system adds the name of the new tier in the Price Tier
Colors frame. The system also displays the standard
Windows Color dialog box.
3.
Click a color.
4.
Click the OK button.
The system closes the Color dialog box. You can view the
new tier in the Sample frame in the Display Options dialog
box.
5.
Click OK.
The system updates the MarketMaker window.
Delete a Price Tier
1.
Click Display Options on the MarketMaker menu.
The system displays the Display Options dialog box.
Chapter 5: Gathering Market Data
2.
Choose the tier you want to delete from the drop-down list
available in the Price Tier Colors field.
3.
Click the Delete Current Tier button available in the Price
Tier Colors frame.
Page 113
The system removes the name of the tier from the Price Tier
Colors frame. The system also removes the name of the tier
from the Sample frame.
4.
Click OK.
The system updates the MarketMaker window.
Change the Color of a Price Tier
1.
Click Display Options on the MarketMaker menu.
The system displays the Display Options dialog box.
2.
Choose the tier you want to change from the drop-down list
available in the Price Tier Colors field.
3.
Click the Set Tier Color button.
The system displays the standard Windows Color dialog box.
4.
Click the color.
5.
Click the OK button.
The system closes the Color dialog box. You can view the
new color of the tier in the Sample frame in the Display
Options dialog box.
6.
Click OK.
The system updates the MarketMaker window.
MarketMinder
Note: See chapter 7 for
information concerning
OrderMinder,
BasketMinder, and
trading with
MarketMinder. See
chapter 8 for
information concerning
PositionMinder.
Page 114
There are several different types of MarketMinders:
StandardMinder, PositionMinder, OrderMinder, BasketMinder,
and ChainMinder. See chapter 7 for more information concerning
a BasketMinder and chapter 8 for more information concerning a
PositionMinder.
The StandardMinder displays any symbol's numeric or price data
in a table. You can choose to display many different data fields,
including Last Price, Dir. Last, Net Change, and Total Volume.
The OrderMinder displays your live, completed, canceled or
deleted, and completed managed orders for the current trading day.
You can also sell from the MarketMinder. For more information
concerning MarketMinder and trading, please see chapter 7.
The ChainMinder displays symbol lists.
Chapter 5: Gathering Market Data
StandardMinder Window
Create a Standard MarketMinder
1.
Click MarketMinder on the RealTick Design menu.
The system displays the Minder Setup dialog box.
Hint: You can also
load symbols or
search for symbols.
See chapter 4 for
information
concerning loading
and searching for
symbols.
Minder Setup Dialog Box
2.
Type the symbol or symbols you want to monitor in the
Selected Symbols field.
3.
Click Add.
The system adds the symbol(s) to the Selected Symbols list.
Chapter 5: Gathering Market Data
Page 115
4.
Click OK to enter your symbols into the MarketMinder
quote window.
The StandardMinder window appears.
Create a ChainMinder
Use a ChainMinder to create other RealTick windows.
1.
Note: A root is a
currency, commodity,
or stock that is
common to a range of
related derivatives
symbols.
Click MarketMinder on the Design menu.
The Minder Setup dialog box appears.
2.
Select the chain type from the Chain Type drop-down list.
3.
Type the root in the Root field.
4.
Select the session in the Session drop-down list.
5.
Click OK.
The ChainMinder window appears with a symbol chain.
Note: Click the favorite Market Statistics under MarketMinder
on the Favorites menu to quickly display a ChainMinder.
Add a Symbol to an Existing MarketMinder
You can add more symbols to a StandardMinder or a
PositionMinder.
1.
Double-click a field in the Symbol column.
The field will activate.
2.
Type the symbol.
3.
Press Enter.
The symbol is added to the Minder.
Quickly create a BasketMinder from your Positions
1.
Right-click a BasketMinder.
The Minder function menu appears.
Page 116
Chapter 5: Gathering Market Data
Minder Function Menu
2.
Select Generate Basket from Positions.
Your positions appear in the BasketMinder.
Using MarketMinder
Convert Currency
Trade securities in a foreign currency.
Note: If you don’t have
the convert currency
option, but would like to,
contact your RealTick
Vendor.
1.
Click Set Default Currency on the MarketMinder window.
The Select Currency dialog box will open.
2.
Select a currency from the Currency drop-down list.
3.
Click OK.
4.
Click Column Layout on the MarketMinder menu.
The Column Layout dialog box will appear.
5.
Select a price column in the Column list box.
The Convert Currency check box will activate.
6.
Click Convert Currency.
7.
Click OK.
The system converts the currency.
Chapter 5: Gathering Market Data
Page 117
Access the Alerts and Alarms
Configure your alerts directly from the MarketMinder. Right-click
a symbol to add it to your alert list or set a global alert for all the
symbols in your watch list.
1.
Right-click a symbol in the symbol column.
A pop-up menu will appear.
2.
Click Show Alerts from the Alerts menu option.
The TAL Alerts window will appear.
Alerts Menu in MarketMinder
o
o
o
Add Symbol MSFT will add your symbol in the TAL Alerts
Configuration dialog box
Add All Symbols will add all the symbols to the TAL Alerts
Configuration dialog box.
Delete All Symbols will delete all the symbols from the TAL
Alerts Configuration dialog box.
Group Symbols
Separate symbols on a page by entering customer’s names and
inserting blank rows. As a result, you’ll be able to display multiple
customer’s information neatly on one window.
1.
Click Setup on the MarketMinder menu.
The MarketMinder Setup dialog box will open.
2.
Page 118
Type a customer’s name in the Selected Symbols field. For
example, type John Doe.
Chapter 5: Gathering Market Data
3.
Click Add.
The name will appear in the Selected Symbols list.
4.
Type the symbol you want in the Selected Symbols field.
5.
Click Add.
The symbol will appear in the Selected Symbols list.
6.
Enter a single space in the Selected Symbols field and press
the Enter key.
7.
You can continue entering more customer names and spaces.
When ready, click OK.
The system will display the MarketMinder window.
Multiple Selections in a MarketMinder
You can delete several symbols at one time.
1.
Click Display Options on the MarketMinder menu.
The Display Options dialog box will appear.
2.
Click the Allow Multiple Selection check box.
3.
Click OK.
4.
Left-click a row and drag the mouse until all the symbol rows
are selected.
5.
Click Delete.
The symbols are deleted.
Changing the Display of MarketMinder
Change the Column Layout
1.
Click Load Column Layout on the MarketMinder menu.
A standard Windows Open Layout dialog box will appear
listing the available layouts.
Chapter 5: Gathering Market Data
Page 119
Open Layout Dialog Box
2.
Click a layout.
3.
Click Open.
Your MarketMinder window will display the new layout.
Configure Column Layout
Create a column layout.
1.
Note: Please
contact Technical
Support to find out
more information
concerning the
Column Layout
Choices (FID –
Field Identification
Code).
Click Configure Column Layout on the Column Layout
Choices submenu of the MarketMinder menu.
The Column Layout dialog box appears.
2.
Click the More >> button.
The dialog box expands.
Column Layout Dialog Box
3.
Page 120
Add columns from the Available Fields and/or delete
columns from the Selected Fields using the <<Add and
Delete>> buttons.
Chapter 5: Gathering Market Data
4.
Click OK.
The system configures the column layout.
Save a Column Layout
Create a layout in the MarketMinder and save it.
1.
After you have made the changes to your MarketMinder
columns, choose Save Column Layout As on the
MarketMinder menu.
The Save Layout dialog box will appear.
2.
Give your column layout a name and attach a “.bvw”
extension. For example, save Order History as
OrderHistory.bvw for the column layout name.
3.
Click Save.
You can now load your custom column layout.
Custom Sort a MarketMinder
Sort the data in a MarketMinder.
1.
Right-click Symbol on the Minder window and select
Custom Sort.
The Custom Sort dialog box will appear.
Custom Sort Dialog Box
Chapter 5: Gathering Market Data
2.
Add the columns you would like to sort to the Selected field
list using the > button.
3.
Click the Ascending option button if you’d like to sort the data
from high to low.
4.
Click the Descending option button if you’d like to sort the
data from low to high.
5.
Click the Put Zeros at Bottom check box if you’d like to put
zeros at the bottom of the column regardless if you sort the
column ascending or descending.
Page 121
6.
Click the Absolute Values check box if you want to ignore
the sign of the values being sorted.
7.
Click OK.
The Minder will sort.
Additional Settings to Custom Sort your Minder
1.
Right-click a column title on the Minder window.
2.
Select Hide Column to hide the column.
3.
Select Comma Seperated 1000s to display the commas.
4.
Select Color Code to add the up-tick and down-tick colors.
Change the Window Font for MarketMinder
1.
Click Display Options on the MarketMinder menu.
The system displays the Display Options dialog box.
Display Options Dialog Box
2.
Choose a font from the drop-down list available in the Font
field.
3.
Choose a font style from the drop-down list available in the
Font Style field. For example, you can choose bold or italic.
4.
Choose a size from the drop-down list available in the Size
field.
5.
Click the Set Text Color button to change the color.
The system displays a standard Windows Color dialog box.
6.
Page 122
Select the color and click OK.
Chapter 5: Gathering Market Data
The standard Windows Color dialog box will close.
7.
Click OK on the Display Options dialog box.
The system updates the MarketMinder window.
Change the Table Display
You can change the grid lines, the borders, the colors, and the
highlight feature in the MarketMinder window.
1.
Click Display Options on the MarketMinder menu.
The system displays the Display Options dialog box.
2.
Click More>> to expand the Display Options dialog box.
Display Options Dialog Box
3.
Uncheck the Show Grid Lines option button to hide the grid
line(s).
The default option is to show the grid line(s).
4.
Uncheck the Show Borders option button to hide the border
lines for the name of the columns and rows.
The default option is to show the borders.
5.
Uncheck the Highlight Selection option button to not
highlight a line you click.
The default option is to highlight the line.
6.
Uncheck the Highlight Updated Cells option button to not
highlight data that has been updated.
The default option is to highlight updated information.
7.
Click More.
The system expands the Display Options dialog box.
Chapter 5: Gathering Market Data
Page 123
8.
If you want to change the colors in the table, uncheck the
Auto Select option button.
The system activates the Grid Color, Border Color,
Selection Color, and Update Color buttons.
9.
If you want to change any of the colors, click one of the Color
buttons.
The system displays a standard Windows Color dialog box.
10. Click the color, and click OK.
11. To change the highlighting feature, choose the feature from
the drop-down list available in the Update Highlight Type
field.
12. Click OK.
The system updates the MarketMinder window.
MultiQuote
The MultiQuote window is a versatile quote window for one or
more instruments or a single trading account. Different layouts for
the MultiQuote offer a wide range of sets of information, including
fundamental data, price data, and account (margin) information.
The layout of the MultiQuote window determines what
information is included in the display. Fundamental layouts
include information such as profit/earnings ratio, Standard &
Poor’s rank, revenue, and earnings per share. Simpler quote
layouts include price information like the 52-week high and low,
volume, earnings, and bid and ask prices. You can choose among
many different layouts.
Page 124
Chapter 5: Gathering Market Data
MultiQuote Window
Create a new MultiQuote
1.
Click MultiQuote on the Design menu.
The Open dialog box will appear.
Hint: Drag and drop a
new symbol in
MultiQuote to replace a
symbol.
Open Dialog Box
2.
Select the MultiQuote layout you would like to open.
3.
Click Open.
The MultiQuote window will appear.
Open a MultiQuote Window Layout
1.
Chapter 5: Gathering Market Data
Click Open Layout on the MultiQuote menu.
Page 125
The system displays the Windows standard Open dialog box.
2.
Double-click the column layout file.
3.
Click Open.
The system opens the layout.
News
With the News window, you can include news headlines and
stories in your RealTick window. You can follow market
movements as well as a wide variety of press releases and
announcements that may affect prices.
Note: You can
view headline
stories as they
reach the market.
News Window
News Headlines
The headline panel of a news window contains a scrolling list of
news headlines. The title bar of the headline window shows the
number of headlines displayed in the window and the search
criteria used to choose them.
News Stories
Most headlines refer to a news story or a statistical report.
Page 126
Chapter 5: Gathering Market Data
View News Stories
1.
Click News on the RealTick Design menu.
The Quick Search Criteria dialog box will open.
Hint: You can
enter multiple
Source criteria.
Type in the sources
directly, separated
by commas.
Quick Search Criteria Dialog Box
2.
Enter the desired selection criteria, or accept the defaults to
return all news stories for the current day.
3.
Click OK.
The News window opens.
Open a Story
o
Double-click the headline in the upper panel of the News
window.
Search for stories about a symbol
o
Drag the symbol from another RealTick window, or from the
symbol search window, and drop the symbol onto the News
toolbar button.
The News window will appear.
Search by Keyword
1.
Click Find Headline on the News menu.
The Find dialog box will appear.
Find Dialog Box
2.
Chapter 5: Gathering Market Data
Type the keyword into the Find What field (for example,
Mexico).
Page 127
3.
Click Up in the Direction section to search from the bottom
up.
4.
Click Down in the Direction section from the top down.
5.
Click OK.
The system will search.
Changing the Display of News
Add columns to the News Window
1.
Click Configure on the News menu.
The Configure dialog box will open.
Configure Dialog Box
2.
Click the check boxes in the Headline Display frame of the
columns you want to add.
3.
Click OK.
The system closes the Configure dialog box and redisplays
the News window.
Navigate News
Use the following options on the News menu to navigate through
news stories.
Page 128
Option
Description
Auto Request Stories
Automatically display new
stories in the second panel of
the News window.
Chapter 5: Gathering Market Data
Option
Description
Newest at Top
Add the newest stories to the
top of the News window.
Double-click a page number in an
open news story. Confirm the
source and page number in the Go
To dialog box.
Jump to a story.
View Last Story
View the last story.
Page Down
View the next story.
Page Up
View the previous story.
Copying News
Use the following options to copy news to other applications.
Option
Description
Copy Headlines
Copy headlines from the
headline window to the
clipboard.
Copy Story
Copy a story to the clipboard
Set an Alarm for News
o
Click Alarm on the News menu to sound an alarm when a
news story is sent to the News screen.
Printing News
Print Stories Automatically
1.
Click Automatically Print Stories on the News menu.
2.
Double-click the headline of the story you would like to print.
The story will print.
Configure and Print a Story Group
1.
Click Setup Print Schedule on the News menu.
The Scheduled Story Configuration dialog box appears.
Chapter 5: Gathering Market Data
Page 129
Hint: To delete a Story
Group, click the group you
would like to delete. Click
Remove. The group is
deleted.
To delete a story in a group,
click the Group that contains
the story you would like to
delete. Click the Story in the
Selected field. Click Remove.
The story is deleted.
Scheduled Story Configuration Dialog Box
2.
Click New to add Group 2 or to create a new group. Group 1
is already available by default.
The new group number will appear in the Story Groups field.
3.
Type the source code of the story in the Source field.
4.
Type the page number of the story in the Page field.
5.
Click Add.
The Source Code and Page number will appear in the
Selected field.
6.
Repeat steps 3, 4, and 5 for every story you would like to add
to the group.
7.
Click Move Up or Move Down to organize the order of the
stories.
8.
Click Page Break After Each Story if you’d like each story
to print on it’s own page.
9.
Type the hours and minutes in the Start Printing at field of
when you would like to print the group.
Note: RealTick must be running at this time in order for these
stories to print.
10. Click OK.
The system saves the group configuration and schedules the
printing.
Page 130
Chapter 5: Gathering Market Data
Configure and Send a Story Group to a File
Note: RealTick must be running at this time in order for these
stories to be sent to the file.
1.
Click Setup Print Schedule on the News menu.
The Scheduled Story Configuration dialog box appears.
2.
Click New to add Group 2 or to create a new group. Group 1
is already available by default.
The new group number will appear in the Story Groups field.
3.
Type the source code of the story in the Source field.
4.
Type the page number of the story in the Page field.
5.
Click Add.
The Source Code and Page number will appear in the
Selected field.
6.
Repeat steps 3, 4, and 5 for every story you would like to add
to the group.
7.
Click Move Up or Move Down to organize the order of the
stories.
8.
Click Print to File to send the Group to a file instead of to
the printer.
The Print to File field will enable.
9.
Type the file path in the Print to File field.
10. Type the hours and minutes in the Start Printing at field of
when you would like the stories sent to the file.
11. Click OK.
The system saves the group configuration and schedules to
send it to the file.
Add a Story to the Scheduled Print Jobs
1.
Double-click the headline text to request the story.
2.
Click Add Story to Print Scheduler on the News menu.
The system will print the story during the time you set in the
print configuration.
Chapter 5: Gathering Market Data
Page 131
News Alert
News Alerts are provided in a separately permissioned window in
RealTick that pop up when news stories arrive from the News
Server. The News Alerts window is independent of the RealTick
page. Enter the keywords, symbols, or categories you would like
to search in the News Alerts Configure window. Headlines will
appear as soon as they are received. You may also set the type of
headline information, fonts, sound, and a special time out feature.
News Alert Window
Create a News Alert
1.
Click Show News Alerts on the RealTick Design menu.
2.
Click Configure and enter the desired search parameters in
the Criteria section.
The system displays the Configure News Alerts dialog box.
Hint: You can load a
symbol file. See Chapter
4 for information
concerning loading a
symbol file.
Configure News Alerts Dialog Box
3.
Page 132
Enter keywords, categories, or the symbol in the text fields in
the Keywords, Categories, and Symbols frame.
Chapter 5: Gathering Market Data
4.
Click Add.
5.
Click OK.
The system displays the news alert.
Close a News Alert
Click the Hide button (all headlines currently in the window
will remain, no Configure settings will be changed.)
o Double-click the control box (all headings currently in the
window and all Configure settings will be cleared.)
Note: When you use the Windows control box to close a News
Alerts window, you will clear out all the keywords you have
previously entered, or any other changes you made in the
Configure dialog box. The next time you want to set an alert, you
will have to re-enter keywords and change any other settings that
you wish to customize. In contrast, the Hide button instructs
RealTick to keep collecting News headlines, adding them to the
ones already in the News Alerts window.
o
Stocks
The Stocks window is a composite window containing other
RealTick windows. Its purpose is to provide a simple, easy
configurable layout for viewing RealTick windows. It is possible
to view your windows in any order by clicking the appropriate tab
in the window display area. Stocks windows are frequently part of
fixed-page installations of RealTick. If you are using a fixed-page
installation, you may have limited capabilities.
Chapter 5: Gathering Market Data
Page 133
Hint: Right-click a
window in Stocks to
access its function
MultiQuote Window
View Stocks
1.
Click Stocks on the Design menu.
The system displays the Stocks Setup dialog box.
Stocks Setup Dialog Box
2.
Type the symbol in the Symbol field.
3.
Click the Vertical Tabs check box if you would like the tabs
to display vertically as opposed to horizontally.
4.
Click the Load File button if you would like to open a
preconfigured tab layout.
5.
Click the Select Account button to select an account.
6.
Click OK.
The system closes the dialog box and displays the Stocks
window.
Page 134
Chapter 5: Gathering Market Data
Change the Tab Font in a Stocks Window
1.
Click Select Tab Font on the Stocks menu.
The Font dialog box will appear.
2.
Select a type of font.
3.
Click OK.
The tabs in the Stocks window display the new tab font.
Table
The Table window displays its data numerically, in rows and
columns, versus in a graph, like Charts. However, just like Charts,
Tables can display its data for a specific time period, such as
Intraday, Daily, Weekly, or Monthly. Volume, open interest, and
exchange information can also be displayed, along with technical
studies.
Chart and Table Windows
Tables contain the same data as Charts. However, it’s in numeric
format.
Hint: You can also
create a table by
dragging a symbol
from the Symbol
Guide or another
RealTick window
and dropping it on
the Table toolbar
button. The system
will create a new
table with the
symbol.
Chapter 5: Gathering Market Data
Users choose to use Tables to follow a certain symbols trend in the
market and to study that trend with a particular technical study.
However, Technical Analysis is used mostly in Charts.
Create a Table
There are several different types of Tables you can create. Tables
can display data daily, weekly, and monthly. These type of charts
will give you price information for the duration of a particular time
period and at a specific time during that time period.
1.
Click Table on the RealTick Design menu.
The Table Setup dialog box will appear.
Page 135
Hint: Click the
More>> button. The
system expands the
Table Setup dialog box
and displays the
Symbol File field.
Table Setup Dialog Box
2.
Type the symbol in the Symbols field and click the Add
button.
3.
Choose the type of table from the drop-down list available in
the Data Period field.
4.
Enter a time frame for the information in the table. Enter the
end date in the Date field, and enter the beginning date in the
Days, Weeks, or Months field. The system searches for data
within the time frame.
5.
If you create an Intraday table, enter the minute time interval
for the table in the Intraday Bar Interval field.
The system updates the information at each interval.
6.
Choose the time frame for your table.
o
For a table that contains data starting from the market’s open,
check the Start Bars at Open field.
For a table that excludes any data before a specific time, check
the Exclude data before field. The system enables the time
field to the right. Enter the beginning time for your table.
For a table that excludes any data after a specific time, check
the Exclude data after field. The time field to the right
activates. Enter the end time for the table.
For a table that displays data during pre and post market
hours, click Show Irregular Trades.
o
o
o
7.
Page 136
Enter a title for the table in the Chart Title field.
Chapter 5: Gathering Market Data
8.
Click the Show Volume option button to display the volume
values on your table.
Note: The following steps are available for the tables Trades, Time
& Sales, and Trades & Quotes.
9.
Click the Show Exchange option button to display the
exchanges on your table.
10. Click the Exch Contributor option button to display the
exchange contributions on your table. This field is available
only if you choose to show the exchange. When you choose
the Exch Contributor option, the table will not display the
exchange handler’s name.
11. Click OK.
The system displays your table in the Table window.
Add a Symbol
1.
Click Add/Replace Symbol on the Table menu.
The New Symbol dialog box will appear.
2.
Type a symbol in the New Symbol field.
3.
Click the Add option button.
4.
Click OK.
The symbol is added to the Table.
Change the Type of Table
Absolute: This style displays the price series.
Percent Change: This calculation shows the change over time for
the value of each symbol. The value of each symbol when it first
appears in the chart is the reference value. The remainder for each
symbol is a percentage of the reference value.
Hint: Use Ratio and
Differential to compare two
symbols. If you only have
one symbol in your table,
see Add a Symbol.
Ratio: This calculation displays the value of one or more symbols
relative to the value of another. You must choose the symbol the
other symbols will be measured against.
Differential: This calculation displays the difference between the
values of two or more symbols. You must choose the symbol the
others will be measured against
1.
Chapter 5: Gathering Market Data
Click Style on the Table menu.
Page 137
The Chart Type dialog box will appear.
Chart Type Dialog Box
2.
Select the calculation type.
3.
If you choose either Ratio or Differential, choose a symbol
from the drop-down list available in the Reference Symbol
drop-down list.
4.
Also, choose a column from the drop-down list available in
the Reference Column field.
5.
Click OK.
The system changes the price display.
Using Tables
Calculate Volume Weighted Average Price
This option is only available for certain charts, for example, Time
& Sales, Trades & Quotes, or Daily.
1.
Click Calculate VWAP on the Table menu.
The system displays the Calculate VWAP dialog box.
Calculate VWAP Dialog Box
Page 138
Chapter 5: Gathering Market Data
2.
Type the start date in the Start Date field.
3.
Type the start time in the Start Time field.
4.
Type the stop date in the Stop Date field.
5.
Type the stop time you want as the end time for the
calculation in the Stop Time field.
6.
Click the Calculate button.
The system displays the average in the Volume Weighted
Avg. Price field.
7.
Click Close.
Transferring Data to other Applications
Hint: To move vertically
and horizontally in a table,
use the up and down arrow
keys and the left and right
arrow keys on your
keyboard.
You can copy RealTick tables and paste them into Windows
applications like Microsoft Excel. The values below were copied
from a RealTick table into a Microsoft Word document.
11/22/9313:00
51 7/8
52
51 3/4
51 3/4
22400
11/22/9313:15
51 7/8
52 1/8
51 3/4
52
45800
11/22/9313:30
52 1/8
52 1/4
52
52 1/4
68700
11/22/9313:45
52 1/4
52 3/8
52 1/8
52 1/4
61300
11/22/9314:00
52 1/8
52 3/8
52 1/8
52 1/4
44400
11/22/9314:15
52 1/4
52 3/8
51 7/8
52
85500
11/22/9314:30
52 1/8
52 1/8
51 7/8
52
28900
11/22/9314:45
52
52 1/8
51 7/8
52 1/8
24700
11/22/9315:00
52 1/8
52 1/8
52
52 1/8
41700
8.
Click the Table window in RealTick, then press Ctrl + Insert
on your keyboard.
The system copies the data.
9.
Open the Windows application and move your mouse where
you want to insert the data.
10. Click Paste on the Edit menu of the Windows application or
press Ctrl + V.
The system pastes the data.
Chapter 5: Gathering Market Data
Page 139
Changing the Display of Tables
Change the Display of a Table
1.
Click Display on the Table menu.
The system displays the Table Display Options dialog box.
Table Display Options Dialog box
2.
If the table includes multiple symbols, choose the appropriate
symbol from the drop-down list available in the Symbol
Settings box.
3.
To add a column to your table, double-click the column name
in the Columns to Display list.
A check mark appears.
4.
To change the color of the column name, click the column
name in the Columns to Display list, and then click the Color
arrow buttons (< or >).
5.
To change the color of the font on the window or when you
print your table, click the Advanced Colors button.
The system displays the Color Setup dialog box.
6.
Enter any changes and click the OK button. For more
information, see the Change Colors section.
7.
To change the font display of the Table window, click the
Screen Font button.
The system displays the Font dialog box.
8.
Page 140
Enter any changes and click the OK button.
Chapter 5: Gathering Market Data
9.
To change the font of the Table window when you print the
window, click the Printer Font button.
The system displays the Font dialog box.
10. Enter any changes and click the OK button.
11. Click OK.
The system updates the Table window.
Change a Column in a Table
1.
Move your mouse to any of the column label names in the
Table window.
2.
Click the right mouse button.
The system displays the Column Settings option.
3.
Click the Column Settings option.
The system displays the Set Column Attributes dialog box.
Set Column Attributes Dialog Box
4.
Choose the column you want to change from the drop-down
list available in the Column field.
5.
Change the name of the column for the first row in the Name1
field.
6.
Change the name of the column for the second row in the
Name2 field.
7.
Enter the width of the field in the Field Width field.
8.
Choose the alignment for the column by clicking the Left,
Center, or Right option buttons.
9.
Click the Show Zeros field if you want to have zeros placed
in numeric fields with no data.
10. Click the Display in Table View if you would like the field to
display in the table view of the charts.
Chapter 5: Gathering Market Data
Page 141
11. Click OK.
The system updates the Table window.
Ticker
Ticker displays real-time price and volume information.
Cascade Display
In Cascade tickers, the quotes appear vertically, top to bottom.
You can choose to display the newest price at the top or the
bottom. In Jet tickers, the quotes scroll horizontally, and the
newest quotes appear on the right
Jet Display
Display a Ticker
1.
Click Ticker on the Design menu.
The Setup Ticker dialog box will appear.
Setup Ticker Dialog Box
Page 142
Chapter 5: Gathering Market Data
Hint: From another
RealTick window or
from the Symbol
Guide, move the
mouse over the symbol
you want to add to the
ticker. Hold the
CTRL key and the left
mouse button. Move
the mouse to the
Ticker window.
Release the Ctrl key
and mouse button
simultaneously. The
symbol is added to the
window.
2.
Click the Symbol Criteria, Symbol List, or Symbol File
option button and select or add symbols.
3.
Choose the types of trades and quotes you want to view. You
can check the Show Trades, Show Irregular Trades, and/or
Show Best Bid/Ask check boxes.
4.
If you have selected Symbol List or Symbol File, choose the
Level II data you want to see. You can check the Show Level
2 Quotes, Inside Market Only, and/or Exclude Size
Changes fields.
5.
If you want, modify the volume of shares to be displayed in
the Trade Volume area of the window. Enter the minimum
volume you want to view in the Minimum Volume field. Or,
you can check the Show Volume in 100’s to view volumes
that are 100 or more.
6.
In the display area of the window, choose Jet (horizontal
flow) or Cascade (vertical flow). If you choose Cascade,
consider choosing Newest on Top.
7.
Click OK.
The system displays the Ticker window.
Configuring a Quote Source
View Data from a Specific Exchange
1.
Click Exchanges on the Ticker menu.
The system displays the Select Regional Exchanges dialog
box.
Select Regional Exchanges Dialog Box
Chapter 5: Gathering Market Data
2.
Click the Show Selected Exchanges Data option button.
3.
The system activates the list field.
Page 143
4.
Click the exchanges from which you would like to see data
displayed. Hold down the CTRL key to choose more than
one exchange.
5.
Click OK.
The system closes the dialog box and redisplays the Ticker
window.
View Composite Data
1.
Click Exchanges on the Ticker menu.
The system displays the Select Regional Exchanges dialog
box.
2.
Click the Show Composite Data option button.
3.
Click OK.
The system closes the dialog box and redisplays the Ticker
window.
View Data from a Specific Market Maker
1.
Click Setup on the Ticker menu.
The Setup Ticker dialog box will appear.
2.
Click Show Level 2 Quotes in the Level 2 Data box.
The Exclude Size Changes check box will activate.
3.
Click Exclude Size Changes.
4.
Click OK.
5.
Click NASDAQ Quote Sources on the Ticker menu.
The Quote Sources to Display dialog box will appear.
Quote Sources to Display Dialog Box
Page 144
Chapter 5: Gathering Market Data
6.
Click the Custom option button in the NASDAQ Stock
Quotes box.
The Select button will activate.
7.
Click Select.
The Include/Exclude Market Makers dialog box will
appear.
Include/Exclude Market Makers Dialog Box
8.
Type a Market Maker(s) in the field.
9.
Click Add.
10. Click the Include only these Market Makers option button.
11. Click OK.
The system closes and redisplays the Ticker window.
Remove Data from a Specific Market Maker
1.
Click NASDAQ Quote Sources on the Ticker menu.
The Quote Sources to Display dialog box will appear.
2.
Click Custom in the NASDAQ Stock Quotes box.
The Select button will activate.
3.
Click Select.
The Include/Exclude Market Makers dialog box will
appear.
4.
Click Exclude these Market Makers.
5.
Click OK.
The system closes the dialog box and redisplays the Ticker
window.
Chapter 5: Gathering Market Data
Page 145
View a Ticker from a Single Source
1.
Click NASDAQ Quote Sources on the Ticker menu.
The Quote Sources to Display dialog box will appear.
2.
Click Show Selected Sources Only.
The Quote Sources List activates.
3.
Select the NASDAQ Quote Sources. Press CTRL and click
a Quote Source to select multiple quote sources.
4.
Click the Show All, ECNs Only, or Exclude ECNs option
button. If you choose Show All, the system displays the data
from both ECN and Exchanges. If you choose ECNs Only,
the system displays the data from ECNs only. If you choose
Exclude ECNs, the system displays the data from exchanges
only.
5.
Choose an exchange for regional quote sources.
6.
Click the Select Exchanges button.
The system displays the Select Regional Exchanges dialog
box.
7.
Choose either Show Composite Data for all exchanges, or
Show Selected Exchange Data Only for specific exchanges.
8.
Click the OK button when finished.
9.
Click the OK button on the Quote Sources to Display dialog
box.
The system closes the dialog box and redisplays the Ticker
window.
Changing the Display of a Ticker
Change the Window Color of a Ticker
1.
Click Colors on the Ticker menu or from the right-click
popup menu.
The Ticker Color Selection dialog box will appear.
Page 146
Chapter 5: Gathering Market Data
Ticker Color Selection Dialog Box
2.
Click the drop-down arrows and select the Background, Text,
Up Tick, Down Tick, and Irregular Tick colors.
3.
Click OK.
The system updates the Ticker window.
Time & Sales
The Time & Sales window displays all the transactions of a
symbol during a particular trading day.
The Time & Sales window displays one row for each transaction.
The eleven columns represent different types of data: Price,
Volume, Exchange, Type, Bid, Bid Size, Bid Exchange, Ask, Ask
Size, Ask Exchange, and Condition. The selection and order of
these columns do not change. Each major column displays the
information for one symbol, and each secondary column displays a
type of information for that symbol, such as last price, previous
close, or time of last trade.
Chapter 5: Gathering Market Data
Page 147
Time & Sales Window
The Time & Sales window features numerous colors. If you use
the default setting for your color scheme, each color has a different
meaning.
Color
Description
Red
The trade was based on the bid price.
Green
The trade was based on the ask price.
Yellow
The trade was between the bid and ask price.
Create a Time and Sales Report
1.
Hint: To create a
new Time & Sales
window, drag and
drop a symbol in
the window.
Page 148
Click Time & Sales on the RealTick Design menu, or click
the Time & Sales button on the RealTick toolbar.
The system displays the Setup Time and Sales dialog box.
Chapter 5: Gathering Market Data
Note: You can also
create a Time & Sales
window by dragging a
symbol from the
Symbol Guide or
another RealTick
window and dropping
it on the Time & Sales
toolbar button. The
system displays a new
Time & Sales with that
symbol.
Setup Time And Sales Dialog Box
2.
Type the symbol in the Symbol field.
3.
Type a date in the Date field.
The Time & Sales window can only display one day’s data at
a time.
4.
Type the start time for the data in the Begin Time frame.
5.
Click the Open option button to list trades from the time the
market opens.
6.
Type the stop time for the data in the End Time frame.
7.
Click the Now option button to include the most recent trade
data in the Time & Sales window.
8.
Click the Upper Case Symbols Only check box to enter
symbols in all upper case regardless of your keyboard setting.
If your symbol uses any lower case characters, make sure this
field is not checked.
9.
Click the Show Regional Bid/Ask check box to view the
regional bid and ask amounts for the symbol.
10. Click the Add New Lines at Top check box to display the
most recent trade data on the top of the list.
11. Uncheck the Add New Lines at Top box to display the trade
data in chronological order.
12. Click the Color Code Prices check box to display the
RealTick color codes for the prices.
Chapter 5: Gathering Market Data
Page 149
13. To display the seconds in the Time column, click the Show
Seconds field.
14. To view only the trades that are of a specific volume or higher,
type the beginning volume in the Minimum Volume field.
15. Click OK.
The system displays the Time & Sales window.
Configuring Quote Sources
View Data from Selected Exchanges
1.
Click Rgnl Exchanges on the Time & Sales menu.
2.
Click the Show Selected Exchange Data Only option button.
3.
Click the exchange you want from the list. Hold the CTRL
key down to choose any other exchanges you want from the
list.
4.
Click OK.
The system updates the Time & Sales window.
View Composite Exchange Data
1.
Click Rgnl Exchanges on the Time & Sales menu.
The system displays the Select Regional Exchanges dialog
box.
2.
Click the Show Composite Data option button.
3.
Click OK.
The system updates the Time & Sales window.
Using Time & Sales
Calculate Volume Weighted Average Price
You can calculate the volume weighted average price for a symbol
during a specific time frame.
1.
Click Calculate VWAP on the Time & Sales menu.
The system displays the Calculate VWAP dialog box.
Page 150
Chapter 5: Gathering Market Data
Calculate VWAP Dialog Box
2.
Type the start date you want to use for the average in the Start
Date field.
3.
Type the start time you want to use for the average in the
Start Time field.
4.
Type the stop date you want to use for the average in the Stop
Date field.
5.
Type the stop time you want to use for the average in the Stop
Time field.
6.
Click the Calculate button.
The system calculates the volume average price.
Edit data in a Time & Sales Window
1.
Double-click the data you want to change. For example, you
can change a time, price, or volume value.
The system displays the Edit field.
Edit Field
Chapter 5: Gathering Market Data
Page 151
2.
Type the new value and press the Enter key from your
keyboard.
The system updates the Time & Sales window with the new
value.
Note: To cancel, press the Esc key.
Copy Time & Sales Data for Another Application
1.
Hint: To move
around in the Time
& Sales window,
use the Page Up
and Page Down
keys on your
keyboard.
Click Copy to the ClipBoard on the Time & Sales menu.
The system copies the window.
2.
Open the program you want to use.
3.
Press CTRL + V.
The system pastes the Time & Sales data.
Configuring the Display of Time & Sales
Change the Print Color for Times & Sales
1.
Click Change Colors on the Time & Sales menu.
The system displays the Color Setup dialog box.
Hint: To replace a
symbol, click
Add/Replace Symbol
on the Time & Sales
menu. Enter the new
symbol in the New
Symbol field. Click
OK.
2.
Click the Printer Colors option button.
3.
Choose the background color you want from the drop-down
list available in the Background Color field. The default
color is white.
4.
Click the column you want to change from the list available in
the Series field.
5.
Choose the color for the column from the drop-down list
available in the Color field.
6.
Choose the line style for the column from the drop-down list
available in the Line Style field.
7.
Repeat steps 5 and 6 for each series whose color and line style
you want to change.
8.
Click OK.
The system displays the changes only when you print the
Time & Sales window.
Page 152
Chapter 5: Gathering Market Data
Add or Remove Columns
1.
Select Display on the Time & Sales menu.
The Display Options dialog box appears.
Display Options Dialog Box
2.
Check or uncheck the columns to display.
3.
Click OK.
TurboOptions™
The TurboOptions window is a flexible, easy-to-read option quote
window. It’s divided into two halves: one for Calls and the other
for Puts. Each column of data will appear on both sides of this
Calls/Puts divide.
TurboOptions Window
Chapter 5: Gathering Market Data
Page 153
Create a TurboOptions Window
1.
Click TurboOptions on the RealTick Design menu or click
the TurboOptions toolbar button.
The Setup TurboOptions dialog box will open.
Setup TurboOptions Dialog Box
2.
Enter the option root or underlier symbol in the Symbol text
box of the TurboOptions window (for example, IBM or /SP).
3.
If the option root or underlier requires lower case letters,
uncheck the Upper Case check box.
4.
Choose the session you want to display data from the Session
drop-down list. Choose Day Session, Night Session, or Both
Sessions.
5.
Move the data fields from the Available list to the Selected
list by using the Move (>), Move All (>>), Remove (<), and
Remove All (<<) buttons.
6.
Ensure the chosen fields appear in the Selected list field in the
desired order by using the Up and Dn buttons.
7.
Choose the order in which the columns will be organized from
the drop-down list. Your choices are Symmetric or Left to
Right.
8.
Click OK to accept the parameters and open the Turbo
Options window.
9.
Click the squares with minus signs in them to expand the
display for each expiration you are interested in.
Select an Exchange
1.
Page 154
Click Exchange on the TurboOptions menu.
Chapter 5: Gathering Market Data
The Select Regional Exchange dialog box will appear.
Select Regional Exchange Dialog Box
2.
Click the exchange you’d like to receive data from, or press
CTRL and click more than one exchange.
3.
Click OK.
The system updates the TurboOptions window.
Using TurboOptions
Set Interest Rates
1.
Click Set Interest Rates on the Turbo Options menu.
The Set Interest Rates dialog box will appear.
Set Interest Rates Dialog Box
2.
Enter the value of the rate in the Value field.
3.
Click the Apply button.
The Rate % field will change.
4.
Chapter 5: Gathering Market Data
Click the OK button.
Page 155
Change Calculation Parameters
Change the parameters for the greeks calculations. There are two
inputs that affect the greeks, Volatilities and the Option Pricing
model. Select both the Volatilities and the Option Pricing model in
the Calculation Parameters dialog box.
1.
Click Calculation Parameters on the Turbo Options menu.
The Calculation Parameters dialog box appears.
Calculation Parameters Dialog Box
2.
Click either Use Real-time Volatility or the Use Fixed
Volatility option button. If you use the real time volatility, the
system will calculate the value. If you want to fix the
volatility, you can enter the value.
If you click Use Fixed Volatility, the system activates the
Calls and Puts field.
Page 156
3.
Type the value in these fields.
4.
Choose the calculation type by clicking the Equity, Future, or
Financial fields.
5.
Choose the calculation model from the drop-down list in the
Model field.
6.
If you want to refresh the Turbo Options window with data
from the server, click the Request From Server option
button.
7.
If you want to view the root default, click the Get Root
Default option button.
8.
If you want to save the root default, click the Save as Root
Default option button.
9.
Click OK.
Chapter 5: Gathering Market Data
Quickly Change the Fixed Volatility Percent
Adjust the fixed volatility percent.
o
Right-click the Vlty column and select the percent you would
like to change the fixed volatility, +2%, +1%, +0.5%, -0.5%,
-1%, and –2%.
Reset Primary Tickers
Use this menu option to return to the primary ticker. If there are
duplicate options with the same expiration and strike price,
RealTick will display an * next to the symbol. Click the symbol,
and the ticker will display the different options.
o
To return the symbol to the primary Ticker, click Reset
Primary Tickers.
View Details in a TurboOptions Window
To
Click
Set the number of strike prices displayed at this
level in the Turbo Options Setup dialog box
To collapse an underlier row so that only the
expiration and (if applicable) the futures
contract is visible
To collapse the row
Sizing Columns
Because of the unique column layout of Turbo Options windows, it
is always better to size the columns from the right side of the
window. As you size a column on the right side, the equivalent
columns on the left side will also be sized.
Change the Width of a Column in TurboOptions
Chapter 5: Gathering Market Data
1.
Choose the column you would like to size on the right side of
the TurboOptions window.
2.
Place the mouse pointer to the right of the column until the
column sizing cursor appears.
3.
Drag the column border to the desired size, either smaller or
larger.
Page 157
Web Browser
The Web Browser window enables you to view sites on the World
Wide Web. You can view stock tips, web news stories, and more.
To run Web Browser, you must have a copy of Internet Explorer
installed on your computer. However, Internet Explorer does not
have to be your default browser.
Web Browser Window
Open a Web Browser Window
1.
Click Web Browser on the Design menu.
The Browser Setup dialog box will appear.
Note: You can also
enter a home page in
the Home Page field.
The Home Page will
become your default web
page whenever you
create a Web Browser
i d
Browser Setup Dialog Box
2.
Page 158
Type the web address you want to open in the Current Url
field.
Chapter 5: Gathering Market Data
3.
Click OK.
The system displays your Web Browser window.
Navigate in a Web Browser Window
Option
Description
Back, Forward, Stop, &
Refresh
Navigate in the Web Browser
window
Toolbar
Remove or restore the Toolbar
Status Bar
Remove or restore the Status Bar
Links to Web Sites
RealTick contains links to five web sites that provide industry
details. Hold the mouse over the Web Browser toolbar button (do
not click) and the web browser links will appear. You can research
symbols, view recommendations of brokers, look through an
earnings calendar, see the industry’s top surprises, and view stock
and ratio reports.
Web Browser Links
You can choose one of the following web links:
Open a Link
1.
Move your mouse to the Web Browser Toolbar button.
2.
DO NOT CLICK THE BUTTON.
The system displays the five links.
3.
Click the link to the site you would like to open.
The system will open the browser and display the site.
Chapter 5: Gathering Market Data
Page 159
Zacks Brokerage Research Center
Zacks Brokerage Research Center - This page contains details
about a company. You can view the recommendations of brokers,
the annual income, balance sheets, and the company profile.
Zacks Brokerage Research Center
1.
Enter the symbol in the New Search field.
2.
Click Go.
The system updates the Zacks Brokerage Research Center
window.
Note: You can also drag and drop a symbol from another RealTick
window.
3.
Choose the type of report you want to view from the dropdown list available in the upper left corner. You can choose
five different reports.
Option
Description
Company Profile
This report contains a graph of the
stock’s volume, highs, and lows.
This report contains the
recommendations of brokers in the
industry. This report is the default.
This report contains the details of
the company’s income for the
previous year.
Consensus
Estimates
Annual Income
Statement
Annual Balance
Sheet
Page 160
This report contains the details of
the company’s assets and liabilities
Chapter 5: Gathering Market Data
Snapshot
for the previous year.
This report contains a graph of the
stock’s volume, highs, and lows.
Earnings Calendar
Earnings Calendar - This page enables you to view past data
from the brokerage research. (Part of Zacks Brokerage Research
Center)
Earnings Calendar
1.
Click the date you want to view.
The system displays the Earnings Calendar Results list.
2.
Click a symbol in the Zacks Ticker field.
The system displays the Zacks Brokerage Research Center
window.
Industry Search
Industry Search - This page enables you to view the brokerage
research data by a particular industry. As a result, you can easily
compare the different stocks from the same industry. (Part of
Zacks Brokerage Research Center)
Chapter 5: Gathering Market Data
Page 161
Industry Search
1.
Click the alphabet letter in the Search field for the industry
names that start with that specific letter in the alphabet.
The system displays the industries starting with that letter.
2.
Click the industry name in the Industry field.
The system displays a list of all the companies that are listed
under the chosen industry.
3.
Click the symbol name from the Symbol field.
The system displays the Zacks Brokerage Research Center
window.
Earnings Surprises
Earnings Surprises - This page enables you to view the top
surprises in the market. You can view both the positive and
negative surprises in the industry. (Part of Zacks Brokerage
Research Center)
Page 162
Chapter 5: Gathering Market Data
Earnings Surprises
o
Click Earning Surprises on the drop-down list from the
toolbar button.
The Earning Surprises window will appear.
Market Guide
Market Guide - This page displays two types of reports - stock
reports and ratio reports. The stock report contains data such as a
summary about the company behind the stock, the growth rates,
and the cash flow. The ratio report contains data such as
dividends, financial strength, and efficiency of the company.
Market Guide Stock Report
To View Data for a Specific Symbol
1.
To access this page, move your mouse on the web browser
toolbar button. DO NOT CLICK ON THE BUTTON. Select
the Market Guide option. The system displays the web site.
2.
Drag and drop a symbol from another RealTick window to the
Market Guide.
3.
Click the section of the report you want to view from the list
in the left frame of the page.
The system displays the information in the right frame of the
page.
Chapter 5: Gathering Market Data
Page 163
Chapter 6: Charts & Technical Analysis
This chapter discusses Charts and Technical Analysis.
Using Charts
Using Charts, you can create a graph to easily view market data.
Charts display the upward and downward trends in the market in a
picture format. Unlike some of the other windows in RealTick,
Charts allow you to view lengthier time periods of data easier. As
a result, you can compare a stock’s historical value over time.
The following window displays the market trend for Microsoft
during the years 1998 and 1999.
Seasonal Chart Window
You can view data in historical and/or real time, depending on the
data criteria. The data criteria include time intervals: Intraday,
Daily, Weekly, Monthly, Seasonal, and Time and Sales. The data
criteria also include price criteria: Bids Only, Asks Only, and Bids
& Asks.
The following Intraday chart displays data at 15-minute intervals
for a five-day period.
Page 164
Chapter 6: Charts & Technical Analysis
Intraday Chart
Daily Chart
In a Daily Chart, the time is displayed on the horizontal axis, and
the price is displayed on the vertical axis. It displays data at day
intervals for a particular time period.
Chapter 6: Charts & Technical Analysis
Page 165
Weekly Chart
In a Weekly Chart, the time is displayed on the horizontal axis, and
the price is displayed on the vertical axis. It displays data at week
intervals for a particular time period.
Monthly Chart
Page 166
Chapter 6: Charts & Technical Analysis
In a Monthly chart, the time is displayed on the horizontal axis,
and the price is displayed on the vertical axis. It displays the data
at month intervals for a particular time period.
Create a Chart
Hint: You can also
create a chart by
dragging a symbol
from the Symbol
Guide or another
RealTick window and
dropping it on the
Chart toolbar button.
The system displays a
new Chart window
with that symbol.
You can create a Chart to display data daily, weekly, or monthly.
These types of charts will give you price information for the
duration of a particular time period. You can also create a Chart to
display data for a season. This is most useful for commodities, to
compare a certain season between two different commodities, or to
compare two different seasons for one commodity. Other types of
Charts focus mostly on price, including Trades, Bids, Asks, or Bids
and Asks. Lastly, you can create a Chart that focuses on both
Time & Sales. You can also compare tick and volume bars more
accurately by defining the number of trades per bar, instead of just
comparing bars based on time.
1.
Click Chart on the Design menu.
The Chart Setup dialog box appears.
Chart Setup Dialog Box
2. Enter one or more symbols in the Symbols field.
-ORClick the More button to load a symbol file.
3. Choose the type of chart from the drop-down list available in the
Data Period field.
4. Enter a date frame for the information in the chart.
Chapter 6: Charts & Technical Analysis
Page 167
5.
6.
7.
Hint: You can later
change the minute
interval of an Intraday
chart by typing p and the
minute interval. For
example, for a fiveminute chart, type p5.
8.
Type the end date in the Date field. The system will not gather
data after this date.
Type the days you want to go back in the Days field.
The system searches for data within the time frame.
If you create an Intraday chart, type the minute time interval for
the chart in the Intraday Bar Interval field, or use the arrows.
The system updates the information at each interval.
Choose the time frame for your chart.
Time Frame
Description
Start Bars at Open
Displays data starting from the market’s
open.
Exclude data before
Excludes any data before a specific time.
Exclude data after
Excludes any data after a specific time.
Irregular Trades
Displays data during non-market hours.
9. Type a title for the chart in the Chart Title field.
10. Click the Bar Graph check box to display the chart data in a bar
graph.
The Candlestick check box will activate.
11. Click the Candlestick check box to display a candlestick interval
chart.
12. Click Show Volume to display the volume bar graph.
13. Click OK.
The system displays your chart in the Chart window.
Add a Symbol to an Existing Chart
1.
Click Add/Replace Symbol on the Chart menu.
The system displays the New Symbol dialog box.
New Symbol Dialog Box
2.
3.
Page 168
Type the new symbol into the New Symbol field.
Click the Add option button.
Chapter 6: Charts & Technical Analysis
4.
Click OK.
The system updates the Chart window.
Replace a Symbol in a Chart
1.
2.
3.
4.
5.
Click Add/Replace Symbol on the Chart menu or press F6.
The system displays the New Symbol dialog box.
Enter the new symbol into the New Symbol field.
Click the Replace option button.
Choose the symbol you want to remove from the Symbols in
Chart field.
Click OK.
The system updates the Chart window.
Note: When you replace a symbol, the new symbol will retain the
technical analysis that was attached to the original symbol.
Change the Type of Chart
There are four different calculation types for a chart.
Absolute: This chart type displays the price series. You can chart
several symbols, using both axes, with this calculation.
Percent Change: This calculation shows the change over time for
the value of each symbol. The value of each symbol when it first
appears in the chart is the reference value. The remainder for each
symbol is a percentage of the reference value.
Ratio: This calculation displays the value of one or more symbols
relative to the value of another. You must choose the symbol the
other symbols will be measured against.
Differential: This calculation displays the difference between the
values of two or more symbols. You must choose the symbol the
others will be measured against.
1.
Chapter 6: Charts & Technical Analysis
Click Style on the Chart menu.
The system displays the Chart Type dialog box.
Page 169
Chart Type Dialog Box
2.
3.
4.
5.
Percent Chart Type
Page 170
Click the option button of the calculation style from the Chart
Type frame.
If you chose either Ratio or Differential, choose a symbol from
the drop-down list available in the Reference Symbol field.
Choose a column from the drop-down list available in the
Reference Column field.
Click OK.
The system updates the Chart window.
Absolute Chart Type
Chapter 6: Charts & Technical Analysis
Quickly Change the Chart Interval
You can change the chart interval with new macro keystrokes.
Change the chart from an intraday to a daily, weekly, or monthly.
1.
2.
3.
4.
Click the chart.
Press the period key on your keyboard and then press I, D, W, or
M for Intraday, Daily, Weekly, or Monthly, respectively.
For Day, Weekly, or Monthly charts, you can specify the number
of days, weeks, or months by typing the number after you press D,
W, or M. For example, for a 30-day Day chart, type .D30.
For an Intraday chart, type the minute interval after you type I.
For example, for a 30-minute Intraday chart, type .I30.
The chart updates.
Chart Macro Keystrokes
Changing the Display of a Chart
Configure your chart to display different information or
information differently. This feature helps you view data more
clearly in a chart.
Change the Display of a Chart
1.
Chapter 6: Charts & Technical Analysis
Click Display on the Chart menu.
The system displays the Chart Display Options dialog box.
Page 171
Chart Display Options Dialog Box
2.
3.
4.
Hint: To toggle
between a Candlestick
chart and a Bar chart,
press Ctrl S.
To scroll up, down,
left, or right in a
Chart, use the arrow
keys on your keyboard.
5.
6.
7.
8.
9.
10.
11.
12.
13.
Page 172
If the panel includes multiple symbols, choose the appropriate
symbol from the drop-down list available in the Symbol
Attributes box.
Double-click the column name in the Series to Display list if you
would like to add data.
A checkmark appears.
Choose the axis by clicking the Left or Right option buttons in the
Vertical Axis frame.
To create a candlestick chart, click the Candlestick check box.
To hide all the data about a specific symbol, click the Hide All
Series check box. The symbol will be hidden (not removed) from
the view on the Chart window.
To display horizontal lines, click the Horizontal Lines check box.
To change the color of the column name, click the column name in
the Series to Display list.
Click the arrow buttons (< or >) in the Color field.
To add grid lines to the chart, click the Grid Lines check box.
To add the last price to the X axis in the chart, click the Show Last
Price In Axis check box.
To change the width of the line, change the value in the Pen
Width field. The width must be at least 1.
To change the color of the font on the window or when you print
your chart, click the Advanced Colors button.
The system displays the Color Setup dialog box.
Chapter 6: Charts & Technical Analysis
Color Setup Dialog Box
14. Select a symbol in the symbol field you would like to change its
colors. Once you select an item in the Series box, the Color and
Line Style drop-down boxes will activate. Choose a color and a
line style. You can also change the background color from the
Background Color drop-down box. Click OK.
15. To change the display font, click Screen Font button.
The system displays the Font dialog box.
Font Dialog Box
16. Enter any changes and click the OK button.
17. To change the print font, click the Printer Font button.
The system displays the Font dialog box.
18. Enter any changes and click the OK button.
19. Click OK.
The system updates the Chart window.
Chapter 6: Charts & Technical Analysis
Page 173
Change a Series in a Chart
Change a column to display different data.
1.
Click Display on the Chart menu.
The system displays the Chart Display Options dialog box.
Chart Display Options Dialog Box
2.
Click the Configure Column button.
The system displays the Set Column Attributes dialog box.
Hint: To dock the Time
& Sales window, click
and drag it to the bottom
of the Chart window.
Set Column Attributes Dialog Box
3.
4.
5.
6.
7.
8.
Page 174
Choose the column you want to change from the drop-down list
available in the Column field.
Change the name of the column as it appears in the Edit Chart
dialog box in the Name1 field.
Change the name of the column as it appears in the statistics popup window in the Name2 field.
Type the width of the field in the Field Width field.
Choose the alignment for the column by clicking the Left, Center,
or Right buttons.
Click the Show Zeros field if you want to have zeros placed in
numeric fields that do not have data.
Chapter 6: Charts & Technical Analysis
9.
Click OK.
The system displays the Chart Display Options dialog box.
10. Click OK.
The system updates the Chart window.
Hide the Chart Title (Legend)
Choose this option to hide the title on the chart window and save
window space.
1.
2.
3.
Click Display on the Chart menu.
The Chart Display dialog box will appear.
In the General Properties box, make sure the Show Legends
check box is unchecked.
Click OK.
The Chart window will appear without the Legend.
Viewing Data in a Chart
Scale a Chart
1.
Click Scaling on the Chart menu.
The system displays the Chart Scaling dialog box.
Chart Scaling Dialog Box
2.
3.
4.
If the chart contains multiple panels, choose the appropriate axis
from the drop-down list available in the Panel field.
If the chart contains multiple axes, choose the appropriate panel
from the drop-down list available in the Axis field.
Choose the scaling option for the Vertical axis:
Option
Min/Max
Scaling
Chapter 6: Charts & Technical Analysis
Description
Adjust the vertical scale to accommodate the entire
page values in the chosen part of the Chart
Page 175
window.
Fixed
Endpoints
Manually scale the vertical axis. Choose the High
and Low values that you want to focus on when
scaling.
Link Left and
Right Axes
Link the left and right vertical axes.
Logarithmic
Scale
Scale the chart based on logarithmic scale.
5.
Choose the scaling option for the Horizontal axis:
Option
Description
Fixed
Specify pixels per data point. Increase or decrease
the number of pixels with the control arrows
available in the Pixel/Data Point field.
Snap to
Window
Scale the graph to fit the entire Chart window.
Snap to Date
Range
Scale the window horizontally so that only data
from a specific time frame appears in the Chart
window.
6.
7.
To set the scaling as the standard for the chart, check the Keep
Vertical Scale Fixed When Symbol Changes option button.
When you change the symbol, the scaling will remain unchanged.
Click OK.
The system updates the Chart window.
Options to Scale a Chart
The following table describes menu options you can use to scale
the data in a chart.
Option
Description
Auto Scale
Scale the price axis so all the information is
displayed with the greatest possible detail.
Snap to
Window
Scale the chart so all the data appears in the chart
window without a horizontal scroll bar.
Quick Scale a Chart
1.
2.
Page 176
Press Ctrl and click the chart.
Move up or down and left or right using the mouse.
Chapter 6: Charts & Technical Analysis
The chart will scale accordingly.
Move Around in a Chart
1.
2.
Press Shift and click the chart.
Move up or down and left or right using the mouse.
The chart will move.
Vertical Zooming a Chart
Vertical Zooming on a chart expands the vertical scale.
1.
2.
To expand the vertical scale, press the Page Up key from your
keyboard repeatedly.
To contract the vertical scale, press the Page Down key from your
keyboard repeatedly.
Enlarge a Chart Region
The Zoom Tool enables you to zoom in on a specific region of
your chart. The system magnifies this area to fill the entire Chart
window. You can restore the chart to its original size by changing
the scale in the Chart Scaling dialog box.
1.
2.
3.
Click Zoom Tool on the Chart menu.
The cursor changes into a magnifying glass.
Hold down the left mouse button and draw around the area you
want to enlarge.
Release the left mouse button.
The system fills the Chart window with the selected area.
Restore a Chart to Original Size
o
Press F7.
The Chart will restore to its normal size.
Note: If you hold down
the left mouse button and
drag the mouse across
the chart, the price and
study values change as
you move to different
time intervals.
Chapter 6: Charts & Technical Analysis
View the Statistics in a Chart
The Info Tool is the default tool for charts. This arrow-shaped tool
enables you to see the numeric details of your chart. When you
choose the Info Tool, the system displays a statistics window in the
Chart window when you hold down the left mouse button. On an
intraday or daily chart, the statistics box displays the price data
(open, high, low, and close), the active studies corresponding to
Page 177
each symbol, and their respective colors and line styles for the time
interval you select. On a trade chart, the statistics box displays the
time and price of each tick.
1.
2.
3.
Click Info Tool on the Chart menu.
The system enables the Info Tool with a check mark.
Move the mouse to the interval bar to view price and study values.
Click with the left mouse button.
The system displays the statistics box.
View a Statistic at a Specific Position on a Chart
The Crosshair Tool performs the same function as the Info Tool,
except that it displays a large crosshair on the Chart window to
show the exact position of the cursor. You can find the exact
vertical and horizontal axis data for a particular point on the chart.
1.
2.
Click Crosshair Tool on the Chart menu.
Click your left mouse button on the area of the chart you want
exact vertical and horizontal axis data.
The system displays the large cross shape.
Using Annotations
Annotaion icon
Hint: To display an
annotation, move
the mouse over the
annotation and click
it.
You can add annotation notes to your charts. Post-it note icons in
the Chart window will mark each of your annotations. When you
click the post-it note with the mouse, the annotation text appears in
the chart label at the top of the chart window. Use annotations to
make a note for yourself.
Note: The system saves annotations and records the date and time
corresponding to the position of the icon. When the date
corresponding to the annotation no longer appears in the Chart
window, the annotation is removed from the chart. For example,
annotations on an intraday chart showing two days of data will be
removed once they are more than two days old.
Add an Annotation
1.
Page 178
Click Annotation on the Attributes sub-menu of the Chart menu.
The system displays the Chart Annotation dialog box.
Chapter 6: Charts & Technical Analysis
Note: There is a 10
annotation limit to
each chart.
Chart Annotation Dialog Box
2.
3.
4.
Enter your message in the Chart Annotation dialog box.
Click the Post Note button to post your annotation to the chart.
The mouse changes to a post icon.
Move the mouse to the point on the Chart window where you
want to place the annotation, and click with the mouse button.
A post-it note icon appears in the Chart window.
Change an Annotation
1.
Double-click the annotation.
The system displays the Edit Chart Annotation dialog box.
Hint: To move an
annotation, drag and
drop it to a new location.
Edit Chart Annotation Dialog Box
2.
3.
Change the text of the annotation message in the Edit Chart
Annotation dialog box.
Click the Save button.
The system updates the annotation.
Delete an Annotation
1.
2.
3.
Chapter 6: Charts & Technical Analysis
Move the mouse over the annotation.
The cursor changes into a post icon.
Double-click the left mouse button.
The system displays the Edit Chart Annotation dialog box.
Click the Delete button.
The system deletes the annotation.
Page 179
Using Trend Lines
Draw trend lines to draw support and resistance levels or break out
points that help technical analysts determine entry and exits in the
market.
Draw a Trend Line
1.
Click Trend Tool on the Chart menu.
The system displays the Trend Lines box.
Trend Lines Dialog Box
2.
3.
4.
Click Draw.
Choose the line style you want from the list in the Type field.
Click Configure.
The Default Lines Setup box will appear.
Default Regular Trend Line Setup
5.
6.
7.
8.
Page 180
Select the appropriate option(s).
Click OK.
On the Chart, click the left mouse button and hold it down.
Drag the mouse until you are finished drawing the trend line.
Chapter 6: Charts & Technical Analysis
9.
Click the close button on the upper right corner of the Trend Lines
box.
Move a Trend Line
1.
2.
3.
4.
Click Select Tool on the Chart menu.
The cursor changes to a target crosshair.
Move the mouse to the middle of the trend line. Do not select an
end point.
The cursor changes from a target crosshair to a plus sign (+).
Click the line with the left mouse button.
Hold down the left mouse button and drag the trend line to its new
location. The size and slope will remain unchanged.
Move a Group of Trend Lines
1.
2.
3.
4.
Click Select Tool on the Chart menu.
The cursor changes to a target crosshair.
Move the mouse to the middle of the first trend line. Do not select
an end point.
The cursor changes from a target crosshair to a plus sign (+).
Click the line with the left mouse button while holding down the
Ctrl key. Continue holding the Ctrl key while selecting the other
lines.
Still holding down the Ctrl key and the left mouse button, drag the
group of trend lines to a new location. The size of each line will
not change.
Copy a Trend Line
1.
2.
3.
Chapter 6: Charts & Technical Analysis
Click Select Tool on the Chart menu.
The cursor changes to a target crosshair.
Move the mouse to the middle of the trend line while holding
down the Shift key. Do not select an end point.
The cursor changes from a target crosshair to a plus sign (+).
Still holding down the Shift key and the left mouse button, drag
the trend line to its new location.
The system copies the line to the new location.
Page 181
Resize a Trend Line
1.
2.
3.
Click Select Tool on the Chart menu.
The cursor changes to a target crosshair.
Move the mouse to one of the ends of the trend line.
The cursor changes from a target crosshair to a sloped cross (X).
Click the left mouse button and move the mouse to resize the line.
Delete a Trend Line
1.
2.
3.
Click Select Tool on the Chart menu.
The cursor changes to a target crosshair.
Move the mouse to the trend line and click the left mouse button.
Press the Delete key from your keyboard to delete the trend line.
Using Pivot Lines
The Pivot Point study works best in futures markets with a wide
daily trading range (high volatility). The study uses the previous
day high, low, close, and open price to generate a pivot, two
support levels, and resistance levels.
Today’s Pivots are a function of yesterday’s high, low, and close
for a specific contract.
H – Yesterday’s High
L – Yesterday’s Low
C – Yesterday’s Close
The five equations for the Pivot Lines are
Page 182
Chapter 6: Charts & Technical Analysis
Adding Pivot Lines
o
Click Pivot Lines from the Attributes sub-menu on the
Chart menu.
The Pivot Lines will appear.
Spreads
With a chart multiplier you can compare stocks or futures spreads
more accurately by using simple arithmetic equations. For
example, =.6325*HWP-CPQ shows the spread between a potential
M&A between HWP and CPQ. Also, it may be necessary to
delimit a ticker symbols with single quotes, for example, the
symbol /SPU1 would need to be delimited as ‘/SPU1’ when used in
a formula.
Create a Chart Multiplier
1.
2.
3.
4.
Click Setup on the Chart menu.
The Chart Setup dialog box will appear.
Type the equation in the Symbols field.
Click Add.
Click OK.
The chart will graph the multiplier.
Note: Charts supports the ticker symbols +, -, /, * in the formula.
Always precede the formula with an equals sign.
Technical Analysis
Technical analysis studies can be added to a chart or a table
window. However, charts are used mostly with Technical
Analysis. RealTick offers a wide variety of price studies,
oscillators, stochastics, moments, volume and open interest studies,
price and volume studies, and directional movement indicators.
This section contains detailed information about each study.
Formulae and references are provided where relevant, along with
the default parameters for each study. You can adjust the
parameters on most studies. The type of chart (intraday, daily,
time and sales) and type of symbol (stock, future, index) determine
what studies are available.
Chapter 6: Charts & Technical Analysis
Page 183
Study Availability Table
The following table lists the availability of various studies by chart
or table type.
Study Type
Moving Averages
Study
Simple, Exp, Linear,
Autoreg.
Envelopes & Bands Percent Offset
Average Range
Total Range
Bollinger
Momentum
Oscillators
Acceleration
Moving Average
Momentum
Moving Average
Oscillator
MACD Oscillator
MACD & Signal Line
Commodity Channel
Index
Volatility
Rate of change
Statistical Moments Monthly Average
Variance
Standard Deviation
Kurtosis
Skew
%R & RSI
Other
Stochastics (4:fast to
slow)
Directional Movement
Indicator
Arms' Ease of Movement
Volume & Price
Variable Accumulation
Dist.
Money Flow
On Balance Volume
Volume
Total Volume
Trade Volume
Tick Count
Open Interest
Page 184
Tick
Y
Intraday
Y
Daily
Y
Y
Y
Y
Y
Y
Y
Y
Y
Y
Y
Y
Y
Y
Y
Y
Y
Y
Y
Y
Y
Y
Y
Y
Y
Y
Y
N
Y
Y
Y
Y
Y
Y
N
N
N
Y
Y
Y
Y
N
N
Y
Y
N
Y
Y
Y
Y
Y
Y
Y
Y
Y
Y
Y
Y
Y
Y
Y
N
Y
Y
N
N
Y
Y
Y
Y
Y
N
N
Y
N
N
N
Y
N
Y
Y
N
N
Y
Y
N
N
Y
Chapter 6: Charts & Technical Analysis
Add a Technical Analysis to a Chart
1.
Click Setup Studies on the Chart menu.
The system displays the Select Studies dialog box.
Note: Only certain types
of charts allow for more
than one symbol, for
example, intraday, daily,
or weekly.
Select Studies Dialog Box
2.
3.
4.
5.
6.
If the chart includes multiple symbols, choose the appropriate
symbol from the drop-down list available in the Symbol field.
Choose the study you want to add in the Selected Studies field.
Click the Add (>) button.
The system displays the name of the study in the Selected Studies
field.
Click the Parameters button to modify the parameters of the
selected study.
The system displays the Parameters dialog box where you can set
additional options for your chart.
Click OK.
The system updates the chart in the Chart window.
Add a Technical Analysis to a Table
1.
2.
3.
4.
Chapter 6: Charts & Technical Analysis
Click Set Up Studies on the Table menu.
The system displays the Select Studies dialog box.
If the table includes multiple symbols, choose the appropriate
symbol from the drop-down list available in the Symbol field.
Click a study in the Available Studies list.
Click the Add (>) button.
Page 185
5.
6.
The system displays the name of the study in the Selected Studies
field.
To change the order of the columns in your Table window, choose
the study in the Selected Studies field then click either the Move
Up or Move Down button.
Click OK.
The system updates the Table window.
Accessing the Parameters Dialog Box
With each study, you can change the parameters of the study. The
parameters will change depending the study. However, how to
access the parameters dialog box for each study is the same.
1.
2.
3.
Click Setup Studies on the Chart menu.
The Setup Studies dialog box appears.
Select a study.
Click Parameters.
The study’s Parameters dialog box will appear.
Note: Some parameter dialog boxes contain a button to access
another parameter dialog box for further configuration.
Price Studies
Price studies are studies that values are in the same units as the
price of the asset. The price studies offered in RealTick are
Moving Averages, Moving Linear Regression, Upper Envelope,
and Lower Envelope.
Moving Averages (MA)
A moving average is a smoothing technique used to isolate the
trend from short-term price fluctuations. RealTick displays four
types of moving averages: simple, autoregressive, linear weighted,
and exponential. The types differ primarily in how they treat older
data. Simple moving averages weight each of the terms in the
average equally. The linear weighted moving average gives more
importance to more recent prices. Both the simple and the linear
weighted moving averages limit the price effect to the number of
periods in the average. The autoregressive moving average is
based on the inputs and outputs in the system.
Page 186
Chapter 6: Charts & Technical Analysis
The exponential gives more weight to recent prices but allows all
data in the window to influence the average. Instead of a number
of periods, the exponential uses a smoothing factor, which can
have any value between zero and one. The larger the smoothing
factor the more influenced the average will be by more recent
prices. If you want to relate the smoothing factor to the periods
used in the standard moving average, set the factor equal to two
divided by one plus the number of periods. Moving averages are
usually based upon the close but can be based on other price series
such as the midpoint.
Formulae:
The mathematical definitions for the different moving averages
follow.
Simple MA:
Autoregressive MA:
Note: If AR=0 then ARMA=SMA.
Linear MA:
Exponential MA:
Variable
Chapter 6: Charts & Technical Analysis
Description
N
The number of periods.
Pt
The price for the current period.
Page 187
P t-1
The price for the previous period.
T
The number of the position of the period being studied in
the total number of periods in the data base.
SF
The exponential smoothing factor = 2/(n+1).
Reference: Colby, Thomas & Robert Meyers, The Encyclopedia of
Technical Market Indicators, Dow Jones Irwin, Homewood, 1988.
Moving Average Parameters
The type of moving average, number of periods and price series
can be changed from the default settings in the Moving Average
Parameters dialog box.
Moving Average Parameters Box
The following table lists the Moving Average parameter defaults.
Value
Defaults
Moving Average Type
Simple
Period
5
Field to Avg
Close
The following picture displays a chart with a moving average.
Page 188
Chapter 6: Charts & Technical Analysis
Intraday Chart with a Moving Average Study
Moving Linear Regression (MLR)
Moving linear regression is the fitted value of price, estimated
from a linear regression of price on time. You can select the price
series to use in the regression and the number of periods to include
in the linear regression. The number of periods in the regression
and the price definition can be changed in the regression dialog
box.
Regression Parameters Box
The following table lists the Moving Linear Regression parameter
defaults.
Value
Chapter 6: Charts & Technical Analysis
Default
Period
5
Series
Close
Page 189
Formula: MLR = a + b t
Where:
Variable
Description
n
The number of periods in the summation.
t
The position of the current time in the database.
Pt
The price for the current period.
Reference: Colby, Robert & Thomas Meyers, Encyclopedia of Technical
Market Indicators, Dow Jones Irwin, Homewood, 1988.
The following picture is a chart with a moving linear regression.
Moving Linear Regression Study
Page 190
Chapter 6: Charts & Technical Analysis
Upper Envelope/ Lower Envelope (UP/DN)
Several types of envelopes based upon a moving average can be
displayed simultaneously. The upper and lower envelopes are
selected as separate studies. The upper envelope (or lower
envelope) parameter dialog box allows you to choose among
different types of envelopes, and to configure the moving average
on which the envelopes are based. The moving average itself is
not displayed unless selected as a separate study. You can choose
from Percentage Offset, Average Range, Bollinger Bands, or
Range Channel.
The following picture displays a chart with an upper envelope
study.
Intraday Chart with an Upper Envelope Study
Percentage Offset
Percentage offset envelopes are simple offset bands to the moving
average itself. If you select % Offset, you can select the
percentage to add (for upper bands) or subtract (for lower bands)
from the moving average.
Formula: The formulae for offset envelopes are:
Chapter 6: Charts & Technical Analysis
Page 191
Where: MA is an n period moving average.
Reference: Kaufman, Perry, The New Commodity Trading Systems &
Methods, John Irwin, 1988
Parameters: You can set the % Offset Envelope value in the
Envelope dialog box. You can enter integers or fractions in
decimal form (e.g., .1). You can also change the type and
parameters of the moving average on which the envelope is based.
The following table lists the Percentage Offset and Moving
Average default parameters.
Value
Default
Percentage Offset
1
Moving Avg Type
Simple
Period
5
Field to Avg
Close
Envelope Parameters Box
Moving Average Parameters Dialog Box
Page 192
Chapter 6: Charts & Technical Analysis
Average Range
Envelopes based on the range can be displayed. The average
envelope adds (upper) or subtracts (lower) a measure of the range
to the moving average. The range is calculated as the largest
absolute value of either today's high minus today's low, today's
high minus yesterday's close, or today's low minus yesterday's
close. The simple moving average of the range is then added or
subtracted to the moving average of the price to produce either
envelope.
Formulae:
Variable
Description
a
Decimal multiplier supplied by the user
D
The maximum of
Hi
The high on day i.
Ci
The close on day i.
Li
The low on day i
Reference: Kaufman, Perry, The New Commodity Trading Systems &
Methods, John Wiley, 1987.
Parameters: The Average Range moving average uses the same
period as the moving average, which is set through the Moving
Average Parameters dialog box.
The following table lists the default parameters for the average
range and the Moving Average.
Chapter 6: Charts & Technical Analysis
Page 193
Value
Default
Average Range
2
Period
5
Type
Simple
Field to Average
Close
Bollinger Bands
Bollinger Bands are based on the standard deviation of price added
or subtracted to a simple moving average. The standard deviation
error is added to the moving average for an upper envelope and
subtracted for a lower envelope.
Formula:
Variable
Description
MA t
An n period moving average.
a
The number of standard deviations to add or subtract
for the moving average. Integers or fractions are
permissible
σ
The standard deviation
Reference: John Bollinger, Bollinger Capital Management, Manhattan
Beach, CA.
Parameters: The Price Series, the multiplier a, and the Period n
are configurable parameters. The Period n is used in computing
both the moving average and the standard deviation.
The following table lists the Bollinger Band and Moving Average
parameter defaults.
Page 194
Chapter 6: Charts & Technical Analysis
Value
Defaults
Bollinger Bands
2
Period
5
Series
Close
Range Channel
Range channels are channels based on the difference between the
highest high and the lowest low for a given period. A percentage
of the range is then added and subtracted to a simple moving
average.
Formula:
Variable
Description
H
The highest high and L is the lowest low for period n.
MA t
An x period moving average.
Parameters: The period used for calculating the range, the
percentage of the range to include, and the moving average period
is adjustable.
Envelope Parameters Box
This table lists the Range Channel and Moving Average parameter
defaults.
Chapter 6: Charts & Technical Analysis
Page 195
Value
Default
Range Channel
50%
Range Period
3
MA Period
5
Series
Close
Oscillators
Oscillators represent different ways of measuring change in prices
rather than measurements of prices themselves. RealTick offers
eleven oscillators for use in charts and tables. Momentum
Oscillator, Acceleration, Moving Average Oscillator, Moving
Average Momentum, Moving Average Convergence Divergence,
Signal Line, MACD Oscillator, Rate of Change in Prices,
Volatility, Volatility Ratio, and Commodity Channel Index.
Momentum Oscillator (MOM)
The momentum oscillator is the most basic oscillator. It is the
difference between two prices at a fixed time interval from one
another. Momentum is analogous to the slope of price relative to
time. A positive value of momentum indicates that prices are
increasing. A positive but negatively sloped momentum shows
that prices are increasing but less rapidly.
Formula:
Variable
Description
Pt
The price for the current period.
P t-n
The price n periods ago.
Reference: Kaufman, Perry, The New Commodity Trading Systems &
Methods, John Wiley & Sons, New York, 1987.
Parameters: The parameters for the momentum calculation can
be changed in the momentum parameter box.
Page 196
Chapter 6: Charts & Technical Analysis
Momentum Parameters Box
The following table lists the Momentum Oscillator parameters.
Value
Default
Period
5
Series
Close
The following picture displays a chart with a momentum oscillator
study.
Momentum Oscillator Study
Acceleration (ACC)
Acceleration is the difference between two momentum indicators.
Acceleration is analogous to rate of change. If values of the
momentum are positive and acceleration is positive, prices are
Chapter 6: Charts & Technical Analysis
Page 197
increasing and the difference is increasing. For small changes in
prices this means that rate of change in prices is increasing, for
example, price increases are accelerating.
Formula:
Variable
Description
MOM t
The value of an n period momentum for the current
period.
MOM t-x
The value of momentum for x periods ago.
Reference: Kaufman, Perry, The New Commodity Trading Systems &
Methods, John Wiley & Sons, New York, 1987.
Parameters: Both the underlying momentum calculations and the
number of periods between the two momentum estimates can be
changed in the acceleration parameter box. The price series is also
selected in the acceleration parameter box.
Acceleration Parameters Box
The following table lists the Acceleration and Moving Average
parameter defaults.
Value
Default
Acceleration
Period
5
Momentum
Period
5
Series
Close
The following picture displays a chart with an acceleration study.
Page 198
Chapter 6: Charts & Technical Analysis
Acceleration Study
Moving Average Oscillator (MAO)
The moving average oscillator is the difference between two
moving averages. The moving average oscillator shows you
crossovers of moving averages.
Formula: The moving average oscillator for period t is:
Variable
Description
MA t(a)
The simple moving average based on a intervals.
MA t(b)
The simple moving average based on b intervals.
Parameters: The default values for the moving averages are two
simple moving averages on the close: the first with 5 periods and
the other with 10 periods. The periods used in the moving
averages and the series can be changed in the moving average
oscillator dialog box.
Chapter 6: Charts & Technical Analysis
Page 199
Moving Average Oscillator Parameters Box
The following table lists the Moving Average Oscillator parameter
defaults.
Value
Default
Short Term Period
5
Long Term Period
10
Field to Avg.
Close
The following picture displays a chart with a moving average
oscillator study.
Moving Average Oscillator Study
Page 200
Chapter 6: Charts & Technical Analysis
Moving Average Momentum (MAM)
Moving average momentum is a momentum based on the
difference between two values of the same moving average rather
than two prices.
Formula:
Variable
Description
a
The number of periods in the values of the moving
averages
n
The length of the momentum
Reference: Kaufman, P.J., The New Commodity Trading Systems and
Methods, John Wiley & Sons, New York, 1987.
Parameters: The momentum period (the number of periods
between the two moving averages) is an adjustable parameter. The
number of periods used in calculating the moving averages can be
changed as well as the price series.
The following table lists the default values for the Moving Average
Momentum.
Moving Avgerage Momentum Parameters Box
Value
Chapter 6: Charts & Technical Analysis
Default
Mov. Avg. Period
5
Momentum
Period
5
Page 201
The following picture displays a chart with a moving average
momentum study.
Moving Average Momentum Study
Moving Average Convergence Divergence (MACD)
The MACD indicator (Appel, Gerald, The Moving Average
Convergence Divergence Trading Method, Signalert Corp, 150
Great Neck Rd; Great Neck, NY 11021) is the difference between
two exponential moving averages, a long term and a short term
moving average. It is usually used in conjunction with a signal
line which is a short term exponential moving average of the
MACD indicator.
Formula:
EMA 1 and EMA 2 are exponential moving averages at period t
with different smoothing factors.
Parameters: The parameters are the respective smoothing factors
and the price series. The default smoothing factor value for the
first moving average is .15, and the default smoothing factor value
for the second moving average is .07. The default values are a
Page 202
Chapter 6: Charts & Technical Analysis
smoothing factor of .07 (approximately equal to 26 periods) for the
second moving average, and .15 for the first (12 periods). The
SLSF (Signal line smoothing factor) choice is grayed in the
MACD parameters box.
MACD Parameters Box
The following table lists the default values for the Moving Average
Convergence Divergence parameters.
Value
Default
EMA1 SF
.15
EMA2 SF
.07
Series
Close
The following picture displays a chart with a moving average
convergence divergence study.
Chapter 6: Charts & Technical Analysis
Page 203
Moving Average Convergence Divergence Study
Signal Line (SIG)
The Signal line is an exponential moving average of the MACD.
The Signal line usually uses a smoothing factor comparable to a
short term moving average.
Formula:
Reference: Colby, Thomas and Robert Meyers, The Encyclopedia of
Technical Market Indicators, Dow Jones Irwin, 1989.
Parameters: The parameters are the respective smoothing factors
and the price series. The default values are a smoothing factor of
.07 (approximately equal to 26 periods) for the second moving
average; .15 for the first (12 periods) and a smoothing factor of .20
for the signal line (9 periods).
Page 204
Chapter 6: Charts & Technical Analysis
Signal Line Parameters
The following table lists the MACD Signal Line parameter
defaults.
Variable
Defaults
Field to Avg
Close
EMA1
.15
EMA2
.07
EMA3
.20
MACD Oscillator (CDO)
The MACD is frequently used with the Signal line to generate
trading signals based on crossovers. The MACD Oscillator shows
these crossovers directly. The MACD Oscillator is the difference
between the MACD line and the Signal line.
Formula:
MACDO = MACD - SIG
Parameters: The parameters are the respective smoothing factors
and the price series. The default values are a smoothing factor of
.07 (approximately equal to 26 periods) for the second moving
average; of .15 for the first (12 periods) and a smoothing factor of
.20 for the signal line (9 periods).
MACDO Parameters Box
Chapter 6: Charts & Technical Analysis
Page 205
The following table lists the default values for MACD Oscillator
parameters.
Value
Default
EMA1
.15
EMA2
.07
EMA3
.200
Series
Close
The following picture displays a chart with a MACD Oscillator
study.
MACD Oscillator Study
Rate of Change in Prices (RCP)
Rate of change in prices is a price momentum indicator. It is the
change in price between the current period and n periods ago,
divided by the price n periods ago. Unlike momentum it is a
relative measure and therefore not biased by changes in the overall
level of prices. It can take positive or negative values.
Page 206
Chapter 6: Charts & Technical Analysis
Formula:
Variable
Description
n
The number of periods.
Pt
The current price.
Pt-n
The price n periods ago.
Reference: Colby, Thomas & Robert Meyers, Encyclopedia of Technical
Market Indicators, Dow Jones Irwin, 1988.
Parameters: The number of periods and the price series are
adjustable.
Rate of Change Parameters Box
The following table lists the Rate of Change in Prices parameter
defaults.
Value
Default
Period
5
Series
Close
The following picture displays a chart with a rate of change in
prices study.
Chapter 6: Charts & Technical Analysis
Page 207
Rate of Change in Prices Study
Volatility (VO)
Volatility as used in technical analysis is a momentum type
measure of the range of prices over a given time period. The
maximum price change experienced is a measure of risk. (For
statistical measure of variance and standard deviation, see
Moments.) RealTick displays volatility and volatility ratio.
Volatility is the difference between the highest price and the lowest
price experienced over period n.
Formula:
VOt = H - L
Variable
Description
H
Highest price occurring over period n.
L
The lowest price occurring over period n.
Reference: Kaufman, Perry, The New Commodity Trading Systems &
Methods, Irwin, 1987.
Parameters: The only parameter in the volatility indicator is the
period. The period length can be changed in the volatility
parameters dialog box.
Page 208
Chapter 6: Charts & Technical Analysis
Volatility Parameters Box
Defaults: Period = 15
Volatility Study
Volatility Ratio (VOR)
Volatility ratio is measure of volatility or maximum price
fluctuation presented in relative terms. Unlike volatility, it is not
affected by the overall level of prices. Volatility ratio is the
difference between the highest high for a given time interval and
the lowest low for the same interval, divided by the lowest low for
the same interval.
Formula:
VOR t = (H - L)/ L
Chapter 6: Charts & Technical Analysis
Page 209
Variable
Description
H
The highest price occurring over period n.
L
The lowest price occurring over period n.
Reference: Colby, Thomas & Robert Meyers, The Encyclopedia of
Technical Market Indicators, Dow Jones Irwin, 1989
Parameters: The only parameter for volatility ratio is the period.
The period can be changed in the volatility ratio parameter box.
Volatility Ratio Parameters Box
Default: Period=15
The following picture displays a chart with a volatility ratio study.
Volatility Ratio Study
Commodity Channel Index (CCI)
The Commodity Channel Index is a momentum indicator
developed by Donald R. Lambert.
Page 210
Chapter 6: Charts & Technical Analysis
Formula:
Variable
Description
M
(1/3)(H+L+C) for a period n.
H
The highest price for a period n.
L
The lowest price for a period n
C
The closing price for a period n.
Ma
The n - period simple moving average of M.
D a= the mean deviation of the absolute value of the difference
between the mean price and the simple moving average of mean
prices.
Reference: Colby, Thomas & Robert Meyers, The Encyclopedia of
Technical Market Indicators, Dow Jones Irwin, 1989.
Parameters: The only parameter to the Commodity Channel Index
is the period n, also referred to as the sample size, which can be
changed through the CCI parameter dialog box.
Commodity Channel Index Parameter Box
Defaults: Period=5
Chapter 6: Charts & Technical Analysis
Page 211
Commodity Channel Index Study
Stochastics
A stochastic is an oscillator based on the position of the closing
price for a certain time period relative to the range over the same
time. This measure and smoothed expressions of it make up the
family of stochastics. This indicator was developed by George
Lane (Investment Educators, P.O. Box 2354, Des Plaines, IL).
Lane's four stochastics are selected as separate studies: %K, %D,
%D Slow, and %D Averaged. These four stochastics share
parameters. In addition, RealTick offers Williams' Percentage
Range and the Relative Strength Index.
K Fast (%K)
Fast %K measures the relative position of the close as the
difference between the lowest price for the period and the close of
the period. This number is expressed as a percentage of the range
for the period. When creating %K you must select the time period,
i.e. the number of intervals to include in the period.
Page 212
Chapter 6: Charts & Technical Analysis
Stochastic Parameters Box
Formula:
%K = ((C-L)/(H-L))*100
Variable
Description
C
The closing price for period n.
L
The lowest price over period n.
H
The highest price over period n.
n
The period length.
The following picture displays a chart with a %K study.
%K Study
D Fast (%D)
A simple moving average of %K is called %D (or Fast %D).
When creating %D, you must select both the number of intervals in
Chapter 6: Charts & Technical Analysis
Page 213
the %K upon which %D is based and the number of terms to
include in the average. Lane uses a three term moving average.
Stochastic Parameters Box
Formula:
%D = MA(%K) over period x.
Value
Description
%K interval
14
%D interval
1
The following picture displays a chart with a %D study.
%D Study
Page 214
Chapter 6: Charts & Technical Analysis
D Slow (%Ds)
Fast stochastics can be very choppy. To reduce the choppiness,
increase the number of periods or use the further smoothed form,
%D Slow. %D Slow is a moving average of %D. To create %D
Slow you must select the number of intervals to include in the
average as well as the parameters used to create %K and %D.
Lane uses three periods to calculate %D Slow.
Stochastic Parameters Box
Formula: %D Slow = MA(%D) for period y.
Value
Descriptions
% K interval
14
%D interval
1
%D Slow
interval
3
D Averaged (%Da)
%D Average is the moving average of %D Slow. To create % D
Average you must select the number of intervals to include in the
average as well as the parameters used to create %K, %D and %D
Slow.
Stochastic Parameters Box
Formula:
%D Average = MA(%D Slow) for period z.
Chapter 6: Charts & Technical Analysis
Page 215
Reference: Eng, William. The Technical Analysis of Stocks, Options and
Futures, Probus, 1988.
Value
Description
%K interval
14
%D interval
1
%D Slow
interval
3
%D Avg.
interval
3
Stochastics Parameters
Parameters are set for stochastics through the Stochastic
Parameters dialog box. The dialog box is identical for each
stochastic because the measures are derivatives of the level above.
You need to enter parameters for the levels above but not for those
below.
Defaults: % K=5 intervals, % D=5 intervals , % D Slow=5
intervals, % D Slow Average=3 intervals.
Williams' Percentage Range (%R)
Williams' Percentage Range measures the position of the current
period's close to the range of prices over a time period. The
number is expressed in percentage terms. It is the similar to Lane's
Stochastic except it uses the low rather than the high in the
numerator. Percent R can take values between zero and 100.
RSI Parameters Dialog Box
Formula:
%R = ((H-C)/(H-L)) * 100
Page 216
Chapter 6: Charts & Technical Analysis
Variable
Description
C
The closing price for period n.
L
The lowest price over period n.
H
The highest price over period n.
n
The period length.
Reference: Kaufman, Perry, The New Commodity Trading Systems &
Methods, John Wiley, 1988.
Parameters: The period, that is number of time intervals to
include in the calculation of the range, is a user defined parameter.
RSI Parameters Dialog Box
Default: Period=5
%R Study
Chapter 6: Charts & Technical Analysis
Page 217
Relative Strength Index (RSI)
The Relative Strength Index, developed by J. Welles Wilder (New
Concepts in Technical Trading Systems, Trend Research,
Greensboro, NC, 1978) is an overbought/oversold indicator
expressed on a scale of 0 to 100. It is the ratio of the average up
closes for a certain number of time intervals divided by the sum of
the average up closes and the average down closes for the same
period. This ratio is multiplied by 100.
Formula:
RSI = 100 ' (RS/(1+RS))
Where:
RS = the ratio of the average of n period gains divided by the
absolute value of the n period losses.
Reference: Kaufman, Perry, The New Commodity Trading Systems &
Methods, John Irwin, 1988.
Parameters: The number of time intervals is a user defined
parameter.
RSI Parameters Box
Default: Period=14
Smooth Ups and Downs: RSI [X] = U [X] / ( U[X] + D[X] )
This picture displays a chart with a RSI study.
Page 218
Chapter 6: Charts & Technical Analysis
Relative Strength Index Study
Moments
The moment estimators are displayed on the first, second and third
panels of the chart window depending on their values. Moments
are measures that characterize a distribution. The monthly average
is the first moment, the measure of central tendency. The variance
is the second moment, the measure of dispersion of the
distribution. The skew is the third moment, the measure of
departure from symmetry. Kurtosis is the fourth moment, the
measure of the departure from normality in the thickness of the
tails of the distribution. Although not required, a math coprocessor
is highly recommended for calculations of moments. A math
coprocessor will speed up display of all studies.
There is also a way to average the data for any study that allows
you to set the period. For more information, please see Mean.
RealTick offers five moment estimators: Monthly Average
(AVG), Variance (VAR), Standard Deviation (SD), Skew (SKW),
and Kurtosis (KUR).
For more information on statistical moments, see any statistics or
econometrics reference book.
Chapter 6: Charts & Technical Analysis
Page 219
Mean
For any study that allows you to set the period, you can generate an
average over the complete length of available data by setting the
period to –1. This generates a single number, which will appear on
a chart as a horizontal line.
Moving averages are described separately in this chapter. Simple,
autoregressive, linear and exponential moving averages can be
selected. The autoregressive moving average allows you to
include previous estimates in the current estimate. The %AR gives
the weight to the previous period's estimate.
Monthly Average (AVG)
Monthly average is only available for daily, weekly, and monthly
charts and tables, which use daily data. This study has no
parameters. It is calculated by adding the data for each month,
then dividing by the number of days in the month. The resulting
numbers are displayed as a step chart.
Variance (VAR)
Variance is displayed in the middle panel with its values shown on
the right axis. Variance measures the volatility or dispersion of the
series. Variance can never be negative. Low values of variance
indicate little dispersion.
Formula:
Where:
P a is the simple mean of prices over the period n.
RealTick also allows you to calculate an autoregressive variance:
Where:
VAR(t) is the simple variance at time t for n periods. If the weight
is zero, the formula reduces to the simple variance above.
Page 220
Chapter 6: Charts & Technical Analysis
Parameters: Both the sample size and the autoregressive weight
serve as smoothing factors in calculating the variance. You can
change the sample size (the period) used in calculating the variance
and enter an autoregressive weight (in percentage terms) using the
Variance Parameters dialog box.
Variance Parameters Box
The following table lists the Variance parameter defaults.
Value
Default
Sample Size
15
% Weight
0
This picture displays a chart with a standard deviation study.
Variance Study
Chapter 6: Charts & Technical Analysis
Page 221
Standard Deviation (SD)
Standard deviation is the square root of variance. Standard
deviation is in the same units as the price variable itself. Standard
deviation is displayed in the second panel (middle or lower,
depending on how many studies are displayed) with its values to
the right.
Formula:
RealTick allows you to calculate an autoregressive standard
deviation:
Where:
SD t is the simple standard deviation at time t for n periods. If the
weight is zero, the formula reduces to the simple standard
deviation above.
Parameters: The standard deviation parameter box allows you to
change the period -- the number of intervals used in calculating the
standard deviation, and include a nonzero autoregressive weight.
The following table lists the standard deviation parameter defaults.
Value
Default
Sample Size
15
% Weight
0
The following picture displays a chart with a standard deviation
study.
Page 222
Chapter 6: Charts & Technical Analysis
Standard Deviation
Skew (SKW)
Skew is displayed on the third (bottom) panel. Skew can be
positive or negative. Positive skew values indicate distributions
with long tails to the right whereas negative values indicate
distributions with long tails to the left. The parameter box for
these studies is similar to that for the variance.
Formula:
Variable
Description
SD
The standard deviation.
Pa
The simple mean of prices over the period t-n to t.
RealTick allows you to calculate an autoregressive skew:
Chapter 6: Charts & Technical Analysis
Page 223
Skew(t) is the simple skew at time t for n periods. If the Weight is
zero, the formula reduces to the simple skew above.
Parameters: The skew parameter box allows you to change the
sample size (the number of periods) used in calculating the skew
and to enter an autoregressive weight (in percentage terms).
Skew Parameters Box
The following table lists the Skew parameter defaults.
Value
Default
Period
15
% Weight
0
The following picture displays a chart with a skew study.
Skew Study
Page 224
Chapter 6: Charts & Technical Analysis
Kurtosis (KUR)
Kurtosis is displayed on the third (bottom) panel. Kurtosis can be
positive or negative. Peaked distributions show positive kurtosis
and flat topped distributions show negative kurtosis.
Formula:
Where:
Pa is the simple mean of prices over the period n.
We subtract 3 to make Kurtosis symmetric around 0.
RealTick allows you to calculate an autoregressive kurtosis:
Where:
KURT t is the simple kurtosis at time t for period n. If the Weight
is zero the formula reduces to the simple kurtosis above.
Parameters: The period and the autoregressive weight can be
changed through the kurtosis parameter box.
Kurtosis Parameters
The following table lists default parameters for the Kurtosis study.
Value
Chapter 6: Charts & Technical Analysis
Default
Period
15
Weight
0
Page 225
The following picture displays a chart with a kurtosis study.
Kurtosis Study
Volume and Open Interest
The Volume and Open Interest indicators are displayed in the
second and third panels. These indicators measure the amount of
trades during a time period. The four Volume and Open Interest
studies available are: Tick Count (TCT), Volume (VOL), Open
Interest (OI), and On Balance Volume (OBV). The Volume and
Open Interest indicators have no adjustable parameters.
Tick Count (TCT)
Tick count is available for intraday bars. Tick count is the number
of ticks that occurred at each time interval. Technically, a tick
occurs whenever the price changes rather than when a trade occurs.
Tick count is displayed as a histogram in the second panel.
Volume (VOL)
The number of contracts traded is available for daily charts. Total
volume is presented as a histogram in the second panel. For tick
charts, trade volume is shown; for intraday and daily charts, the
total volume in the interval bar is shown.
Page 226
Chapter 6: Charts & Technical Analysis
Open Interest (OI)
Open interest is also available for daily charts. Open Interest is
displayed as a histogram on the second panel. Open Interest can
be overlaid on total volume. Select Open Interest before Total
Volume.
On Balance Volume (OBV)
On balance volume (Granville, Joseph E., A New Strategy of Daily
Stock Market Timing for Maximum Profit, Prentice Hall, 1976) is
a simple accumulation process. If a period closes up, its volume is
added to a total. If a period closes down, its volume is subtracted
from a total. Since on balance volume is an accumulation, it is
sensitive to the days included in the measure. There are no
adjustable parameters for the measure. On Balance Volume is
presented as a graph in the third panel.
Formula:
Variable
Description
C
The current period's closing price.
Cp
The previous period's closing price.
|C - Cp|
The absolute value of the difference between the two
closing prices.
V
The current period's volume.
Reference: Colby, Thomas, and Robert Meyers, The Encyclopedia of
Technical Market Indicators, Dow Jones Irwin, Illinois, 1988.
Price and Volume Studies
The following indicators combine price and volume: Williams'
Accumulation Distribution, Arm's Ease of Movement, and Money
Flow.
Chapter 6: Charts & Technical Analysis
Page 227
Williams' Accumulation Distribution (WAD)
Williams' Accumulation Distribution (Larry Williams, P.O. Box
8162, Ranch Santa Fe, CA 92067) is a price momentum indicator
that is weighted by volume.
Formula:
Variable
Description
C
The current period's closing price.
O
The current period's opening price.
H
The current period's high price.
L
The current period's low price.
V
The current period's volume.
Reference: Colby, Thomas & Robert Meyers, The Encyclopedia of
Technical Market Indicators, Homewood, 1988.
Parameters: The only adjustable parameter is the period.
Williams Accumulation Distribution Parameters Box
Default: Period = 15
The following picture displays a chart with a Williams
Accumulation Distribution study.
Page 228
Chapter 6: Charts & Technical Analysis
Williams’ Accumulation Distribution Study
Arms' Ease of Movement (EMV)
Arms’ Ease of Movement Indicator (Richard J. Arms, Volume
Cycles in the Stock Market: Market Timing through Equivolume
Charting, Dow Jones Irwin, Homewood, 1983) is another
momentum indicator that combines price and volume.
Formula:
Variable
Description
H
The current period's high price.
L
The current period's low price.
Hp
The previous period's high price.
Lp
The previous period's low price.
V
The current period's volume.
The measure is multiplied by 100000.
Reference: Colby, Thomas and Robert Meyers, An Encyclopedia of
Technical Market Indicators, Dow Jones Irwin, Homewood, Illinois 1988.
Chapter 6: Charts & Technical Analysis
Page 229
Parameters: A smoothed version of the EMV is available. It is
calculated as a simple moving average of the EMV. The period
length in the smoothed version is an adjustable parameter.
Ease of Movement Parameters Box
Default: Unsmoothed
Arm’s Ease of Movement Study
Money Flow (FLO)
The Money Flow study combines price and volume information.
RealTick only calculates Money Flow for tick charts. The value of
the Money Flow study can be very high, so there is a default
multiplier of 1/1000 in the Overlay dialog box.
Formula:
If the last tick is an up tick (i.e., if P(n) > P(n-1) ), then
F(n) = F(n-1) + ( P(n) * V(n) )
Page 230
Chapter 6: Charts & Technical Analysis
If the last tick is a down tick (i.e., if P(n) < P(n-1) ), then
F(n) = F(n-1) - ( P(n) * V(n) )
If the last tick is no change, then
F(n) = F(n-1)
Variable
Description
F
Money Flow
P
Price
V
Volume
Parabolic Price/Time Study
The Parabolic Time/Price study is best said to be a buy or sell
trigger or a “stop and reverse” system. The graph, which resembles
a parabola, is made up of stops. The stop is related to time and
price. It never backs up. It moves an incremental amount in the
direction of the trade. For example, if the trade is short, the stop
will move downward. If the trade is long, the stop will move
upward. Each time the price reaches a new high or low in price,
the stop accelerates. If the price reverts insignificantly, the stop
will not accelerate. If the price reverts significantly and crosses
over the stop, it’s time to trade.
Formula: The bottom formula is a translation of the top (actual)
formula.
Reference: Wilder Jr., J. Welles. New Concepts In Technical Trading
Systems. Trend Research, Greensboro, N.C.
Parameters: Trade Long or Short. Select the starting point for the
parabolic. (The entry point is where the study begins its
calculations, expressed as an offset from the beginning of the data.)
Select the Acceleration.
Chapter 6: Charts & Technical Analysis
Page 231
Parabolic Time/Price Setup Dialog Box
Value
Default
Start Study
Long
First Point
1
Acceleration
.020
The following picture displays a chart with a parabolic study.
Parabolic Study
Page 232
Chapter 6: Charts & Technical Analysis
Directional Movement Indicators (PDI, MDI, DX,
ADX)
Wilder's Directional Movement Index (J.W. Wilder, Jr, New
Concepts in Technical Trading Systems, Trend Research, P.O Box
128, McLeansville, NC 27301) is a filtering momentum that
measures movement in the up direction relative to movement in the
down direction.
Four directional movement indicators are available: Plus
Directional Movement (PDI); Minus Directional Movement
(MDI); Directional Movement Indicator (DX); Average
Directional Movement (ADX).
Formulae:
Plus Directional Movement = PDM= H-H p
Minus Directional Movement = MDM =L – L p
Variable
Description
H
The highest price of the current period.
Hp
The highest price of the previous period.
L
The lowest price of the current period.
Lp
The lowest price of the previous period.
Cp
The closing price for the previous period.
If |H-H p| > |L-L p| then DM is PDM and MDM is zero.
If |H-Hp| < |L-L p| then DM is MDM and PDM is zero.
TR = True Range = is the largest of H - L; H - C p; or L - C p
The four directional movement indicators are:
Plus Directional Movement
PDI = EMA(PDM) / EMA(TR)
Minus Directional Movement
MDI = EMA(MDM) / EMA(TR)
Directional Movement Indicator
DX = (PDI - MDI) / (PDI+ MDI)
Chapter 6: Charts & Technical Analysis
Page 233
Chapter 7: Placing Orders
This chapter discusses the different order types you can place using
RealTick. It will instruct you how to use the different windows to
place these orders. These windows include Order Book,
MarketMaker, MarketMinder, TurboOptions, and Stocks.
Order Types
Market Order
Note: Market orders
are currently
available on ARCA,
ISI, REDI, INCA,
and BTRD.
With this order type you can place a buy or sell order at the current
market price. There may be a price difference between the time
you place the order and the confirmation of the order. You will
find out the actual trading price when you receive the order
confirmation.
Example: You place an order to Buy 100 shares of Microsoft at
Market. The best offer is currently$ 65. The order may be
executed at $65 or whatever the best offer changes to while your
market order is open.
Limit Order
This order type allows you to select a specific price at which you
want your order to be executed. The order will be executed at that
price or better.
Page 234
Chapter 7: Placing Orders
Example: Microsoft is currently at $69. You place an order to
buy Microsoft at $68 or lower. When the market hits $68, or falls
below $68, the order will be executed.
MSFT is
currently at
68 3/4 a share
The market
falls to 68
The order will be filled
at this price or better
The market
does not fall
The order is not filled
You place a Limit order to buy
Microsoft at 68 a share.
Stop Market Order
Note: Stop Market
orders are currently
available on ARCA
and ISI.
With this order type, you can decide a specific price at which you
want your order to be triggered. The order then turns into a market
order and is executed at the market price.
Example: You own 1000 shares of Microsoft at $72. The current
price is $70. You place a Sell Stop Market order with a stop price
of $68. A market order will be sent once the current price reaches
or passes $68.
MSFT is
currently at 70
You own 1000 shares of
Microsoft. You place a Sell
Stop Market order at 68.
Chapter 7: Placing Orders
The market
falls to 68
The market order
will be executed
Page 235
Stop Limit Order
Note: Stop Limit
Orders are currently
available on ARCA.
This is a limit order to buy or sell at the specified limit price if the
specified stop price is reached or passed. The stop price must be
below (above) the current price if the order is a sell (buy).
Example: You own 1000 shares of Microsoft at $72. The current
price is $70. You place a Sell Stop Limit order with a stop price of
$68 and a limit price of $67. A limit order at the price of $67 will
be sent out once the current price reaches or passes $68.
Current price
reaches 68
You own 1000 shares of
Microsoft at 72 a share. You
place a Sell Stop 68 Limit 67.
Trigger Limit Order
at $67 a share
Trailing Stop
A stop market order that follows (trails) the current price with a
difference of the specified trail amount, creating a new stop market
order, as the current price moves away from the original price.
Example: You place a Trailing Stop order of 2 points as the Trail
Amount when the current price is $70, therefore your trigger price
is $68. The price increases to $71 a share. Your new trigger price
will automatically change to $69. If the price reverses and goes
down, the trailing stop will place a market sell order once it
reaches $69 a share.
Page 236
Chapter 7: Placing Orders
MSFT is
currently at 70
The market
reaches 70 3/4
but then drops
2 points
You sell the shares
The market
reaches 73 1/2
but then drops
2 points
You sell the shares
You own 1000 shares of
Microsoft. You place a Trailing
Stop order of 2 points to sell
shares of Microsoft.
PostNoPreference
The order is sent to ARCA without being preferenced out to other
Market Makers and ECNs. The order will stay on ARCA’s internal
book until it is filled.
Example: You place an order on ARCA. You check the
PostNoPref box and send the order out. It remains on the ARCA
internal book for the day.
See the Expiration section.
Preference
An Order Type used with SelectNet to designate what
MarketMaker the trader wants to preference. You can also
preference ECNs. You can preference using ARCA or SelectNet.
Note: This is not a SelectNet Broadcast.
Example: You choose ARCA or SelectNet as the trading route,
click the preference check box, specify a Market Maker or ECN
identification, then send the order to preference that participant.
You can also click on the Market Maker or ECN identification in
the Level II panel to automatically fill in the preference box.
Chapter 7: Placing Orders
Page 237
Discretionary (Proactive)
Proactive Discretionary orders are the same as Discretionary
orders. They attempt to hit/take any bid/offer that falls within the
discretionary range, and accept any preference order coming into
it. Discretionary orders do not execute outside the NBBO unless
the Show price is preferenced.
Example: You place an order with a broker to buy 1000 shares of
MSFT starting at the limit price of $71 a share. You set the
discretionary price at $72 a share. The broker buys the first 500
shares at $71 and has up until $72 a share to buy the next 500
shares. If the price gets to $72 a share, the discretionary order
turns into a limit order and remains in the book until it can be
filled.
Passive Discretionary
Passive discretionary orders execute with the street at the show
price and interact with orders within the book at the discretionary
price.
Discretion Limit
A Discretion Limit order attaches itself to a Discretionary order
and only attempts an execution against an order that falls within
your discretion range, if it is over a preset share quantity.
You place a Discretion Limit
order to buy Microsoft.
Page 238
A Proactive
Discretionary order
comes through
that fits in
your discretionary
size range and
price range.
Chapter 7: Placing Orders
Best Bid or Offer (BBO)
This order type sends a limit order with a price that equals the
current bid or offer.
Example: You choose to buy 1000 shares of MSFT. You choose
the BBO Order Type to buy at the current offer.
This Market
Maker is
offering MSFT
at 32 3/4
a share.
This Market
Maker is
offering MSFT
at 32 1/2
a share.
You place a Best Bid or Offer
(BBO) order and buy shares
from the second Market Maker
offering Microsoft at 32 1/2.
Midpoint (MID)
With this order type you can buy or sell at the midpoint between
the best bid and the best offer.
Example: You decide to buy 1000 shares of Microsoft at the
Midpoint, and to offset the midpoint by a point, to buy at one point
higher or lower than the midpoint.
Chapter 7: Placing Orders
Page 239
The best offer
for MSFT is at
74 a share
The best offer
for MSFT is at
72 a share
You place a MID (midpoint)
order to buy at the midpoint
between the best bid and best
offer at 73 a share.
BID
Your order will be sent as a limit order with a price equal to the
current best bid.
Example: You place an order to buy with the order type BID. If
the current best bid is $72, your order will be sent as a limit order
at $72.
Offer
Your order will be sent as a limit order with a price equal to the
current best offer.
Example: You place an order to sell with the order type offer. If
the current best offer is $72, your order will be sent as a limit
order at $72.
Page 240
Chapter 7: Placing Orders
The current
best offer is 72
You sell the shares
The current
best offer is 73
No order
You offer 72 for Microsoft.
TOP
The TOP price type allows you to join the top of the book quote
for the symbol you are trading. With TOP orders, buys are sent as
limit orders at the current best bid, and sells are sent as limit orders
at the current best offer.
Note: This order type is only available for BasketMinder. See the
BasketMinder section in this chapter.
Short
Note: It is not always
possible to short sell a stock.
Your Broker Dealer has to
first have that stock in
inventory before you can
make the trade. The system
may reject your order if it’s
not currently available to
short. In this case, contact
your Broker Dealer.
Chapter 7: Placing Orders
Short is borrowing a security (or commodity futures contract) from
a broker and selling it, with the understanding that it must later be
bought back (hopefully at a lower price) and returned to the broker.
Example: You borrow 1000 shares of Microsoft from a broker
dealer. You sell short the shares you borrowed and buy the 1000
shares back at a lower price to profit the difference. You then
return the 1000 shares.
Page 241
The current
best offer is 73
MSFT is
currently at 73
You buy back the shares
at 71, return the shares to
the Broker Dealer, and
keep the difference.
You borrow 1000 shares
from a Broker Dealer and
sell the shares at 73
Conditional Order
This order will be executed only if certain conditions are met.
Example: You make a conditional order to sell 1,000 shares of
Microsoft when it reaches a particular price, if these conditions
are not met, the order will not be executed.
MSFT is
currently at
72 a share
The market
falls to 71
The order is placed.
The market
rises to 72
The order sits in
RealTick until the
condition is met
You place a conditional
order to buy Microsoft
once it falls to 71.
Note: This function is
not available to all
users. Please contact
your Broker Dealer if
you have any
questions.
Page 242
Basket Order
A basket order is a group of securities brought together with the
intention of being bought or sold all at once.
Example: You decide to buy a group of internet stocks at one time,
so you place a basket order.
Chapter 7: Placing Orders
3000 shares
of ATHM
1000 share
of AOL
1000 shares
of AMZN
2000 shares
of CMGI
You place a Basket Order
to buy these Internet
stocks at one time.
1500 shares
of CSCO
Reserve Order
Note: A reserve order
is considered one
order.
An order that allows you to buy or sell large quantities of a
security in increments, so the whole amount traded is not disclosed
to the market at one time. This order type can only be placed on
ARCA.
Example: You decide to buy 2,000 shares of MSFT, so you place a
reserve order to buy MSFT at 100 shares at a time. This way, the
2,000 shares will not be disclosed to the market at one time.
Random Reserve
Random Reserve orders vary the display size on a Reserve order.
For example, a reserve book order with a display quantity of 2000
shares and a random reserve value of 200 sends orders from 1800
to 2200 shares.
Chapter 7: Placing Orders
Page 243
Staged Order
Sometimes referred to as an Order ticket, a Staged order is an order
that authorizes further trading for a particular symbol up to the
quantity specified in the Staged order. The Staged order also
provides cumulative statistics on all the fills that are associated
with it. When a user is configured to use this feature, no orders
may be placed, unless they correspond to a live Staged order in
terms of symbol, buy/sell, and quantity. A Staged order may also
have a price restriction placed on it. Staged orders are intended for
an environment where decisions on what and how much to buy or
sell are handled separately from the trade entry itself. Staged
orders provide the following features:
o
Authorization of all orders entered by the trader to eliminate
errors in size or buy/sell side.
o
Aggregate statistics show you at a glance the state of the
Staged orders so you do not have to sort through all the trade
detail.
Note: The Staged order system can be integrated with other Order
Management Systems. Please contact your System Administrator
for more details.
Tracking Order
With a tracking order, you buy at the bid and sell at the offer, on
the NBBO, so it changes as the market moves. Each tracking order
uses a trade size and a reserve size. The trade size represents the
number of shares eligible to be filled at each price level. The order
Page 244
Chapter 7: Placing Orders
is live until the reserve quantity is filled. These orders are never
routed outside of ArcaEx and are only valid for the Core session.
Cross Order
Clean cross: without
interaction with
standing orders.
A Cross order is a two-sided order with instructions to match a
buyer and a seller at a specified price (the cross price). Cross
orders are filled internally on ArcaEx. Because of ArcaEx’s pricetime priority, Cross orders may interact with standing orders on the
ArcaEx Book.
For example, if an ETP holder wants to cross 1,000 shares of ABC
at 10.15, a Cross order can be submitted to ArcaEx at 10.15. If
there is a bid in the ARCA Book for ABC at 10.15 for 500 shares,
ArcaEx will include the 500 share Book order in the cross. The
ETP holder will sell 500 shares of ABC against the Book order and
cross the remaining 500 shares. If the cross price is inside the
bid/ask spread, the ETP holder will execute a clean cross without
interacting with the Book.
Inside Limit
Inside Limit orders follow just the NBBO and will not fill at the
next tier until all quotes at the NBBO are exhausted. Inside Limit
is available on the combined ARCA/REDI Exchange.
Pegging Orders
Pegging orders follow the NBBO or a target value. You can set
the price to match the NBBO or you can offset to trail or lead the
NBBO or your target value. There are several different types of
pegging orders: Basic Pegging, Reverse Pegging, Mid Pegging,
Pegging with a Discretion Component, Pegging with a Discretion
Limit, Pegging with Limits, and Pegging with an Offset.
Chapter 7: Placing Orders
Page 245
Basic Pegging buys at the bid and sells at the offer. When buying,
you will join the best bid. When selling, you will join the best
offer. The peg offset is subtracted from the best bid and added to
the best offer.
The NBBO is
$32 for MSFT.
You place a basic Peg order
to sell Microsoft.
You join the
best offer and
sell MSFT at $32.
Reverse Pegging buys at the best offer and sells at the best bid.
You may also add a Peg value to the order. This Peg value is
added to the best offer on buy orders and subtracted from the best
bid on sell orders.
Mid Pegging ensures that your bid or offer is halfway between the
current NBBO. You may also add a Peg value to the order.
Pegging with a Discretion Component allows you to add a
discretionary offset to your pegged order. It participates on the bid
side while simultaneously taking certain offers when buying. If
selling, you will join the offer and hit bids within the discretion
amount.
MSFT is
at $32.38
a share.
You place a Peg Bid to
buy Microsoft.
You add a discretionary
offset of negative .01.
You buy MSFT at
the best bid and
hit any orders
at $32.37.
Pegging with a Discretion Limit Size allows you to add a
discretion limit size to a pegged order.
Pegging with Limits allows you to add a limit top or a limit
bottom.
Page 246
Chapter 7: Placing Orders
Volume
The volume defines how you want the order to be filled.
All or Nothing (AON)
All or Nothing - round-lot market or limit-price orders that must be
executed in its entirety or not at all.
Example: You place an AON order to buy 100 shares of Microsoft
at a particular price. If the order cannot be completely filled, it
will sit in the book until it is eligible to become executed, otherwise
it will cancel at the end of the trading session.
Partial
This is an order that can be filled partly instead of in its entirety.
Often times there will be several partial orders until the order is
completed entirely.
Example: You place a Partial order to buy 1000 shares of
Microsoft at a particular price. 100 of the shares are filled. The
other shares sit in the book until it is eligible to become executed,
otherwise they will cancel at the end of the trading session.
Sweep Reserve
The ARCA Sweep Reserve executes your marketable order using
the reserving quantity and posts the balance using the show
amount. If multiple market participants are on the inside bid or
offer, ARCA splits up the reserve quantity and sweeps the inside
market simultaneously. Non-marketable orders display the show
quantity.
Expirations
Expiration defines the period when an order is valid.
Day
A buy or sell order that expires at the end of regular market hours,
if it is not executed.
Chapter 7: Placing Orders
Page 247
Example: You place an order to buy 1000 shares of Microsoft at a
particular price. You set the expiration to Day, so if the order is
not filled that day, it is canceled.
Note: Not all trading
routes support every
expiration type. Contact
your Broker Dealer for
more information.
Day +
A buy or sell order that will expire after extended trading hours on
the trading day it was entered, if it is not executed.
Example: You place an order to buy 1000 shares of Microsoft at a
particular price. This sets the expiration to Day+, so if the order
is not filled that day, including during extended trading hours, the
order will be canceled.
Good Until Canceled (GTC)
Good Until Canceled – An order to buy or sell that remains in
effect until it is either executed or canceled. This is currently
available on ISI.
Example: You place an order for Microsoft at a particular price.
The trader sets the expiration to GTC, so that the order will not
cancel until you decide to cancel the order.
Immediate or Cancel (IOC)
Immediate or Cancel -- A market or limit-price order executed in
whole or in part as soon as it is represented in the market. Any
portion not executed is canceled.
Example: You place an order to buy 1000 shares of Microsoft.
When the order enters the market, only 100 shares can be filled
and the other 900 are canceled.
NOW℠
An order that will be filled immediately or canceled immediately,
and can only be placed on ARCA. If ARCA cannot fill the order,
the order goes to major ECNs, where it is either filled by one ECN,
split up amongst several ECNs in order to be filled, or canceled.
Example: You place an order to buy Microsoft at a particular
price. You set the expiration to NOW, so either ARCA, ISLD,
REDI, or INCA will fill the order.
Page 248
Chapter 7: Placing Orders
Market Order Auction (MOA)
ArcaEx supports both market and limit order auctions. All users
who have access to the ArcaEx route can participate in the
Auction. Both are single-priced Dutch auctions that match buy
and sell orders at the price that maximizes the amount of tradeable
stock.
The Limit Order Auction is held at 8:00 AM EST, when limit
orders are matched at the Indicative Match Price – the price at
which the maximum volume of orders is executable at auction
time. Unexecuted limit orders become eligible for the opening
session immediately upon conclusion of the Limit Order Auction.
Users may begin entering market and limit orders for the Market
Order Auction at 8:00 AM EST. The Market Order Auction takes
place at 9:30 AM EST and serves as a bridge between the opening
session. Executions resulting from the Market Order Auction are
reported at the conclusion of the auction, and the core trading
session then commences.
MarketMinder Column Layout
Suitability
There are six suitability rules that can affect RealTick users. These
rules include Transaction Cost, Transaction Size, Trade Frequency,
Price Range, Single Item Portfolio Balancing, and Portfolio
Balancing. These rules are risk-management tools that restrict
your customers from executing an order when violating a rule.
Transaction Cost: Restricts or warns the user if the transaction
costs exceeds suitability limit per transaction.
Transaction Size: Restricts or warns a user if transaction size
exceeds suitability limit per transaction.
Trade Frequency: Restricts or warns a user if they have exceeded
the maximum number of trades per day.
Price Range: Restricts or warns a user if the price on the trade is
greater than a percentage or absolute amount from the last sale
(market).
Chapter 7: Placing Orders
Page 249
Single Item Portfolio Balancing: Restricts or warns the user if a
position in his portfolio exceed x% or absolute value of the entire
value.
Portfolio Balancing: Restricts or warns the user if a security type
in his portfolio exceeds x% or absolute value of the entire value of
the portfolio.
RealTick Windows with Order Entry
RealTick offers Order Entry with several windows. You can
monitor market data and trade from several of the windows.
Order Entry Screen (OES)
Note: If you would like a
description of each order
entry field in the OES
window, refer to the online
help.
Send an order using the Order Entry screen. You can send orders
by setting the parameters in the Order Entry screen and clicking an
order button. If you would like a description of each order entry
field in this OES screen, refer to the online help.
Order Book
The Order Book window displays detailed information about each
transaction placed in RealTick. You can view an order you placed
from any OES screen throughout the day in the Order Book. For
example, if you placed an order in a MarketMaker window, you
can view the details of the order in Order Book. You can also
place orders from this window.
Access the Order Book by selecting Order Book on the Design
menu or double-clicking the Level II panel in MarketMaker.
Order Book Window
MarketMaker
Page 250
Chapter 7: Placing Orders
There are several different OES layouts in the MarketMaker Order
Entry screen. You can choose from Standard, Standard 2, Mini,
Mini 2, and Full. Each layout is setup differently. Some of the
layouts include more options than others. Look at the different
OES layouts and see which layout you would like to use to trade.
Note: Not all the Order
Entry layouts are the
same.
Standard Layout
Standard 2 Layout
Mini Layout
Mini 2 Layout
Chapter 7: Placing Orders
Page 251
Full Layout
MarketMinder
There are several different OES layouts available in
MarketMinder. Each layout is set up differently. Look at the
different layouts and see which one you would like to use to trade.
MarketMinder has full trading capabilities.
Standard Layout
Mini Layout
Mini 2 Layout
Page 252
Chapter 7: Placing Orders
PEG Layout
TurboOptions
Buy and sell options from the advanced option’s quote window.
This window requires that you have Options Quote data. If you
have any questions, please contact your Broker Dealer.
TurboOptions Window
Stocks
The OES screen in Stocks can be found on the MarketMinder tab.
You can buy and sell from this tab just like you can from a Minder.
Please see the MarketMinder section in this chapter to learn more
about trading from this window.
Placing Orders
Buy from the Order Entry Screen in Order Book
From the Order Book, MarketMaker, MarketMinder,
TurboOptions, or Stocks window, you can place a Limit, Market,
Chapter 7: Placing Orders
Page 253
Stop-Market, Stop-Limit, Trailing Stop, PostNoPref,
Discretionary, Best Bid or Offer, MID, Bid, Offer, Conditional, or
Deferred order.
Note: Trailing Stop,
PostNoPref, and
Discretionary are
currently available on
ARCA.
This set of instructions uses the Order Book window. Any of the
windows that offer Order Entry have a generic Show Order Entry
Screen command and can buy.
1.
Click Show Order Entry Screen on the Order Book menu.
The system displays the Order Entry fields.
Order Book with Order Entry Fields
2.
Type the stock you want to purchase in the Stock field.
3.
Choose the type of trade you want from the drop-down list
available in the Price type field. If you choose a Limit Order
(LMT), you must enter a price in the Price field.
4.
Type the amount of trade you want to buy in the Volume
field.
5.
Choose the volume type (partial or all or none) from the
drop-down list available in the Quantity box.
6.
Right-click the Buy button and select when you want the order
to expire. You can choose IOC, GTC, or Day.
7.
Choose the type of payment from the drop-down list in the
Account Type field. You can choose either Cash or Margin.
Note: If the command button says Sell, right-click the command
button and select Buy.
8.
Click Buy.
The system displays the Select Trade Route dialog box.
9.
Page 254
Choose the exchange from the drop-down list available in the
Trade Route field.
Chapter 7: Placing Orders
10. Click OK.
The system places the order.
Sell from the Order Entry Screen in MarketMaker
Hint: Click any market
participant in the Level
II panel of the
MarketMaker window to
automatically preference
that participant for
routes that support
preferencing, such as
SelectNet and ARCA.
This set of instructions uses the MarketMaker window. Any of the
windows that offer Order Entry have a generic Show Order Entry
Screen command.
Note: Press F7 on your keyboard to quickly open the Order Entry
Screen.
1.
Select Order Entry Screen from the Show Windows submenu on the MarketMakers menu.
The system displays the OES screen.
MarketMaker Window
2.
Select an OES layout, Standard, Standard 2, Mini, Mini 2,
or Full.
3.
Click the Market Maker of the price you want to sell.
The price appears in the Price field.
4.
Chapter 7: Placing Orders
Enter the amount of trade you want to sell in the Volume
field.
Page 255
5.
Choose the type of trade you want from the drop-down list
available in the Order Type field. If you choose a Limit
Order (LMT), you must enter a price in the Price field.
6.
Choose the volume type (partial or all or none) from the
drop-down list available in the Vol Type field.
Note: If you chose the Mini OES layout, select the Volume Type
from the OES layout drop-down menu.
7.
Choose when you want this order to expire from the dropdown list available in the Expiration field.
8.
Click the Time In Force (ellipse) button.
The Time In Force dialog box will appear.
Time In Force Dialog Box
9.
Warning: Selecting the
incorrect Trade Route
can result in the order
being rejected or sent to
the wrong destination.
Click the Specify Time In Force option button and select the
session.
10. Click OK.
11. Select the trading route from the Route field.
12. Choose your account type from the drop-down list available in
the Acct Type field.
Note: If you chose the Mini OES layout, select the Account Type
from the OES layout drop-down menu.
13. Click the Sell button.
Hint: Trigger the
deferred orders in an
OrderMinder. Rightclick a managed order
and select Activate.
Page 256
The system places the order.
Place a Deferred Order from the Order Book
Deferred orders are orders that sit in the order book until triggered.
You must manually trigger the order yourself before it is sent.
Chapter 7: Placing Orders
This set of instructions uses the Order Book window. Any of the
windows that offer Order Entry have a generic Show Order Entry
Screen command and can place a Deferred Order.
1.
Click Show Order Entry Screen on the Order Book menu.
The system displays the Order Entry fields.
2.
Click the Deferred Order check box.
3.
Click the Buy button if you’d like to purchase stock. Click the
Sell button if you’d like to sell stock.
The Enter Conditional Order dialog box will appear.
Note: You can place a
Deferred order in Order
Book without having to
access the Enter
Conditional Order
dialog box. Just click the
Deferred check box, and
click Buy or Sell,
depending on your trade.
The order will be placed
in the Order Book.
Enter Conditional Order Dialog Box
4.
In the Order to Execute box, click Buy if you are purchasing
the stock or Sell if you are selling the stock.
5.
Click Place Order.
The system will place the Deferred order in the Order Book.
Place a Conditional Order from MarketMaker
See Add a Sound Alert
to a Conditional Order
in this chapter.
Chapter 7: Placing Orders
RealTick enables you to place an order that will automatically be
sent to the exchange ONLY after specific conditions you set have
been met in the market. For example, you can set the condition to
sell your shares of Microsoft once the price reaches a specific
amount. The exchanges do not receive your order until your
conditions have been met. However, if you close RealTick or
experience a power outage, the conditional order is erased! As a
Page 257
result, if RealTick is closed, the conditional order will not be
placed, even when the conditions have been met.
This set of instructions uses the MarketMaker window. Any of the
windows that offer Order Entry have a generic Show Order Entry
Screen command and can place a Conditional Order.
1.
Select Order Entry Screen from the Show Windows submenu on the MarketMaker menu.
The system displays Order Entry screen.
2.
Select the OES layout, Standard, Standard 2, Mini, Mini 2,
or Full.
3.
Click the MarketMaker of the price you want to buy or sell.
The price appears in the Price field.
4.
Click the Conditional Order check box in the Order
Options frame.
5.
Click the Buy button if you are purchasing the stock, or click
the Sell button if you are selling the stock.
The system displays the Enter Conditional Order dialog
box.
Enter Conditional Order Dialog Box
6.
Page 258
Choose the value you want RealTick to monitor from the
drop-down list in the Data Item field. For example, you can
choose Last Price or Bid.
Chapter 7: Placing Orders
7.
Choose the condition (greater than, less than, equal to) from
the drop-down list in the Condition field.
8.
Enter the amount you want to monitor in the Price field.
9.
Enter the amount of trade you want to buy or sell in the
Volume field.
10. Choose the volume type (Partial or AON) from the dropdown list available in the Vol Type field.
11. Choose the type of trade you want from the drop-down list
available in the Type field. If you choose a Limit Order
(LMT), you must enter a price in the Price field.
12. Choose when you want this order to expire from the dropdown list available in the Expiration field.
13. Click the Buy button if you are purchasing the stock, or click
the Sell button if you are selling the stock.
14. Click the Place Order button.
Note: As conditional orders
are held in RealTick, closing
the application, losing
connectivity to the order
servers, losing power, and
any other situation that
prevents RealTick from
operating correctly, will
result in the conditional order
not to be triggered. Contact
your Broker Dealer if you
have any questions.
The system displays the Confirm Order dialog box.
Note: The Confirm Order dialog box will appear only if you select
Confirm All Trades on the Warnings/Confirmations tab on the
Order Entry Properties dialog box.
15. Click OK.
The system places the order with the exchange only after the
conditions have been met.
Note: If you close RealTick, you automatically cancel the
conditional order. The order will NOT be placed. You will have to
load the conditional order when you restart RealTick.
Load a Conditional Order
If you close RealTick while there is a Conditional order that hasn’t
yet been triggered, you’ll have to load the Conditional order when
you restart RealTick if you still want to place the order.
1.
Login to RealTick.
The Load Conditional Orders dialog box will appear.
Chapter 7: Placing Orders
Page 259
Load Conditional Orders Dialog Box
2.
Click the Conditional order(s) you would like to load.
3.
Click Load.
4.
Open the Order Book and the Conditional order(s) will be
displayed.
The order(s) will sit in the Order Book until the condition is
met.
Place a Reserve Order
Reserve orders allow you to buy or sell large amounts of a security
in increments so the whole amount being traded is not disclosed to
the market. Reserve orders are only available on ARCA.
Note: By default, the
Show field and the
Reserve field have the
same volume. Change
each field separately
or change the defaults
in the Order Entry
Properties menu.
Page 260
This set of instructions uses the MarketMinder window. Any
window that offers Order Entry has a generic Show Order Entry
Screen command and can place a Reserve order.
1.
Click Show Order Entry Screen on the MarketMinder
menu.
The Order Entry screen will appear.
Chapter 7: Placing Orders
MarketMinder Order Entry Screen
2.
Select the trade route from the Route drop-down list.
The Reserve Amount check box will activate.
3.
Click the Reserve Amount check box.
The Reserve Amount field will activate.
4.
Type the reserve amount.
5.
Type the Show amount in the Show field.
6.
Click Buy if you are purchasing the stock or click Sell if you
are selling the stock.
The system will buy or sell in increments of the Show amount
up to the Reserve amount.
Place a Track Bid or a Track Offer
This Order Type is only available with ArcaEx.
Hint: Use the
MarketMaker’s My
Order feature to know
where your tracking
order stands in relation
to the rest of the book.
Chapter 7: Placing Orders
1.
Click Show Order Entry Screen on the MarketMaker
menu.
The system displays the Order Entry panel.
2.
Select Track Bid to buy or Track Offer to sell from the Price
Type field.
Page 261
The system automatically selects Core as your expiration.
Order Entry Panel
3.
Click the Reserve Amt. check box.
The Volume field will change to the Trade Size field.
4.
Type the total amount you would like to buy or sell in the
Reserve Amt. field or use the spin buttons.
5.
Type the trading amount in the Show field or use the arrows.
6.
Select the type of payment from the Account Type drop-down
field.
7.
Click Buy for track bid or click Sell for track offer.
The order is placed.
Place a Cross Order
Cross orders are available in RealTick’s MarketMaker and IOI
windows.
1.
From the Standard OES layout in a MarketMaker, select a
Price Type.
2.
Select an account type from the Account Type drop-down
list.
3.
Select Cross from the MarketMaker OES drop-down list.
The Cross OES layout will appear.
Order Entry Screen
Page 262
4.
If the Price field is activated, select the price.
5.
Select the volume in the Volume spin box.
6.
Select the route from the Route drop-down box.
7.
Click Cross.
Chapter 7: Placing Orders
The order is placed.
Place a Market or Limit Order Auction Order
1.
Click Show Order Entry Screen on the MarketMinder
menu.
The Order Entry Screen will appear.
2.
Select Market or Limit in the Price Type field.
3.
Select MOA from the Expiration drop-down list.
Order Entry Screen
4.
Configure the remaining part of the order.
5.
Click Buy to buy or Sell to sell.
The order is placed.
Place a Sweep Reserve Order
1.
Select Order Entry Properties on the MarketMaker menu.
2.
Click the Miscellaneous tab.
3.
Click the Use Arca Sweep Reserve check box.
4.
Click OK.
Order Entry Properties Dialog Box
Chapter 7: Placing Orders
Page 263
Place an Inside Limit Order
1.
From the OES panel on the MarketMinder window, select
Inside Limit from the Price Type drop-down field.
MarketMaker Window
2.
Select the ARCA route from the Route drop-down field.
3.
Type the amount of shares you would like to trade in the
Volume spin box, or use the arrows.
4.
Select the expiration from the Expiration drop-down field.
5.
Click the Buy button to buy the stock, or click Sell to sell the
stock.
The order is placed.
Place a Passive Discretionary Order
1.
Page 264
From the OES panel on the MarketMaker window, select
Passive Discretionary from the Price Type drop-down field.
Chapter 7: Placing Orders
MarketMaker Window
2.
Type the discretionary price in the Discretionary spin box, or
use the arrows.
3.
Type the show price in the Price field.
4.
Select the ARCA route from the Route drop-down field.
5.
Type the amount of shares you would like to trade in the
Volume spin box, or use the arrows.
6.
Select the expiration from the Expiration drop-down field.
7.
Click the Buy button to buy the stock, or click Sell to sell the
stock.
The order is placed.
Select a Discretion Limit Range
1.
Click Order Entry Properties on the MarketMaker menu.
The Order Entry Properties dialog box will appear.
Chapter 7: Placing Orders
Page 265
Order Entry Properties Dialog Box
2.
Click the Default Discretion Limit check box.
The spin box will activate.
3.
Type or select the number of shares in your Discretionary
range using the spin buttons.
4.
Click OK.
The discretionary range is set.
Place a Basic Pegging Order
1.
Select Peg as the OES layout from the MarketMaker OES
panel.
The Peg OES layout will appear.
Page 266
Chapter 7: Placing Orders
MarketMaker Window
Note: You can sell on
a Peg Bid and buy on
a Peg Offer.
2.
Select Peg Bid to buy, Peg Offer to sell, or Peg Mid from the
Price Type drop-down field.
3.
Select ARCA as the route from the Route drop-down field.
4.
Type the amount of shares you would like to trade in the
Volume spin box, or use the arrows.
5.
Type the offset price in the Peg Offset spin box, or use the
arrows.
6.
Type the limit price or select the price using the arrows.
7.
Click Buy if you are placing a Peg Bid or click Sell if you are
placing a Peg Offer.
The order is placed in the Order Book.
Random Reserve Order
Set the Random Reserve
1.
Select Order Entry Properties from the MarketMaker
menu.
The Order Entry Properties dialog box will appear.
Chapter 7: Placing Orders
Page 267
Order Entry Properties Dialog Box
2.
Click the Default Random Reserve Delta check box.
The spin box will activate.
3.
Type the random reserve amount or use the spin buttons.
4.
Click OK.
The default Random Reserve amount is set.
Place a Random Reserve Order
1.
On the OES panel of the MarketMaker, click the Reserve
Amt. check box.
The Reserve Amt. field will activate.
Page 268
2.
Type the reserve amount in the Reserve Amt. field or use the
spin buttons.
3.
Right-click the OES panel and select Random Reserve Delta
from the right-click menu.
Chapter 7: Placing Orders
OES Right-Click Menu
4.
Select the price type from the Price Type field. If you choose
a Limit order, you must specify the price in the Price field.
5.
Click Buy to buy, or click Sell to sell.
The order is placed.
BasketMinder
Use Basket orders to trade more than one stock at a time. Trade
“baskets” of securities as if you were trading a single instrument or
an index.
Setup the Basket Order Entry Window
1.
Note: BasketMinder is
not available for all
users. Please contact
your Broker/Dealer if
you have any
questions.
Click Setup on the MarketMinder menu.
The Minder Setup dialog box will appear.
2.
Click the Baskets option button.
3.
Type the symbols you want to trade in the Selected Symbols
field, or select a symbol file.
4.
Click OK.
A BasketMinder will appear.
Chapter 7: Placing Orders
Page 269
BasketMinder Window
5.
Double-click each field in the Weight column to activate the
field and type the number of shares you would like to trade for
each symbol.
6.
Press Enter.
The weight is added to the symbol.
Configure a Standard BasketMinder Order
In a standard BasketMinder, all the symbols are configured with
the same order parameters.
1.
Select the type of trade you want from the drop-down list
available in the Price Type field.
2.
Select the volume type from the drop-down list available in
the Volume Type field.
3.
Select the Trading Route from the Route field.
4.
Select when you want this order to expire from the drop-down
list available in the Expiration field.
5.
If you’d like to buy or sell at the bid/offer price, select
Bid/Offer from the Price Type drop-down list.
The Offset field will activate.
6.
Type or select the Offset value.
7.
If you’d like to sell short, click Short Sells.
If this button is checked, all sales will be marked as short sells.
8.
If you’d like the lots to be rounded to the nearest hundred
shares, click the No Odd Lots check box.
This will enable the Round Down check box.
Page 270
Chapter 7: Placing Orders
9.
If you’d like to always round the lots down, click Round
Down.
Advanced Nasdaq Configuration
With Nasdaq stocks, you can use the Basket Order parameters or
you can customize Nasdaq orders separately. Use this procedure
for more control over Nasdaq orders.
1.
Click Configure in the Nasdaq Orders box.
The Select NASDAQ Order Parameters box will appear.
Select NASDAQ Order Parameters
2.
Click Use Basket Order Parameters if you’d like to use the
Basket Order parameters, or click Customize Order
Parameters if you’d like to configure Nasdaq orders
separately.
3.
Select the type of trade you want from the drop-down list
available in the Price Type field.
4.
If you’d like to buy or sell at the bid/offer price, select BBO.
The Offset (+in/-out) field will activate.
5.
Select or type a value in the Offset field.
6.
Select the volume type (partial) from the drop-down list
available in the Volume Type field.
7.
Select the Trading Route.
8.
Select when you want this order to expire from the drop-down
list available in the Expiration field.
9.
If you’d like to sell short, click Short Sells.
If this button is checked, all sells will be marked as short sells.
10. Click OK.
The Nasdaq BasketMinder parameters are customized.
Chapter 7: Placing Orders
Page 271
Advanced Listed Configuration
With Listed stocks, you can use the Basket Order parameters or
you can customize Listed orders separately. Use this procedure for
more control over the Listed Stock.
1.
Click Configure in the Listed Orders box.
The Select Listed Order Parameters box will appear.
Selected Listed Order Parameters
2.
Click Use Basket Order Parameters if you’d like to use the
Basket Order parameters, or click Customize Order
Parameters if you’d like to configure Listed orders separately.
3.
Select the type of trade you want from the drop-down list
available in the Price Type field.
4.
If you’d like to buy or sell at the bid/offer price, select BBO.
The Offset (+in/-out) field will activate.
5.
Select or type a value in the Offset field.
6.
Select a volume type (partial) from the drop-down list
available in the Volume Type field.
7.
Select the Trading Route.
8.
Select when you want this order to expire from the drop-down
list available in the Expiration field.
9.
If you’d like to sell short, click Short Sells.
If this button is checked, all sells will be marked as short sells.
10. Click OK.
The Listed BasketMinder parameters are customized.
Customize Order Parameters
You can configure symbols separately in a BasketMinder.
Page 272
Chapter 7: Placing Orders
1.
Right-click the Details field of a symbol you would like to
configure its order parameters.
A pop-up menu will appear.
2.
Click Configure Order.
The Select Symbol Name Order Parameters box will
appear.
Select Symbol Name Order Parameters Dialog Box
3.
Click Customize Order Parameters.
4.
Select the type of trade you want from the drop-down list
available in the Price Type field.
5.
Select a volume type (partial) from the drop-down list
available in the Volume Type field.
6.
Select the Trading Route.
7.
Select when you want this order to expire from the drop-down
list available in the Expiration field.
8.
If you’d like to buy or sell at the bid/offer price, select BBO.
The Offset (+in/-out) field will activate.
9.
Select or type a value in the Offset field.
10. If you’d like to sell short, click Short Sells.
If this button is checked, all sells will be marked as short sells.
11. Click OK.
Basket Quantity/Execution
Choose how you would like to execute the basket.
1.
Chapter 7: Placing Orders
Type the name of the basket in the Basket Tag field.
Page 273
The Basket Tag will be passed along with each order placed,
and can be used in the order history window to distinguish
orders placed from different baskets.
2.
To buy/sell the specified quantity of baskets based purely on
the weights, click the Delta option button.
The Delta text box will activate.
3.
Type or select a multiple of the weight. See note.
-OR4.
To use your current position to determine how much to
buy/sell, click the Target option button.
The Target text box will activate.
Note: The Target model targets the number of shares you wish to
own of a specific stock. It looks at your current position, and then
buys/sells accordingly. For example, your weight is 100 for MSFT,
and you currently have 150 shares of MSFT. If you choose a
Target of 1, the system will sell 50 shares to equal the 100-share
weight for MSFT.
The Delta model is a multiplier of the weight. It purchases or sells
based on the weight of a symbol, regardless of your current
position.
5.
Type or select the number of baskets you wish to own.
6.
Click Recalculate.
The Execute Basket button will activate and the system will
calculate the cost of the basket.
7.
Click Execute Basket.
The system places the basket order.
Limit Market Exposure
You can limit the cost of your basket.
There are two ways you can choose to limit the cost of your basket,
Partition Rows or Slice Shares. The Partition Rows feature fills
the order starting with the most expensive symbol to the least
expensive symbol until the cost of the basket is met. Sometimes
not all symbols are needed to meet the cost.
The Slice Shares feature fills the order by evenly distributing the
cost of the basket amongst all the symbols.
Page 274
Chapter 7: Placing Orders
1.
Click Limit Market Exposure.
The Limit Market Exposure box will activate.
2.
Type or select the maximum cost of your basket in the Max.
Cost Buy/Sells spin box.
3.
Click Partition Rows or Slice Shares.
See Basket/Quantity Execution to place the order.
Using Accounts
Show Account Balance
Keep track of your account balance while you purchase and sell
securities.
Note: Please note that
each window within
RealTick can be
asserted with a
separate account when
placing an order.
Make sure you’ve
selected the correct
account.
1.
Click Show Account Balance on the Order Book menu.
The Account Balance panel will appear.
Show Account Balance Panel
2.
Click the trade you would like to see its balance.
The account balance will appear.
Trade with Another Account
1.
Click Select Account on the Order Book menu.
The system displays the Select Account dialog box.
2.
Click the appropriate account in the Available Accounts list
box.
3.
Click OK.
The system displays the chosen account in the Order Book
window title bar.
Canceling Orders
You can cancel orders when they are Live, Partially Filled, and
Pending.
Chapter 7: Placing Orders
Page 275
There are three ways to cancel a pending order from the Order
Book window: Cancel Now!!, Cancel Order, and Quick DoubleClick Cancels. The Cancel Now!! and Cancel Order features can
both be found by a right-click over a pending order. Cancel Now!!
cancels the pending order immediately, while Cancel Order opens
the Cancel Order dialog box.
The third method of order cancellation is the Quick Double-Click
Cancels. If enabled, you can cancel any pending order by doubleclicking the order in the upper panel of the Order Book window.
This feature is enabled if you have Confirm All Trades enabled in
the Options tab of the Order Entry Properties screen.
Please understand if you enable Confirm All Trades in the
Warnings and Confirmations tab of the Order Entry Properties
screen, RealTick will confirm (or reconfirm, if you use Cancel
Order) your cancellations as well as all orders.
Quick Double-Click Cancel
You can easily cancel an order by just double-clicking the order in
the OrderBook, making canceling orders fast and easy.
1.
Click Setup on the Order Book menu.
The OES Setup dialog box will appear.
OES Setup Dialog Box
2.
Click Quick Double-Click Cancels.
3.
Click OK.
The OES Setup dialog box will close.
4.
Page 276
Double-click a pending order (red text) in the upper panel.
Chapter 7: Placing Orders
o
If Confirm All Trades is not enabled, a cancel request will be
sent out immediately.
o
If Confirm All Trades is enabled in the
Warnings/Confirmations tab of the Order Entry Properties
dialog box, a confirmation dialog box will appear.
5.
Click OK.
A cancel request will be sent.
Cancel Using Cancel Now!!
1.
Right-click a pending order (red text) in the upper panel.
The system displays the right mouse button menu.
2.
Click Cancel Now!!
o
If Confirm All Trades is not enabled, the order will be
canceled immediately.
o
If Confirm All Trades is enabled in the
Warnings/Confirmations tab of the Order Book Properties
dialog box, a confirmation dialog box will appear.
Confirm Cancel Dialog Box
3.
Click OK.
A cancel request will be sent.
Cancel Using Cancel Order
1.
Right-click a pending order (red text) in the upper panel.
The system displays the right mouse button menu.
2.
Click Cancel Order.
The Cancel Order dialog box will appear.
3.
Chapter 7: Placing Orders
Check the parameters quickly, and if it is the correct order,
click Cancel Order.
Page 277
o
If Confirm All Trades is not enabled, a cancel request will be
sent.
o
If Confirm All Trades is enabled in the Options tab of the
Order Book Properties dialog box, a second confirmation
dialog box will appear.
4.
Click OK.
A cancel request will be sent.
Confirm All Trades
RealTick allows you to confirm an order or to confirm a cancel
order before the system follows through with the order. This is an
extra “are you sure?” confirmation, perhaps if you accidentally
click the sell or buy button before you are ready.
1.
Click Order Entry Properties on the Order Book menu.
The Order Entry Properties dialog box will appear.
2.
Click the Warnings/Confirmations tab.
The Warnings/Confirmations tab will appear.
3.
Click Confirm All Trades.
Order Entry Properties Dialog Box
4.
Click OK.
Confirm All Trades is activated.
Page 278
Chapter 7: Placing Orders
Setting Order Entry Defaults for Quick Trading
The Order Entry Properties command opens the Order Entry
Properties dialog box. The six tabs of this dialog box (Actions,
Options, Managed Orders, Routing, Event Sounds, and
Warnings/Confirmations) enable you to create and edit Order
Actions (also known as Hot Keys); configure order defaults;
determine your price and volume increments; configure reserve
order defaults; determine the default routing for various types of
securities; set sounds to play when trading events occur, and set the
warning parameters of RealTick. The options you choose in this
dialog box will affect all of the order-entry enabled RealTick
windows.
Set General Order Entry Defaults
You can create general default for the Order Entry fields of the
Order Entry screen in MarketMaker and MarketMinder windows.
For example, you can set one exchange as a default for all orders.
1.
Click Order Entry Properties on the MarketMaker or
MarketMinder menu.
The Order Entry Properties dialog box appears with the
Order Entry Defaults tab open.
Order Entry Properties Dialog Box
Chapter 7: Placing Orders
Page 279
2.
Choose the security you would like to set defaults for.
3.
Click the Route drop-down list to select the route.
The Select Route dialog box will no longer appear for the user
because this default is set.
4.
Click the Expiration drop-down list to select an expiration
value.
5.
Select the Account drop-down list to select the account.
The Select Account dialog box will no longer appear for the
user because this default is set.
6.
Select the Price Type drop-down list to select the price type
for orders.
7.
Click the Volume Type drop-down list to select the volume
type for orders.
8.
Click the Trade Size drop-down list to select the trade size for
orders.
9.
If you want the trade volume to default to the position size,
check the Default Trade size to Position.
10. Enter in the field the maximum share size you want to default
up to.
11. Choose a different security type and repeat steps 3 through 10.
12. Click OK.
The system saves all changes and closes the dialog box.
Change the Spin Button Defaults
Determine the incremental value you would like to use to quickly
change a value when placing an order. You can set the price
increment and volume increment.
Note: At the Order View, press the Shift key and select the spin
button. It will round to the nearest increment before fully
incrementing.
1.
Click Order Entry Properties on the Order Book menu.
The Order Entry Properties dialog box appears.
2.
Click the Miscellaneous tab.
The Miscellaneous tab appears.
Page 280
Chapter 7: Placing Orders
Order Entry Properties Dialog Box
Hint: At the Order View,
use the Accelerated spin
increment by pressing
CTRL and selecting the
spin button with your
mouse.
3.
Type or select the increment value for Price in the Decimal
Prices and Fractional Prices spin boxes.
4.
Enter the amount the increment should increase to if you use
the arrow keys in the Price field on the Order Book window
in the Accelerated Volume field.
5.
Click OK.
The system saves all changes and closes the dialog box.
Set Keypad to Configure the Volume
For even faster order execution, use the number keypad to set or
change the quantity of your order. Depending on the volume
increment, the keypad number will adjust the volume. The
numbers in effect become a multiplier. For example, if your
volume increment is set to 50 and you press the number 2 on the
keypad, the volume will change to 100.
1.
Click Order Entry Properties on the Order Book menu.
The Order Entry Properties dialog box appears.
2.
Select the Miscellaneous tab.
The system displays the Miscellaneous tab.
3.
Chapter 7: Placing Orders
Click the Use Keypad Numbers As Volume Amount.
Page 281
4.
Click OK.
The keypad is set.
Set Reserve Order Defaults
1.
Click Order Entry Properties on the Order Book menu.
The system displays the Order Entry Properties dialog box.
2.
Click the Managed Orders tab.
The system displays the Managed Orders tab.
3.
Type the amount for reserve order in the Reserve Amount
field.
4.
Check the Use Price Range option button if you want to set a
range for reserve orders.
The system activates the Upper and Lower fields.
5.
Type the value for the upper range in the Upper field, and the
lower range in the Lower field.
6.
Set the Execution Delay to the amount of time you want the
system to wait before sending out the next order, when using
the Reserve Order feature.
7.
Click OK.
The system saves all changes and closes the dialog box.
Set an Alarm for an Order Event
You can set the Order Book to sound an alarm after a specific
event occurs. For example, you can set the Order Book window to
sound an alarm after you sold your stock.
1.
Click Order Entry Properties on the Order Book menu.
The system displays the Order Entry Properties dialog box.
Page 282
Chapter 7: Placing Orders
Order Entry Properties Dialog Box
2.
Click Event Sounds tab.
The system displays the Event Sounds tab.
3.
Check Enable Order Event Sounds option button.
The system activates the other fields in the dialog box.
4.
Choose the event you wish to trigger a sound from the list
available in the Event field.
5.
Choose the sound from the drop-down list available in the
Sound field. If no .wav files are listed there, you can search
your hard drive and/or network using the Browse button.
6.
Click OK.
The system closes the Order Entry Properties and sets the
alarm. Next time the order event occurs the alarm will sound.
Set Warnings to Display after a Specific Action
You can set the Order Book window to display a warning or
confirmation after you place an order.
1.
Click Order Entry Properties on the Order Book menu.
The system displays the Order Entry Properties dialog box.
2.
Chapter 7: Placing Orders
Click Warnings/Confirmations tab.
Page 283
The system displays the Warnings/Confirmations tab.
3.
For Price warnings, click the Warning Type drop-down list to
choose when you would like to be warned.
Order Entry Properties Dialog Box
4.
Click either the Absolute or Percentage option button for the
range value. The system will send the warning when the price
value is past the range of the market value.
5.
Check the Warn if Trade Size is greater than field if you
want to warn against trades of a certain volume. Enter the
value in the numeric field.
6.
Check the Confirm All Trades field if you want the system to
display a confirmation dialog box after you place a trade.
7.
Check the Confirm Conditional Order Executions field if
you want the system to display a confirmation dialog box after
you place a conditional order trade.
8.
Check the Acknowledge Canceled Orders field if you want
the system to display a confirmation dialog box after you
cancel an order.
9.
Check the Acknowledge Staged Order field if you want the
system to display a confirmation box after you place a staged
order.
10. Check the Long/Short Crossover Warning field if you want
the system to display a confirmation dialog box after a trade is
Page 284
Chapter 7: Placing Orders
placed that crosses over zero position. For example, if you are
long 1000 shares of XYZ and you place a trade to short sell
2000 shares of XYZ, the system will warn you since you are
covering your current position and going short with the same
trade.
11. Click OK.
The system saves all changes and closes the dialog box.
Setting Button Colors
1.
Click Order Entry Properties on the Order Book menu.
The Order Entry Properties dialog box will appear.
2.
Click the Order Colors tab.
The Order Colors tab will appear.
Order Entry Properties Dialog Box
3.
Click the Use Button Colors check box.
The Buy, Sell, and Sell Short button will activate with their
colors.
Default Button Colors
Chapter 7: Placing Orders
Page 285
4.
Click Buy, Sell, or Sell Short to open the Color dialog box
and select a different default color.
5.
Click OK.
The default color will change
Setting Order Status Colors
1.
Click Order Entry Properties on the Order Book menu.
The Order Entry Properties dialog box will appear.
2.
Click Order Colors on the Order Entry Properties dialog
box.
3.
Click Buy, Sell, or Sell Short in the Order Status Live box
to open the Color dialog box and select a different default
color.
Default Live Order Color
4.
Click Bought, Sold, or Sold Short in the Order Status
completed box to open the Color dialog box and select
different default colors.
5.
Click OK.
The default color will change.
Setting Order Alerts
You can set alerts on a Conditional order or on a price.
Add a Sound Alert to a Conditional Order
1.
From the MarketMaker menu, click Order Entry
Properties.
The Order Entry Properties dialog box will appear.
2.
Click Condition Triggered in the Event list.
3.
Select System Beep from the Sound drop-down field, or click
Browse and select a different .wav file.
4.
Click Test to hear the sound.
5.
Click OK.
The alert is set.
Page 286
Chapter 7: Placing Orders
Set a Price Warning
1.
From the MarketMaker menu, click Order Entry
Properties.
The Order Entry Properties dialog box.
Order Entry Properties Dialog Box
2.
Click the Warnings/Confirmations tab.
3.
Select the warning type from the Warning Type drop-down
field.
4.
Click the Absolute option button.
5.
Type the increment range in the Range field.
6.
Click OK.
The price warning is set.
Creating Hot Keys
You can assign keyboard combinations to quickly buy or sell
stocks. For example, a well-known Windows Hot Key is Ctrl + C
for copy. You can create a function key, Ctrl, or Alt +
combination for quick buys, sells, or cancels.
Note: You can use a
function key as a hot key.
Click Func from the Hot
Key drop-down list and
select a function key.
Chapter 7: Placing Orders
Create a Buy Hot Key
You can create a Buy Hot Key to quickly purchase a stock.
Page 287
1.
Click Order Entry Properties on the Order Book menu.
The Order Entry Properties screen appears.
2.
Click the Actions tab.
The Actions tab appears.
Order Entry Properties Dialog Box
3.
Click Create.
The Edit Order Action dialog box appears.
Hint: To buy at the best
bid or offer without a
confirmation box
appearing, choose BBO
as your price type. If you
choose Limit as your
price type, a
confirmation box will
appear to confirm your
limit price.
Edit Order Action Dialog Box
4.
Click the Action checkbox.
The Action box will activate.
5.
Page 288
Click Buy in the Actions Type drop-down list.
Chapter 7: Placing Orders
6.
Click the Price Type check box and select the price type from
the Price Type drop-down list in the Options box.
7.
Click the Route check box and select the route from the
Route drop-down list in the Options box.
8.
Click the Expiration check box and select the expiration date
from the Expiration drop-down list in the Options box.
9.
Click the Quantity check box.
The Quantity box will activate.
10. Select the volume of stock you would like to buy.
11. Click the Volume drop-down list to select a type of volume,
Partial or AON.
12. Click the Use Position option button if you’d like the hot key
to default to your current position size.
Note: Use Position takes your current position into consideration
when buying or selling. If your default quantity for a Buy Hot Key
is 1000 and you currently own 400 shares, the system will only
buy 600. If you own 400 shares and you have a Sell Hot Key with
a default quantity of 1000, the system will only sell 400. If you do
not have a position, the system will use the default quantity of
1000 when placing the next order.
13. Select a letter to use as part of your hot key in the Ctrl field in
the Hot Key box. This is the key combination you press to
quickly perform an action. For example, CTRL + A.
14. Click OK.
The hot key is created.
Create a Sell Hot Key
You can create a Sell Hot Key to quickly sell a stock.
1.
Click Order Entry Properties on the Order Book menu.
The Order Entry Properties dialog box will appear.
2.
Click the Actions tab.
The Actions tab will appear.
3.
Click Create.
The Edit Order Action dialog box will appear.
Chapter 7: Placing Orders
Page 289
4.
Click the Action check box.
The Action box will activate.
5.
Select Sell from the Action Type drop-down list.
6.
Click the Short Sell/Offer check box.
7.
Click the Price Type check box and select the price type from
the Price Type drop-down list in the Options box.
8.
Click the Route check box and select the route from the
Route drop-down list in the Options box.
9.
Click the Expiration check box and select the expiration from
the Expiration drop down list in the Options box.
10. Select the volume of stock you would like to sell.
11. Click the Volume Type drop-down list to select a type of
volume, Partial or AON.
12. Click the Use Position option to if you’d like the hot key to
default to your current position size.
13. Select a letter to use as part of your hot key in the Ctrl field in
the Hot Key box. This will be the combination of keys you
press to quickly perform the action. For example, CRTL + A.
14. Click OK.
The hot key is created.
Create a Bid Hot Key
You can create a Bid Hot Key to quickly place a Bid.
1.
Click Order Entry Properties on the Order Book menu.
The Order Entry Properties will appear.
2.
Click the Actions tab.
The Actions tab will appear.
3.
Click Create.
The Edit Order Action dialog box will appear.
4.
Click the Action check box.
The Action box will appear.
5.
Page 290
Select Bid from the Action Type drop-down list.
Chapter 7: Placing Orders
6.
Click the Route check box and select the route from the
Route drop-down list in the Options box.
7.
Click the Expiration check box and select the expiration from
the Expiration drop-down list in the Options box.
8.
Select a volume you would like to bid on.
9.
Click the Volume Type drop-down list to select a type of
volume, Partial or AON.
10. Click the Use Position option if you’d like the hot key to
default to your current position size.
11. Click the Best, Up, or Down option button in the Bid/Offer
option box.
12. If you selected Up or Down, select an amount in the
Adjustment field.
13. Select a letter to use as part of your hot key in the Ctrl field in
the Hot Key box. This will be the combination of keys you
press to quickly perform the action, for example, CTRL + A.
14. Click OK.
The hot key is created.
Create an Offer Hot Key
You can create an Offer Hot Key to quickly place an Offer.
1.
Click Order Entry Properties on the Order Book menu.
The Order Entry Properties dialog box will appear.
2.
Click the Actions tab.
The Actions tab appears.
3.
Click Create.
The Edit Order Action dialog box will appear.
4.
Click the Action check box.
The Action box will activate.
Chapter 7: Placing Orders
5.
Select Offer from the Action Type drop-down list.
6.
Click Short Sell/Offer in the Action box if you’d like to offer
short.
Page 291
7.
Click the Route check box and select the route from the
Route drop-down list in the Options box.
8.
Click the Expiration check box and select the expiration from
the Expiration drop-down list in the Options box .
9.
Select the volume of the stock you would like to offer.
10. Click the Volume Type drop-down list to select the volume
type, Partial or AON.
11. Click the Use Position option if you’d like the hot key to
default to your current position size.
12. Click the Best, Up, or Down option button in the Bid/Offer
Options box.
13. If you selected Up or Down, select an amount in the
Adjustment field.
14. Select a letter to use as part of your hot key in the Ctrl field in
the Hot Key box. This will be the combination of keys you
press to quickly perform an action, for example, CTRL + A.
15. Click OK.
The hot key is created.
Create a Cancel Orders (Symbol) Hot Key
Create Hot Keys to quickly cancel orders by symbol or by account.
1.
Click Order Entry Properties on the Order Book menu.
The Order Entry Properties dialog box will appear.
2.
Click the Actions tab.
The Actions tab will appear.
3.
Click Create.
The Edit Order Action dialog box will appear.
4.
Click the Action check box.
The Action box will activate.
Page 292
5.
Select Cancel Orders (Symbol) from the Action Type box.
6.
Select a letter to use as part of your hot key in the Ctrl field in
the Hot Key box. This will be the combination of keys you
press to quickly perform the action, for example, CTRL + A.
7.
Click OK.
Chapter 7: Placing Orders
The hot key is created.
Create a Close Position (Symbol) Hot Key
1.
Click Order Entry Properties on the Order Book menu.
The Order Entry Properties dialog box will appear.
2.
Click the Actions tab.
The Actions tab will appear.
3.
Click Create.
The Edit Order Action dialog box will appear.
4.
Click the Action check box.
5.
Select Close Position (Symbol) from the Action Type dropdown list.
6.
Click the Price Type drop down list in the Options box to
select a price type.
7.
Click the Route drop-down list in the Options box to select a
route
8.
Click the Expiration drop-down list in the Options box to
select an expiration date.
9.
Select a letter to use as part of your hot key in the Ctrl field in
the Hot Key box. This will be the combination of keys you
press to quickly perform this action, for example, CTRL + A.
You can also choose to use the Alt key in combination with
letters and numbers.
10. Click OK.
The hot key is created.
Create a Cancel Orders (Account) Hot Key
1.
Click Order Entry Properties on the Order Book menu.
The Order Entry Properties dialog box will appear.
2.
Click the Actions tab.
The Actions tab will appear.
3.
Click Create.
The Edit Order Action dialog box will appear.
Chapter 7: Placing Orders
Page 293
4.
Click the Action check box.
5.
Select Cancel Orders (Account) from the Action Type dropdown list.
6.
Select a letter to use as part of your hot key in the Ctrl field in
the Hot Key box. This will be the combination of keys you
press to quickly perform the action, for example, CTRL + A.
7.
Click OK.
The hot key is created.
Create a Close Position (Account) Hot Key
1.
Click Order Entry Properties on the Order Book menu.
The Order Entry Properties dialog box will appear.
2.
Click the Actions tab.
The Actions tab will appear.
3.
Click Create.
The Edit Order Action dialog box will appear.
Edit Order Action Dialog Box
Page 294
4.
Click the Action check box.
5.
Select Close Position (Account) from the Action Type dropdown list.
6.
Click the Price Type drop-down list in the Options box to
select a type of price.
7.
Click the Route drop-down list in the Options box to select an
exchange.
8.
Click the Expiration drop-down list in the Options box to
select an expiration date.
Chapter 7: Placing Orders
9.
Select a letter to use as part of your hot key in the Ctrl field in
the Hot Key box. This will be the combination of keys you
press to quickly perform this action, for example, CTRL + A.
10. Click OK.
The hot key is created.
Interact with Order View
With this feature, you can partially define an order hot key.
Interact with Order View requires an action (buy, sell, cancel,
etc…) for the hot key, but the remaining attributes of the order are
taken from the active order view. The most common use of this
feature is for creating route-specific buy/sell Hot Keys that will use
the limit price in the order view.
1.
Click Order Entry Properties on the MarketMaker menu.
The Order Entry Properties dialog box will appear.
Order Entry Properties Dialog Box
2.
Click Create on the Actions tab.
The Edit Order Action dialog box will appear.
Chapter 7: Placing Orders
Page 295
Edit Order Action Dialog Box
3.
Click the Action check box.
The Action box will activate.
4.
Click Interact with Order View.
5.
Configure hot key.
6.
Click OK.
Create an Actionless Hot Key
Note: Any attributes
can be applied in this
manner, and one
Order Action can
specify multiple
attributes.
An Order Action that does not cause an order to be placed,
cancelled, or modified is referred to as “actionless.” The attributes
of the Order Action are applied to the current Order View and will
be used when you submit an order.
For example, create a hot key to preference orders. Type the
Market Maker ID, ECN, or exchange in the Preference field and
save it as a hot key. When at the Order View, press the hot key
and configure the remaining attributes of the order.
1.
Click Order Entry Properties on the MarketMaker menu.
The Order Entry Properties dialog box will appear.
2.
Click Create on the Actions tab.
The Edit Order Action dialog box will appear.
3.
Click the Preference check box and type the Market Maker
ID, ECN, or exchange in the Preference field.
4.
Click OK.
The hot key is created.
Page 296
Chapter 7: Placing Orders
Create a Change Order Action Hot Key
Use a Change hot key to change the parameters of a live order
without having to right-click an order. You can press the hot key
and the Change Order dialog box will appear.
1.
Click Order Entry Properties on the Order Book menu.
The Order Entry Properties dialog box will appear.
2.
Click Create on the Actions tab.
The Edit Order Actions dialog box will appear.
3.
Click the Action check box.
The Action box will activate.
4.
Select Change from the Action Type drop-down list.
5.
Click OK.
The hot key is created.
Create a “Bump” Hot Key
You can create a hot key to change your order, price or volume, in
increments. Define the increment.
1.
Click Order Entry Properties on the Order Book menu.
The Order Entry Properties dialog box appears.
2.
Click Create on the Actions tab.
The Edit Order Action dialog box appears.
3.
Click the Action check box.
The Action box will activate.
4.
Select Bump price/volume from the Action drop-down list.
The Price Adjustment box will activate.
5.
Select the appropriate price and/or volume increment.
6.
For price, click the Fractional check box if you would like to
increment by fractions.
7.
Click OK.
The hot key is created.
Chapter 7: Placing Orders
Page 297
Clone a Hot Key
You can copy a hot key.
1.
Click Order Entry Properties on the MarketMaker menu.
The Order Entry Properties dialog box appears.
2.
Click the Actions tab.
The Actions tab will appear.
3.
Select the hot key you would like to copy.
4.
Click Copy.
The Edit Order Action dialog box will appear.
5.
Reassign the hot key combination.
6.
Click OK.
The hot key clone is created.
Edit a Hot Key
1.
Click Order Entry Properties on the Order Book menu.
The Order Entry Properties dialog box appears.
2.
Click the Actions tab.
The systems display the Actions tab.
Order Entry Properties Dialog Box
3.
Page 298
Click the action you would like to edit from the Actions list.
Chapter 7: Placing Orders
4.
Click Edit.
The Edit Action Order dialog box will appear.
5.
Make the appropriate changes.
6.
Click OK.
The system saves all changes.
Delete a Hot Key
1.
Click Order Entry Properties on the Order Book menu.
The system displays the Order Entry Properties dialog box.
2.
Click the Actions tab.
The system displays the Actions tab.
3.
Click the action that you want to delete from the Actions list.
4.
Click Delete.
The system deletes the action.
5.
Click OK.
The system saves all changes and closes the dialog box.
Create the Hot Key Action Bar
Create a Hot Key Action Bar that displays your hot keys as
buttons. Click in a hot key button and RealTick will execute the
action.
1.
Click Show Action Bars on the MarketMinder menu.
The toolbar displays under the MarketMinder window.
Chapter 7: Placing Orders
Page 299
MarketMinder displaying the Action Bar
2.
Right-click the Action bar and select Add Button.
A button appears on the Action bar.
3.
Right-click the button and select Select Action.
The Select Action dialog box appears.
Select Action Dialog Box
4.
Page 300
If you do not have any hot keys already created to select, click
Actions.
Chapter 7: Placing Orders
The Actions tab of the Order Entry Properties dialog box
will appear.
5.
Create a hot key. See the Create Hot Key section in Chapter 7
of the RealTick manual.
6.
Once the hot key is created, select it in the Select Account
dialog box and click OK.
The hot key is assigned to the button on the Action bar.
Chapter 7: Placing Orders
Page 301
The Actions tab of the Order Entry Properties dialog box
will appear.
5.
Create a hot key. See the Create Hot Key section in Chapter 7
of the RealTick manual.
6.
Once the hot key is created, select it in the Select Account
dialog box and click OK.
The hot key is assigned to the button on the Action bar.
Chapter 7: Placing Orders
Page 303
Chapter 8: Tracking Positions and
Account Balances
This chapter discusses several different windows you can use to
track your positions and account balance. You can track your
positions and your account balance using MarketMinder,
MultiQuote, and Order Book.
PositionMinder
The PositionMinder tracks all the open positions in an account. It
can also track any closed positions you have for the day. You can
add columns and configure the display as with any MarketMinder.
Note: You cannot set up
the PositionMinder
before your first trade.
You must have at least
one open position to
create a PositionMinder.
PositionMinder Window
Page 304
Chapter 8: Tracking Positions and Account Balances
Create a PositionMinder
1.
Click MarketMinder on the RealTick Design menu.
The Minder Setup dialog box will appear.
Note: If you have more
than one account, the
Select Account screen
will appear after you
click OK. Choose an
account, and the
PostionMinder will open
with that account’s
positions.
Minder Setup Dialog Box
2.
Click the Positions option button in the Minder Type section.
The Orders tab will appear.
3.
If you want your PositionMinder to show your closed
positions as well as your open positions, click the Show
Closed Positions in PositionMinder check box. This will
allow you to see the closed positions’ contribution to P & L.
4.
Click OK to exit the Minder Setup screen and open your new
PositionMinder.
The information in the screen will update as you trade.
Select an Account
View your positions and your account balance in another account.
Note: Once you have
selected a new account,
the PositionMinder will
automatically update.
1.
Click Select Account on the MarketMinder menu.
The system displays the Select Account dialog box.
Chapter 8: Tracking Positions and Account Balances
Page 305
Select Account Dialog Box
2.
Double-click an account in the Available Accounts list field.
The system displays the chosen account in the MarketMinder
window title bar.
Change the Column Layout
Note: Your account
balance appears in the
Totals row and P&L
Total column.
RealTick is shipped with one or more column layout files for
viewing positions. You can modify the default layouts if you want
to add new fields, remove fields, or change the order of the fields.
You can also add column totals to your PositionMinder so you can
see your portfolio’s net worth and watch it update over time.
3.
Click Configure Column Layout from the Column Layout
Choices sub-menu on the Market Minder menu.
The Column Layout screen will open.
Hint: To delete a
column, click the column
you would like to delete
in the Selected Fields list
and click Delete.
Column Layout Dialog Box
4.
Click More.
The system expands the Column Layout screen.
5.
Page 306
Click the name of the field from the Available Fields list.
Chapter 8: Tracking Positions and Account Balances
6.
Change the data in the Server, Table, and Sub Type fields to
see different fields.
7.
Click the field name you want to display and click Add.
The system adds the data to the Selected fields list.
8.
Click OK.
The system displays the new field in the PositionMinder.
OrderMinder
The OrderMinder displays your orders for the current trading day.
Create an OrderMinder
1.
Click MarketMinder on the Design menu.
The Minder Setup screen appears.
2.
Click the Orders option button.
The Orders tab appears.
Minder Setup Dialog Box
3.
Select the order details in the Order Display box.
o
Click the Summary option button if you’d like to display the
symbol, transaction (buy or sell), price, and status (completed
or live).
o
Click the Standard Detail option button if you’d like to
display the symbol, transaction (buy or sell), price, route, and
status (completed or live).
Chapter 8: Tracking Positions and Account Balances
Page 307
4.
Click the Standard Orders and/or Managed Orders check
box to filter the orders to display.
Note: Managed Orders are order types controlled by RealTick,
such as Conditional or Deferred Orders.
o
Click the Live check box to display live orders.
o
Click the Completed check box to display completed orders.
o
Click the Deleted check box to display canceled or deleted
orders.
5.
Enter additional filters in the Other Filters box.
6.
Click OK.
The OrderMinder window appears.
Multiple Selections in an OrderMinder
You can highlight multiple rows of orders in an OrderMinder and
press the delete key to instantaneously cancel all orders that are
highlighted.
1.
Click Display Options on the MarketMinder menu.
The Display Options dialog box will appear.
2.
Click the Allow Multiple Selection check box.
3.
Click OK.
4.
Left-click an order in the OrderMinder.
5.
Drag the mouse until all the orders are selected.
6.
Click Delete.
View the Order Transaction Summary
1.
Select an order in the OrderMinder window. You can select
mulitiple orders by pressing the <SHIFT> key and clicking an
order and dragging the mouse over the additional orders.
2.
Right-click the highlighted order(s), and select View Order.
The Order Transaction Summary dialog box appears.
Page 308
Chapter 8: Tracking Positions and Account Balances
Order Transaction Summary Dialog Box
3.
To display order executions, click the Show Executions in the
Filter Parameters check box.
4.
To sort by short sales, click the Separate by Short Sales
check box.
5.
To sort by routes, click the Separate by Routes check box.
6.
To sort by price tiers, click the Separate by Price Tiers check
box.
7.
To display more details of an order, select the order and click
Details.
The Extended Details dialog box appears.
Extended Details Dialog Box
Chapter 8: Tracking Positions and Account Balances
Page 309
Link a MarketMinder to an OrderMinder
Link a MarketMinder window to an OrderMinder window that is
filtering on “symbol” to build a stock-specific order history
window.
Note: The
StandardMinder should
display symbols you used
to place orders.
1.
Link a StandardMinder to an OrderMinder.
See Chapter 4 for more information on linking windows.
Note: You MUST link the StandardMinder to the OrderMinder,
not vice versa.
2.
Type a symbol in the Symbol field on the Orders tab of the
Minder Setup dialog box (OrderMinder).
3.
Press Alt and double-click a symbol in the StandardMinder
window.
The symbol’s order history will appear in the OrderMinder.
TicketMinder
This is used in conjunction with Staged Order Tickets.
Display Ticketed Orders
Monitor or display ticketed orders in the MarketMinder.
1.
Click MarketMinder on the Design menu.
The Minder Setup dialog box appears.
Minder Setup Dialog Box
2.
Page 310
Click Tickets.
Chapter 8: Tracking Positions and Account Balances
The Orders tab appears.
3.
Click the Summary option button in the Order Display box
if you would like to display the order summary.
4.
Click the Standard Detail option button in the Order Display
box if you would like to display standard order details.
5.
Click the Live check box if you would like to display live
ticketed orders.
6.
Click the Completed check box if you would like to display
completed ticketed orders.
7.
Click the Deleted check box if you would like to display
deleted ticketed orders.
The following filters are optional:
8.
Type the symbol in the Symbol field of the ticketed order(s)
you would like to display.
9.
Type the volume type in the Volume Type field.
10. Type the price type in the Price Type field.
11. Type the route in the Route field.
12. Type the expiration in the Expiration field.
13. Type the order tag in the Order Tag field.
14. Type the Market Maker ID, ECN, or exchange in the
Preference/Opposite Party.
15. Click OK.
A TicketMinder displays with the ticketed orders.
MultiQuote
MultiQuote is shipped with several different layouts you can use to
track your positions and account balance. These include the
Account Info layouts, Account detail.mqt and Account INFO –
TOP.MQT.
Note: The Account detail.mqt and the Account INFO –
TOP.MQT layouts both display your account balance in the
Available Equity field.
Chapter 8: Tracking Positions and Account Balances
Page 311
Note: If you have
multiple accounts, when
you click MultiQuote on
the Design menu, the
Select Account screen
will appear. Select the
account you would like
to view its positions and
balances.
Account detail.mqt Layout
Account INFO – Top.MQT Layout
Configure the MultiQuote Window to View Your
Positions
1.
Click MultiQuote on the Design menu.
The Open screen will appear.
2.
Click Account detail.mqt to view your positions and account
balance.
Configure the MultiQuote Window to View Your
Account Balance
1.
Click MultiQuote on the Design menu.
The Open screen will appear.
2.
Click Account Info – Top.MQT to view your positions and
account balance.
Select an Account
View your positions and account balance in another account.
1.
Click Select Account on the MultiQuote menu.
The system displays the Select Account screen.
Page 312
Chapter 8: Tracking Positions and Account Balances
Note: Once you’ve
selected a new account,
the MultiQuote layout
will automatically
update.
Select Account Dialog Box
2.
Double-click an account in the Available Accounts list field.
The system displays the chosen account in the MultiQuote
screen title bar.
Order Book
The Order Book screen displays detailed information about each
transaction connected with every order placed from any window in
RealTick. You can view your account balance from the Order
Book.
Order Book Screen
View Your Account Balance
1.
Click Order Book on the Design menu.
The Order Book window will appear.
2.
Click Show Account Balance on the Order Book menu.
The account will show along with its balance and profit or
loss.
Chapter 8: Tracking Positions and Account Balances
Page 313
3.
Page 314
Select a different account from the account drop-down list to
view another account’s balance.
Chapter 8: Tracking Positions and Account Balances
Chapter 9: Using Advanced Features
This chapter discusses advanced features in RealTick.
Commit Changes
You can edit data in both a Chart and a Table window. If there is a
price that is incorrect, on a Chart or in a Table, you can edit it and
send it to the TA_SRV so that it is corrected in the database.
Edit & Save Data in a Chart
The save option is available only for LAN customers who own
their own TA_SRV machines.
1.
Double-click the Chart screen.
The system displays the Edit Chart screen.
2.
Double-click the data you want to change. For example, you
can change the price or volume value.
The system displays a small edit text field.
3.
Enter the new value and press the Enter key from your
keyboard. (To cancel, press the Esc key.)
4.
Close the Edit Chart screen by clicking the Close button in
the upper right corner of the screen.
The system displays the new values in your chart.
Note: To save the changes
you have to use the Commit
Changes. The system will
send your changes to the
TA_SRV, and the changes
will be recorded in the
server’s historical database.
Note: The new values you enter appear in the chart for as long as
you keep the window open. The changes will not be permanent
unless you send them to the TA_SRV. If you send your changes to
the TA_SRV, the changes are recorded in the server’s historical
database.
5.
To make the changes permanent, click Commit Changes on
the Chart menu.
The system saves the changes.
Chapter 9: Using Advanced Features
Page 315
Edit & Save Data in a Table
The Save option is available only for LAN clients and for
customers who own their own TA_SRV machines.
1.
Double-click the data that you want to change. For example,
you can change a time, price, or volume value.
The system displays the text field around the information you
would like to edit.
2.
Type the new value and press the Enter key from your
keyboard (To cancel, press the Esc key).
The system updates the Table screen with the new value.
Note: The new values you enter appear in the table for as long as
you keep the window opened. The changes will not be permanent
unless you send them to the TA_SRV. If you send your changes to
the TA_SRV, the changes are recorded in the server's historical
database.
3.
To make the changes permanent, choose Commit Changes
from the Table menu.
Scripts
RealTick has a built-in scripting facility that can be used for
purposes of printing out Charts at the beginning or end of the day,
or for cycling through pages as part of a demo.
Note: RealTick’s
scripting facility is being
phased out and will soon
be replaced with a COM
automation interface that
will provide more
extensive scripting
capabilities.
Page 316
Designing
Design a Script
1.
Click Design Script on the Page menu.
The Script Design dialog box will appear.
Chapter 9: Using Advanced Features
Script Design Dialog Box
2.
Select a command from the Commands box.
3.
Click Insert.
The command will appear in the script file.
If you choose Open Page, PrintScreen, SetDelayTime,
WaitFor, or WaitUntil, you will have to enter a parameter in
the Parameters box before inserting the command into the
script.
Note: The Parameters box will change to the Seconds box or
Time box depending the command you choose.
4.
Select the next command from the Commands box.
5.
Click the Append button.
Note: The Append button will enter the command after the last
command. The Insert command will enter the command first in
the Script box.
6.
Continue selecting the commands from the Command box
until you have completed your script.
7.
Once you have completed your script, click Save As.
The Save As dialog box will appear.
8.
Type the name of the script in the File Name field and click
Save.
The script is saved.
9.
Chapter 9: Using Advanced Features
Click Close & Execute.
Page 317
The script is created. The command appears in the Status bar.
Status Bar
Executing
1.
Click Execute Script on the Page menu.
The Open dialog box will appear.
Open Dialog Box
2.
Click the Script File you would like to open and click Open.
The script is executed.
Page 318
Chapter 9: Using Advanced Features
Chapter 10: Troubleshooting
This chapter discusses the most common problems RealTick users
experience and the possible causes and solutions to these problems.
For further help, contact Townsend Analytics, Ltd. Technical
Support at 1-800-997-9630 or visit our website at
www.realtick.com.
Connectivity Problems
Many problems Internet users experience are due to their Internet
connection. Several of these problems include inability to log on
to RealTick, slow or incorrect data updates in the Chart and
MarketMaker windows, and losing connection to the servers.
Note: The status lights on the status bar will go from green to
yellow to red when there is a server connection loss. See Chapter
3 for more information concerning the status lights.
If you are experiencing any of these problems, run a ping test.
Perform a TalTrade Ping Test
Test your RealTick connectivity.
1.
Select Run on the Start menu.
The Run dialog box will appear.
Run Dialog Box
2.
Type command or cmd in the Open field.
3.
Click OK.
The DOS prompt will appear.
Chapter 10: Troubleshooting
Page 319
.
DOS Prompt Dialog Box
4.
Type ping beacon.taltrade.com at the C:\> prompt.
You will receive four replies.
The test results are the length of time it takes to receive the four
replies.
o
If the times are above 250 milliseconds (ms), you will have a
problem using RealTick.
Reply Time
o
If you do not receive one of the four replies, you will have a
problem using RealTick. You should receive a Request
timed out error message.
o
If you do not receive any of the four replies, there may be a
firewall, or you may not be connected to the Internet. If this is
the case, you will need to perform an Internet connectivity
test.
Perform an Internet Connectivity Test
Test your Internet connectivity.
o
Open a web page.
If you are unable to open a web page, you are not connected to
the Internet. Contact your Internet provider.
If you are able to open a web page, you will need to see if the
connection is with TalTrade or with the Internet. You will
need to perform a Ping Internet Test.
Page 320
Chapter 10: Troubleshooting
Perform a TraceRoute Test
Once a problem is established, perform a traceroute test to see
where the problem is originating. This test works similar to a ping
test, but instead of pinging the end machine, it pings each machine
along the line three times.
Note: A slow response
from a later router may
be due to a slow
response from an early
router.
1.
Select Run on the Start menu.
The Run dialog box will appear.
Run Dialog Box
2.
Type command or cmd in the Open field.
3.
Click OK.
The DOS prompt will appear.
DOS Prompt
4.
Type tracert beacon.taltrade.com at the C:\> prompt.
o
Several lines will return displaying three times per line. Each
line is a router. If one router is consistently displaying high
ping times or timed outs, contact Townsend Analytics, Ltd.
Technical Support.
Chapter 10: Troubleshooting
Page 321
.
o
If there are not high ping times or timed outs, some possible
problems may include your modem or Ethernet card, poor
connection to Internet, bad and loose or tangled cable, or IRQ
conflict. In this case, contact a hardware expert before
replacing any hardware equipment, and/or contact your
Internet Service Provider to check your Internet connection.
Data Outages and Data Integrity
Two common data integrity issues include a bad tick in a Chart or
a stuck MarketMaker. A bad tick hampers the scaling of a Chart,
and a stuck MarketMaker makes it difficult to trade.
If you are a LAN customer, you must contact your system
administrator to correct this problem.
Note: A stuck
MarketMaker is a
quote (bid or ask) that
keeps coming up in the
MarketMaker window
as the best, even if the
market has moved
away from that price.
Page 322
If you are not a LAN customer and access your data from TAL,
contact Townsend Analytics, Ltd. Technical Support.
Questions you should ask yourself before calling Technical
Support.
o
Is there a stop on trading for a period?
o
Is the exchange closed?
o
Is the symbol spelled correctly?
o
Is it a future, and is the contract expired?
o
Is your system clock displaying the correct time?
Chapter 10: Troubleshooting
Chapter 11: RealTick Add-ons
This chapter discusses third party applications that are integrated
into RealTick, such as Hottrend, Oz Scanner, and MarketGauge.
Hottrend™
This Web Browser favorite displays detailed information on the
top 30 Hottrend stocks. The Radar will display from 0 – 30 stocks,
depending on overall market activity and the extent to which each
individual stock is exceeding its normal trading parameters
(“abnormal”). It is recalculated every minute and produced by
quantifying all first and second order variables measured against
the same period in time for previous trading days.
Hottrend algorithms are based on a sophisticated model that
measures the activity levels of multiple variables simultaneously.
Besides volume and price, Hottrend also measures trade count,
money flow, and other related indicators in order to create a 360degree view of an emerging liquidity event.
See Hottrend RealTime Radar Web Browser Favorite in RealTick
for additional help.
Display Hottrend
o
Select Hottrend favorites 7 (NASDAQ) or 8 (NYSE) on the
Web Browser sub-menu of the Favorites menu.
The favorite will appear.
Access Hottrend through the MarketMinder
Favorite
You can access Hottrend through the MarketMinder TAL Chain
Symbol List.
1.
Select TAL Chain Symbol List from the MarketMinder
favorites on the Favorite menu.
The TAL Chain listing window will appear.
Chapter 11: RealTick Add-ons
Page 323
TAL Chain Listing Window
2.
Click $HOTTREND NYSE or $HOTTREND Nasdaq and
drag and drop into a MarketMinder.
The symbols will appear.
MarketMinder Displaying Hottrend NYSE Symbols
Page 324
Chapter 11: RealTick Add-ons
Link Hottrend RealTime Radar to another RealTick
Window
1.
Click Links… on the Hottrend window.
The Select Window to Link dialog box will appear.
Select Window to Link Dialog Box
2.
Select the window you would like to link.
3.
Click OK.
Display a Symbol in the Linked Window
o
Click the ticker symbol hyperlink.
The linked window will display the symbol.
Drag and drop a symbol from the Hottrend Favorite
1.
Click a symbol in Hottrend.
2.
Drag and drop the symbol in a MarketMinder, MultiQuote,
News, MarketMaker, Turbo Options, Order Book, Chart, or
Enlist window.
The symbol will display.
View the Day Summary
The Day Summary displays all the activity on the RealTime Radar
for the day.
o
Click the Day Summary button.
The window appears.
Chapter 11: RealTick Add-ons
Page 325
Hottrend Day Summary Window
See Hottrend Day Summary in RealTick for additional help.
Hottrend Smart Alerts
Hottrend Smart Alerts enables RealTick customers to configure
and receive stock alerts derived from Hottrend detection of
abnormal activity.
Access Hottrend Smart Alerts
o
Select Hottrend Smart Alerts from the Web Browser submenu of the Favorites menu.
Hottrend Smart Alerts will appear.
Setup an Alert
o
Type a symbol in the Enter Symbol field.
Oz Scanner
The Oz Scanner is a technical filter that sorts stocks by different
sets of criteria. There are nine different scanners.
Usual Suspects Scan
Display stocks that are increasing in price and that may potentially
trade higher than their average daily volume. The Usual Suspect
Scan will provide you with the stock on day one of its increase.
Knock Down Scan
Page 326
Chapter 11: RealTick Add-ons
Display stocks that are decreasing in price and that may potentially
trade higher than their average daily volume. Use the Knock
Down Scan to sell short.
Power Trader Scan
Display stocks that are increasing in price and that may potentially
trade higher than their average daily volume – a similar, but stricter
scan than Usual Suspects.
New Kid on the Block Scan
Display stocks that are increasing in price and that may potentially
trade higher than their average daily volume. The detection point
for the stock’s initial volume and price increase is much lower than
that of the Power Trade Scan, so it finds stocks that are gaining
interest from institutions or investors.
Gapper Scan
Display stocks that are showing strength and momentum for a
potential position trade after a major news event.
Bottom Fisher Scan
Display stocks that have traded down for at least three sessions and
are currently trading higher and signaling that a potential shortterm bottom might have been formed.
Sky Scraper Screen
Display the stocks that have traded up for at least three sessions
and are trading down from yesterday’s close.
10 ½ Weeks Scan
See which stocks are moving up and making a 53-day high on
higher than average volume. Use the 10 ½ Weeks Scan for both
long and short positions.
9 ½ Weeks Scan
Identify downward-moving stocks making a 47-day low on higher
than average volume. The 9 ½ Weeks Scan can be used for both
long and short positions.
Chapter 11: RealTick Add-ons
Page 327
Access an Oz Scanner
1.
Select the TAL Chain Symbol List on the MarketMinder
favorite of the Favorites menu.
The TAL Chain Listing window appears.
TAL Chain Listing Window
2.
Select a Scanner and drag and drop it into a MarketMinder.
The Scanner symbols will appear.
Oz Scanners
Page 328
Chapter 11: RealTick Add-ons
For more information regarding Oz Scanner, please visit
www.tonyoz.com.
MarketGauge
MarketGauge is a visual and contextual Web-based indicator of
the market. Its features include Hot Spots, HyperQuote, Report
View and Multiple Report Views: Price & Volume
Views/Fundamental Views, Price and Volume Gauges, and
Portfolio.
For more information, please see the MarketGauge help.
Access MarketGauge
o
Chapter 11: RealTick Add-ons
Select MarketGauge from the Web Browser favorite of the
Favorites menu.
Page 329
Barra Risk Factor
Barra Risk Factor is a risk measurement application
Access Barra Risk Factor
o
Select Barra Risk Factor from the Web Browser sub-menu
of the Favorites menu.
Display Barra Risk Factors for a Stock
1.
Type the ticker symbol in the Enter a Ticker field.
2.
Click Go.
Barra Risk Factor
The Risk Factor Analysis will appear.
Page 330
3.
Click the Price Fluctuation tab to view the Price Fluctuation
chart.
4.
Click the Broad Market link, Sector link (middle cylinder),
or Industry link (bottom cylinder) to display winners and
losers.
5.
To return to the Risk Factor page, click the Risk Factor tab at
the top of the page.
Chapter 11: RealTick Add-ons
Index
1
10 ½ Weeks Scan, 327
9
9 ½ Weeks Scan, 327
A
Absolute, 137, 169
Acceleration (ACC), 197
Access an Oz Scanner, 328
Access the Alerts and Alarms, 118
Accessing the Parameters Dialog Box,
186
Account Balance, 304
Order Book, 313
Actionless Hot Key, 296
Add a Currency, 99
Add a Mail Alert in the Status Bar, 60
Add a New Page, 56
Add a Price Tier, 113
Add a Sound Alert to TAL Mail, 60
Add a Symbol, 137
Add a Symbol to an Existing Chart,
168
Add a Symbol to an Existing
MarketMinder, 116
Add a Technical Analysis to a Chart,
185
Add a Technical Analysis to a Table,
185
Add Columns to the IOI Client
Window, 103
Add columns to the News Window,
128
Add to Favorites, 67
Adding and Removing Panels, 111
Index
Adobe Acrobat Reader, 13
Advanced Features, 315
Advanced Listed Configuration, 272
Advanced Nasdaq Configuration, 271
Alarms. See TAL Alarms
Alerts. See TAL Alerts
Annotations, 178
Add an Annotation, 178
Change an Annotation, 179
Delete an Annotation, 179
AON, 247
Arms' Ease of Movement (EMV), 229
Auto Scale, 176
Automation. See Scripts
Average Price Calculator
Use the Average Price Calculator,
308
Average Range, 193
B
Basket Order, 242
BasketMinder, 269
Advanced Listed Configuration,
272
Advanced Nasdaq Configuration,
271
Basket Quantity/Execution, 273
Configure a Standard Basket
Minder Order, 270
Customize Order Parameters, 272
Limit Market Exposure, 274
Setup the Basket Order Entry
Window, 269
BBO, 239
Best Fit, 61
BID, 240
Bollinger Bands, 194
Bottom Fisher Scan, 327
Page 331
Bump Hot Key, 297
Buy from the Order Entry Screen in
Order Book, 253
C
Calculate Volume Weighted Average
Price, 138, 150
Canceling Orders, 275
Cancel Using Cancel Now!!, 277
Cancel Using Cancel Order, 277
Confirm All Trades, 278
Quick Double-Click Cancel, 276
ChainMinder, 116
Change a Column in a Table, 141
Change a Favorite, 67
Change a Series in a Chart, 174
Change Order Action Hot Key, 297
Change the Color of a Price Tier, 114
Change the Color of Indications, 102
Change the Column Layout, 119, 306
Change the Display of a Chart, 171
Change the Display of a Table, 140
Change the Price Display, 137
Absolute, 137
Differential, 137
Percent Change, 137
Ratio, 137
Change the Server for a RealTick
Window, 72
Change the Spin Button Defaults, 280
Change the Table Display, 123
Change the Type of Chart, 169
Change the View of the Fixed Page
News Window, 96
Go Back, 96
Maximize Story Window, 96
Split Window, 96
Change the Window Color of a
Ticker, 146
Change the Window Font for Market
Minder, 122
Change Your Password, 51
Chart, 164
Absolute, 169
Page 332
Add a Symbol to an Existing
Chart, 168
Add a Technical Analysis to a
Chart. See Technical Analysis
Annotations. See Annotations
Auto Scale, 176
Change a Series in a Chart, 174
Change the Display of a Chart,
171
Change the Type of Chart, 169
Chart Menu, 28
Create a Chart, 167
Daily, 165
Differential, 169
Enlarge a Chart Region, 177
Fixed, 176
Fixed Endpoints, 176
Hide the Chart Title (Legend),
175
Intraday, 164
Intraday Chart Hot Keys, 168
Link Left and Right Axes, 176
Logarithmic Scale, 176
Min/Max Scaling, 175
Monthly, 167
Percent Change, 169
Ratio, 169
Replace a Symbol in a Chart, 169
Restore a Chart to Original Size,
177
Scale a Chart, 175
Seasonal, 167
Snap to Date Range, 176
Snap to Window, 176
Spreads, 183
Trend Lines. See Trend Lines
Vertical Zooming a Chart, 177
View the Statistics in a Chart,
177
Weekly Chart, 166
Chart Multiplier, 183
Chart, 183
Child → Popup, 70
Clone a Hot Key, 298
Close a News Alert, 133
Index
Color Depth, 12
Column Widths, 20
Columns
Add Columns to the IOI Client
Window, 103
Add Columns to the News
Window, 128
Change a Column in a Table, 141
Change the Column Layout in
MarketMinder, 119
Change the Width of a Column,
21
Change the Width of a Column in
Turbo Options, 157
Column Widths, 20
Configure Column Layout in
MarketMinder, 120
Custom Sort a MarketMinder,
121
Save a Column Layout in
MarketMinder, 121
Sizing Columns in Turbo
Options, 157
Commit Changes, 315
Edit & Save Data in a Chart, 315
Edit & Save Data in a Table, 316
Commodity Channel Index (CCI), 210
Conditional Order, 242
Load a Conditional Order, 259
Configure a Standard Basket Minder
Order, 270
Configure Column Layout, 120
Configure the MultiQuote Window to
View Your Account Balance, 312
Configure the MultiQuote Window to
View Your Positions, 312
Configuring a Quote Source, 143
Remove Data from a Specific
Market Maker, 145
View a Ticker from a Single
Source, 146
View Composite Data, 144
View Data from a Specific
Exchange, 143
Index
View Data from a Specific
Market Maker, 144
Configuring Quote Sources, 150
Confirm All Trades, 278
Connection Line, 12
Connectivity Problems, 319
Connectivity Provider, 12
Control Menu, 25
Convert Currency, 117
Copy a Trend Line, 181
Copy News Data for Another
Application, 96
Copy Time & Sales Data for Another
Application, 152
Copying News, 129
Corporate Actions, 93
Corporate Actions Menu, 44
Corporate Actions Search, 94
Create a Bid Hot Key, 290
Create a Buy Hot Key, 287
Create a Cancel Orders (Account) Hot
Key, 293
Create a Cancel Orders (Symbol) Hot
Key, 292
Create a ChainMinder, 116
Create a Chart, 167
Create a Close Position (Account) Hot
Key, 294
Create a Close Position (Symbol) Hot
Key, 293
Create a Forex Window, 97
Create a MarketMaker Window, 104
Create a new MultiQuote, 125
Create a News Alert, 132
Create a Page, 53
Create a Page Hotkey, 58
Create a Position MarketMinder, 305
Create a Sell Hot Key, 289
Create a Standard MarketMinder, 115
Create a Table, 135
Create a Time and Sales Report, 148
Create a Turbo Options Window, 154
Create an Alarm, 85
Create an Alert, 89
Page 333
Create an Offer Hot Key, 291
Create an OrderMinder, 307
Creating Hot Keys, 287
Cross Order, 245
Currencies, 99
Add a Currency, 99
Custom Sort a MarketMinder, 121
Customize Order Parameters, 272
D
D Averaged (%Da), 215
D Fast (%D), 213
D Slow (%Ds), 215
Data Directory, 18
Data Outages and Data Integrity, 322
Day, 247
Day +, 248
Day Summary, 325
Delete a Favorite, 69
Delete a Hot Key, 299
Delete a Page, 57
Delete a Price Tier, 113
Delete a Trend Line, 182
Delete an Alert, 92
Design a Script, 316
Design Menu, 26
Differential, 137, 169
Directional Movement Indicators
(PDI, MDI, DX, ADX), 233
Discretionary, 238
Display a Ticker, 142
Display Hottrend, 323
Display of a Window, 81
Domain Name, 50
Download Installation from
RealTick.com, 13
Draw a Trend Line, 180
Drop-Down Lists, 24
E
Earnings Calendar, 161
Earnings Surprises, 162
Edit & Save Data in a Chart, 315
Page 334
Edit & Save Data in a Table, 316
Edit a Hot Key, 298
Edit data in a Time & Sales Window,
151
Enlarge a Chart Region, 177
Executing, 318
Expirations, 247
Day, 247
Day +, 248
GTC, 248
IOC, 248
Now, 248
F
Favorites, 63
Add to Favorites, 67
Change a Favorite, 67
Chart, 64
Delete a Favorite, 69
MarketMinder, 64
Open a Favorite, 66
Stocks, 65
Symbols Lists, 66
Turbo Options, 65
Web Browser, 65
Favorites Directory, 18
Favorites Menu, 45
Files Installed, 17
Data Directory, 18
Favorites Directory, 18
Help Directory, 18
Pages Directory, 18
Parm Directory, 18
Sounds Directory, 19
Fixed, 176
Fixed Endpoints, 176
Fixed Page
Fixed Page News Menu, 33
Fixed Page News, 94
Change the View of the Fixed
Page News Window, 96
Copy News Data for Another
Application, 96
View a News Story, 95
Index
View a Story, 95
Forex, 97
Add a Currency, 99
Create a Forex Window, 97
Forex Menu, 35
Move Around in Forex, 99
Function Hot Keys, 287
Futures, 73
G
Gapper Scan, 327
Go To
News, 129
Group Symbols, 118
GTC, 248
H
Hard Drive, 11
Hardware Requirements, 11
Hard Drive, 11
Modem, 11
Operating System, 11
Processor, 11
RAM, 11
System Requirements, 11
Help Directory, 18
Hide the Chart Title (Legend), 175
Hot Key Action Bar, 299
Hot Keys
Actionless Hot Keys, 296
Change Order Action Hot Key,
297
Clone a Hot Key, 298
Create a “Bump” Hot Key, 297
Create a Bid Hot Key, 290
Create a Buy Hot Key, 287
Create a Cancel Orders (Account)
Hot Key, 293
Create a Cancel Orders (Symbol)
Hot Key, 292
Create a Close Position (Account)
Hot Key, 294
Index
Create a Close Position (Symbol)
Hot Key, 293
Create a Page Hotkey, 58
Create a Sell Hot Key, 289
Create an Offer Hot Key, 291
Creating Hot Keys, 287
Delete a Hot Key, 299
Edit a Hot Key, 298
Interact with Order View, 295
Set Page Hot Keys, 79
Hottrend, 323
Day Summary, 325
Display Hottrend, 323
Link Hottrend, 325
MarketMinder, 323
I
Include/Exclude a Market Maker, 110
Indication of Interest, 100
Indications, 100
Add Columns to the IOI Client
Window, 103
Change the Color of Indications,
102
Indications Menu, 44
View Details of a Specific
Indications, 102
Industry Search, 161
Installation Procedures, 13
Install RealTick, 16
Interact with Order View, 295
Internet Requirements, 12
Connection Line, 12
Connectivity Provider, 12
Services, 12
Speed, 12
Intraday Chart Hot Keys, 168
IOC, 248
K
K Fast (%K), 212
Knock Down Scan, 326
Page 335
Kurtosis (KUR), 219, 225
L
Level II. See MarketMaker
Limit Market Exposure, 274
Limit Order, 234
Link a MarketMinder to an
OrderMinder, 310
Link Hottrend, 325
Link Left and Right Axes, 176
Linking Windows, 70
Links to Web Sites, 159
Load a Symbol File, 72
Log on to RealTick, 50
Logarithmic Scale, 176
M
MACD Oscillator (CDO), 205
Market Guide, 163
Market Order, 234
MarketGauge, 329
Access MarketGauge, 329
MarketMaker, 104
Add a Price Tier, 113
Adding and Removing Panels,
111
Change the Color for ECNs, 112
Change the Color of a Price Tier,
114
Create a MarketMaker Window,
104
Delete a Price Tier, 113
Include/Exclude a Market Maker,
110
MarketMakers Menu, 38
My Order, 106
Set an Alarm for Updates, 107
Set Route from ECN ID, 107
Show Market Montage, 112
Show MultiQuote, 111
Show Order Entry Window, 112
Show Range Bar, 112
Show Ticker, 112
Page 336
View Data from a Single
Exchange, 109
View Data from a Single Source,
107
View Data from all Exchanges,
110
View NASDAQ Stock Quotes
from all Sources, 108
View NASDAQ Stock Quotes
from all Sources except ECNs,
109
View NASDAQ Stock Quotes
from ECNs only, 109
MarketMinder, 114
Access the Alerts and Alarms,
118
Add a Symbol to an Existing
MarketMinder, 116
Change the Column Layout, 119
Change the Table Display, 123
Configure Column Layout, 120
Convert Currency, 117
Create a ChainMinder, 116
Create a Standard MarketMinder,
115
Custom Sort a MarketMinder,
121
Group Symbols, 118
MarketMinder Menu, 36
Multiple Selections in a
MarketMinder, 119
Save a Column Layout, 121
Mean, 220
Menu Bar. See RealTick Menu Bar
Microsoft Internet Explorer, 13
Microsoft Outlook, 13
MID, 239
Min/Max Scaling, 175
Modem, 11
Moments, 219
Money Flow (FLO), 230
Monthly Average (AVG), 220
Move a Group of Trend Lines, 181
Move a Trend Line, 181
Move Around in Forex, 99
Index
Moving Average Convergence
Divergence (MCD), 202
Moving Average Momentum (MAM),
201
Moving Average Oscillator (MAO),
199
Moving Average Parameters, 188
Moving Averages, 186
Moving Linear Regression (MLR),
189
Multiple Selections in a
MarketMinder, 119
Multiple Selections in an
OrderMinder, 308
MultiQuote, 124, 311
Configure the MultiQuote
Window to View Your Positions,
312
Create a new MultiQuote, 125
MultiQuote Menu, 40
Save the MultiQuote Window
Layout, 125
Select an Account, 312
My Order, 106
N
NASDAQ Stock Quotes
View NASDAQ Stock Quotes
from all Sources except ECNs in
MarketMaker, 109
View NASDAQ Stock Quotes
from all Sources in MarketMaker,
108
View NASDAQ Stock Quotes
from ECNs only in MarketMaker,
109
Navigate in a Web Browser Window,
159
Navigate News, 128
New Kid on the Block Scan, 327
Newest at Top, 129
News, 126
Index
Add columns to the News
Window, 128
Auto Request Stories, 128
Copy Headlines, 129
Copy Story, 129
Newest at Top, 129
News Headlines, 126
News Menu, 31
News Stories, 126
Open a Story, 127
Page Down, 129
Page Up, 129
Printing News, 129
Search for stories about a symbol,
127
Set an Alarm for News, 129
View Last Story, 129
View News Stories, 127
News Alert, 132
Close a News Alert, 133
Create a News Alert, 132
News Headlines, 126
News Stories, 126
Now, 248
O
Offer, 240
On Balance Volume (OBV), 227
Open a Favorite, 66
Open a Link, 159
Open a Page, 53
Open a Story, 127
Open a Web Browser Window, 158
Open Interest (OI), 227
Open TAL Alerts, 89
Open the Page Manager Dialog Box,
55
Operating System, 11
Option Buttons, 24
Order Book, 250, 313
Order Entry Menu, 42
Order Entry Screen
MarketMaker, 250
Page 337
Stocks, 253
Turbo Options, 253
Order Entry Screen (OES), 250
Order Types, 234
Basket Order, 242
BBO, 239
BID, 240
Conditional Order, 242
Cross Order, 245
Discretionary, 238
Market Order, 234
MID, 239
Offer, 240
Pegging Orders, 245
PostNoPref, 237
Preference, 237
Reserve Order, 243
Short, 241
Staged Order, 244
Stop Limit Order, 236
TOP, 241
Tracking Order, 244
Trailing Stop, 236
OrderMinder, 307
Link a MarketMinder to an
OrderMinder, 310
Multiple Selections in an
OrderMinder, 308
Oscillators, 196
Momentum Oscillator (MOM),
196
Oz Scanner, 326
10 ½ Weeks Scan, 327
9 ½ Weeks Scan, 327
Access an Oz Scanner, 328
Bottom Fisher Scan, 327
Gapper Scan, 327
Knock Down Scan, 326
New Kid on the Block Scan, 327
Power Trader Scan, 327
Sky Scraper Screen, 327
Usual Suspects Scan, 326
Page 338
P
Page Manager, 55
Add a New Page, 56
Create a Page Hotkey, 58
Delete a Page, 57
Open the Page Manager Dialog
Box, 55
Rename a Page, 56
Page Menu, 25
Pages
Create a Page, 53
Open a Page, 53
Save a New Page, 54
Save an Existing Page, 54
View Next or Previous Page, 54
Pages Directory, 18
Parabolic Price/Time Study, 231
Parameters Dialog Box, 186
Parm Directory, 18
Partial, 247
Pegging Orders, 245
Percent Change, 137, 169
Percentage Offset, 191
Perform a TalTrade Ping Test, 319
Perform a TraceRoute Test, 321
Perform an Internet Connectivity Test,
320
Permissions, 10
Pivot Lines, 182
Adding Pivot Lines, 183
Place a Conditional Order from
MarketMaker, 257
Place a Deferred Order from the
Order Book, 256
Place a Reserve Order, 260
Placing Orders, 253
Buy from the Order Entry Screen
in Order Book, 253
Place a Conditional Order from
MarketMaker, 257
Place a Deferred Order from the
Order Book, 256
Sell from the Order Entry Screen
in MarketMaker, 255
Index
Portfolio Balancing, 250
PositionMinder, 304
Change the Column Layout, 306
Create a Position MarketMinder,
305
Select an Account, 305
Positions, 304
PositionMinder, 304
PostNoPref, 237
Power Trader Scan, 327
Preference, 237
Price and Volume Studies, 227
Williams' Accumulation
Distribution (WAD), 228
Price Range, 249
Price Studies, 186
Moving Averages (MA), 186
Price Tier, 113
Add a Price Tier, 113
Change the Color of a Price Tier,
114
Delete a Price Tier, 113
Printing, 61
Print Screen, 61
Printing News, 129
Processor, 11
Q
Quick Double-Click Cancel, 276
Quote Sources
Include/Exclude a Market Maker,
110
Remove Data from a Specific
Market Maker in Ticker, 145
Select an Exchange in Turbo
Options, 154
View a Ticker from a Single
Source, 146
View Composite Data in Ticker,
144
View Composite Exchange Data
in Time & Sales, 150
Index
View Data from a Single
Exchange in MarketMaker, 109
View Data from a Single Source
in MarketMaker, 107
View Data from a Specific
Exchange in Ticker, 143
View Data from a Specific
Market Maker in Ticker, 144
View Data from all Exchanges in
MarketMaker, 110
View Data from all Sources in
MarketMaker, 108
View Data from Selected
Exchanges in Time & Sales, 150
View NASDAQ Stock Quotes
from all Sources except ECNs in
MarketMaker, 109
View NASDAQ Stock Quotes
from all Sources in MarketMaker,
108
View NASDAQ Stock Quotes
from ECNs only in MarketMaker,
109
R
RAM, 11
Range Channel, 195
Rate of Change in Prices (RCP), 206
Ratio, 137, 169
RealTick Control Menu, 25
RealTick Menu Bar, 25
Chart Menu, 28
Corporate Actions Menu, 44
Design Menu, 26
Favorites Menu, 45
Fixed Page News Menu, 33
Forex Menu, 35
Indications Menu, 44
MarketMakers Menu, 38
MarketMinder Menu, 36
MultiQuote Menu, 40
News Menu, 31
Order Entry Menu, 42
Page 339
Page Menu, 25
Stocks Menu, 42
Table Menu, 30
TAL Alarms Menu, 44
Ticker Menu, 31
Time & Sales Menu, 40
Turbo Options Menu, 35
Web Browser Menu, 43
Window Menu, 45
RealTick Pages, 52
RealTick Status Bar
Name and Domain, 49
Server Button, 49
Status Lights, 49
Time, 49
RealTick Toolbar, 46
Refresh Rate, 12
Relative Strength Index (RSI), 218
Remove Data from a Specific Market
Maker, 145
Rename a Page, 56
Replace a Symbol in a Chart, 169
Reserve Order, 243
Resize a Trend Line, 182
Resolution, 12
Right Mouse Button, 21
Root, 116
S
Save a Column Layout, 121
Save a New Page, 54
Save an Existing Page, 54
Save the MultiQuote Window Layout,
125
Scale a Chart, 175, 176
Screen Display Requirements, 12
Color Depth, 12
Refresh Rate, 12
Resolution, 12
Screen Size, 12
Video Card, 12
Screen Size, 12
Scripts
Design a Script, 316
Page 340
Executing, 318
Search by Keyword
News, 127
Search for a News Story, 95
Search for stories about a symbol, 127
Search for Symbols, 72, 74
Sell from the Order Entry Screen in
MarketMaker, 255
Server-Connection Lights, 48
Servers, 71
Change the Server for a RealTick
Window, 72
Monitoring Servers, 71
Status Bar, 71
Services, 12
Set a Startup Page, 78
Set an Alarm for an Order Event, 282
Set an Alarm for News, 129
Set an Alarm for Updates, 107
Set Default Servers, 80
Set General Order Entry Defaults, 279
Set General RealTick Options, 80
Set Page Defaults, 80
Set Page Hot Keys, 79
Set Reserve Order Defaults, 282
Set Route from ECN ID, 107
Set the Price Display for RealTick, 79
Set Warnings to Display after a
Specific Action, 283
Setting Button Colors, 285
Setting Order Entry Defaults for
Quick Trading, 279
Setting Order Status Colors, 286
Setup the Basket Order Entry
Window, 269
Short, 241
Show Account Balance, 275
Signal Line (SIG), 204
Single Item Portfolio Balancing, 250
Skew (SKW), 223
Snap to Date Range, 176
Snap to Printer, 61
Snap to Window, 176
Software, 12
Adobe Acrobat Reader, 13
Index
Microsoft Internet Explorer, 13
Microsoft Outlook, 13
Sounds Directory, 19
Speed, 12
Spreads, 183
Create a Chart Multiplier, 183
Staged Order, 244
Standard Deviation (SD), 222
Status Bar, 48, 71
Lights, 48
Status Lights, 48
Stochastics, 212
Stochastics Parameters, 216
Stocks, 133
Stocks Menu, 42
View Stocks, 134
Stop Limit Order, 236
Stop Market Order, 235
Study Availability Table, 184
Suitability
Portfolio Balancing, 250
Price Range, 249
Single Item Portfolio Balancing,
250
Trade Frequency, 249
Transaction Cost, 249
Transaction Size, 249
Symbol, 137
Add a Symbol, 137
Add a Symbol to an Existing
MarketMinder, 116
Load a Symbol File, 72
Search for Symbols, 73, 74
Symbol Guide, 74
Search for Symbols, 74
Symbol Lists, 66
Create a Window Using the
Chain Symbol Lists, 66
Symbology, 75
Month Code, 76
System Defaults, 77
Change Colors for Up Ticks and
Down Ticks, 77
Index
Change the Spin Button Defaults,
280
Set a Startup Page, 78
Set an Alarm for an Order Event,
282
Set Default Servers, 80
Set General Order Entry Defaults,
279
Set General RealTick Options, 80
Set Page Defaults, 80
Set Page Hotkeys, 79
Set Reserve Order Defaults, 282
Set the Price Display for
RealTick, 79
Set Warnings to Display after a
Specific Action, 283
Setting Button Colors, 285
Setting Order Entry Defaults for
Quick Trading, 279
Setting Order Status Colors, 286
System Requirements, 11
Hardware Requirements, 11
T
Table, 135
Absolute, 137
Add a Symbol, 137
Add a Technical Analysis to a
Table. See Technical Analysis
Calculate Volume Weighted
Average Price, 138
Change a Column in a Table, 141
Change the Display of a Table,
140
Change the Price Display, 137
Create a Table, 135
Daily, 135
Differential, 137
Intraday, 135
Monthly, 135
Percent Change, 137
Ratio, 137
Table Menu, 30
Page 341
Transferring Data to other
Applications, 139
Weekly, 135
TAL Alarms, 84
Create an Alarm, 85
TAL Alarms Menu, 44
TAL Alerts, 89
Create an Alert, 89
Delete an Alert, 92
Open TAL Alerts, 89
Turn Off a Beeping Alarm, 92
TAL Mail
Add a Mail Alert in the Status
Bar, 60
Add a Sound Alert to TAL Mail,
60
Technical Analysis, 183
Acceleration (ACC), 197
Accessing the Parameters Dialog
Box, 186
Add a Technical Analysis to a
Table, 185
Arms' Ease of Movement (EMV),
229
Average Range, 193
Bollinger Bands, 194
Commodity Channel Index
(CCI), 210
D Averaged, 215
D Fast (%D), 213
D Slow (%Ds), 215
Directional Movement Indicators
(PDI, MDI, DX, ADX), 233
K Fast (%K), 212
Kurtosis, 219
Kurtosis (KUR), 225
MACD Oscillator (CDO), 205
Mean, 220
Moments, 219
Momentum Oscillator (MOM),
196
Money Flow (FLO), 230
Monthly Average (AVG), 220
Moving Average Convergence
Divergence (MCD), 202
Page 342
Moving Average Momentum
(MAM), 201
Moving Average Oscillator
(MAO), 199
Moving Average Parameters, 188
Moving Averages, 186
Moving Linear Regression
(MLR), 189
On Balance Volume (OBV), 227
Open Interest (OI), 227
Oscillators, 196
Parabolic Price/Time Study, 231
Percentage Offset, 191
Price and Volume Studies, 227
Price Studies, 186
Range Channel, 195
Rate of Change in Prices (RCP),
206
Relative Strength Index (RSI),
218
Signal Line (SIG), 204
Skew (SKW), 223
Standard Deviation (SD), 222
Stochastics, 212
Stochastics Parameters, 216
Study Availability Table, 184
Tick Count, 226
Upper Envelope/ Lower
Envelope (UP/DN), 191
Variance (VAR), 220
Volatility (VO), 208
Volatility Ratio (VOR), 209
Volume (VOL), 226
Williams' Accumulation
Distribution (WAD), 228
Williams' Percentage Range
(%R), 216
Tick Count (TCT), 226
Ticker, 142
Change the Window Color of a
Ticker, 146
Configuring a Quote Source, 143
Display a Ticker, 142
Ticker Menu, 31
Time & Sales, 147
Index
Calculate Volume Weighted
Average Price, 150
Change the Print Color for Times
& Sales, 152
Color Scheme, 148
Configuring Quote Sources, 150
Copy Time & Sales Data for
Another Application, 152
Create a Time and Sales Report,
148
Edit data in a Time & Sales
Window, 151
Time & Sales Menu, 40
View Composite Exchange Data,
150
View Data from Selected
Exchanges, 150
To view data for a specific symbol,
163
TOP, 241
Tracking Order, 244
Trade Frequency, 249
Trade with Another Account, 275
Trailing Stop, 236
Transaction Cost, 249
Transaction Size, 249
Transferring Data to other
Applications, 139
Trend Lines, 180
Copy a Trend Line, 181
Delete a Trend Line, 182
Draw a Trend Line, 180
Move a Group of Trend Lines,
181
Move a Trend Line, 181
Resize a Trend Line, 182
Troubleshooting, 319
Turbo Options, 153
Change the Width of a Column in
Turbo Options, 157
Select an Exchange, 154
Sizing Columns, 157
Turbo Options Menu, 35
Index
View Details in a Turbo Options
Window, 157
Turn Off a Beeping Alarm, 92
U
Upper Envelope/ Lower Envelope
(UP/DN), 191
Using Accounts, 275
Show Account Balance, 275
Trade with Another Account, 275
Usual Suspects Scan, 326
V
Variance (VAR), 220
Vertical Zooming a Chart, 177
Video Card, 12
View a Statistic at a Specific Position
on a Chart, 178
View a Story, 95
View a Ticker from a Single Source,
146
View Composite Data, 144
View Composite Exchange Data, 150
View Data from a Single Exchange,
109
View Data from a Single Source, 107
View Data from a Specific Exchange,
143
View Data from a Specific Market
Maker, 144
View Data from all Exchanges, 110
View Data from all Sources
MarketMaker, 108
View Details of a Specific Indication,
102
View NASDAQ Stock Quotes from
all Sources, 108
View NASDAQ Stock Quotes from
all Sources except ECNs, 109
View NASDAQ Stock Quotes from
ECNs only, 109
View News Stories, 127
Page 343
View Next or Previous Page, 54
View Stocks, 134
View the Statistics in a Chart, 177
View Your Account Balance, 313
Volatility (VO), 208
Volatility Ratio (VOR), 209
Volume, 247
AON, 247
Partial, 247
Volume (VOL), 226
Volume and Open Interest Studies
On Balance Volume (OBV), 227
Open Interest (OI), 227
Tick Count, 226
Volume (VOL), 226
Volume Hot Keys, 281
W
Web Browser, 158
Earnings Calendar, 161
Earnings Surprises, 162
Industry Search, 161
Links to Web Sites, 159
Market Guide, 163
Navigate in a Web Browser
Window, 159
Open a Link, 159
Open a Web Browser Window,
158
Page 344
Web Browser Menu, 43
Zacks Brokerage Research
Center, 160
Weekly Chart, 166
Williams' Accumulation Distribution
(WAD), 228
Williams' Percentage Range (%R),
216
Window Menu, 45
Windows Features
Close Button, 20
Drop-Down Lists, 24
Maximize Button, 20
Minimize Button, 20
Option Buttons, 24
Restore Down, 20
Right Mouse Button, 21
Window Border, 20
Windows Features in RealTick, 20
Z
Zacks Brokerage Research Center,
160
Annual Balance Sheet, 160
Annual Income Statement, 160
Company Profile, 160
Consensus Estimates, 160
Snapshot, 161
Index