1
Plotting One-Dimensional Data
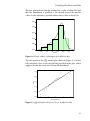
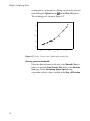
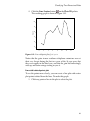
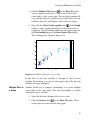
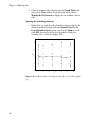
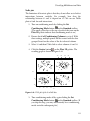
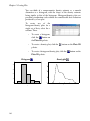
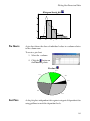
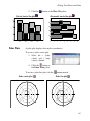
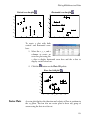
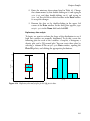
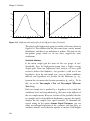
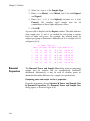
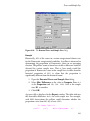
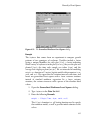
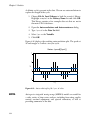
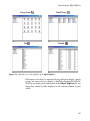
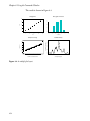
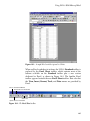
Histogram/density plot
3
2
1
0
0.1
0.3
0.5
0.7
0.9
1.1
x
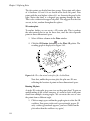
Pie Charts
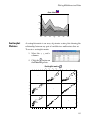
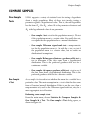
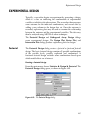
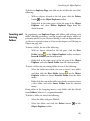
A pie chart shows the share of individual values in a column relative
to the column sum.
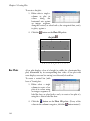
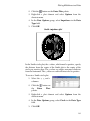
To create a pie chart:
1. Select the x column.
2. Click the
button on
the Plots 2D palette.
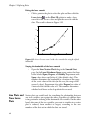
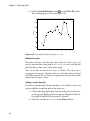
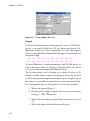
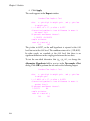
Pie chart
3.0
4.0
2.0
1.0
5.0
6.0
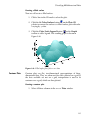
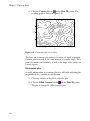
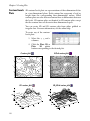
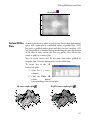
Dot Plots
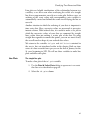
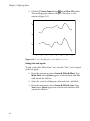
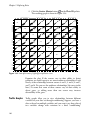
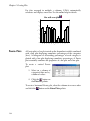
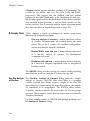
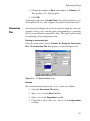
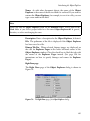
A dot plot plots independent data against categorical dependent data
using gridlines to mark the dependent levels.
131