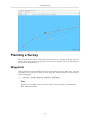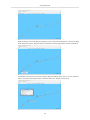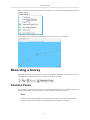
1
SPOT.ON User Manual
Version 3.5.0
Ocean Modules Sweden AB
SPOT.ON User Manual: Version 3.5.0
Ocean Modules Sweden AB
Copyright © 2013 Ocean Modules Sweden AB
SPOT.ON is protected by patents and international copyright laws.
Table of Contents
Preface ......................................................................................................................... v
1. System Requirements ................................................................................................. 1
2. Installation ................................................................................................................ 2
Installing the x264 video codec ................................................................................ 2
Installing SPOT.ON Survey System .......................................................................... 2
Installing Microsoft .NET 4.5 .................................................................................. 2
Installing Optional C-MAP Charts ............................................................................ 3
3. Using SPOT.ON ........................................................................................................ 4
Starting SPOT.ON ................................................................................................. 4
The SPOT.ON Interface and Menus .......................................................................... 4
The File Menu .............................................................................................. 4
The Edit Menu .............................................................................................. 5
The Map Menu ............................................................................................. 5
The Filter Menu ............................................................................................ 6
The Report Menu .......................................................................................... 6
The Windows Menu ....................................................................................... 6
The Help Menu ............................................................................................. 7
Getting Started ...................................................................................................... 7
Creating a Survey .......................................................................................... 7
Working with Panes ....................................................................................... 7
Working with Sensors and Data Input ....................................................................... 9
Audio Input ................................................................................................ 10
Video Input ................................................................................................. 10
Positioning Input .......................................................................................... 12
Ocean Modules ROVII Graphical Representation .............................................. 12
General Serial Input ..................................................................................... 13
Default Input Sources ................................................................................... 14
Map and Image Overlay Configuration .................................................................... 15
SPOT.ON Simple Vector World Map .............................................................. 16
Jeppesen C-MAP Charts ............................................................................... 16
ESRI Shape Maps ........................................................................................ 16
Combination Vector/Raster Maps ................................................................... 17
Georeferenced Images ................................................................................... 18
Map Layer Settings .............................................................................................. 19
Map Orientation and Map Tools ............................................................................. 20
The Map Toolbar ......................................................................................... 20
Panning ...................................................................................................... 20
Zooming ..................................................................................................... 20
Distance Tool .............................................................................................. 20
Planning a Survey ................................................................................................ 21
Waypoints .................................................................................................. 21
Recording a Survey .............................................................................................. 23
Attention Points ........................................................................................... 23
Playing Back a Survey .......................................................................................... 24
Playback Mode ............................................................................................ 24
Viewer Mode .............................................................................................. 25
Track Display Settings .......................................................................................... 25
Postion Data Filtering ................................................................................... 25
Track Display Options .................................................................................. 28
Heading Indicator ........................................................................................ 29
4. Automatic Reporting ................................................................................................. 31
Creating a Printed Report ...................................................................................... 31
Exporting Report to Microsoft Word ....................................................................... 32
5. Sharing a Survey ...................................................................................................... 33
Exporting a Survey .............................................................................................. 33
iii
SPOT.ON User Manual
Partial Export ...................................................................................................... 33
A. Creating a GeoTIFF ................................................................................................. 34
iv
Preface
SPOT.ON is a patented survey management software which allows operators to supervise, manage
and collect synchronized geographic position, video and virtually any other type of data in a survey
environment. Although SPOT.ON was originally designed for underwater use, it is ideal for recording
any type of georeferenced data.
SPOT.ON is used all over the world for pipe inspections, nuclear power plant cooling tunnel
inspections, survey planning, research and harbor control.
The US Navy Explosive Ordnance Disposal Divers use SPOT.ON to inspect ship hulls for
identification, documentation and disposal of improvised explosive devices. The Swedish Road and
Traffic Authority uses SPOT.ON to document roads and automatically flag problem areas for repair.
The Swedish Police have used SPOT.ON with video recorded from a helicopter to visualize sequences
of events following armored car robberies, allowed the court to easily understand the chain of evidence
during the trial.
Other customers include the German Water Police, the Finnish Navy, the Danish Navy and the
Swedish Coast Guard, not to mention countless research institutions, universities, port authorities,
dive operators and survey companies.
Collected data is connected to a track overlay on a drawing, map or chart. Any part of the recorded data
is instantly viewable and playable by simply clicking the track. Points of interest are automatically
presented in an automated report.
Of course, the full survey, including all video and other collected data, can be shared and played back
in the freely available SPOT.ON Viewer.
Due to a flexible and rapid development process custom modules can be deployed quickly. Simple
licensing terms allows installation on multiple computers and transfer of the license between them
without manual activation or an Internet connection.
v
Chapter 1. System Requirements
All testing and verification is performed using Microsoft Windows 7 64-bit English. SPOT.ON should
work with all versions of Microsoft Windows from Windows XP and up, but only testing is limited
and no support can be offered.
Caution
SPOT.ON is always run as a 32-bit process, and can therefore only use 32-bit DirectShow
filters. The main reason that SPOT.ON is always 32-bit is that not all functionality, such as
some of the modules of the chart engine supplied by third party developers, are yet available
in 64-bit versions.
Hardware requirements vary depending on which modules are loaded, number of video streams,
recording quality, survey length, etc.
At least one USB port must be available for the SPOT.ON USB License Key.
Additional video capture hardware, serial port interfaces and USB ports may be required depending
on the type of data to be acquired. Ocean Modules can supply a rack-mounted PC with a SPOT.ON
Hardware Kit which provides the most common interfaces for analog video, HD-SDI video, sonar
and serial data capture.
Warning
The SPOT.ON USB License Key represents the entire value of the SPOT.ON license. A
damaged or faulty USB Key can be repaired or replaced by Ocean Modules. Ocean Modules
is not responsible for replacing a lost or stolen USB Key, please ensure the USB Key is
adequately protected from loss or theft.
SPOT.ON started without a USB License Key inserted into one of the computer's USB ports will
function in Viewer Mode. To use the full feature set, a valid USB License Key must be present.
1
Chapter 2. Installation
Installing the x264 video codec
Before installing SPOT.ON, install the latest version of 32-bit x264 Video for Windows, from the
installer supplied on the USB memory with the SPOT.ON installer, or download the latest version
from: http://sourceforge.net/projects/x264vfw/files/x264vfw.
If the video codec has not been configured previously, open the the x264 Video for Windows
configuration application from the Windows Start menu.
Select a "Preset" to suit the computer's capabilities, "medium" provides a reasonable compromise
between quality, file size and processor requirements. If performance problems persist choose a faster
encoding. Check the "Zero Latency" box. Set "Log Level" to "None". Do not change any of the other
default settings. Save changes before closing the application.
Installing SPOT.ON Survey System
Start the SPOT.ON Installer from the USB memory, accept the license agreement, check which
fixes and features have been added since the last version and launch SPOT.ON. The Ocean Modules
SPOT.ON USB License Key does not need to be inserted for installation. An installation which is
started without a SPOT.ON USB License Key will function in SPOT.ON Viewer Mode.
Installing Microsoft .NET 4.5
SPOT.ON version 3.5 requires the Microsoft .NET framework version 4.5. If the computer is not
already equipped with .NET 4.5 a message will be displayed when SPOT.ON is started. If required,
install Microsoft .NET 4.5 from the SPOT.ON USB License Key. An Internet connection is required
to complete the installation.
2
Installation
Installing Optional C-MAP Charts
SPOT.ON features support for optional Jeppesen Marine C-MAP digital charts which can be used to
replace the standard vector world map. C-MAP charts work together with optional GeoTIFF overlay
images. Please install SPOT.ON before installing C-MAP as this will create the directory into which
the chart data is to be placed.
To install C-MAP charts for use in SPOT.ON the following is required:
• Jeppesen C-MAP Professional+ chart database DVD or USB memory
• Jeppesen JeT Carmenta USB eToken Hardware License Key
• Jeppesen Carmenta .usr file
• PKI eToken installer .msi file
• C-MAP Runtime installer .msi file
Installation instructions:
1. Copy the Jeppesen Marine C-MAP Professional+ chart data folder named CM93_3 from the
supplied DVD or USB memory to C:\Maps\CM93_3.
2. Before continuing with application installation, log in as an Administrator, and ensure that
Windows User Account Control (UAC) is turned off in the user account settings. Once installation
and test is complete UAC can be enabled again.
3. Install the eToken client PKIClient-x64-5.1-SP1.msi (for 64-bit Windows) from the supplied DVD
or USB memory. This software makes it possible to use the USB License Key for the C-MAP
chart data.
4. From the Start Menu, run the Start eToken PKI Client application from the eToken folder.
5. From the supplied DVD or USB memory, run the CMapRTE.msi installer to install the Jeppesen
Marine C-MAP Runtime. When prompted to insert the Jeppesen Marine USB eToken, labelled
with a JeT Carmenta System ID, do so and click "Yes". If Windows detects the USB eToken and
asks to install drivers, choose "No".
6. From the Start Menu, run the C-Map Chart Manager from the C-Map Professional SDK Runtime
folder.
7. From the Databases tab in the C-Map Chart Manager, click Register manually and select the
C:\Maps\CM93_3 folder. The new chart should appear as Professional+ in the list of registered
databases. Select the new database and click "Set as Default". A checkmark should appear to the
left of the Professional+ database.
8. From the Licenses tab in C-Map Chart Manager, click "Import from file" and select the .usr file
from the supplied DVD or USB memory. The file name should correspond to the JeT Carmenta
System ID label on the USB eToken. The License list should now list the zones and areas for which
the installation is now licensed. Close the C-Map Chart Manager.
Start SPOT.ON and set up the survey to to use C-MAP according to the "Charts" section of this manual.
Note
To increase performance under certain conditions some zoom levels have been removed.
Zoom in until chart data becomes visible, and then pan to the correct area.
3
Chapter 3. Using SPOT.ON
Starting SPOT.ON
To use the recording, editing and reporting features of SPOT.ON, a valid Ocean Modules SPOT.ON
USB License Key must be inserted into one of the computer's USB ports. Without a valid License
Key installed SPOT.ON will run in Viewer Mode which will allow recorded surveys which have been
exported for use in Viewer Mode to be played back.
The SPOT.ON Interface and Menus
The File Menu
The File menu contains options for creating new surveys, opening surveys in different modes and
exporting surveys for use in the freely distributable SPOT.ON Viewer.
• New... - presents a dialog for entering a new survey folder name. A new folder will be created in
the default surveys folder to hold the new survey data. If a survey folder with this name already
exists the user will be prompted to choose a new name.
• Open for Playback... - presents a dialog for selecting a survey to open for playback. Select the survey
folder itself, not any of the folders or files inside it.
• Open for Recording... - presents a dialog for selecting a survey to open for continued recording.
Select the survey folder itself, not any of the folders or files inside it.
• Switch to Recording Mode - allows recording to continue in the currently opened survey. This
option then changes to Switch to Playback Mode.
• Close Survey - closes the currently open survey.
• Recent Surveys - holds a list of recently opened surveys for quick access.
• Create Partial Copy - creates a new survey containing only a portion of the open survey. Please see
the section about partial copies in this manual for more details.
• Export Survey... - presents a dialog to choose an external location to save the currently open survey,
for example a USB memory stick.
• Open with Viewer... - displays the current survey in Viewer Mode. This is how the survey will look
when opened in the freely distributable SPOT.ON Viewer.
• Restore Default Settings and Exit - closes SPOT.ON and deletes user settings reverting to the default
settings.
4
Using SPOT.ON
• Exit - closes the currently open survey and exits SPOT.ON.
The Edit Menu
The Edit menu contains options for adjusting global settings for the SPOT.ON installation.
• Settings... - contains general settings for the SPOT.ON environment.
• Add/Remove Data Sources... - a shortcut to the Data Sources panel, only available in Recording
Mode, discussed in the Adding Sensors section of this manual.
The General Settings allow system-wide choice of lat/long formatting and setting of the default survey
location.
The Map Menu
The Map menu contains map setting options.
• Layers... - allows selection of layer visibility, attention points, waypoints, overlay images, map
components, etc. See the section about map configuration in this manual for details.
5
Using SPOT.ON
• Overlay Image... - allows geo-referenced satellite images or drawing overlays to be placed over the
standard map. See the section about map configuration in this manual for details.
• Configuration... - offers choice of different types of maps and charts. See the section about map
configuration in this manual for details.
The Filter Menu
The Filter menu provides access to the Filter Positions configuration window. See the section about
position filtering in this manual for details.
The Report Menu
The Report menu provides access to the automated report features.
• Preview - generates a preview of the automated report for the open survey.
• Page Setup... - provides access to the page setup configuration of the default printer.
• Print... - prints the automated report for the currently open survey.
• Export as Word File... - exports the complete automated report as a .docx file for further editing
in Microsoft Word.
• Report Settings... - allows text for Title, Client and Survey Description to be added to the
automatically generated report.
Please see the section about auotomated reports in this manual for more information.
The Windows Menu
The Windows menu provides access to the panes corresponding to each of the installed and activated
modules. Menu items will depend on SPOT.ON configuration and installed modules. Windows that
have been closed can be accessed from this menu.
6
Using SPOT.ON
The Help Menu
The Help menu shows release information and provides access to this manual online.
• About - shows the version number of the installed build and the change log of recent versions.
• Online Manual - provides access to the latest version of this manual online.
Getting Started
Creating a Survey
Choose new from the File menu and create a new survey by giving it a reasonable folder name, it will
be saved in the folder set in the general preferences. If the chosen survey name is in use SPOT.ON
will ask for a new name before allowing the survey to be saved.
Working with Panes
SPOT.ON is based on a flexible window management system which allows most windows to be
floating, docked, tabbed or a combination of several modes. The following pane types are always
available. Additional panes may be available depending on which data sources have been set.
• Logging - shows the log file, useful for debugging problems, but not relevant for normal survey use.
• Attention Points - list of the points of interest that can be added during operation.
• Map - the map or drawing where the track is plotted.
• DataSources - configuration of the preferences and sensors for platforms to be tracked, currently
only supports one platform.
• Timeline - provides access to navigation by time, only visible in playback mode.
Panes can be dragged and docked or tabbed in different positions, or released as separate windows.
They may also be hidden by using the close X, but can always be made visible again from the Window
Menu.
7
Using SPOT.ON
Floating windows can be moved around freely, and placed anywhere on the desktop. Windows can be
docked to any side of any window, splitting the view where it has been added, by dragging it to one
of the docking squares at the sides or in the center of the available view spaces.
Windows can be tabbed in a view space by dragging the window to the center of the docking icon in
the center of a window. Each tabbed window in the particular view space will be represented by a tab
at the bottom of the space, and can be accessed by a click on the tab.
8
Using SPOT.ON
A reasonable layout for a new recording is a the Map pane and the Attention Points pane.
Working with Sensors and Data Input
Sensors are added in the DataSources pane. SPOT.ON has support for many types of sensors, the most
common are positioning data and video. Additional modules are available for sensors such as vehicle
orientation data, cable trackers and sonars.
The Data Sources pane shows which data sources have been added, and the status of each data source.
Clicking Add/Remove... brings up the Input Streams configuration window where existing streams
can be configured or removed, and new streams can be added.
The "Add/Remove..." button brings up the source choice dialog, where the various types of data
sources can be added. Clicking the "Default Input Streams..." button brings up a dialog where all
sources currently in use can be set to be activated automatically every time SPOT.ON opens. Sources
can also be added or removed from the list one at a time.
9
Using SPOT.ON
If no data string is indicated in the DataSources window, the port may be configured incorrectly, or
no valid positions are being transmitted by the positioning system. Settings can be adjusted using the
Settings button. When valid positions are being received the NMEA string will be indicated in the
DataSources pane.
Audio Input
The audio stream data source will continuously record audio from a connected audio device, such as
operator voice notes, hydrophone or diver communication. There is no graphical visualisation of the
audio input.
Video Input
Multiple video and sonar feeds can be added from the DataSources pane. Click Add/Remove and
choose Video stream. Configure the video device, normally SPOT.ON will choose the best resolution
to use. Do not change this setting without good reason to do so. It is possible to name video sources,
for example "front camera", "read camera" or "multibeam sonar".
10
Using SPOT.ON
The rack-mounted PC that is delivered with Ocean Modules V8 ROV system can be equipped with
a SPOT.ON Hardware Kit which allows simultaneous recording of HD-SDI video, analog video and/
or PC monitor based graphic displays such as sonars.
If the video preview pane is not visible, it can be accessed from the Windows menu.
Sonar input through a VGA/DVI frame grabber is also available through the video data source
selection.
11
Using SPOT.ON
Positioning Input
The position input source has support for standard NMEA GPGGA and Kongsberg PSIMSSB serial
input strings used by major GPS and underwater positioning system manufacturers.
Ocean Modules ROVII Graphical Representation
The Ocean Modules NMEA ROVII data source can parse attitude data from the Ocean Modules V8
range of ROV systems.
12
Using SPOT.ON
The Ocean Modules NMEA ROVII data source presents the overlay output as a graphical display of
heading, pitch, roll and depth.
General Serial Input
The General Serial data source allows a serial port to be configured to collect any type of serial data,
such as output from a sound velocity sensor or an altimeter.
13
Using SPOT.ON
Data collected from a General Serial data source is displayed as a text string prefixed with a timestamp.
Default Input Sources
The currently active data sources can be set to activate every time a survey is opened for recording
in SPOT.ON by clicking the Default Input Streams button and then Set the current input streams as
default botton. It is also possible to selectively add current input streams to the default list by selecting
the input source in the Current Input Streams (the left list) and clicking the Add button. Input sources
can be selectively removed from the default source list by selecting the input source in the Default
Input Streams (the right list) and clicking Remove.
14
Using SPOT.ON
Map and Image Overlay Configuration
SPOT.ON comes preconfigured for a number of different map and chart services.
Map configuration can be set as default for new surveys and for individual surveys. In both cases the
map data source is set in the Configuration pane accessed from the Map menu. If no survey is currently
open only the default configuration can be set.
Setting a configuration as default will cause it to be used for all future surveys, until it is changed
again. It is always possible to revert to the default map.
Caution
Map changes will only take effect when the survey has been reopened in SPOT.ON. This
means that changing a map for a currently open survey will the survey to be reopened.
Note
Even though the configuration option is available additional chart data and/or appropriate
licenses may need to be installed.
If a configuration file for a custom map not available from the standard configuration has been
provided, it can be added from the Custom Map Configuration option.
15
Using SPOT.ON
SPOT.ON Simple Vector World Map
SPOT.ON is always delivered with the SPOT.ON Simple Vector World Map preinstalled, which is a
very fast and lightweight map, however it is not very detailed.
More detailed maps be purchased through Ocean Modules.
Jeppesen C-MAP Charts
Detailed charts, such as C-MAP by Jeppesen (http://ww1.jeppesen.com/main/corporate/marine/
lightmarine/gb/) can be purchased through Ocean Modules.
ESRI Shape Maps
Many national maps are available in vector (ESRI Shape) and/or raster format from the relevant
authority in each respective country. SPOT.ON includes configuration for a number of these national
maps and others can be licensed through Ocean Modules.
16
Using SPOT.ON
If configuration for a required vector or raster map does not exist, it can be developed by Ocean
Modules.
Combination Vector/Raster Maps
Configuration for some map types can switch between vector (ESRI Shape) maps of different levels
of detail depending on zoom level, and even switch to high-resolution raster images (such as satellite
imagery) at closer zoom levels.
Overview zoom level showing a general vector data map.
Mid-level zoom showing a detailed vector data map.
17
Using SPOT.ON
Detailed zoom view showing a raster data map.
Georeferenced Images
A geo-referenced image in GeoTIFF, such a satellite map, a sea chart, a side-scan sonar image or a
drawing can be positioned over any standard map using the Overlay Image function in the Map menu.
Complete instructions for creating overlay images using QGIS can be found in the Creating GeoTIFF
Overlays chapter of this manual.
An imported image can be archived for easy access for future surveys by using the save to archive
function.
18
Using SPOT.ON
Once completed, the image will appear over the map in the chosen position. If the image does not
appear to be correct, most likely more reference points, or reference points with better accuracy, need
to be added to the geotiff configuration.
The image overlay configuration will also accept Google KMZ files in the format generated by the
DeepView Publisher sidescan sonar data acquisition and rendering software.
Map Layer Settings
The Layer settings, accessible from the Map menu, control the display of items in the map view. Layers
which can be shown or hidden for the actual map will vary from map to map. It is also possible to
show or hide SPOT.ON components displayed on the map, such as waypoints, attention points and
the positioned cursor.
19
Using SPOT.ON
Map Orientation and Map Tools
The Map Toolbar
The Map Toolbar provides easy access to the most commonly used function, although most of them
can be controlled through keyboard shortcuts or mouse actions .
Panning
The map can be panned by holding down the left mouse button and dragging the map.
Zooming
The can be zoomed by holding the right mouse button and dragging, by using the Plus and Minus
buttons on the Map Toolbar or by using a mouse equipped with a scroll wheel.
The map can be zoomed to a specific area by using the Zoom Box button on the Map Toolbar and
then dragging the mouse to draw the selection box. Deactivate the zoom box by clicking the same
button again.
Distance Tool
The distance tool can be activated by clicking the Distance Tool button and then clicking points on
the map. It is deactivated by clicking the button again.
20
Using SPOT.ON
Planning a Survey
Once the required map and/or overlay image has been loaded, it is possible to plan the survey by
setting a route using waypoints. Waypoints can also be used to mark the location of objects that are
to be inspected during the survey.
Waypoints
Clicking the Waypoint Tool in the Map Toolbar activates the Waypoint Tool. While active, each click
in the Map View will result in creation of a new Waypoint. Existing Waypoints can be moved by
clicking and dragging.
Note
Waypoints can be added at any point before, during or after recording, in both Recording
Mode and Playback Mode.
21
Using SPOT.ON
Right-clicking on an existing Waypoint displays a context menu allowing deletion or precision editing
of the Waypoint. When a Waypoint has been deleted the remaining Waypoints will be renumbered.
Coordinates can be entered accurately using the Waypoint Editing pane, where it is also possible to
enter a note which will be displayed as a text label next to the Waypoint on the map.
22
Using SPOT.ON
Display of lines connecting Waypoint can be toggled on or off using the Display Settings menu of
the Map Toolbar.
Connecting lines are useful if the Waypoints describe a route that is to be followed.
Recording a Survey
Recording of all input sensor data is started by clicking the Record button in the Survey Toolbar. A
track appears as the tracked objekt moves and position data is recorded.
Attention Points
Any number of Attention Points can be recorded during the operation by repeatedly clicking the
Attention Point button. Attention Points are tied to the time at which they were set.
Note
Unlike Waypoints, the coordinates of Attention Points will always be an approximation along
the track, which may also change if the smoothing filters are applied or changed.
23
Using SPOT.ON
Attention Points are used to mark the time at which objects of interest can be observed using the
sensors, making it simple to navigate back to them in Playback Mode.
Attention Point notes can be edited by double-clicking the Note field, typing some text, ending with
the return key. Attention Points can be deleted by right-clicking on the desired Attention Point and
choosing the appropriate option in the context menu.
Playing Back a Survey
There are two modes in which a survey can be played, Playback Mode and Viewer Mode.
Playback Mode
In Playback Mode all the editing and map manipulation tools are available, such as adding, moving
or deleting Attention Points and Waypoints, map configuration, addition of overlay imagery, and
application of smoothing filters.
A survey can be played back by choosing "Open for Playback..." in the File menu, or using the "Switch
to Playback Mode" when the survey is open for recording.
Caution
Playback Mode requires a computer with a valid SPOT.ON USB License.
Click the Play button to start playback. Recorded surveys can be navigated by clicking anywhere on
the track, clicking on Attention Points in the Attention Points pane or dragging the Time Line cursor.
24
Using SPOT.ON
Viewer Mode
In Viewer Mode, all editing functions are locked and the map, survey track, Attention Points and
Waypoints are exported as a static image. Viewer Mode is useful as a preview of how the survey will
look if exported and opened in the freely available SPOT.ON Viewer.
Note
A SPOT.ON installation without a valid SPOT.ON USB License Key can only be run in
Viewer Mode.
Warning
Only surveys with current reports can be opened in Viewer Mode. Generate the report before
copying a survey a survey for use in Viewer Mode.
Track Display Settings
Postion Data Filtering
Display of position data as a track on the map can be filtered to account for errors and inaccuracies
of the positioning system. Without filtering a track may look jagged or make unreasonable jumps due
to outliers.
25
Using SPOT.ON
The filtering settings can be adjusted in the Position Filter pane accessible from the Filter menu.
Note
Clicking Apply immediately applies the filter to the visible portion of the track on the map.
Adding a moderate amount of smoothing and outlier removal results in a track close to the original,
but with some unexpected "loops".
26
Using SPOT.ON
Applying more outlier removal removes the "loops".
For low quality position data more smoothing, outlier removal and greater error allowance may be
required, but adding too much will result in a less accurate track.
27
Using SPOT.ON
Caution
Filters can only be applied in Playback Mode. However, it is possible to switch a survey from
Recording Mode to Playback Mode, apply the filters and then switch back to Recording Mode
and use the filtered view of position data which was recorded before the filter was applied.
Track Display Options
The track display can be set in the Track Display Setting menu.
Track as Points shows only the raw data from the positioning system, as points on the map.
Track as Line connects each data point collected by the positioning system with a line.
Filtered Track shows only the filtered track.
28
Using SPOT.ON
Caution
A filter must have been applied in order to show Filtered Track.
Filtered Track and Original Track as Points shows both the filtered track and the raw data as points.
Caution
The track settings that are selected when reports are created, or surveys exported for Viewer
use are the ones that will be used for map presentation in the printed report and during
playback in Viewer Mode.
Heading Indicator
If heading data for the tracked object is available through the Ocean Modules NMEA ROVII interface
clicking the Show Heading Indicator from the Display Settings menu in the Map Toolbar will display
a line from the cursor to the edge of the map view making it easier to follow a set course.
29
Using SPOT.ON
30
Chapter 4. Automatic Reporting
Creating a Printed Report
A printed report can be generated using the Report menu. The report will contain an overview of the
map and the data collected for each Attention Point.
The report can be generated or regenerated and previewed at any time.
31
Automatic Reporting
Exporting Report to Microsoft Word
The report can be exported in editable Microsoft Word .docx format by choosing Export as Word
File... from the Report menu.
32
Chapter 5. Sharing a Survey
A survey can be shared by copying the entire survey folder from the default survey location. If the
location has not been changed it will be the SPOT.ON Surveys folder on the desktop.
Warning
A survey copied without a proper and current generated report may not be viewable in Viewer
Mode.
Exporting a Survey
A survey can also be copied using the Export Survey... option in the File menu. Using the export
function guarantees that all files are up to date for use in Viewer Mode.
Note
Using the export function is the recommended method for sharing a survey to be played back
in Viewer Mode.
Partial Export
It is possible to export only a portion of a recorded survey. To select a time range for partial export,
navigate to the starting time for the portion to be exported and click the Set button under the label
Start Time in the Time Line.
Navigate to the end of the portion to be exported and click the Set button under the label End Time
in the Time Line.
To complete the export, choose Create Partial Export form the File Menu.
Caution
Creating a partial export may require recoding of large audio and/or video files, and may
take several minutes.
33
Appendix A. Creating a GeoTIFF
Download and Install Quantum GIS if it is not already installed. Quantum GIS can be downloaded
free of charge from http://www.qgis.org. This guide is based on Quantum GIS 1.7.4-Wroclaw for
Windows, but instructions for more recent versions or other operating systems should be similar.
Open the Georeferencer plugin by clicking on the Georeferencer icon or choose Plugins ->
Georeferences -> Georeferencer in the menu.
Open the map image you want to convert to a geotiff by clicking the Open raster icon or choose File
-> Open raster in the menu.
Georeferences will ask you what CRS (Coordinate Reference System) you want. You will typically
want to use WGS 84, i.e., the reference system used by GPS.
34
Creating a GeoTIFF
Add at least two points (coordinates) by first selecting the Add point tool and the clicking on points
on the map with known coordinates. Notice that X-coordinates comes before Y-coordinates which is
the reverse compared for example coordinates taken from Google maps. The points in the example
image is the two red dots on the map.
Open Transformation settings by clicking the transformation settings icon or or choose Settings ->
Transformation settings in the menu.
35
Creating a GeoTIFF
Choose your destination GeoTIFF file as Output raster. We recommend setting Target SRS to
EPSG:4326, i.e., WGS 84.
Generate the GeoTIFF by clicking Start georeferencing icon or choose File -> Start georeferencing
in the menu.
Now you have a GeoTIFF image that can be used in SPOT.ON.
36