1
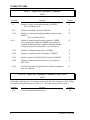
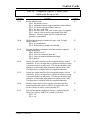
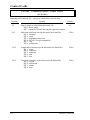
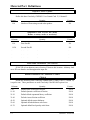
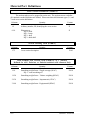
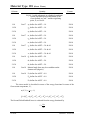
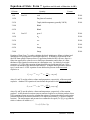
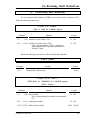
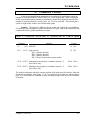
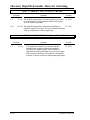
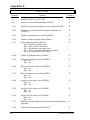
(Thermal Orthotropic Elastic with 12 Curves)
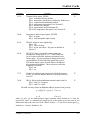
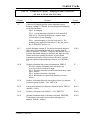
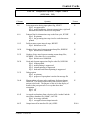
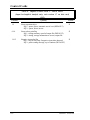
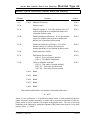
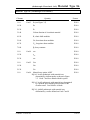
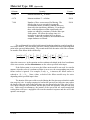
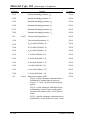
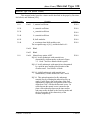
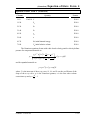
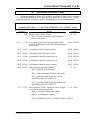
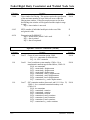
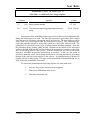
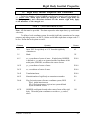
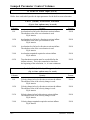
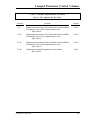
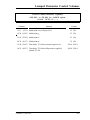
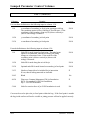
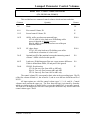
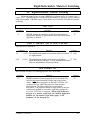
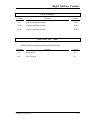
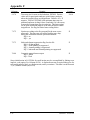
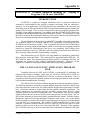
Material Type 23
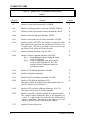
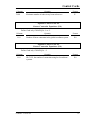
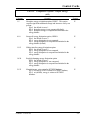
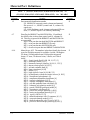
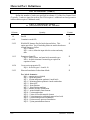
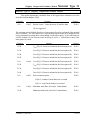
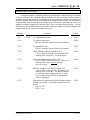
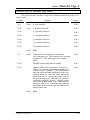
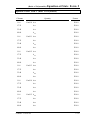
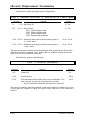
Material Type 112
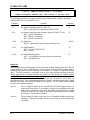
(Finite Elastic Strain, Piecewise Linear Isotropic Plasticity)
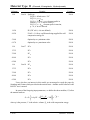
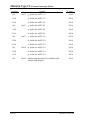
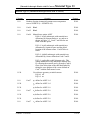
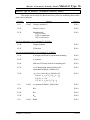
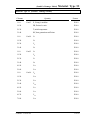
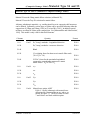
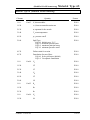
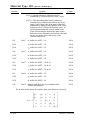
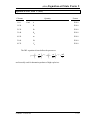
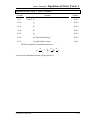
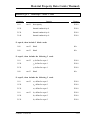
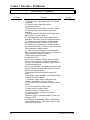
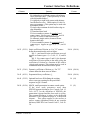
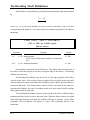
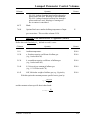
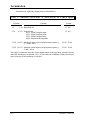
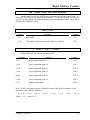
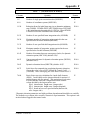
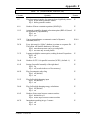
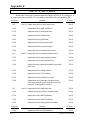
Columns
1-10
Quantity
Card 3
Format
Young’s modulus
E10.0
11-20
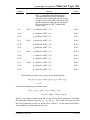
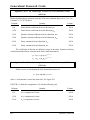
Strain rate parameter, C
E10.0
21-30
Strain rate parameter, p
E10.0
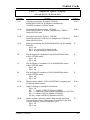
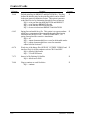
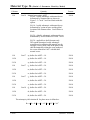
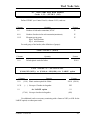
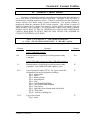
1-10
Card 4
Poisson’s ratio
E10.0
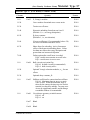
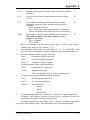
1-10
Card 5
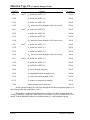
Yield stress
E10.0
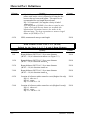
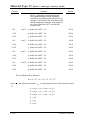
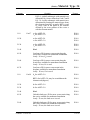
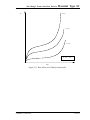
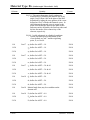
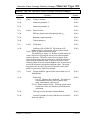
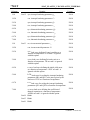
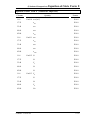
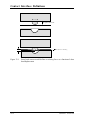
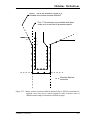
Load curve ID or Table ID. The load curve ID
defines effective stress versus effective plastic strain.
Cards 7 and 8 are ignored with this option. The
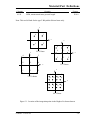
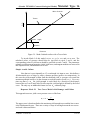
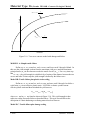
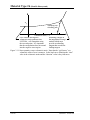
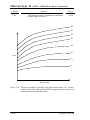
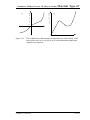
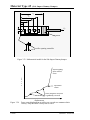
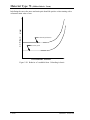
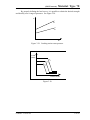
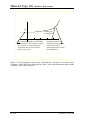
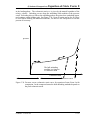
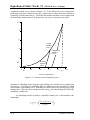
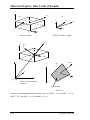
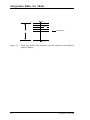
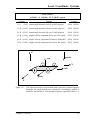
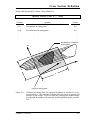
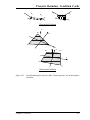
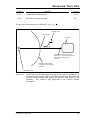
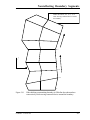
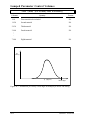
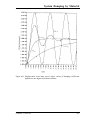
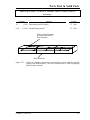
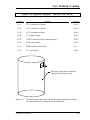
table ID, see Figure 3.9, defines for each strain rate
value a load curve ID giving the stress versus
effectiveplastic strain for that rate. The stress versus
effective plastic strain curve for the lowest value of
strain rate is used if the strain rate falls below the
minimum value. Likewise, the stress versus effective
plastic strain curve for the highest value of strain rate is
used if the strain rate exceeds the maximum value. The
strain rate parameters on card 3, the curve ID on card
6, and cards 7 and 8 are ignored if a Table ID is
defined.
E10.0
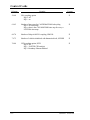
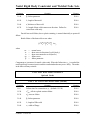
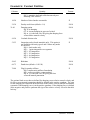
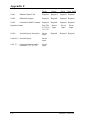
Tangent modulus, ignored if the stress-strain curve is
defined below
E10.0
Load curve number to scale yield stress to account for
strain rate effects.
E10.0
11-20
1-10
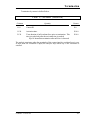
Card 6
11-20
1-80
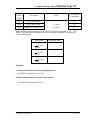
Card 7
Effective plastic strain values (define up to 8 points)
E10.0
1-80
Card 8
Corresponding yield stress values
E10.0
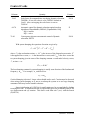
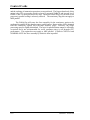
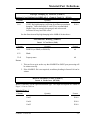
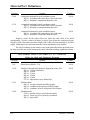
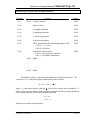
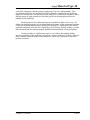
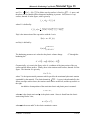
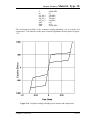
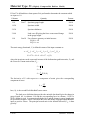
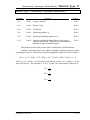
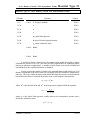
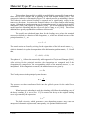
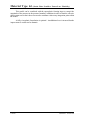
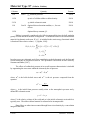
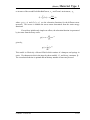
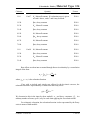
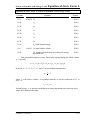
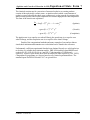
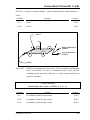
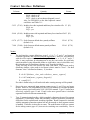
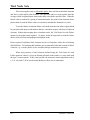
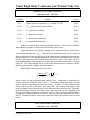
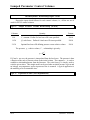
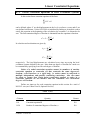
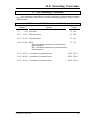
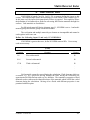
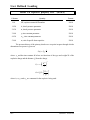
The stress strain behavior may be treated by a bilinear stress strain curve by
defining the tangent modulus. Alternately, a stress versus effective plastic strain curve
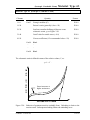
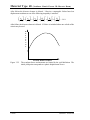
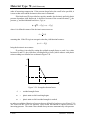
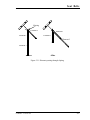
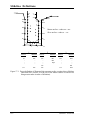
(Card 5, Columns 11-20) similar to that shown in Figure 3.8 can be used. If eight point
are insufficient, a load curve may be used with an arbitrary number of points. The cost is
roughly the same for either approach. The most general approach is to used the table
definition, (Card 5, Columns 11-20) discussed below.
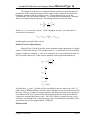
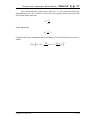
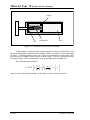
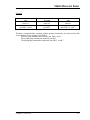
Three options to account for strain rate effects are possible.
LS-DYNA Version 960
3.23.1m