1
482
Chapter 34
Chi-Square Test
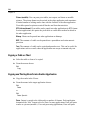
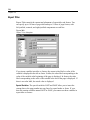
The Chi-Square Test procedure tabulates a variable into categories and computes a
chi-square statistic. This goodness-of-fit test compares the observed and expected
frequencies in each category to test either that all categories contain the same
proportion of values or that each category contains a user-specified proportion of
values.
Examples. The chi-square test could be used to determine if a bag of jelly beans
contains equal proportions of blue, brown, green, orange, red, and yellow candies.
You could also test to see if a bag of jelly beans contains 5% blue, 30% brown, 10%
green, 20% orange, 15% red, and 15% yellow candies.
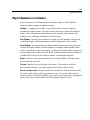
Statistics. Mean, standard deviation, minimum, maximum, and quartiles. The number
and the percentage of nonmissing and missing cases, the number of cases observed
and expected for each category, residuals, and the chi-square statistic.
Data. Use ordered or unordered numeric categorical variables (ordinal or nominal
levels of measurement). To convert string variables to numeric variables, use the
Automatic Recode procedure, available on the Transform menu.
Assumptions. Nonparametric tests do not require assumptions about the shape of
the underlying distribution. The data are assumed to be a random sample. The
expected frequencies for each category should be at least 1. No more than 20% of the
categories should have expected frequencies of less than 5.
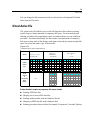
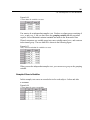
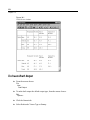
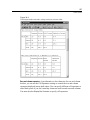
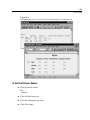
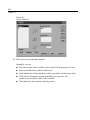
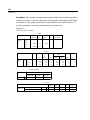
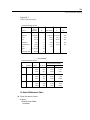
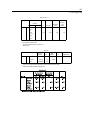
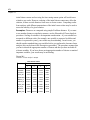
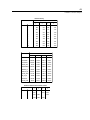
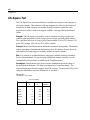
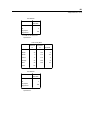
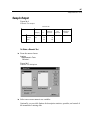
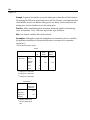
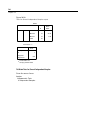
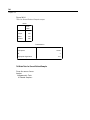
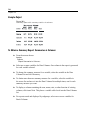
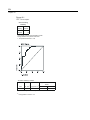
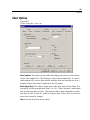
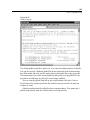
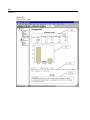
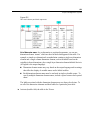
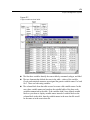
Figure 34-1
Chi-Square Test output
Color of Jelly Bean
Observed
N
Blue
Expected
N
Residual
6
18.8
-12.8
Brown
33
18.8
14.2
Green
9
18.8
-9.8
Yellow
17
18.8
-1.8
Orange
22
18.8
3.2
Red
26
18.8
7.2
Total
113