1
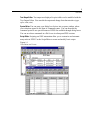
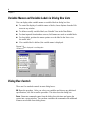
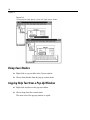
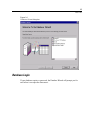
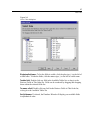
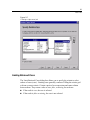
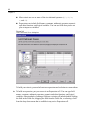
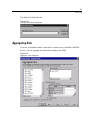
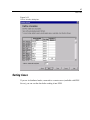
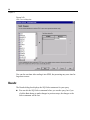
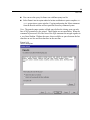
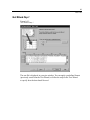
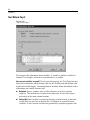
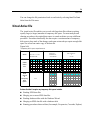
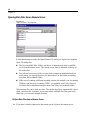
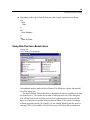
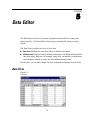
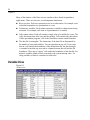
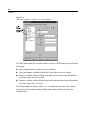
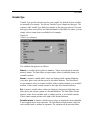
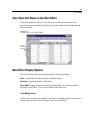
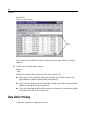
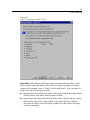
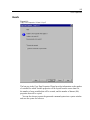
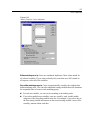
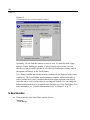
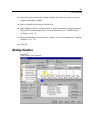
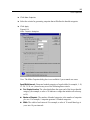
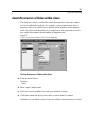
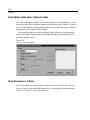
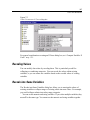
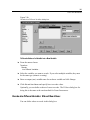
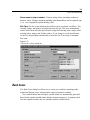
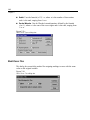
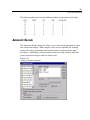
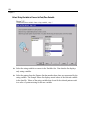
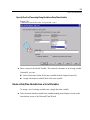
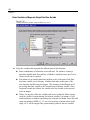
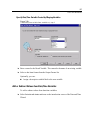
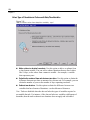
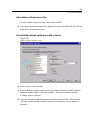
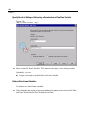
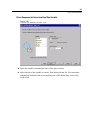
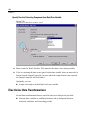
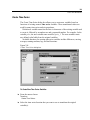
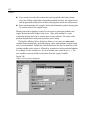
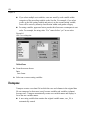
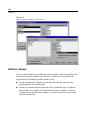
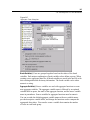
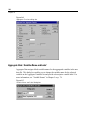
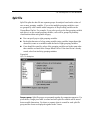
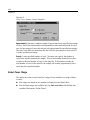
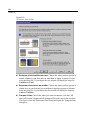
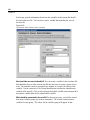
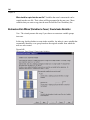
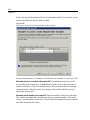
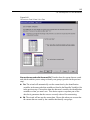
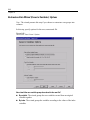
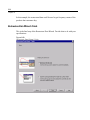
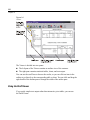
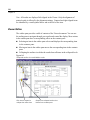
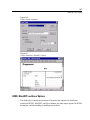
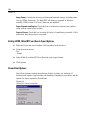
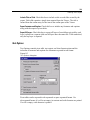
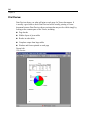
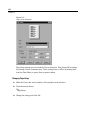
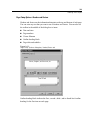
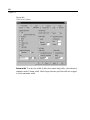
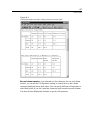
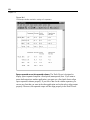
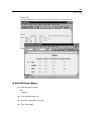
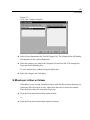
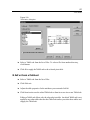
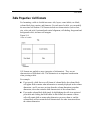
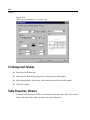
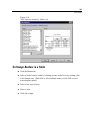
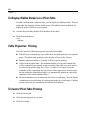
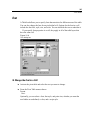
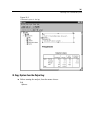
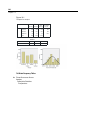
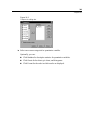
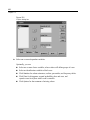
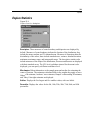
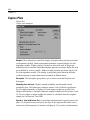
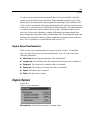
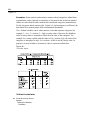
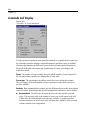
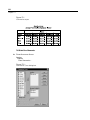
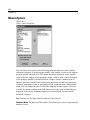
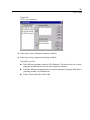
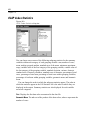
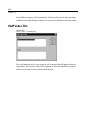
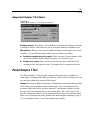
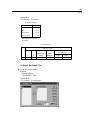
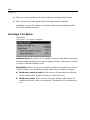
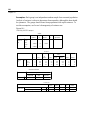
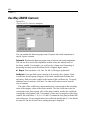
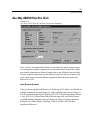
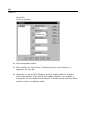
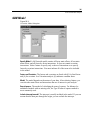
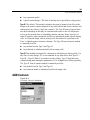
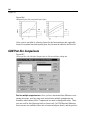
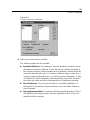
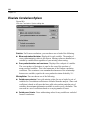
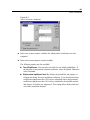
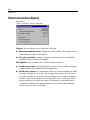
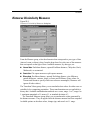
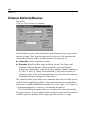
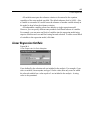
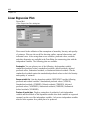
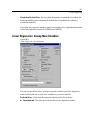
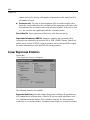
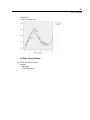
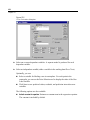
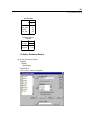
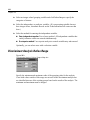
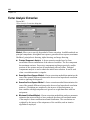
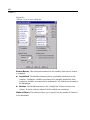
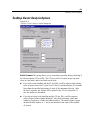
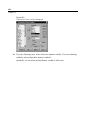
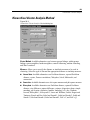
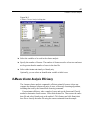
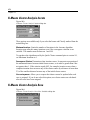
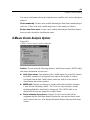
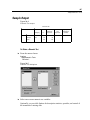
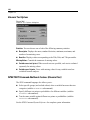
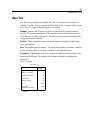
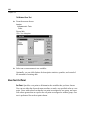
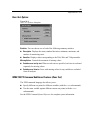
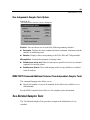
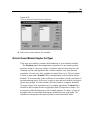
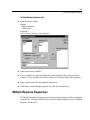
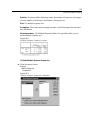
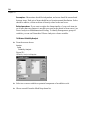
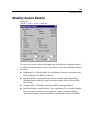
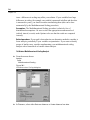
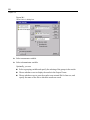
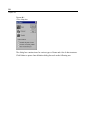
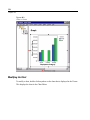
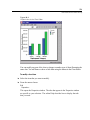
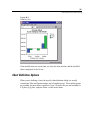
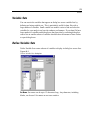
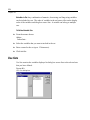
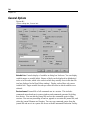
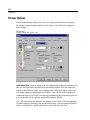
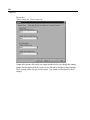
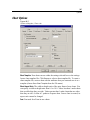
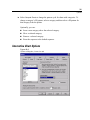
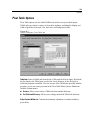
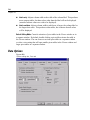
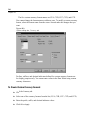
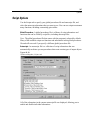
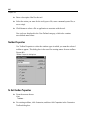
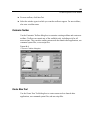
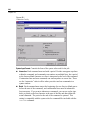
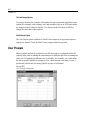
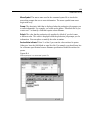
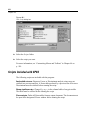
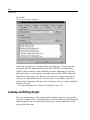
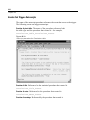
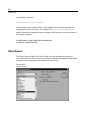
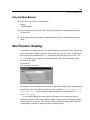
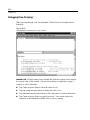
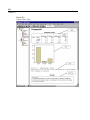
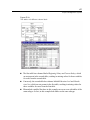
Chapter
Overview of the Chart Facility
40
High-resolution charts and plots are created by the procedures on the Graphs menu
and by many of the procedures on the Analyze menu. This chapter provides an
overview of the chart facility.
Creating and Modifying a Chart
Before you can create a chart, you need to have your data in the Data Editor. You can
enter the data directly into the Data Editor, open a previously saved data file, or read a
spreadsheet, tab-delimited data file, or database file. The Tutorial selection on the
Help menu has online examples of creating and modifying a chart, and the online
Help system provides information on how to create and modify all chart types.
Creating the Chart
After you get your data into the Data Editor, you can create a chart by selecting a
chart type from the Graphs menu. This opens a chart dialog box.
555