1
Chapter
19
OLAP Cubes
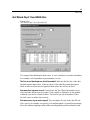
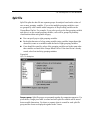
The OLAP (Online Analytical Processing) Cubes procedure calculates totals, means,
and other univariate statistics for continuous summary variables within categories of
one or more categorical grouping variables. A separate layer in the table is created for
each category of each grouping variable.
Example. Total and average sales for different regions and product lines within regions.
Statistics. Sum, number of cases, mean, median, grouped median, standard error
of the mean, minimum, maximum, range, variable value of the first category of
the grouping variable, variable value of the last category of the grouping variable,
standard deviation, variance, kurtosis, standard error of kurtosis, skewness, standard
error of skewness, percentage of total cases, percentage of total sum, percentage
of total cases within grouping variables, percentage of total sum within grouping
variables, geometric mean, and harmonic mean.
Data. The summary variables are quantitative (continuous variables measured on an
interval or ratio scale), and the grouping variables are categorical. The values of
categorical variables can be numeric or short string.
Assumptions. Some of the optional subgroup statistics, such as the mean and standard
deviation, are based on normal theory and are appropriate for quantitative variables
with symmetric distributions. Robust statistics, such as the median and range, are
appropriate for quantitative variables that may or may not meet the assumption of
normality.
349