1
346
Chapter 18
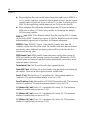
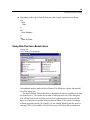
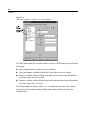
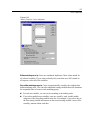
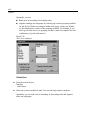
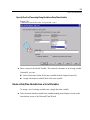
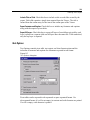
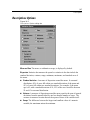
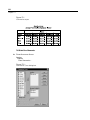
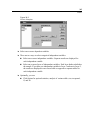
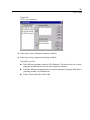
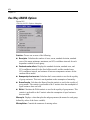
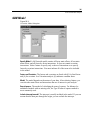
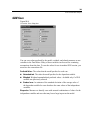
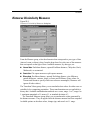
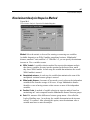
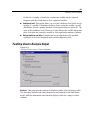
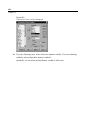
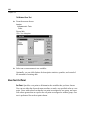
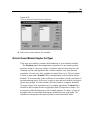
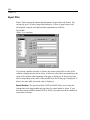
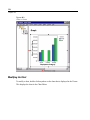
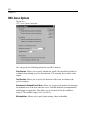
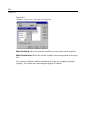
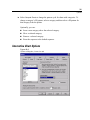
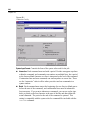
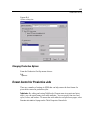
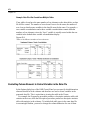
Means Options
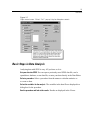
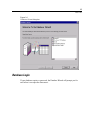
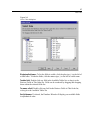
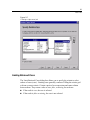
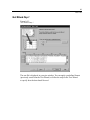
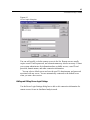
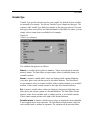
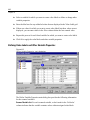
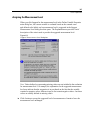
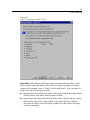
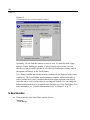
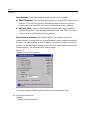
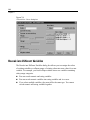
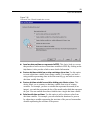
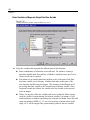
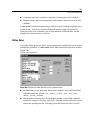
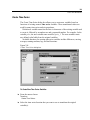
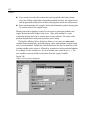
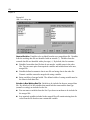
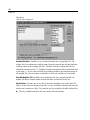
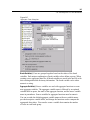
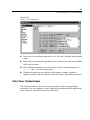
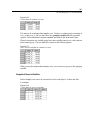
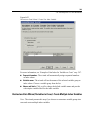
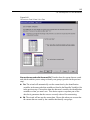
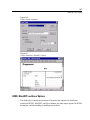
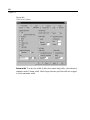
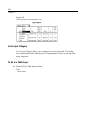
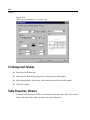
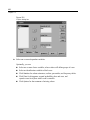
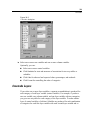
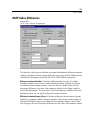
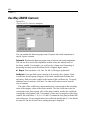
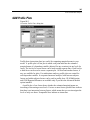
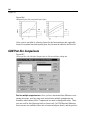
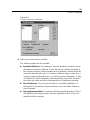
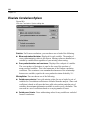
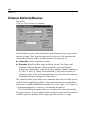
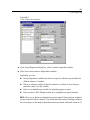
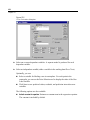
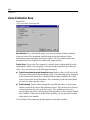
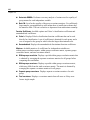
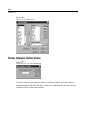
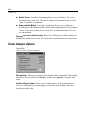
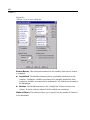
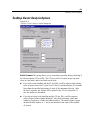
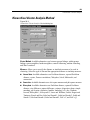
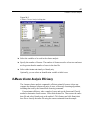
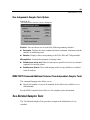
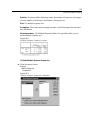
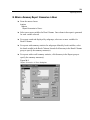
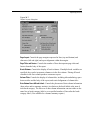
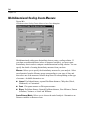
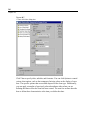
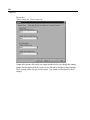
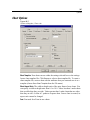
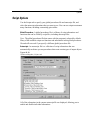
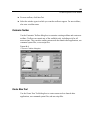
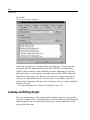
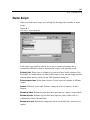
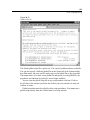
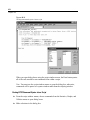
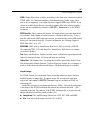
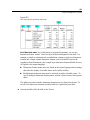
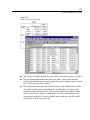
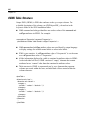
Figure 18-3
Means Options dialog box
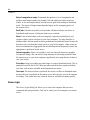
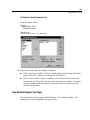
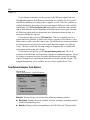
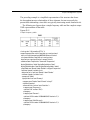
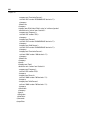
You can choose one or more of the following subgroup statistics for the variables
within each category of each grouping variable: sum, number of cases, mean, median,
grouped median, standard error of the mean, minimum, maximum, range, variable
value of the first category of the grouping variable, variable value of the last category
of the grouping variable, standard deviation, variance, kurtosis, standard error of
kurtosis, skewness, standard error of skewness, percentage of total sum, percentage
of total N, percentage of sum in, percentage of N in, geometric mean, and harmonic
mean. You can change the order in which the subgroup statistics appear. The order
in which the statistics appear in the Cell Statistics list is the order in which they are
displayed in the output. Summary statistics are also displayed for each variable
across all categories.
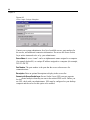
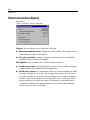
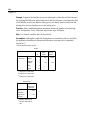
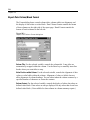
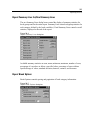
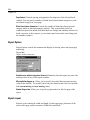
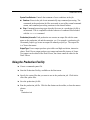
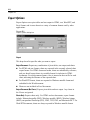
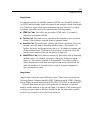
First. Displays the first data value encountered in the data file.
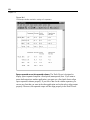
Geometric Mean. The nth root of the product of the data values, where n represents the
number of cases.