1
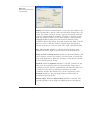
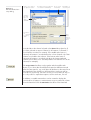
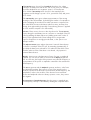
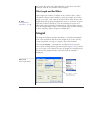
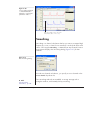
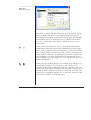
times with the data. In this case, the Default rate drop-down list becomes
enabled and must be used to choose the sampling rate at which the
data were recorded. The sampling rates are those supported by Chart
(up to 200 000 samples per second).
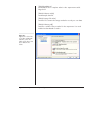
Ignore non-numeric lines. If this checkbox is selected (it is off by default),
▼ Refer
Data Headers for
Reading Text, p. 250
Chart ignores non-numeric lines in the text file, including settings
information (data headers, indicating the sampling rate etc). Otherwise,
each non-numeric line is checked to see if it is a data header starting
with a recognized keyword: if not, an alert will appear. You should
only select this checkbox if you are importing a file that contains
irrelevant lines of text, for example column headings in a spreadsheet.
Reading the Text
Once you have chosen your options in the Open Text File dialog, click
OK to read in the text file. Reading a text file into Chart can be slow.
While text is being imported into Chart, a dialog indicating progress is
shown. To stop the process, click Cancel in the dialog: your Chart file
will retain the data loaded into it up until the time you stop.
Data values can be in normal or scientific forms: 3, –2.34, 1.2e3 (for
1.2 x 10³), etc. A sequence of two tab characters is taken to mean that
there is no data point for a reading (the channel is empty at that point).
Time values can be in the form of decimal seconds, or hours, minutes,
and seconds (such as 2:03:50.1); ‘a.m.’ and ‘p.m.’ are recognized as
long as they are used in the format specified in your computer’s time
settings in the Windows control panel.
Blocks are created in the resultant Chart data when the sampling rate
changes, when a new set of data headers is encountered, or when a
channel becomes empty (as would occur if an input were turned off
while recording). A change in the time interval must be more than 10%
of the interval to be taken as the start of a new block (this allows for
rounding errors).
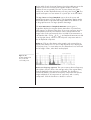
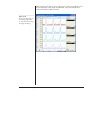
For each block that is read in, Chart examines the first 16 000 values
(or the whole block, if it contains fewer than 16 000 values) and
computes maximum and minimum values in each channel. The upper
and lower limits of the Amplitude axis scales for each channel are then
set to these maximum and minimum values. The default unit is volts (V).
Chapter 5 — Working With Files
111