1
Recording
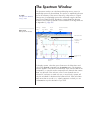
To start recording, click the Start button at the bottom right of the Chart
View. The button then changes to Stop: click it when you want to stop
recording. Alternatively, you can type Ctrl-space bar.
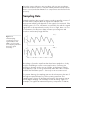
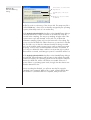
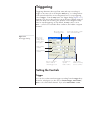
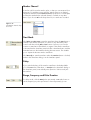
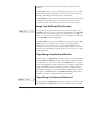
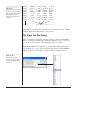
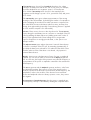
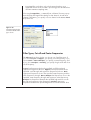
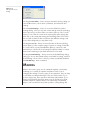
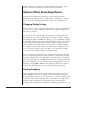
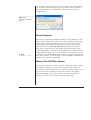
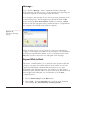
Display while Recording
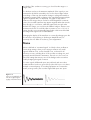
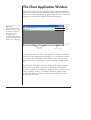
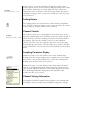
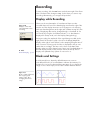
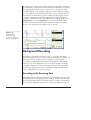
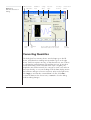
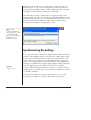
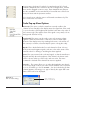
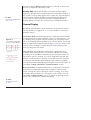
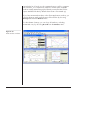
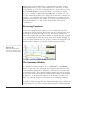
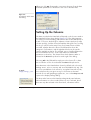
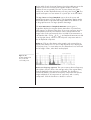
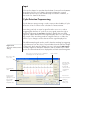
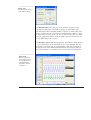
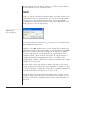
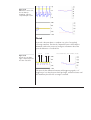
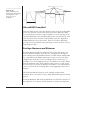
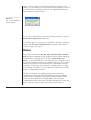
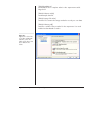
Figure 2–10
Displays of time and
signal amplitude while
recording.
▼ Refer
General Display, p. 84
Chart uses the visual metaphor of a mechanical chart recorder:
recorded data scroll across the data display area from the right of the
window as if the display area were a roll of paper in such a device,
with new data being drawn at the right and old data moving left. (This
way of displaying data can be changed though, so that data do not
scroll at all, by using the Scroll/Review button, or so that data are
displayed in Sweep mode, set in the Display Settings dialog.)
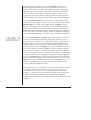
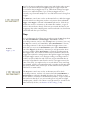
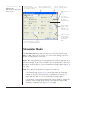
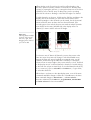
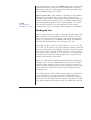
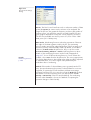
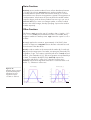
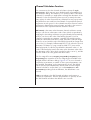
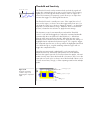
During recording, the amplitude of the signal being recorded (in the
right pane if the window is split) is shown in the Range/Amplitude
display at the right of each channel, unless sampling at higher rates. If
units conversion is being used, the value is displayed in the set units
rather than as a voltage. The time is also shown in the Rate/Time
display at the top of the channel control area, in a form depending on
the time display format (usually from the start of the block). These
displays are updated every quarter of a second or so.
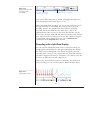
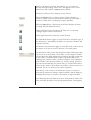
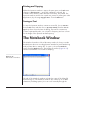
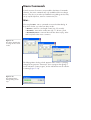
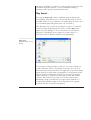
Blocks and Settings
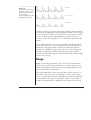
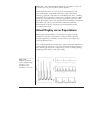
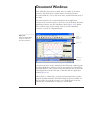
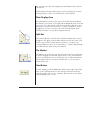
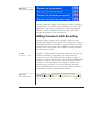
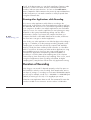
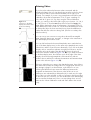
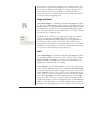
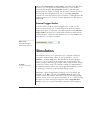
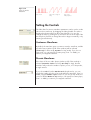
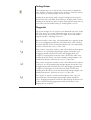
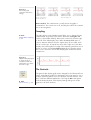
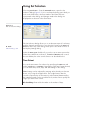
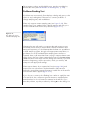
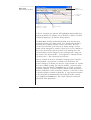
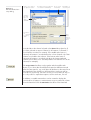
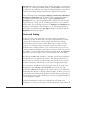
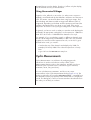
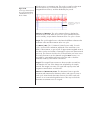
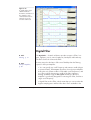
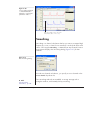
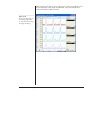
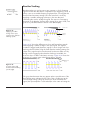
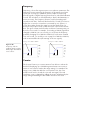
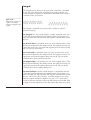
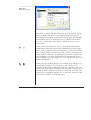
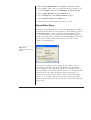
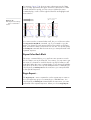
A solid vertical line is drawn by default between two sections
(user-defined ‘blocks’) of recorded data to indicate discontinuity, for
instance if you stop recording and then start again. If you change the
range of one or more inputs, a new scale is drawn between the two
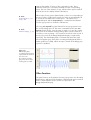
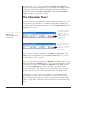
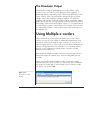
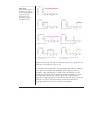
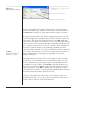
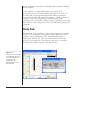
Figure 2–11
Blocks of data: left break,
after stopping and
starting; right, after
changing a channel’s
range.
Chapter 2 — Introduction to Chart
35