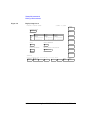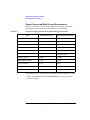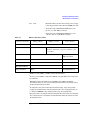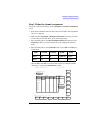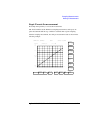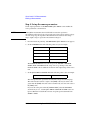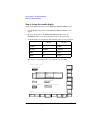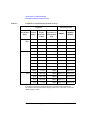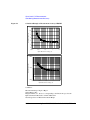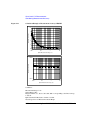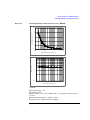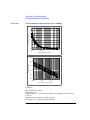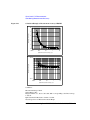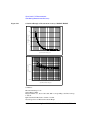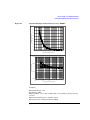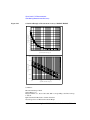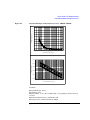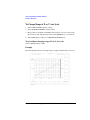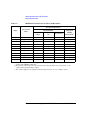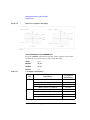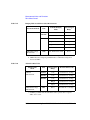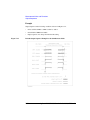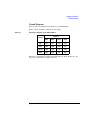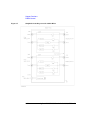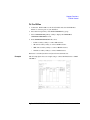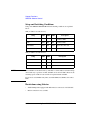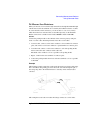
1
User’s Guide Volume 2 Measurement and Analysis Agilent 4155C Semiconductor Parameter Analyzer Agilent 4156C Precision Semiconductor Parameter Analyzer 04156-90020 August 2003 Edition 5 Legal Notice The information contained in this document is subject to change without notice. © Agilent Technologies, Inc. 2001, 2003 This document contains information which is protected by copyright. All rights are reserved. Reproduction, adaptation, or translation without prior written permission is prohibited, except as allowed under the copyright laws. • Product Warranty Agilent Technologies warrants Agilent Technologies hardware, accessories and supplies against defects in materials and workmanship for the period of one year from the warranty start date specified below. If Agilent Technologies receives notice of such defects during the warranty period, Agilent Technologies will, at its option, either repair or replace products which prove to be defective. Replacement products may be either new or like-new. Warranty service of this product will be performed at Agilent Technologies. Buyer shall prepay shipping charges to Agilent Technologies and Agilent Technologies shall pay shipping charges to return the product to Buyer. However, Buyer shall pay all shipping charges, duties, and taxes for products returned to Agilent Technologies from another country. Agilent Technologies does not warrant that the operation of Agilent Technologies products will be uninterrupted or error free. If Agilent Technologies is unable, within a reasonable time, to repair or replace any product to a condition as warranted, customer will be entitled to a refund of the purchase price upon prompt return of the product. The Agilent Technologies products may contain remanufactured parts equivalent to new in performance or may have been subject to incidental use. The warranty period begins on the date of delivery or on the date of installation if installed by Agilent Technologies. If customer schedules or delays Agilent Technologies installation more than 30 days after delivery, warranty begins on the 31st day from delivery. Warranty does not apply to defects resulting from (a) improper or inadequate maintenance or calibration, (b) software, interfacing, parts or supplies not supplied by Agilent Technologies, (c) unauthorized modification or misuse, (d) operation outside of the published environmental specifications for the product, or (e) improper site preparation or maintenance. 2 Agilent 4155C/4156C User’s Guide Vol.2, Edition 5 To the extent allowed by local law, the above warranties are exclusive and no other warranty or condition, whether written or oral, is expressed or implied and Agilent Technologies specifically disclaims any implied warranties or conditions of merchantability, satisfactory quality, and fitness for a particular purpose. Agilent Technologies will be liable for damage to tangible property per incident up to the greater of $300,000 or the actual amount paid for the product that is the subject of the claim, and for damages for bodily injury or death, to the extent that all such damages are determined by a court of competent jurisdiction to have been directly caused by a defective Agilent Technologies product. To the extent allowed by local law, the remedies in this warranty statement are customer’s sole and exclusive remedies. Expect as indicated above, in no event will Agilent Technologies or its suppliers be liable for loss of date or for direct, special, incidental, consequential (including lost profit or date), or other damage, whether based in contract, tort, or otherwise. For consumer transactions in Australia and New Zealand: the warranty terms contained in this statement, except to the extent lawfully permitted, do not exclude, restrict or modify and are in addition to the mandatory statutory rights applicable to the sale of this product to you. • Assistance Product maintenance agreements and other customer assistance agreements are available for Agilent Technologies products. For any assistance, contact your nearest Agilent Technologies Sales Office. • Certification Agilent Technologies, Inc. certifies that this product met its published specifications at the time of shipment from the factory. Agilent Technologies further certifies that its calibration measurements are traceable to the National Institute of Standards and Technology (NIST), to the extent allowed by the Institute’s calibration facility, and to the calibration facilities of other International Standards Organization members. Agilent 4155C/4156C User’s Guide Vol.2, Edition 5 3 • Safety Summary The following general safety precautions must be observed during all phases of operation, service, and repair of this instrument. Failure to comply with these precautions or with specific warnings elsewhere in this manual may impair the protections provided by the equipment. In addition, it violates safety standards of design, manufacture, and intended use of the instrument. Agilent Technologies, Inc. assumes no liability for customer’s failure to comply with these requirements. NOTE Agilent 4155C/4156C/41501B comply with INSTALLATION CATEGORY II for mains input and INSTALLATION CATEGORY I for measurement input terminals, and POLLUTION DEGREE 2 defined in IEC 1010-1. Agilent 4155C/4156C/41501B are INDOOR USE products. NOTE LEDs in Agilent 4155C/4156C/41501B are Class 1 in accordance with IEC 825-1. CLASS 1 LED PRODUCT. • GROUND THE INSTRUMENT This is Safety Class I instrument. To minimize shock hazard, the instrument chassis and cabinet must be connected to an electrical ground. The power terminal and the power cable must meet International Electrotechnical Commission (IEC) safety standards. • DO NOT OPERATE IN AN EXPLOSIVE ATMOSPHERE Do not operate the instrument in the presence of flammable gases or fumes. Operation of any electrical instrument in such an environment constitutes a definite safety hazard. • KEEP AWAY FROM LIVE CIRCUITS Operation personnel must not remove instrument covers. Component replacement and internal adjustments must be made by qualified maintenance personnel. Do not replace components with power cable connected. Under certain conditions, dangerous voltages may exist even with the power cable removed. To avoid injuries, always disconnect power and discharge circuits before touching them. • DO NOT SERVICE OR ADJUST ALONE Do not attempt internal service or adjustment unless another person, capable of rendering first aid and resuscitation, is present. 4 Agilent 4155C/4156C User’s Guide Vol.2, Edition 5 • DO NOT SUBSTITUTE PARTS OR MODIFY INSTRUMENT Because of the danger of introducing additional hazards, do not install substitute parts or perform any unauthorized modification to the instrument. Return the instrument to a Agilent Technologies Sales and Service Office for services and repair to ensure that safety features are maintained. • DANGEROUS PROCEDURE WARNINGS Warnings, such as example below, precede potentially dangerous procedures throughout this manual. Instructions contained in the warnings must be followed. WARNING Dangerous Voltage, capable of causing death, are present in this instrument. Use extreme caution when handling, testing, and adjusting. • Safety Symbols The general definitions of safety symbols used on equipment or in manuals are listed below. Instruction manual symbol: the product will be marked with this symbol when it is necessary for the user to refer to the instruction manual in order to protect against damage to the instrument. Indicates dangerous voltage and potential for electrical shock. Do not touch terminals that have this symbol when instrument is on. Protective conductor terminal. For protection against electrical shock in case of a fault. Used with field wiring terminals to indicate the terminal which must be connected to ground before operating equipment. Frame or chassis terminal. A connection to the frame (chassis) of the equipment which normally includes all exposed metal structures. Indicates earth (ground) terminal. Alternating current. Direct current. ON (Supply). Agilent 4155C/4156C User’s Guide Vol.2, Edition 5 5 OFF (Supply). STANDBY (Supply). Means INSTALLATION CATEGORY I. Measurement terminals on the rear panel comply with INSTALLATION CATEGORY I. CAT 1 WARNING The warning sign denotes a hazard. It calls attention to a procedure, practice, condition or the like, which, if not correctly performed or adhered to, could result in injury or death to personal. CAUTION The caution sign denotes a hazard. It calls attention to an operating procedure, practice, condition or the like, which, if not correctly performed or adhered to, could result in damage to or destruction of part or all of the product. • Herstellerbescheinigung GEÄUSCHEMISSION Lpa < 70 dB am Arbeitsplatz normaler Betrieb nach DIN 45635 T. 19 • Manufacturer’s Declaration ACOUSTIC NOISE EMISSION Lpa < 70dB operator position normal operation per ISO 7779 6 Agilent 4155C/4156C User’s Guide Vol.2, Edition 5 NOTE This ISM device complies with Canadian ICES-001. Cet appareil ISM est conforme ?Hla norme NMB-001 du Canada. Printing History Edition 1: January 2001 Edition 2: June 2001 Edition 3: December 2001 Edition 4: January 2003 Edition 5: August 2003 Agilent 4155C/4156C User’s Guide Vol.2, Edition 5 7 In This Manual This manual provides information for measurement and analysis functions of Agilent 4155C/4156C, and consists of the following chapters: • Sweep Measurements Describes how to perform sweep measurements. • Knob Sweep Measurements Describes how to perform knob sweep measurements. • Sampling Measurements Describes how to perform sampling measurements. • Quasi-static C-V Measurements Describes how to perform quasi-static C-V measurements. • Stress Force Describes how to perform stress force. Stress function is effective for the reliability testing of semiconductor devices. • Analyzing Measurement Results Describes how to analyze measurement results manually and automatically. • Measurement Units and Functions Provides information about measurement units and measurement functions. • Support Functions Provides information about several functions which support measurements. • Built-in Functions Provides information about the built-in mathematical functions and read out functions. • Connecting Measurement Devices Explains how to connect the measurement devices to the instrument. 8 Agilent 4155C/4156C User’s Guide Vol.2, Edition 5 Contents 1. Sweep Measurements Measurement Functions . . . . . . . . . . . . . . . . . . . . . . . . . . . . . . . . . . . . . . . . . . . . . 1-3 Basic Sweep Measurement . . . . . . . . . . . . . . . . . . . . . . . . . . . . . . . . . . . . . . . . 1-4 Subordinate Sweep Measurement . . . . . . . . . . . . . . . . . . . . . . . . . . . . . . . . . . . 1-7 Synchronous Sweep Measurement . . . . . . . . . . . . . . . . . . . . . . . . . . . . . . . . . . 1-9 Pulse Sweep Measurement . . . . . . . . . . . . . . . . . . . . . . . . . . . . . . . . . . . . . . . 1-11 Defining Measurement Conditions . . . . . . . . . . . . . . . . . . . . . . . . . . . . . . . . . . . 1-14 To Define Measurement Units . . . . . . . . . . . . . . . . . . . . . . . . . . . . . . . . . . . . . 1-16 To Set up Primary Sweep . . . . . . . . . . . . . . . . . . . . . . . . . . . . . . . . . . . . . . . . 1-18 To Set up Secondary Sweep . . . . . . . . . . . . . . . . . . . . . . . . . . . . . . . . . . . . . . 1-19 To Set up Synchronous Sweep . . . . . . . . . . . . . . . . . . . . . . . . . . . . . . . . . . . . 1-20 To Set up Constant Output . . . . . . . . . . . . . . . . . . . . . . . . . . . . . . . . . . . . . . . 1-21 To Set up SMU Pulsed Output . . . . . . . . . . . . . . . . . . . . . . . . . . . . . . . . . . . . 1-22 To Set up PGU Output . . . . . . . . . . . . . . . . . . . . . . . . . . . . . . . . . . . . . . . . . . . 1-24 To Set up Stop Condition . . . . . . . . . . . . . . . . . . . . . . . . . . . . . . . . . . . . . . . . . 1-26 To Display Graphics Results . . . . . . . . . . . . . . . . . . . . . . . . . . . . . . . . . . . . . . 1-27 To Display List Results . . . . . . . . . . . . . . . . . . . . . . . . . . . . . . . . . . . . . . . . . . 1-28 To Execute or Stop Measurement . . . . . . . . . . . . . . . . . . . . . . . . . . . . . . . . . . 1-29 Making a Measurement . . . . . . . . . . . . . . . . . . . . . . . . . . . . . . . . . . . . . . . . . . . . 1-30 Step 1. Prepare for the measurement . . . . . . . . . . . . . . . . . . . . . . . . . . . . . . . . 1-31 Step 2. Mount your DUT on the test fixture . . . . . . . . . . . . . . . . . . . . . . . . . . 1-33 Step 3. Define the channel assignments . . . . . . . . . . . . . . . . . . . . . . . . . . . . . 1-35 Step 4. Define the user functions . . . . . . . . . . . . . . . . . . . . . . . . . . . . . . . . . . . 1-37 Step 5. Set up the measurement parameters . . . . . . . . . . . . . . . . . . . . . . . . . . 1-39 Step 6. Set up the results display . . . . . . . . . . . . . . . . . . . . . . . . . . . . . . . . . . . 1-41 Step 7. Execute the measurement . . . . . . . . . . . . . . . . . . . . . . . . . . . . . . . . . . 1-43 2. Knob Sweep Measurements Measurement Functions . . . . . . . . . . . . . . . . . . . . . . . . . . . . . . . . . . . . . . . . . . . . . 2-3 Available units and functions . . . . . . . . . . . . . . . . . . . . . . . . . . . . . . . . . . . . . . . 2-3 Agilent 4155C/4156C User’s Guide Vol.2, Edition 5 Contents - 1 Contents Normal Sweep and Knob Sweep Measurements . . . . . . . . . . . . . . . . . . . . . . . . Features of Knob Sweep Function . . . . . . . . . . . . . . . . . . . . . . . . . . . . . . . . . . KNOB SWEEP screen . . . . . . . . . . . . . . . . . . . . . . . . . . . . . . . . . . . . . . . . . . . Analysis of the Knob Sweep Measurement Results . . . . . . . . . . . . . . . . . . . . . Executing Measurements. . . . . . . . . . . . . . . . . . . . . . . . . . . . . . . . . . . . . . . . . . . To Define Measurement Units . . . . . . . . . . . . . . . . . . . . . . . . . . . . . . . . . . . . To Execute Measurements . . . . . . . . . . . . . . . . . . . . . . . . . . . . . . . . . . . . . . . To Stop Measurement . . . . . . . . . . . . . . . . . . . . . . . . . . . . . . . . . . . . . . . . . . . To Change Measurement Conditions . . . . . . . . . . . . . . . . . . . . . . . . . . . . . . . . 2-4 2-5 2-8 2-9 2-10 2-11 2-12 2-13 2-14 3. Sampling Measurements Measurement Functions. . . . . . . . . . . . . . . . . . . . . . . . . . . . . . . . . . . . . . . . . . . . . 3-3 Available Units. . . . . . . . . . . . . . . . . . . . . . . . . . . . . . . . . . . . . . . . . . . . . . . . . . 3-3 Sampling Interval and Measurement Time . . . . . . . . . . . . . . . . . . . . . . . . . . . . 3-4 Sampling Measurement Data . . . . . . . . . . . . . . . . . . . . . . . . . . . . . . . . . . . . . . . 3-7 Sampling Completion . . . . . . . . . . . . . . . . . . . . . . . . . . . . . . . . . . . . . . . . . . . . 3-9 Source Output Sequence and Time Origin. . . . . . . . . . . . . . . . . . . . . . . . . . . . 3-11 Linear Sampling Measurement . . . . . . . . . . . . . . . . . . . . . . . . . . . . . . . . . . . . 3-13 Thinned-out Sampling Measurement . . . . . . . . . . . . . . . . . . . . . . . . . . . . . . . 3-16 Logarithmic Sampling Measurement . . . . . . . . . . . . . . . . . . . . . . . . . . . . . . . 3-19 Defining Measurement Conditions . . . . . . . . . . . . . . . . . . . . . . . . . . . . . . . . . . . To Define Measurement Units . . . . . . . . . . . . . . . . . . . . . . . . . . . . . . . . . . . . To Set up Sampling Parameters . . . . . . . . . . . . . . . . . . . . . . . . . . . . . . . . . . . To Set up Constant Output . . . . . . . . . . . . . . . . . . . . . . . . . . . . . . . . . . . . . . . To Set up PGU Output . . . . . . . . . . . . . . . . . . . . . . . . . . . . . . . . . . . . . . . . . . To Define Stop Conditions . . . . . . . . . . . . . . . . . . . . . . . . . . . . . . . . . . . . . . . To Display Graphics Results . . . . . . . . . . . . . . . . . . . . . . . . . . . . . . . . . . . . . . To Display List Results . . . . . . . . . . . . . . . . . . . . . . . . . . . . . . . . . . . . . . . . . . To Execute or Stop Measurement . . . . . . . . . . . . . . . . . . . . . . . . . . . . . . . . . . 3-24 3-26 3-27 3-29 3-30 3-32 3-33 3-34 3-35 Making a Measurement . . . . . . . . . . . . . . . . . . . . . . . . . . . . . . . . . . . . . . . . . . . . 3-36 Contents - 2 Agilent 4155C/4156C User’s Guide Vol.2, Edition 5 Contents Step 1. Prepare for the measurement . . . . . . . . . . . . . . . . . . . . . . . . . . . . . . . . 3-36 Step 2. Mount your DUT on the test fixture . . . . . . . . . . . . . . . . . . . . . . . . . . 3-36 Step 3. Define the channel assignments . . . . . . . . . . . . . . . . . . . . . . . . . . . . . 3-37 Step 4. Set up the measurement parameters . . . . . . . . . . . . . . . . . . . . . . . . . . 3-38 Step 5. Set up the results display . . . . . . . . . . . . . . . . . . . . . . . . . . . . . . . . . . . 3-40 Step 6. Execute the measurement . . . . . . . . . . . . . . . . . . . . . . . . . . . . . . . . . . 3-41 4. Quasi-static C-V Measurements Measurement Functions . . . . . . . . . . . . . . . . . . . . . . . . . . . . . . . . . . . . . . . . . . . . . 4-3 Available Units . . . . . . . . . . . . . . . . . . . . . . . . . . . . . . . . . . . . . . . . . . . . . . . . . . 4-3 Capacitance Data Calculation. . . . . . . . . . . . . . . . . . . . . . . . . . . . . . . . . . . . . . . 4-3 Operation . . . . . . . . . . . . . . . . . . . . . . . . . . . . . . . . . . . . . . . . . . . . . . . . . . . . . . 4-4 Parameters . . . . . . . . . . . . . . . . . . . . . . . . . . . . . . . . . . . . . . . . . . . . . . . . . . . . . 4-6 Defining Measurement Conditions . . . . . . . . . . . . . . . . . . . . . . . . . . . . . . . . . . . . 4-8 To Define Measurement Units . . . . . . . . . . . . . . . . . . . . . . . . . . . . . . . . . . . . . 4-10 To Set up QSCV Sweep Source . . . . . . . . . . . . . . . . . . . . . . . . . . . . . . . . . . . . 4-11 To Set up Stop Condition . . . . . . . . . . . . . . . . . . . . . . . . . . . . . . . . . . . . . . . . . 4-12 To Set up Constant Output . . . . . . . . . . . . . . . . . . . . . . . . . . . . . . . . . . . . . . . 4-13 To Set up PGU Output . . . . . . . . . . . . . . . . . . . . . . . . . . . . . . . . . . . . . . . . . . . 4-13 To Define Measurement Conditions. . . . . . . . . . . . . . . . . . . . . . . . . . . . . . . . . 4-14 To Display Graphics Results . . . . . . . . . . . . . . . . . . . . . . . . . . . . . . . . . . . . . . 4-15 To Display List Results . . . . . . . . . . . . . . . . . . . . . . . . . . . . . . . . . . . . . . . . . . 4-16 To Execute or Stop Measurement . . . . . . . . . . . . . . . . . . . . . . . . . . . . . . . . . . 4-17 Making a Measurement . . . . . . . . . . . . . . . . . . . . . . . . . . . . . . . . . . . . . . . . . . . . 4-18 Step 1. Prepare for measurement . . . . . . . . . . . . . . . . . . . . . . . . . . . . . . . . . . . 4-18 Step 2. Mount your DUT on the test fixture . . . . . . . . . . . . . . . . . . . . . . . . . . 4-18 Step 3. Define the channel assignments . . . . . . . . . . . . . . . . . . . . . . . . . . . . . 4-19 Step 4. Set up the source parameters . . . . . . . . . . . . . . . . . . . . . . . . . . . . . . . . 4-20 Step 5. Set up the measurement parameters . . . . . . . . . . . . . . . . . . . . . . . . . . 4-22 Step 6. Set up the results display . . . . . . . . . . . . . . . . . . . . . . . . . . . . . . . . . . . 4-24 Step 7. Execute the measurement . . . . . . . . . . . . . . . . . . . . . . . . . . . . . . . . . . 4-25 Agilent 4155C/4156C User’s Guide Vol.2, Edition 5 Contents - 3 Contents Maximum Measurement Value . . . . . . . . . . . . . . . . . . . . . . . . . . . . . . . . . . . . . . 4-26 Considering Measurement Accuracy. . . . . . . . . . . . . . . . . . . . . . . . . . . . . . . . . . 4-28 5. Stress Force Stress Function . . . . . . . . . . . . . . . . . . . . . . . . . . . . . . . . . . . . . . . . . . . . . . . . . . . 5-3 Stress Output Channels . . . . . . . . . . . . . . . . . . . . . . . . . . . . . . . . . . . . . . . . . . . 5-4 Stress Mode . . . . . . . . . . . . . . . . . . . . . . . . . . . . . . . . . . . . . . . . . . . . . . . . . . . . 5-6 Stress Force Sequence . . . . . . . . . . . . . . . . . . . . . . . . . . . . . . . . . . . . . . . . . . . . 5-7 Stress Stop Function at Abnormal Status . . . . . . . . . . . . . . . . . . . . . . . . . . . . 5-10 Defining Stress Conditions . . . . . . . . . . . . . . . . . . . . . . . . . . . . . . . . . . . . . . . . . To Set up Stress Source Channels . . . . . . . . . . . . . . . . . . . . . . . . . . . . . . . . . . To Set up Stress Condition/Timing . . . . . . . . . . . . . . . . . . . . . . . . . . . . . . . . . To Set up ac (Pulse) Output . . . . . . . . . . . . . . . . . . . . . . . . . . . . . . . . . . . . . . To Set up dc Output . . . . . . . . . . . . . . . . . . . . . . . . . . . . . . . . . . . . . . . . . . . . . To Force Stress . . . . . . . . . . . . . . . . . . . . . . . . . . . . . . . . . . . . . . . . . . . . . . . . 5-11 5-13 5-15 5-17 5-19 5-20 6. Analyzing Measurement Results Analysis Function . . . . . . . . . . . . . . . . . . . . . . . . . . . . . . . . . . . . . . . . . . . . . . . . . 6-3 Marker on the GRAPH/LIST: GRAPHICS screen . . . . . . . . . . . . . . . . . . . . . . 6-4 Marker on the GRAPH/LIST: LIST screen . . . . . . . . . . . . . . . . . . . . . . . . . . . 6-6 Cursor . . . . . . . . . . . . . . . . . . . . . . . . . . . . . . . . . . . . . . . . . . . . . . . . . . . . . . . . 6-8 Line Drawing . . . . . . . . . . . . . . . . . . . . . . . . . . . . . . . . . . . . . . . . . . . . . . . . . . 6-9 Scaling Functions . . . . . . . . . . . . . . . . . . . . . . . . . . . . . . . . . . . . . . . . . . . . . . 6-11 Overlay Display Function . . . . . . . . . . . . . . . . . . . . . . . . . . . . . . . . . . . . . . . . 6-12 Automatic Analysis Function . . . . . . . . . . . . . . . . . . . . . . . . . . . . . . . . . . . . . 6-12 Manual Analysis . . . . . . . . . . . . . . . . . . . . . . . . . . . . . . . . . . . . . . . . . . . . . . . . . To Specify a Measurement Point on Curve . . . . . . . . . . . . . . . . . . . . . . . . . . . To Specify between Measurement Points on Curve . . . . . . . . . . . . . . . . . . . . To Display or Move Cursor . . . . . . . . . . . . . . . . . . . . . . . . . . . . . . . . . . . . . . . To Adjust Display Range to Measurement Curve Automatically . . . . . . . . . . Contents - 4 6-13 6-14 6-16 6-18 6-19 Agilent 4155C/4156C User’s Guide Vol.2, Edition 5 Contents To Zoom the Display Range . . . . . . . . . . . . . . . . . . . . . . . . . . . . . . . . . . . . . . 6-19 To Center Display at Cursor Location . . . . . . . . . . . . . . . . . . . . . . . . . . . . . . . 6-20 To Draw Line through Two Specified Points . . . . . . . . . . . . . . . . . . . . . . . . . 6-20 To Draw Line through Specified Point with Specified Gradient . . . . . . . . . . 6-22 To Draw Tangent to Specified Point of Measurement Curve . . . . . . . . . . . . . 6-24 To Draw Regression Line for Specified Region . . . . . . . . . . . . . . . . . . . . . . . 6-26 To Display and Select a Line . . . . . . . . . . . . . . . . . . . . . . . . . . . . . . . . . . . . . . 6-28 To Display Grid on the Graph . . . . . . . . . . . . . . . . . . . . . . . . . . . . . . . . . . . . . 6-28 To Change Data Variable on Graph . . . . . . . . . . . . . . . . . . . . . . . . . . . . . . . . . 6-29 To Change Range of X or Y Axis Scale . . . . . . . . . . . . . . . . . . . . . . . . . . . . . 6-30 To Change Variable Assigned to X, Y1, or Y2 Axis . . . . . . . . . . . . . . . . . . . . 6-31 To Overlay an Internal Memory Measurement Curve onto Plotting Area . . . 6-32 To Scroll the LIST screen . . . . . . . . . . . . . . . . . . . . . . . . . . . . . . . . . . . . . . . . 6-34 To Display or Move Marker on LIST screen . . . . . . . . . . . . . . . . . . . . . . . . . 6-35 To Change Variables of LIST screen . . . . . . . . . . . . . . . . . . . . . . . . . . . . . . . . 6-36 Automatic Analysis . . . . . . . . . . . . . . . . . . . . . . . . . . . . . . . . . . . . . . . . . . . . . . . 6-37 To Draw Line by Specifying Two Points . . . . . . . . . . . . . . . . . . . . . . . . . . . . 6-38 To Draw Line by Specifying Gradient and One Point . . . . . . . . . . . . . . . . . . 6-40 To Draw Tangent to Specified Measurement Point . . . . . . . . . . . . . . . . . . . . . 6-42 To Draw Regression Line by Specifying Two Points . . . . . . . . . . . . . . . . . . . 6-44 To Display Marker at Specified Point . . . . . . . . . . . . . . . . . . . . . . . . . . . . . . . 6-47 7. Measurement Units and Functions Measurement Units . . . . . . . . . . . . . . . . . . . . . . . . . . . . . . . . . . . . . . . . . . . . . . . . 7-3 GNDU - Ground Unit. . . . . . . . . . . . . . . . . . . . . . . . . . . . . . . . . . . . . . . . . . . . . 7-3 SMU - Source Monitor Unit. . . . . . . . . . . . . . . . . . . . . . . . . . . . . . . . . . . . . . . . 7-4 VSU - Voltage Source Unit . . . . . . . . . . . . . . . . . . . . . . . . . . . . . . . . . . . . . . . 7-17 VMU - Voltage Monitor Unit . . . . . . . . . . . . . . . . . . . . . . . . . . . . . . . . . . . . . . 7-18 PGU - Pulse Generator Unit . . . . . . . . . . . . . . . . . . . . . . . . . . . . . . . . . . . . . . . 7-20 Compliance . . . . . . . . . . . . . . . . . . . . . . . . . . . . . . . . . . . . . . . . . . . . . . . . . . . . . 7-23 Voltage and Current Compliance . . . . . . . . . . . . . . . . . . . . . . . . . . . . . . . . . . . 7-23 Agilent 4155C/4156C User’s Guide Vol.2, Edition 5 Contents - 5 Contents Power Compliance . . . . . . . . . . . . . . . . . . . . . . . . . . . . . . . . . . . . . . . . . . . . . 7-27 Measurement Ranging Mode . . . . . . . . . . . . . . . . . . . . . . . . . . . . . . . . . . . . . . . Auto Ranging . . . . . . . . . . . . . . . . . . . . . . . . . . . . . . . . . . . . . . . . . . . . . . . . . Limited Auto Ranging . . . . . . . . . . . . . . . . . . . . . . . . . . . . . . . . . . . . . . . . . . Compliance Range . . . . . . . . . . . . . . . . . . . . . . . . . . . . . . . . . . . . . . . . . . . . . Fixed Range . . . . . . . . . . . . . . . . . . . . . . . . . . . . . . . . . . . . . . . . . . . . . . . . . . 7-29 7-30 7-31 7-32 7-32 Measurement Time . . . . . . . . . . . . . . . . . . . . . . . . . . . . . . . . . . . . . . . . . . . . . . . Integration Time. . . . . . . . . . . . . . . . . . . . . . . . . . . . . . . . . . . . . . . . . . . . . . . . Overhead Time. . . . . . . . . . . . . . . . . . . . . . . . . . . . . . . . . . . . . . . . . . . . . . . . . To Specify Source Output Time. . . . . . . . . . . . . . . . . . . . . . . . . . . . . . . . . . . . 7-33 7-33 7-36 7-36 SMU Filter . . . . . . . . . . . . . . . . . . . . . . . . . . . . . . . . . . . . . . . . . . . . . . . . . . . . . 7-37 Self-calibration . . . . . . . . . . . . . . . . . . . . . . . . . . . . . . . . . . . . . . . . . . . . . . . . . . 7-38 Auto Calibration. . . . . . . . . . . . . . . . . . . . . . . . . . . . . . . . . . . . . . . . . . . . . . . . 7-38 Zero Offset Cancel . . . . . . . . . . . . . . . . . . . . . . . . . . . . . . . . . . . . . . . . . . . . . . . 7-39 To Measure Offset Data . . . . . . . . . . . . . . . . . . . . . . . . . . . . . . . . . . . . . . . . . . 7-39 To Perform Offset Cancel . . . . . . . . . . . . . . . . . . . . . . . . . . . . . . . . . . . . . . . . 7-41 QSCV Zero Offset Cancel . . . . . . . . . . . . . . . . . . . . . . . . . . . . . . . . . . . . . . . . . . 7-42 To Measure Offset Data . . . . . . . . . . . . . . . . . . . . . . . . . . . . . . . . . . . . . . . . . . 7-42 To Perform Offset Cancel . . . . . . . . . . . . . . . . . . . . . . . . . . . . . . . . . . . . . . . . 7-44 Operation States . . . . . . . . . . . . . . . . . . . . . . . . . . . . . . . . . . . . . . . . . . . . . . . . . Idle State. . . . . . . . . . . . . . . . . . . . . . . . . . . . . . . . . . . . . . . . . . . . . . . . . . . . . . Measurement State . . . . . . . . . . . . . . . . . . . . . . . . . . . . . . . . . . . . . . . . . . . . . . Stress Force State . . . . . . . . . . . . . . . . . . . . . . . . . . . . . . . . . . . . . . . . . . . . . . . Standby State . . . . . . . . . . . . . . . . . . . . . . . . . . . . . . . . . . . . . . . . . . . . . . . . . . Changing among Operation States . . . . . . . . . . . . . . . . . . . . . . . . . . . . . . . . . 7-45 7-45 7-45 7-46 7-46 7-46 Output Sequence . . . . . . . . . . . . . . . . . . . . . . . . . . . . . . . . . . . . . . . . . . . . . . . . . 7-48 Sequential Mode . . . . . . . . . . . . . . . . . . . . . . . . . . . . . . . . . . . . . . . . . . . . . . . 7-49 Simultaneous Mode . . . . . . . . . . . . . . . . . . . . . . . . . . . . . . . . . . . . . . . . . . . . . 7-51 Contents - 6 Agilent 4155C/4156C User’s Guide Vol.2, Edition 5 Contents Measurement Sequence . . . . . . . . . . . . . . . . . . . . . . . . . . . . . . . . . . . . . . . . . . . . 7-53 8. Support Functions User Function and User Variable . . . . . . . . . . . . . . . . . . . . . . . . . . . . . . . . . . . . . . 8-3 Output or Measurement Data . . . . . . . . . . . . . . . . . . . . . . . . . . . . . . . . . . . . . . . 8-3 User Function . . . . . . . . . . . . . . . . . . . . . . . . . . . . . . . . . . . . . . . . . . . . . . . . . . 8-5 User Variable . . . . . . . . . . . . . . . . . . . . . . . . . . . . . . . . . . . . . . . . . . . . . . . . . . . 8-6 Syntax of Data Variable Name . . . . . . . . . . . . . . . . . . . . . . . . . . . . . . . . . . . . . 8-8 Expression . . . . . . . . . . . . . . . . . . . . . . . . . . . . . . . . . . . . . . . . . . . . . . . . . . . . . 8-9 Standby Function . . . . . . . . . . . . . . . . . . . . . . . . . . . . . . . . . . . . . . . . . . . . . . . . . 8-13 Standby Channels . . . . . . . . . . . . . . . . . . . . . . . . . . . . . . . . . . . . . . . . . . . . . . . 8-13 Standby State . . . . . . . . . . . . . . . . . . . . . . . . . . . . . . . . . . . . . . . . . . . . . . . . . . 8-13 Available Units and Output Values. . . . . . . . . . . . . . . . . . . . . . . . . . . . . . . . . . 8-14 Output Values of non-Standby Channels . . . . . . . . . . . . . . . . . . . . . . . . . . . . . 8-14 Output Sequence of Standby Channels . . . . . . . . . . . . . . . . . . . . . . . . . . . . . . 8-15 When Getting Setup File . . . . . . . . . . . . . . . . . . . . . . . . . . . . . . . . . . . . . . . . . 8-16 To Use Standby Function . . . . . . . . . . . . . . . . . . . . . . . . . . . . . . . . . . . . . . . . . 8-17 R-BOX Control . . . . . . . . . . . . . . . . . . . . . . . . . . . . . . . . . . . . . . . . . . . . . . . . . . 8-18 Resistance Value . . . . . . . . . . . . . . . . . . . . . . . . . . . . . . . . . . . . . . . . . . . . . . . 8-18 Connections . . . . . . . . . . . . . . . . . . . . . . . . . . . . . . . . . . . . . . . . . . . . . . . . . . . 8-18 Setups . . . . . . . . . . . . . . . . . . . . . . . . . . . . . . . . . . . . . . . . . . . . . . . . . . . . . . . . 8-20 Circuit Diagram . . . . . . . . . . . . . . . . . . . . . . . . . . . . . . . . . . . . . . . . . . . . . . . . 8-21 To Use R-Box . . . . . . . . . . . . . . . . . . . . . . . . . . . . . . . . . . . . . . . . . . . . . . . . . 8-23 SMU/PG Selector Control . . . . . . . . . . . . . . . . . . . . . . . . . . . . . . . . . . . . . . . . . . 8-25 Setup and Switching Conditions . . . . . . . . . . . . . . . . . . . . . . . . . . . . . . . . . . . 8-26 Restrictions using Selector . . . . . . . . . . . . . . . . . . . . . . . . . . . . . . . . . . . . . . . . 8-26 To Use Selector. . . . . . . . . . . . . . . . . . . . . . . . . . . . . . . . . . . . . . . . . . . . . . . . . 8-27 Switching Matrix Control . . . . . . . . . . . . . . . . . . . . . . . . . . . . . . . . . . . . . . . . . . 8-28 Requirements . . . . . . . . . . . . . . . . . . . . . . . . . . . . . . . . . . . . . . . . . . . . . . . . . . 8-28 To Control Functions . . . . . . . . . . . . . . . . . . . . . . . . . . . . . . . . . . . . . . . . . . . . 8-31 Agilent 4155C/4156C User’s Guide Vol.2, Edition 5 Contents - 7 Contents To Control Connections . . . . . . . . . . . . . . . . . . . . . . . . . . . . . . . . . . . . . . . . . . 8-36 To Use Matrix Setup File . . . . . . . . . . . . . . . . . . . . . . . . . . . . . . . . . . . . . . . . . 8-40 Trigger Function . . . . . . . . . . . . . . . . . . . . . . . . . . . . . . . . . . . . . . . . . . . . . . . . . 8-41 Trigger Input . . . . . . . . . . . . . . . . . . . . . . . . . . . . . . . . . . . . . . . . . . . . . . . . . . 8-43 Trigger Output . . . . . . . . . . . . . . . . . . . . . . . . . . . . . . . . . . . . . . . . . . . . . . . . . 8-44 9. Built-in Functions Built-in Function . . . . . . . . . . . . . . . . . . . . . . . . . . . . . . . . . . . . . . . . . . . . . . . . . . 9-3 ABS . . . . . . . . . . . . . . . . . . . . . . . . . . . . . . . . . . . . . . . . . . . . . . . . . . . . . . . . . . 9-4 AT . . . . . . . . . . . . . . . . . . . . . . . . . . . . . . . . . . . . . . . . . . . . . . . . . . . . . . . . . . . 9-4 AVG . . . . . . . . . . . . . . . . . . . . . . . . . . . . . . . . . . . . . . . . . . . . . . . . . . . . . . . . . . 9-4 COND . . . . . . . . . . . . . . . . . . . . . . . . . . . . . . . . . . . . . . . . . . . . . . . . . . . . . . . . 9-5 DELTA . . . . . . . . . . . . . . . . . . . . . . . . . . . . . . . . . . . . . . . . . . . . . . . . . . . . . . . 9-6 DIFF . . . . . . . . . . . . . . . . . . . . . . . . . . . . . . . . . . . . . . . . . . . . . . . . . . . . . . . . . 9-7 EXP . . . . . . . . . . . . . . . . . . . . . . . . . . . . . . . . . . . . . . . . . . . . . . . . . . . . . . . . . . 9-8 INTEG . . . . . . . . . . . . . . . . . . . . . . . . . . . . . . . . . . . . . . . . . . . . . . . . . . . . . . . . 9-8 LGT . . . . . . . . . . . . . . . . . . . . . . . . . . . . . . . . . . . . . . . . . . . . . . . . . . . . . . . . . . 9-9 LOG . . . . . . . . . . . . . . . . . . . . . . . . . . . . . . . . . . . . . . . . . . . . . . . . . . . . . . . . . 9-9 MAVG . . . . . . . . . . . . . . . . . . . . . . . . . . . . . . . . . . . . . . . . . . . . . . . . . . . . . . . 9-10 MAX . . . . . . . . . . . . . . . . . . . . . . . . . . . . . . . . . . . . . . . . . . . . . . . . . . . . . . . . 9-11 MIN . . . . . . . . . . . . . . . . . . . . . . . . . . . . . . . . . . . . . . . . . . . . . . . . . . . . . . . . . 9-11 SQRT . . . . . . . . . . . . . . . . . . . . . . . . . . . . . . . . . . . . . . . . . . . . . . . . . . . . . . . . 9-11 Read Out Function . . . . . . . . . . . . . . . . . . . . . . . . . . . . . . . . . . . . . . . . . . . . . . . @CX . . . . . . . . . . . . . . . . . . . . . . . . . . . . . . . . . . . . . . . . . . . . . . . . . . . . . . . . @CY . . . . . . . . . . . . . . . . . . . . . . . . . . . . . . . . . . . . . . . . . . . . . . . . . . . . . . . . @CY1 . . . . . . . . . . . . . . . . . . . . . . . . . . . . . . . . . . . . . . . . . . . . . . . . . . . . . . . @CY2 . . . . . . . . . . . . . . . . . . . . . . . . . . . . . . . . . . . . . . . . . . . . . . . . . . . . . . . @IX . . . . . . . . . . . . . . . . . . . . . . . . . . . . . . . . . . . . . . . . . . . . . . . . . . . . . . . . . @IY . . . . . . . . . . . . . . . . . . . . . . . . . . . . . . . . . . . . . . . . . . . . . . . . . . . . . . . . . @IY1 . . . . . . . . . . . . . . . . . . . . . . . . . . . . . . . . . . . . . . . . . . . . . . . . . . . . . . . . @IY2 . . . . . . . . . . . . . . . . . . . . . . . . . . . . . . . . . . . . . . . . . . . . . . . . . . . . . . . . Contents - 8 9-12 9-13 9-13 9-13 9-13 9-14 9-14 9-15 9-15 Agilent 4155C/4156C User’s Guide Vol.2, Edition 5 Contents @L1CO . . . . . . . . . . . . . . . . . . . . . . . . . . . . . . . . . . . . . . . . . . . . . . . . . . . . . . 9-16 @L1G . . . . . . . . . . . . . . . . . . . . . . . . . . . . . . . . . . . . . . . . . . . . . . . . . . . . . . . 9-16 @L1G1 . . . . . . . . . . . . . . . . . . . . . . . . . . . . . . . . . . . . . . . . . . . . . . . . . . . . . . 9-17 @L1G2 . . . . . . . . . . . . . . . . . . . . . . . . . . . . . . . . . . . . . . . . . . . . . . . . . . . . . . 9-18 @L1X . . . . . . . . . . . . . . . . . . . . . . . . . . . . . . . . . . . . . . . . . . . . . . . . . . . . . . . 9-19 @L1Y . . . . . . . . . . . . . . . . . . . . . . . . . . . . . . . . . . . . . . . . . . . . . . . . . . . . . . . 9-19 @L1Y1 . . . . . . . . . . . . . . . . . . . . . . . . . . . . . . . . . . . . . . . . . . . . . . . . . . . . . . 9-19 @L1Y2 . . . . . . . . . . . . . . . . . . . . . . . . . . . . . . . . . . . . . . . . . . . . . . . . . . . . . . 9-19 @L2CO . . . . . . . . . . . . . . . . . . . . . . . . . . . . . . . . . . . . . . . . . . . . . . . . . . . . . . 9-19 @L2G . . . . . . . . . . . . . . . . . . . . . . . . . . . . . . . . . . . . . . . . . . . . . . . . . . . . . . . 9-20 @L2G1 . . . . . . . . . . . . . . . . . . . . . . . . . . . . . . . . . . . . . . . . . . . . . . . . . . . . . . 9-21 @L2G2 . . . . . . . . . . . . . . . . . . . . . . . . . . . . . . . . . . . . . . . . . . . . . . . . . . . . . . 9-22 @L2X . . . . . . . . . . . . . . . . . . . . . . . . . . . . . . . . . . . . . . . . . . . . . . . . . . . . . . . 9-23 @L2Y . . . . . . . . . . . . . . . . . . . . . . . . . . . . . . . . . . . . . . . . . . . . . . . . . . . . . . . 9-23 @L2Y1 . . . . . . . . . . . . . . . . . . . . . . . . . . . . . . . . . . . . . . . . . . . . . . . . . . . . . . 9-23 @L2Y2 . . . . . . . . . . . . . . . . . . . . . . . . . . . . . . . . . . . . . . . . . . . . . . . . . . . . . . 9-23 @MI . . . . . . . . . . . . . . . . . . . . . . . . . . . . . . . . . . . . . . . . . . . . . . . . . . . . . . . . 9-23 @MX . . . . . . . . . . . . . . . . . . . . . . . . . . . . . . . . . . . . . . . . . . . . . . . . . . . . . . . . 9-24 @MY . . . . . . . . . . . . . . . . . . . . . . . . . . . . . . . . . . . . . . . . . . . . . . . . . . . . . . . . 9-24 @MY1 . . . . . . . . . . . . . . . . . . . . . . . . . . . . . . . . . . . . . . . . . . . . . . . . . . . . . . . 9-24 @MY2 . . . . . . . . . . . . . . . . . . . . . . . . . . . . . . . . . . . . . . . . . . . . . . . . . . . . . . . 9-24 10. Connecting Measurement Devices Using Test Fixture . . . . . . . . . . . . . . . . . . . . . . . . . . . . . . . . . . . . . . . . . . . . . . . . 10-3 Using Connector Plate . . . . . . . . . . . . . . . . . . . . . . . . . . . . . . . . . . . . . . . . . . . . . 10-5 To Reduce Leakage Current . . . . . . . . . . . . . . . . . . . . . . . . . . . . . . . . . . . . . . . 10-5 To Measure Low Resistance. . . . . . . . . . . . . . . . . . . . . . . . . . . . . . . . . . . . . . . 10-7 Agilent 4155C/4156C User’s Guide Vol.2, Edition 5 Contents - 9 Contents Contents - 10 Agilent 4155C/4156C User’s Guide Vol.2, Edition 5 1 Sweep Measurements Agilent 4155C/4156C User’s Guide Vol.2, Edition 5 Sweep Measurements This chapter consists of the following sections which describes how to execute a sweep measurement: • “Measurement Functions” • “Defining Measurement Conditions” • “Making a Measurement” For details about the measurement setup screens, see Setup Screen Reference manual. 1-2 Agilent 4155C/4156C User’s Guide Vol.2, Edition 5 Sweep Measurements Measurement Functions Measurement Functions For sweep measurements, the sweep source channels perform staircase sweep output of voltage or current, while the monitor channels measure voltage or current for each sweep step. The 4155C/4156C provides three types of sweep measurement: • “Basic Sweep Measurement” One sweep source (VAR1) is used. • “Subordinate Sweep Measurement” A primary (VAR1) and secondary sweep source (VAR2) are used. • “Synchronous Sweep Measurement” A primary (VAR1) and synchronous sweep source (VAR1') are used. Also, you can set up a combined subordinate and synchronous sweep measurement. Available Units SMUs and VSUs can be sweep sources (VAR1, VAR2, and VAR1'). A sweep or constant source SMU can be set to the pulsed source to prevent thermal drift of the DUT. Output Range Sweep source units use the following output range: • minimum range covers all sweep output values in Linear sweep. • minimum range covers all sweep output values in Log voltage sweep. • optimum range for output value every sweep step in Log current sweep. Agilent 4155C/4156C User’s Guide Vol.2, Edition 5 1-3 Sweep Measurements Measurement Functions Basic Sweep Measurement Basic sweep measurement uses one sweep source (VAR1). The following sweep types are available: • • LIN/LOG • Linear staircase • Logarithmic staircase SWEEP MODE • Single Source channel sweeps the output from user specified start value to stop value. • Double Source channel sweeps the output from user specified start value to stop value, then from stop value to start value. You can select any combination of LIN/LOG and SWEEP MODE as shown in the following table: 1-4 Agilent 4155C/4156C User’s Guide Vol.2, Edition 5 Sweep Measurements Measurement Functions Figure 1-1 Basic Sweep Measurement To set up basic sweep measurement, select VAR1 function for desired SMU or VSU on CHANNELS: CHANNEL DEFINITION screen. Parameters Also, specify the following parameters for VAR1 on MEASURE: SWEEP SETUP screen. Parameter Description sweep mode Single or double sweep. linear/log Linear or logarithmic sweep. For logarithmic sweep, select the number steps in one decade as follows: LOG10 10 steps in one decade. LOG25 25 steps in one decade. LOG50 50 steps in one decade. Agilent 4155C/4156C User’s Guide Vol.2, Edition 5 1-5 Sweep Measurements Measurement Functions start Start value of sweep. For logarithmic sweep, start must not be zero. Allowable range of start depends on output range of sweep source. For output range of each measurement channel, refer to Chapter 7. stop Stop value of single sweep or turning back value of double sweep. For logarithmic sweep, stop must have same polarity as start, and must not be zero. Allowable range of stop depends on output range of sweep source. For output range of each measurement channel, refer to Chapter 7. step • For linear sweep, step is step increment of sweep. Number of sweep steps is calculated from start, stop, and step. Calculated number of steps must be in range: 2 to 1001. • For logarithmic sweep, step is invalid. Number of sweep steps is calculated from start, stop, and number of steps in one decade, which is specified by log parameter. Calculated number of steps must be in range: 2 to 1001. compliance Compliance value of sweep source. This parameter applies to SMU only. Allowable range of compliance depends on the compliance range of sweep source. For the compliance range of each measurement channel, refer to Chapter 7. power compliance (Optional) Power compliance value of sweep source. This parameter applies to SMU only. Allowable range depends on power compliance range of sweep source. For details, refer to Chapter 7. hold time Time required for DUT to settle after forcing start value. Allowable range is 0 to 655.35s. Resolution: 10 ms. delay time Time required for DUT to settle after stepping the output. Allowable range: 0 to 65.535 s. Resolution: 100 µs Refer to Setup Screen Reference for setting up these parameters. 1-6 Agilent 4155C/4156C User’s Guide Vol.2, Edition 5 Sweep Measurements Measurement Functions Subordinate Sweep Measurement For subordinate sweep measurement, you set up a secondary sweep source (VAR2) in addition to a primary sweep source (VAR1). After primary sweep is completed, the output of secondary sweep source is incremented or decremented by the specified step value, then the primary sweep source is swept again. Figure 1-2 Subordinate Sweep Measurement To set up the subordinate sweep measurement, select the following on CHANNELS: CHANNEL DEFINITION screen: • VAR1 function for desired primary sweep source (SMU or VSU). • VAR2 function for desired secondary sweep source (SMU or VSU). Subordinate sweep measurement has the following restriction: • For the secondary sweep source, only single sweep mode and linear staircase mode are available. Agilent 4155C/4156C User’s Guide Vol.2, Edition 5 1-7 Sweep Measurements Measurement Functions Parameters The parameters for primary sweep source (VAR1) are same as the parameters for sweep source of basic sweep measurement. For secondary sweep source (VAR2), specify the following parameters on MEASURE: SWEEP SETUP screen. NOTE Parameter Description start Start value of secondary sweep. Allowable range of start depends on the output range of secondary sweep source. For the output range of each measurement channel, refer to Chapter 7. step Step increment of secondary sweep. number of steps Number of secondary sweep steps.Allowable range: 1 to 128. Stop value Stop value of secondary sweep is calculated from start, step, and number of steps. Allowable range of stop depends on the output range of secondary sweep source. For the output range of each measurement channel, refer to Chapter 7. compliance Compliance value of secondary sweep source. This parameter applies to SMU only. Allowable range of compliance depends on the compliance range of secondary sweep source. For the compliance range of each measurement channel, refer to Chapter 7. power compliance (Optional) Power compliance value of secondary sweep source. This parameter applies to SMU only. Allowable range of power compliance depends on the power compliance range of sweep source. For details, refer to Chapter 7. 1-8 Agilent 4155C/4156C User’s Guide Vol.2, Edition 5 Sweep Measurements Measurement Functions Synchronous Sweep Measurement For synchronous sweep measurement, you set up a synchronous sweep source (VAR1') in addition to a primary sweep source (VAR1). The output of the synchronous sweep source is swept synchronously with the output of the primary sweep source at a constant offset value and ratio. Figure 1-3 Synchronous Sweep Measurement To set up synchronous sweep measurement, select the following on CHANNELS: CHANNEL DEFINITION screen: • VAR1 function for desired primary sweep source (SMU or VSU). • VAR1' function for desired synchronous sweep source (SMU or VSU). Synchronous sweep mode has the following restrictions: • • For the following, VAR1' is always set to the same mode as VAR1: • linear/log staircase • single/double sweep mode VAR1 and VAR1' must be same V/I output mode. For example, if VAR1 is set to V mode, then VAR1' must be set to V or VPULSE mode. Agilent 4155C/4156C User’s Guide Vol.2, Edition 5 1-9 Sweep Measurements Measurement Functions Parameters The parameters for primary sweep source (VAR1) are same as the parameters for sweep source of basic sweep measurement. For synchronous sweep source (VAR1'), specify the following parameters on MEASURE: SWEEP SETUP screen. Parameter Description offset Offset between outputs of primary and synchronous sweep sources. ratio Ratio between outputs of primary and synchronous sweep sources. compliance Compliance value of synchronous sweep source. This parameter applies to SMU only. Allowable range of compliance depends on the compliance range of synchronous sweep source. For the compliance range of each measurement channel, refer to Chapter 7. power compliance (Optional) Power compliance value of synchronous sweep source. This parameter applies to SMU only. Allowable range of power compliance depends on the power compliance range of synchronous sweep source. For details, refer to Chapter 7. The relationship between the output of primary and synchronous sweep sources is determined by the following equation: synchronous output = primary output × ratio + offset The synchronous output determined by above equation must not exceed the output range of synchronous sweep source. 1-10 Agilent 4155C/4156C User’s Guide Vol.2, Edition 5 Sweep Measurements Measurement Functions Pulse Sweep Measurement For a sweep measurement, a sweep or constant source SMU can be a pulse source. But only one SMU can be a pulse source. Figure 1-4 shows the relationship between pulse source and other sources. Figure 1-4 Pulse Source and Other Sources For the pulse sweep measurement, the delay time of the primary sweep source is ignored, and each step of the primary sweep source is synchronized with output of the SMU pulse source. Measurements are made during the pulse output. The pulse output of PGU is not synchronized with any other source. Agilent 4155C/4156C User’s Guide Vol.2, Edition 5 1-11 Sweep Measurements Measurement Functions Figure 1-5 SMU Pulse Parameters Specify SMU pulse parameters (MEASURE: SWEEP SETUP): Parameter Description pulse period SMU forces the next pulse after specified pulse period. Allowable range: 5 ms to 1 s. Resolution: 100 µs. pulse width Time from when SMU output starts to change from base value to time when SMU starts to return from peak value. Measurements are made while the peak value is output. Allowable range: 0.5 ms to 100 ms. Resolution: 100 µs. base value The base output value of the SMU pulse. Be aware that if any of following are true, pulsed SMU channel may not output the pulse period and pulse width you specified: • Measurement range differs from compliance range (lowest range that includes compliance). • Ranging mode is set to auto range or limited auto range. • Multi-channel measurement is set. 1-12 Agilent 4155C/4156C User’s Guide Vol.2, Edition 5 Sweep Measurements Measurement Functions NOTE Pulse width If the measurement settings do not meet the following conditions, pulse width setting of SMU may be insufficient to make measurement. If so, the pulse width is automatically changed to be appropriate. Number of Meas. Channels: 1 Integration Time: Short Ranging Mode: Fixed Agilent 4155C/4156C User’s Guide Vol.2, Edition 5 1-13 Sweep Measurements Defining Measurement Conditions Defining Measurement Conditions This section describes the sweep measurement tasks. The basic procedure to test your DUT is as follows: 1 Connecting your DUT to the 4155C/ 4156C. See Chapter 10 for procedures. 2 C HA N NE L S: C H AN NE L D EF I NI TI O N 01 J AN 29 10 :5 7A M S WE EP * ME A SU RE M EN T MO D E SW E EP S AM P LI N G * CH A NN EL S U N IT SM U 1: HR SM U 2: HR SM U 3: HR SM U 4: HR SM U 5: HP VS U 1 VS U 2 VM U 1 VM U 2 PG U 1 PG U 2 GN D U M E AS UR E I NA ME IS IG ID V NA ME VS VG VD ST BY M O DE CO M MO N V V FC T N CO N S T VA R 1 ' VA R 1 S ER I ES R ES I ST AN CE 0 ohm Q SC V D EF AU L T M EA SU R E S ET UP 0 ohm - -- -- - - -- -- - - -- -- - - -- -- - - -- -- - - -- -- - - -- -- - - -- - - - -- --- - - - -- -- M EM 1 M B -T r V CE -I C D IS C HA RG E ON Defining measurement mode and measurement units that you use to make measurement. See “To Define Measurement Units” on page 1-16. Also see Chapter 8 for the user function, standby function, and R-box control. M EM 2 M F ET V DS -I D -- -- M OR E 1 /2 S WE E P S el e ct Me as u re me nt Mo d e wi t h so f tk ey o r ro ta ry kn ob . C HA NN E L D EF US ER FC TN U SE R V AR S B E52 5 0A PRO P N EX T P AG E 3 M EA S UR E : SW E EP S ET U P 01 J AN 29 10 :5 8A M S IN GL E *V A RI A BL E U N IT N A ME S W EE P M OD E L I N/ L OG S T AR T S T OP S T EP N O O F S TE P C O MP L IA NC E P O WE R C OM P V AR 1 V AR 2 S MU 3: H R VD S IN GL E L IN EA R 0. 00 0 0 V 2. 00 0 0 V 20 .0 m V 1 01 10 0. 0 0m A O FF VA R1 ' UN I T SM U2 : HR NA M E VG OF F S ET 0 .0 0 00 V RA T I O 1 .0 0 0 CO M P LI AN CE 1 00 . 00 mA PO W E R CO MP OF F D OU BL E *T I MI N G H O LD TI ME 0. 00 0 0 s D E LA Y T IM E 0. 00 0 0 s * S WE EP S TO P A T A NY A B NO RM St at us *C O NS T AN T U N IT N A ME M O DE S O UR C E - -- -- - -- - - -- - -- -- - - -- -- - - -- - -- - -- -- C O MP L IA NC E - -- -- - -- - - -- - -- -- - - -- -- - - -- - -- - -- -- S IN G LE S el e ct Sw ee p M od e w it h s of t ke y o r ro ta r y k no b. S WE EP S ET UP 1-14 M EA S UR E S ET U P OU T PU T SE Q S B P R EV P A GE N EX T P AG E Setting the source parameters of the units. See following in this section: • “To Set up Primary Sweep” • “To Set up Secondary Sweep” • “To Set up Synchronous Sweep” • “To Set up Constant Output” • “To Set up SMU Pulsed Output” • “To Set up PGU Output” • “To Set up Stop Condition” Agilent 4155C/4156C User’s Guide Vol.2, Edition 5 Sweep Measurements Defining Measurement Conditions 4 D IS P LA Y : DI S PL AY S E TU P 01 J AN 29 10 :5 8A M G RA PH I CS *D I SP LA Y M OD E G R AP HI C S Setting the display mode to show measurement results. See following in this section: L IS T *G R AP HI C S X ax is Y 1a xi s Y 2a xi s N A ME VD S QI D D SQ ID S C AL E L IN EA R L IN EA R L IN EA R MIN 0. 00 00 0 00 0 0 V 0. 00 0 00 00 00 0 0. 00 0 00 00 0 00 MAX 2. 00 00 0 00 V 10 0. 0 00 00 00 0 m 10 0. 0 00 00 0 00 m *G R ID ON * L IN E P AR AM ET E R ON *D A TA V A RI AB LE S * D AT A D IS PL AY R ES OL UT I ON N OR MA L G RA P HI C S S el e ct Di sp l ay M od e w i th s o ft ke y o r ro t a ry k no b . D IS PL A Y S ET UP AN LY SI S SE TU P “To Display Graphics Results” • “To Display List Results” B P R EV P A GE S • N EX T P AG E 5 Executing the measurement. See “To Execute or Stop Measurement” on page 1-29. Also see Chapter 7 for executing self-calibration and zero offset cancel. 6 G RA P H/ L IS T: GR AP HI C S S H OR T 01 J AN 29 10 :5 9A M M AR KE R Results. For example, displayed graphically. OFF () () 10 0 .m M AR KE R M IN /M A X 1 00 . m SQ I D I NT ER PO LA T E OFF DS QI D 10 . 0m / d iv 1 0. 0 m /d i v M AR KE R S KI P A UT O A NA LY S IS 0. 0 0 0 .0 0 0. 0 0 VD (V ) 2 00 .m / di v C UR SO R 2. 00 OFF B A XI S Y1 MA RK ER / CU RS OR L IN E SC A LI NG S DIS P LA Y SET U P SW EE P SE TU P T I MI NG S E TU P Agilent 4155C/4156C User’s Guide Vol.2, Edition 5 1-15 Sweep Measurements Defining Measurement Conditions To Define Measurement Units Press Chan front-panel key to define the measurement units. CHANNELS: CHANNEL DEFINITION screen is displayed. 1. MEASUREMENT MODE: Select SWEEP secondary softkey for sweep measurement. 2. VNAME: Enter a unique name for voltage variable. For example, enter Vce for collector-emitter voltage. If channel does neither V force nor V measurement, you can omit VNAME. 3. INAME: Enter a unique name for current variable. For example, enter Ic for collector current. If channel does neither I force nor I measurement, you can omit INAME. 4. MODE: Select one of the following softkeys: • V : Voltage output (for SMU, VSU, and PGU). V : Grounded mode voltage measurement (for VMU). • I : Current output (for SMU). • VPULSE : Pulsed voltage output (for SMU and PGU). • IPULSE : Pulsed current output (for SMU). • COMMON : Circuit common (for SMU and GNDU). • DVOLT : Differential mode voltage measurement (for VMU). 5. FCTN: Select one of the following softkeys to set the output function: • CONST : Constant output function (for SMU, VSU, and PGU). • VAR1 : Primary sweep output function (for SMU and VSU). • VAR2 : Secondary sweep output function (for SMU and VSU). • VAR1' : Synchronous sweep output function (for SMU and VSU). 1-16 Agilent 4155C/4156C User’s Guide Vol.2, Edition 5 Sweep Measurements Defining Measurement Conditions 6. DISCHARGE: Select ON secondary softkey to connect the discharge resistor to VMU input, or OFF to disconnect the resistor. The discharge resistor is used to prevent the VMU inputs from charge up in the idle state. When DISCHARGE is ON, the discharge resistor is automatically connected to the VMU input, and disconnected from the input in the measurement state. VNAME and INAME You can use VNAME and INAME names in user function definitions or for analysis on the GRAPHICS/LIST screens. These names must be 6 or less alphanumeric characters. First character must be alphabet character. To disable a unit Select DELETE ROW softkey. The settings for the unit are deleted. Agilent 4155C/4156C User’s Guide Vol.2, Edition 5 1-17 Sweep Measurements Defining Measurement Conditions To Set up Primary Sweep Primary sweep source is the measurement unit defined as VAR1 in the CHANNELS: CHANNEL DEFINITION screen. To set up the primary sweep source, press Meas front-panel key. The MEASURE: SWEEP SETUP screen is displayed. 1. VAR1 : SWEEP MODE Select one of the following softkeys to set the sweep mode: • SINGLE : single sweep mode. • DOUBLE : double sweep mode. 2. VAR1 : LIN/LOG Select one of the following softkeys to set the sweep step mode: • LINEAR : linear step mode. • LOG XX : logarithmic step mode. XX specifies the number of steps per decade. XX is 10, 25, or 50. 3. VAR1 : START Enter the sweep start value. 4. VAR1 : STOP Enter the sweep stop value. If you select LOG sweep step mode, the polarity of stop value must be same as the polarity of start value. 5. VAR1 : STEP If you select LINEAR sweep step mode, enter the sweep step value. This field is not available for the LOG mode. 6. VAR1 : COMPLIANCE, POWER COMPLIANCE Only for SMU. Enter the compliance value, and power compliance (ON or OFF) for the primary sweep source. NO OF STEP is automatically calculated from START, STOP, and STEP values. You cannot change UNIT and NAME in this screen. To change the values, go to the CHANNELS: CHANNEL DEFINITION screen. 1-18 Agilent 4155C/4156C User’s Guide Vol.2, Edition 5 Sweep Measurements Defining Measurement Conditions To Set up Secondary Sweep Secondary sweep source is the measurement unit defined as VAR2 in the CHANNELS: CHANNEL DEFINITION screen. On the MEASURE: SWEEP SETUP screen, set up the primary sweep source (VAR1), then do following: 1. VAR2: START Enter the secondary sweep start value. 2. VAR2: STEP Enter the secondary sweep step value. 3. VAR2: NO OF STEP Enter the number of steps for the secondary sweep. 4. VAR2 : COMPLIANCE, POWER COMPLIANCE Only for SMU. Enter the compliance value, and power compliance (ON or OFF) for the secondary sweep source. SWEEP MODE and LIN/LOG are automatically set to SINGLE and LINEAR, respectively. You cannot change the settings. The STOP value is automatically calculated from START, STEP, and NO OF STEP values. You cannot change UNIT and NAME in this screen. To change the values, go to the CHANNELS: CHANNEL DEFINITION screen. Agilent 4155C/4156C User’s Guide Vol.2, Edition 5 1-19 Sweep Measurements Defining Measurement Conditions To Set up Synchronous Sweep Synchronous sweep source is the measurement unit defined as VAR1’ in the CHANNELS: CHANNEL DEFINITION screen. VAR1’ is available for the measurement units set to the output mode same as the VAR1 output mode. The output value of VAR1' is calculated by the following equation: VAR1' = VAR1 × RATIO + OFFSET On the MEASURE: SWEEP SETUP screen, set up the primary sweep source (VAR1), then do following: 1. VAR1’ : OFFSET Enter the offset value of the VAR1’ output against the VAR1 output. 2. VAR1’ : RATIO Enter the ratio value of the VAR1’ output against the VAR1 output. 3. VAR1’ : COMPLIANCE, POWER COMPLIANCE Only for SMU. Enter the compliance value, and power compliance (ON or OFF) for the synchronous sweep source. You cannot change UNIT and NAME in this screen. To change the values, go to the CHANNELS: CHANNEL DEFINITION screen. 1-20 Agilent 4155C/4156C User’s Guide Vol.2, Edition 5 Sweep Measurements Defining Measurement Conditions To Set up Constant Output Constant voltage/current source is the measurement unit defined as CONST in the CHANNELS: CHANNEL DEFINITION screen. To set up the constant output source, press Meas front-panel key. The MEASURE: SWEEP SETUP screen is displayed. 1. CONSTANT : SOURCE Enter the desired output value of the constant source. 2. CONSTANT : COMPLIANCE Only for SMU. Enter the compliance value for the constant source. You cannot change UNIT, NAME, and MODE in this screen. To change the values, go to the CHANNELS: CHANNEL DEFINITION screen. Agilent 4155C/4156C User’s Guide Vol.2, Edition 5 1-21 Sweep Measurements Defining Measurement Conditions To Set up SMU Pulsed Output SMU pulse output source is the measurement unit defined as VPULSE or IPULSE in the CHANNELS: CHANNEL DEFINITION screen. For pulsed sweep source, set the function (FCTN) to VAR1, VAR2, or VAR1’. For pulsed constant source, set the function to CONST. To set up the SMU pulse output source, press Meas front-panel key. The MEASURE: SWEEP SETUP screen is displayed. 1. Set the source output parameters: • For VAR1, refer to “To Set up Primary Sweep” on page 1-18. • For VAR2, refer to “To Set up Secondary Sweep” on page 1-19. • For VAR1’, refer to “To Set up Synchronous Sweep” on page 1-20. • For CONST, refer to “To Set up Constant Output” on page 1-21. 2. SMU PULSE: PERIOD Enter the pulse period value. 3. SMU PULSE: WIDTH Enter the pulse width value. 4. SMU PULSE: BASE Enter the pulse base value. You cannot change UNIT and NAME in this screen. To change the values, go to the CHANNELS: CHANNEL DEFINITION screen. 1-22 Agilent 4155C/4156C User’s Guide Vol.2, Edition 5 Sweep Measurements Defining Measurement Conditions Pulse Parameters The relation between the PERIOD, WIDTH, and BASE values are as shown in the following figures. SMU outputs the pulses as shown in figure (a) or figure (b). • Figure (a) When the function (FCTN) is set to VAR1, VAR2, or VAR1’. The pulse peak values are the sweep output values calculated from the sweep start, stop, step values, and so on. • Figure (b) When the function (FCTN) is set to CONST. The pulse peak value is the output value of the constant output source. Agilent 4155C/4156C User’s Guide Vol.2, Edition 5 1-23 Sweep Measurements Defining Measurement Conditions To Set up PGU Output 1. Define PGU to be VPULSE and CONST as described in “To Define Measurement Units” on page 1-16. 2. Press Meas key in the PAGE CONTROL key group. 3. Select PGU SETUP primary softkey. 4. In the PERIOD field of PGU1, enter the pulse period value. 5. In the WIDTH field of desired PGU column, enter the pulse width value. 6. In the DELAY TIME field of desired PGU column, enter delay time value. 7. In the PEAK VALUE field of desired PGU column, enter pulse peak value. 8. In the BASE VALUE field of desired PGU column, enter pulse base value. 9. In the LEADING TIME field of desired PGU column, enter the leading-edge transition time. 10. In the TRAILING TIME field of desired PGU column, enter the trailing-edge transition time. 11. In the IMPEDANCE field of desired PGU column, select: • LOW secondary softkey for approximately zero ohm output impedance. • 50 ohm secondary softkey for 50 ohm output impedance. 12. In the PULSE COUNT field, do one of the following: • Select FREE RUN secondary softkey to force the pulse continuously. • Or enter the number of pulses to output (for sampling measurement only). For the pulse period and pulse count values, the values you set for PGU1 are also used for PGU2. The following figure shows the relation between pulse waveform and setup parameters. 1-24 Agilent 4155C/4156C User’s Guide Vol.2, Edition 5 Sweep Measurements Defining Measurement Conditions To modify the UNIT and NAME fields Modify the UNIT and NAME fields on the CHANNELS: CHANNEL DEFINITION screen. Using PGUs as constant voltage source To use a PGU as a constant voltage source, set the desired PGU as follows: • V in MODE column on the CHANNEL DEFINITION screen • Desired output voltage value in SOURCE field on MEASURE: PGU SETUP screen. Agilent 4155C/4156C User’s Guide Vol.2, Edition 5 1-25 Sweep Measurements Defining Measurement Conditions To Set up Stop Condition 1. Press Meas key in the PAGE CONTROL key group. 2. Move field pointer to SWEEP Status field. 3. Select one of the following softkeys: CONT AT ANY STOP AT ANY ABNORM STOP AT COMPLIANCE Sweep will continue even if an abnormal status occurs. If power compliance is set for an SMU, this softkey is not displayed. Sweep will stop if any abnormal status occurs. Sweep will stop only if SMU reaches its compliance setting. This is automatically set when power compliance is set for SMUs, or when 10k ohm, 100k ohm, or 1M ohm is selected in the SERIES RESISTANCE field. Abnormal status means the following: • SMU reaches its compliance setting. • Current of VSU exceeds approximately ±100 mA. • SMU or VSU oscillates. • A/D converter overflow occurs. • Average current of PGU exceeds ±100 mA. 1-26 Agilent 4155C/4156C User’s Guide Vol.2, Edition 5 Sweep Measurements Defining Measurement Conditions To Display Graphics Results 1. Press Display key in the PAGE CONTROL key group. 2. Select DISPLAY SETUP primary softkey. 3. In the DISPLAY MODE field, select GRAPHICS secondary softkey. 4. In the X axis column, enter variable name, select axis scale, and enter minimum and maximum values. 5. In the Y1 axis column, enter variable name, select axis scale, and enter minimum and maximum values. 6. If you use Y2 axis, enter variable name, select axis scale, and enter minimum and maximum values in Y2 axis column. When the pointer is in the NAME row, the allowable variable names appear in the secondary softkey area. To set a variable name, select the desired secondary softkey. The allowable names are names that you already set up on the CHANNEL DEFINITION, USER FUNCTION, and USER VARIABLE screens. To display a grid on the plotting area In the GRID field, select ON to display or OFF to not display. To display line parameters on the plotting area In the LINE PARAMETER field, select ON to display or OFF to not display. Line parameters are the X and Y intercepts and gradient of the analysis lines. To display variables on the data variable area In the DATA VARIABLES fields, select secondary softkey for desired variable. Up to 2 variables can be displayed on the data variable area which is located between the graph area and the marker area. To change resolution of the data to be displayed In the DATA DISPLAY RESOLUTION field, select NORMAL for the resolution shown in the specifications, or EXTEND for the ADC full scale resolution. For example, the data display resolution is 1 fA in NORMAL mode, and 10 aA in EXTEND mode for 10 pA measurement range. Agilent 4155C/4156C User’s Guide Vol.2, Edition 5 1-27 Sweep Measurements Defining Measurement Conditions To Display List Results 1. Press Display key in the PAGE CONTROL key group. 2. Select DISPLAY SETUP primary softkey. 3. In the DISPLAY MODE field, select LIST secondary softkey. 4. In the LIST area, select the secondary softkey of the variables for which you want to list the measurement results. When the pointer is in the NAME row, the allowable variable names appear in the secondary softkey area. To set a variable name, select the desired secondary softkey. The allowable names are names that you already set up on CHANNEL DEFINITION, USER FUNCTION, and USER VARIABLE screens. To display variables on the data variable area In the DATA VARIABLES fields, select secondary softkey for desired variable. Up to 2 variables can be displayed on the data variable area which is located below the list area. To change resolution of the data to be displayed In the DATA DISPLAY RESOLUTION field, select NORMAL for the resolution shown in the specifications, or EXTEND for the ADC full scale resolution. For example, the data display resolution is 1 fA in NORMAL mode, and 10 aA in EXTEND mode for 10 pA measurement range. 1-28 Agilent 4155C/4156C User’s Guide Vol.2, Edition 5 Sweep Measurements Defining Measurement Conditions To Execute or Stop Measurement • • To execute a measurement, press: key in the MEASUREMENT key group for single measurement. • Single • Repeat • Append key in the MEASUREMENT key group for repeat measurement. key in the MEASUREMENT key group for append measurement. To stop a measurement, press Stop key in the MEASUREMENT key group. Single, Repeat, and Append Measurement There are three measurement execution modes as follows: Single measurement Repeat measurement Append measurement Clears GRAPHICS or LIST screen, then executes measurement one time. Measurement results are displayed on GRAPHICS or LIST screen. Executes measurements continuously. Before each measurement is executed, the GRAPHICS or LIST screen is cleared. Most recent measurement results are displayed on GRAPHICS or LIST screen. Executes measurement one time. Does not clear GRAPHICS or LIST screen. That is, measurement results are added to the existing results. Agilent 4155C/4156C User’s Guide Vol.2, Edition 5 1-29 Sweep Measurements Making a Measurement Making a Measurement In this section, you learn how to execute the measurements with an 4155C/4156C and to display the measurement results graphically. Id-Vg measurement of a MOS FET is provided as an example. You learn step-by-step how to perform this measurement. You measure the device under test (DUT) by using the measurement circuit as shown in the following diagram. SMU2 and SMU3 sweep the same voltage to the gate and drain. SMU3 measures the drain current (Id). The source and substrate are connected to circuit common. You should get result similar to the following figure. Gate voltage Vg (swept from 0 V to 2 V) is assigned to X axis, √Id is assigned to Y1 axis, and ∂√Id / ∂Vg is assigned to Y2 axis. NOTE For accurate measurements, allow the 4155C/4156C to warm-up for a minimum of 40 minutes after you turn on the instrument, and then execute calibration. For the self-calibration, see Chapter 7. 1-30 Agilent 4155C/4156C User’s Guide Vol.2, Edition 5 Sweep Measurements Making a Measurement Step 1. Prepare for the measurement Before executing measurement, configure the 4155C/4156C and accessories. 1. Make sure that the 4155C/4156C is off. 2. Connect the 16442A/B test fixture to the 4155C/4156C. See figure below. 3. If you use the keyboard, connect it to the 4155C/4156C. Connection between 4156C and 16442A/B: 16442A/B Kelvin Triaxial Cables Coaxial Cables Interlock/LED Cable 4156 4156C cable 16442A/B 4156C Interlock/LED a Intlk VSU 1 SMU 1 Kelvin triaxial c SMU 1 SMU 2 Kelvin triaxial c SMU 3 Kelvin triaxial c Intlk cable 16442A/B Coaxial b VSU 1 VSU 2 Coaxial b VSU 2 SMU 2 VMU 1 Coaxial b VMU 1 SMU 3 VMU 2 Coaxial b VMU 2 a. Interlock/LED cable: Agilent 16493J b. Coaxial cable: Agilent 16493B. You do not need to connect VSUs and VMUs for this measurement. c. Kelvin triaxial cable: Agilent 16493K, or Triaxial cable: Agilent 16493C. For the non-kelvin connections, open the Sense terminals. Agilent 4155C/4156C User’s Guide Vol.2, Edition 5 1-31 Sweep Measurements Making a Measurement Connection between 4155C and 16442A/B: 16442A/B Triaxial Cables Coaxial Cables Interlock/LED Cable 4155 4155C cable 16442A/B Intlk Interlock/LED a Intlk SMU 1 Triaxial b SMU 2 Triaxial b SMU 3 Triaxial b SMU 4 Triaxial b SMU 1 (blue label) SMU 2 (blue label) SMU 3 (blue label) SMU 4 (blue label) 4155C cable 16442A/B VSU 1 Coaxial c VSU 1 VSU 2 Coaxial c VSU 2 VMU 1 Coaxial c VMU 1 VMU 2 Coaxial c VMU 2 a. Interlock/LED cable: Agilent 16493J b. Triaxial cable: Agilent 16493C. You do not need to connect SMU4 for this measurement. c. Coaxial cable: Agilent 16493B. You do not need to connect VSUs and VMUs for this measurement. 1-32 Agilent 4155C/4156C User’s Guide Vol.2, Edition 5 Sweep Measurements Making a Measurement Step 2. Mount your DUT on the test fixture 1. Select a suitable socket module for your DUT. 2. Mount the socket module on the test fixture. 3. Mount your DUT on the socket module. 4. Make connections with four connection cables (miniature banana to pin plug). You make the following connections: • Source to SMU1 • Gate to SMU2 • Drain to SMU3 • Substrate to SMU1 Both the source and substrate terminals are connected to SMU1. 5. After finishing connections, shut the lid of the test fixture. Agilent 4155C/4156C User’s Guide Vol.2, Edition 5 1-33 Sweep Measurements Making a Measurement Wiring for the 4156C For this measurement, non-Kelvin connections are used. So, connect only the force terminals as shown in the following figure: Wiring for the 4155C 1-34 Agilent 4155C/4156C User’s Guide Vol.2, Edition 5 Sweep Measurements Making a Measurement Step 3. Define the channel assignments You set the connection information on the CHANNELS: CHANNEL DEFINITION screen. 1. Turn on the 4155C/4156C. Self-test starts. 2. After self-test is finished, make sure that CHANNELS: CHANNEL DEFINITION screen appears on the screen of the 4155C/4156C. If not, press Chan front-panel key. where, softkeys located bottom of screen are the primary softkeys, and softkeys located right side of screen are the secondary softkeys. 3. Make sure that SWEEP is displayed in the MEASUREMENT MODE field. If not, select SWEEP secondary softkey in the MEASUREMENT MODE field. 4. Set the connection information in the CHANNELS area as shown in the following table. For the actual screen, see Figure 1-6. on Front Panel on Keyboard To move the pointer, use arrow keys of MARKER/CURSOR area. use arrow keys To move the cursor to edit in display area, use arrow keys of Edit area. use Backspace key. To enter "VS" in VNAME field, press . (period) and + keys, then Enter. type VS, then press Enter. To enter "IS" in INAME field, press * and + keys, then Enter. type IS, then press Enter. To set "V" in MODE field, select V secondary softkey. press Shift-F1 keys. To set "VAR1" in FCTN field, select VAR1' secondary softkey. press Shift-F4 keys. To set "VAR1" in FCTN field, select VAR1 secondary softkey. press Shift-F2 keys. To disable a unit, select DISABLE UNIT secondary softkey. press Shift-F7 keys. Agilent 4155C/4156C User’s Guide Vol.2, Edition 5 1-35 Sweep Measurements Making a Measurement Figure 1-6 Channel Definition Screen CH AN NE L S: C HAN NE L D EFIN ITI ON 01JAN29 10:57AM SWEEP * ME A SU RE MEN T MOD E SW E EP SAMPLING * CH A NN EL S UNIT SM U 1: HR SM U 2: HR SM U 3: HR SM U 4: HR SM U 5: HP VS U 1 VS U 2 VM U 1 VM U 2 PG U 1 PG U 2 GN D U VNAME VS VG VD MEASURE INAME IS IG ID STBY MODE COMMON V V FC TN CO NS T VA R1 ' VA R1 SERIES RESISTANCE 0 ohm QSCV DEFAULT MEASURE SETUP 0 ohm ------------------------------------------- -- -- - - ---- -- - - --- MEM1 M B-Tr VCE-IC DISCHARGE ON MEM2 M FET VDS-ID ---- MORE SWEEP Se le ct Me as ure me nt Mode wi th so ftke y o r rot ary kno b. CHANNEL DEF 1-36 US E R FC T N USER VAR S E5250A PROP 1/2 B NEXT PAGE Agilent 4155C/4156C User’s Guide Vol.2, Edition 5 Sweep Measurements Making a Measurement Step 4. Define the user functions You define the user functions on the CHANNELS: USER FUNCTION DEFINITION screen. 1. Select USER FCTN primary softkey. The CHANNELS: USER FUNCTION DEFINITION screen appears. 2. Enter the user function information as shown in the following table. For the actual screen, see Figure 1-7. on Front Panel on Keyboard To move the pointer, use arrow keys of MARKER/CURSOR area. use arrow keys. To move the cursor to edit in display area, use arrow keys of Edit area. use Backspace key. To enter "SQID" in NAME field, press +, 2, *, / keys, then Enter. type SQID, then press Enter. To enter "SQRT(ID)" a in DEFINITION field, press +, 2, 3, p, blue key, ( keys, and ID secondary softkey, then ) and Enter. type SQRT(ID), then press Enter. To enter "DSQID" in NAME field, press /, +, 2, *, / keys, then Enter. type DSQID, then press Enter. To enter "DIFF(SQID,VG)" b in DEFINITION field, press /, *, 7, 7, blue key, (, blue key, +, 2, *, /, blue key, , (comma) keys, and VG secondary softkey, then ) and Enter. type DIFF(SQID,VG), then press Enter. To disable a user function, select DISABLE FUNCTION secondary softkey. press Shift-F7 key. a. Square root operator (√ ) is defined by "SQRT" built-in function. b. Partial difference (∂/∂) is defined by "DIFF" built-in function. Agilent 4155C/4156C User’s Guide Vol.2, Edition 5 1-37 Sweep Measurements Making a Measurement Figure 1-7 User Function Definition Screen CH AN NE L S: U SER F UNC TION DE FI NIT ION 01JAN29 10:53AM * US E R FU NCT IO N NAME UNIT DEFI N IT IO N SQ I D SQRT(ID) DS Q ID DIFF(SQID,VG) DELETE ROW SQID En te r U se r Fun ct ion Nam e. (m ax 6 ch a rs .) CHANNEL DEF US E R FC T N USER VAR S E5250A PROP B PREV PAGE NEXT PAGE Figure 1-7 defines the following two user functions: SQID = √Id DSQID = ∂SQID / ∂Vg = ∂√ Id / ∂Vg Where, Id is drain current and Vg is gate voltage. 1-38 Agilent 4155C/4156C User’s Guide Vol.2, Edition 5 Sweep Measurements Making a Measurement Step 5. Set up the measurement parameters You set the output parameters on the MEASURE: SWEEP SETUP screen. 1. Press Meas front-panel key. The MEASURE: SWEEP SETUP screen appears. In the screen, the upper left area defines the VAR1 information, and the upper right area defines the VAR1’ information. See Figure 1-8. 2. Set the VAR1 information as shown below: on Front Panel on Keyboard To move the pointer, use arrow keys of MARKER/CURSOR area. use arrow keys. To set "SINGLE" in SWEEP MODE field, select SINGLE secondary softkey. press Shift-F1 keys. To set "LINEAR" in LIN/LOG field, select LINEAR secondary softkey. press Shift-F1 keys. To enter "2.000 V" in STOP field, press 2, then Enter. type 2, then press Enter. To enter "20.00 mV" in STEP field, press 2, 0, m, then Enter. type 20m, then press Enter. Drain voltage sweeps from 0 V to 2 V with 20 mV step. The current compliance is set to 100 mA. 3. Set the VAR1’ information as shown below: on Front Panel on Keyboard To enter "0.000 V" in OFFSET field, press 0, then Enter. type 0, then press Enter. To enter "1.000" in RATIO field, press 1, then Enter. type 1, then press Enter. To force the same voltage to the drain and gate, set RATIO = 1 and OFFSET = 0. Because VAR1’ is defined as follows: (VAR1’ output) = RATIO × (VAR1 output) + OFFSET Agilent 4155C/4156C User’s Guide Vol.2, Edition 5 1-39 Sweep Measurements Making a Measurement Figure 1-8 Sweep Setup Screen ME AS UR E : SW EEP S ETU P 01JAN29 10:58AM SINGLE * VA RI A BL E UN IT NA ME SW EE P M OD E LI N/ L OG ST AR T ST OP ST EP NO O F S TE P CO MP L IA NC E PO WE R C OM P VAR1 VAR2 SMU3:HR VD SINGLE LINEAR 0.0000 V 2.0000 V 20.0mV 101 100.00mA OFF VAR1' UN IT SMU2:HR NA ME VG OF FS ET 0.0000 V RA TI O 1.000 CO MP LIA NCE 100.00mA PO WE R C OMP OFF DOUBLE * TI MI N G HO LD TI ME 0.0000 s DE LA Y T IM E 0.0000 s *SWEEP STOP AT ANY ABNORM Status * CO NS T AN T UN IT NA ME MO DE SO UR C E - -- --- --- --- -- --- - -- - -- -- -- ---- --- -CO MP L IA NC E - -- --- --- --- -- --- - -- - -- -- -- ---- --- -SI NG LE Se le ct Sw ee p M od e w ith sof tk ey or r o ta ry kn ob. SWEEP SETUP 1-40 MEASURE SETUP OUTPUT SEQ S B PREV PAGE NEXT PAGE Agilent 4155C/4156C User’s Guide Vol.2, Edition 5 Sweep Measurements Making a Measurement Step 6. Set up the results display You set the results display information on the DISPLAY: DISPLAY SETUP screen. 1. Press Display front-panel key. The DISPLAY: DISPLAY SETUP screen appears. 2. Make sure GRAPHICS is displayed in the DISPLAY MODE field. If not, select GRAPHIC secondary softkey in the DISPLAY MODE field. 3. Set the X-, Y1-, and Y2-axes information as shown below. For the actual setup, see Figure 1-9. on Front Panel on Keyboard To enter "VG" in NAME field, select VG secondary softkey. press Shift-F3 keys. To set "LINEAR" in SCALE field, select LINEAR secondary softkey. press Shift-F1 keys. To enter "0.00000 V" in MIN field, press 0, then Enter. type 0, then press Enter. To enter "2.00000 V" in MAX field, press 2, then Enter. type 2, then press Enter. To enter "SQID" in NAME field, select MORE 1/2, then SQID secondary softkeys. press Shift-F7 keys, then Shift-F3 keys. To enter "0.00000 A" in MIN field, press 0, then Enter. type 0, then press Enter. To enter "100.000mA" in MAX field, press 1, 0, 0, m, then Enter. type 100m, then press Enter. To enter "DSQID" in NAME field, select MORE 1/2, then DSQID secondary softkeys. press Shift-F7 keys, then Shift-F4 keys. Agilent 4155C/4156C User’s Guide Vol.2, Edition 5 1-41 Sweep Measurements Making a Measurement Figure 1-9 Display Setup Screen DI SP LA Y : DI SPL AY SE TUP 01JAN29 10:58AM GRAPHICS *D I SP LA Y M OD E G R AP HI CS LIST *G R AP HI CS Xaxis Y1axis Y2axis NAME VD SQID DSQID SCALE LINEAR LINEAR LINEAR MIN 0.000000000 V 0 .00 0000 0 00 0 0.0000000000 MAX 2.0000000 V 1 00. 0000 0 00 0m 100.00000000m *G R ID ON * LI NE PARA M ET ER ON *D A TA V ARI AB LES * DA TA DISP L AY R ESO LUTI ON NORMAL GR AP HI C S Se le ct Di sp lay M ode wit h s of tke y or ro ta ry knob . DISPLAY SETUP 1-42 AN L YSI S SE T UP S B PREV PAGE NEXT PAGE Agilent 4155C/4156C User’s Guide Vol.2, Edition 5 Sweep Measurements Making a Measurement Step 7. Execute the measurement Press Single front-panel key to execute the measurement. You will get measurement results as shown in the following example: GR AP H/ L IS T: GR AP HIC S SHORT 01JAN29 10:59AM MARKER OFF () () 1 00 .m MARKER MIN/MAX 100.m SQID INTERPOLATE OFF DSQID 1 0. 0m /d iv 10.0m /div MARKER SKIP AUTO ANALYSIS 0.00 0.00 0. 0 0 VD (V) 20 0 .m / div CURSOR 2.00 OFF B AXIS Y1 MA R KER / CU R SOR LINE SCALING S DISPLAY SETUP SWEEP SETUP Agilent 4155C/4156C User’s Guide Vol.2, Edition 5 TIMING SETUP 1-43 Sweep Measurements Making a Measurement 1-44 Agilent 4155C/4156C User’s Guide Vol.2, Edition 5 2 Knob Sweep Measurements Agilent 4155C/4156C User’s Guide Vol.2, Edition 5 Knob Sweep Measurements This chapter explains how to execute knob sweep measurements. The knob sweep function is useful in the following cases: • to determine a parameter value for normal sweep • to quickly make a rough measurement of a DUT characteristics 2-2 Agilent 4155C/4156C User’s Guide Vol.2, Edition 5 Knob Sweep Measurements Measurement Functions Measurement Functions The knob sweep function allows you to easily perform real-time sweep measurements by rotating the rotary knob on the front panel. This function is useful when you want to quickly make a rough measurement of a DUT characteristic, or when you want to easily define a measurement setup for normal sweep. To start the knob sweep measurement, press the green key and then the Single front-panel key. The 4155C/4156C starts knob sweep measurement, and repeats measurements continuously until this function is stopped. You can change the measurement setups even while the measurements are being performed. When knob sweep measurements are started, the VAR1 start value and VAR1 sweep range are 0 V or 0 A. You change the sweep range from 0 to the stop value by rotating the knob. To stop the knob sweep measurements, press Stop front-panel key, or a PAGE CONTROL group key. To restart the measurement, press the following key(s): If you pressed the Stop key: Single key If you pressed a PAGE CONTROL key: green key and Single key Available units and functions Table 2-1 shows available units and functions for knob sweep measurement. Table 2-1 Available Units and Functions for Knob Sweep Measurement Output Function Output Mode Unit Meas. Mode Pulse VAR1 VAR1' VAR2 CONST STAND BY V I COMM ON V DVOLT I SMU • n.a. • • • • • • n.a. • − • VSU • n.a. • • • • − − − − − − VMU − − − − − − − − − • • − GNDU − − − • − − − • − − − − PGU − − − • • • − − • − − − • means "This is available for knob sweep measurement". n.a. means "This is not available for knob sweep measurement". − means "This is not available for this unit". Agilent 4155C/4156C User’s Guide Vol.2, Edition 5 2-3 Knob Sweep Measurements Measurement Functions Normal Sweep and Knob Sweep Measurements Table 2-2 compares the normal sweep measurement performed by measurement front-panel keys and knob sweep measurement by the front-panel knob. Table 2-2 Comparison of Sweep Measurement and Knob Sweep Measurement Item Sweep Measurement Knob Sweep Measurement Spacing of VAR1 linear or log linear Sweep Mode of VAR1 single or double single or double Number of Steps for VAR1 1 to 1001 1 to 1001 Hold Time 0 to 655.35 s 0 to 655.35 s Power Compliance available not available Measurement Ranging Mode auto, limited auto, or fixed compliance range a Standby Function available available Measurement Channel 1 to 8 ch 1 ch only Output Sequence can set can set b Trigger Function available not available Integration Time short, medium, or long 80 µs a Measurement range is automatically set according to specified compliance value. b Settings on the MEASURE: OUTPUT SEQUENCE screen also apply to knob sweep measurement. 2-4 Agilent 4155C/4156C User’s Guide Vol.2, Edition 5 Knob Sweep Measurements Measurement Functions Features of Knob Sweep Function The following are parameters that are for knob sweep measurement only or that have a different meaning or range from normal sweep measurement. LIN/LOG mode Only linear mode is available. Even if you set LOG on the MEASURE: SWEEP SETUP screen, the knob sweep is a linear sweep measurement. VAR1 Range Sweep range of VAR1 source output. If you do not set the VAR1 RANGE, the default is the stop value specified for the VAR1 channel on the MEASURE: SWEEP SETUP screen. Polarity The following sweep polarities are available for the knob sweep function of the VAR1 source. To set the polarity, select VAR1 SETUP and POLARITY softkeys. + (positive) Used to set the sweep output in the positive X direction. - (negative) Used to set the sweep output in the negative X direction. +/- (bipolar) Used to set the sweep output in both the positive and negative X directions. To increase the source absolute value, rotate the rotary knob in clockwise. To decrease the source value toward 0, rotate the rotary knob in counterclockwise. When measurement curves reach 0, the curves remain at 0 even if you continue to rotate the rotary knob counterclockwise. Agilent 4155C/4156C User’s Guide Vol.2, Edition 5 2-5 Knob Sweep Measurements Measurement Functions Step Time Step time is the time width of a sweep step as shown in the following figure. For knob sweep measurements, you cannot set the delay time. Instead, you set the step time, which you can only set on the KNOB SWEEP screen. Setup range is 0.5 ms to 100 ms, with 100 µs resolution. For normal sweep measurement, the step time depends on the measurement time. For knob sweep measurement, step time is always this specified value. Measurement Channel You select the measurement channel by selecting the Y-AXIS ASSIGN softkey on the KNOB SWEEP screen, then selecting the desired secondary softkey. You can select one measurement channel only, so the Y2 axis is not available on the KNOB SWEEP screen. • default measurement channel • When an SMU is set to VAR1 Measurement channel is the VAR1 channel. • When a VSU is set to VAR1 Measurement channel is the first found channel that can measure. Searching order is: SMU1 → . . . . . → SMU6 → VMU1 → VMU2. • restrictions If you use series resistance for VAR1 channel and VAR1 channel is V force mode, only VAR1 measurement channel can be assigned to Y axis. NOTE Measurement Resolution When performing knob sweep measurement, measurement resolution of each measurement unit is worse than the measurement resolution of normal sweep measurements. 2-6 Agilent 4155C/4156C User’s Guide Vol.2, Edition 5 Knob Sweep Measurements Measurement Functions Sweep Step Value For the VAR1 channel, you do not set the step value. You can consider the step value to be the amount you rotate the knob. Then, the sweep is performed for the specified number of steps. The STEP field on the MEASURE: SWEEP SETUP screen has no meaning. Initial value: 0, Step value automatically set: 0 to VAR1 range/number of steps. Number of Steps For the VAR1 channel, you set the number of steps on the KNOB SWEEP screen. So, for the knob sweep function, the number of steps for VAR1 has no relation to the NO OF STEP setting on the MEASURE: SWEEP SETUP screen. Start Value The start value is always 0, and does not depend on the polarity. You cannot set the start value. So, the START setting on the MEASURE: SWEEP SETUP screen has no meaning for the knob sweep function. Stop Value Stop value is always step value × number of steps. You cannot set the stop value. The measurement is continuously repeated from 0 to the stop value until the Stop front-panel key is pressed or the KNOB SWEEP screen is changed to another screen. Measurement Range If SMU is the measurement channel: Compliance range is used. That is, the measurement range is set to the lowest range that includes the compliance value that is set on the MEASURE: SWEEP SETUP screen. If VMU is the measurement channel: 20 V range is used for the grounded measurement mode, and the 2 V range is used for the differential measurement mode. Agilent 4155C/4156C User’s Guide Vol.2, Edition 5 2-7 Knob Sweep Measurements Measurement Functions KNOB SWEEP screen To start the knob sweep measurement, press the green key and then the Single front-panel key. The 4155C/4156C displays KNOB SWEEP screen, and starts measurements. To stop the knob sweep measurement, press the Stop front-panel key or a PAGE CONTROL group key. Cursor On the KNOB SWEEP screen, the long cursor is always displayed, and you cannot turn it off. In the CURSOR field, coordinate values of the cursor are displayed in X, Y order. X axis setting X axis always plots the VAR1 source value. Maximum value of X axis is the setting value of the VAR1 RANGE secondary softkey of VAR1 SETUP softkey group. Y axis setting Y axis always plots the measurement data of the measurement channel. You can select the measurement channel by using the secondary softkeys of the Y-AXIS ASSIGN softkey group. Maximum value of Y axis scale is the compliance value of the measurement channel. 2-8 Agilent 4155C/4156C User’s Guide Vol.2, Edition 5 Knob Sweep Measurements Measurement Functions Analysis of the Knob Sweep Measurement Results On the KNOB SWEEP screen, you cannot use analysis functions and user functions. But you can analyze the knob sweep measurement result by quitting knob sweep mode as shown below: 1. Select the SETUP COPY primary softkey on the KNOB SWEEP screen. 2. Press the Graph/List front-panel key. The knob sweep results are displayed on the GRAPH/LIST screen. Then you can use analysis functions. To Use User Function User function is not available for the knob sweep mode. If you want to use user functions in GRAPH/LIST screen group after the knob sweep measurements, do following before entering to the knob sweep mode: 1. Define user functions on CHANNELS: USER FUNCTION DEFINITION screen. 2. Enter user function names in DATA VARIABLES field of DISPLAY: DISPLAY SETUP screen. 3. On GRAPH/LIST: GRAPHICS screen, select DISPLAY SETUP primary softkey, then set DATA VAR softkey to ON. After getting the measurement data on the knob sweep mode, and quitting the knob sweep mode as described above, the results of user function will be displayed on the GRAPH/LIST screen. Agilent 4155C/4156C User’s Guide Vol.2, Edition 5 2-9 Knob Sweep Measurements Executing Measurements Executing Measurements You can easily execute the knob sweep measurements, as shown below: 1. Defines measurement units on the CHANNELS: CHANNEL DEFINITION screen. 2. Presses the green key, and then Single key. NOTE In the knob sweep mode, user functions and user variables are not available. See “To Use User Function” on page 2-9. To use PGU in the pulse output mode (MODE=VPULSE), set up the MEASURE: PGU SETUP screen as same as the normal sweep mode. For setting up the PGU SETUP screen, refer to Chapter 1. 2-10 Agilent 4155C/4156C User’s Guide Vol.2, Edition 5 Knob Sweep Measurements Executing Measurements To Define Measurement Units Press Chan front-panel key to define the measurement units. CHANNELS: CHANNEL DEFINITION screen is displayed. 1. MEASUREMENT MODE: Select SWEEP secondary softkey. 2. VNAME and INAME: Enter a unique name for voltage or current variable. These names must be 6 or less alphanumeric characters. First character must be alphabet character. For example, enter Vce for collector-emitter voltage. If channel does neither output nor measurement, you can omit VNAME and INAME. 3. MODE: Select one of the following softkeys to set the output mode: • V : Voltage output (for SMU, VSU, and PGU). V : Grounded mode voltage measurement (for VMU). • I : Current output (for SMU). • VPULSE : Pulsed voltage output (for PGU). • IPULSE : Not available. • COMMON : Circuit common (for SMU and GNDU). • DVOLT : Differential mode voltage measurement (for VMU). 4. FCTN: Select one of the following softkeys to set the output function: • CONST : Constant output function (for SMU, VSU, and PGU). • VAR1 : Primary sweep output function (for SMU and VSU). • VAR2 : Secondary sweep output function (for SMU and VSU). • VAR1' : Not available. To disable a unit Select DELETE ROW softkey. The settings for the unit are deleted. Agilent 4155C/4156C User’s Guide Vol.2, Edition 5 2-11 Knob Sweep Measurements Executing Measurements To Execute Measurements 1. Press the green key, then Single front-panel key. The KNOB SWEEP screen is displayed, and knob sweep measurement starts. During measurements, self-test, or forcing stress, this operation is ignored. If you want to change the Y-axis parameter, press Stop front-panel key and Y-AXIS ASSIGN primary softkey. Then select a secondary softkey for the Y-axis parameter you want. To start knob sweep measurement again, press Single front-panel key only. 2. Rotate the rotary knob to stretch or shrink the sweep range. Knob sweep measurement is executed, and measurement curve appears on the graph. Warning messages If the CHANNELS or MEASURE screen group have incorrect settings for knob sweep measurements when starting the knob sweep, a warning message is displayed, then the STOP and CONT primary softkeys are available. Select STOP softkey to know the incorrect setting. The setting is highlighted on the screen. Select CONT softkey to perform knob sweep measurement with the following settings: • If VAR1’ function (FCTN) has been set: The unit works as CONST channel. The output value is VAR1’ start value. • If VPULSE or IPULSE mode (MODE) has been set for the VAR1 or VAR2 unit: The unit works as V or I channel. • If the power compliance function (POWER COMP) has been set: The function does not work. Same as POWER COMP = OFF. 2-12 Agilent 4155C/4156C User’s Guide Vol.2, Edition 5 Knob Sweep Measurements Executing Measurements Example The following figure shows an example to set both X axis and Y axis display regions to positive. To Stop Measurement To stop the knob sweep measurement, press Stop front-panel key. This returns the 4155C/4156C operation state to the previous state. For example, if the knob sweep measurement starts from the idle state, the operation state returns to the idle state. Starting knob sweep again To start the knob sweep measurement again, press the following front-panel key: Single The knob sweep measurement will start from the point where it was stopped. Green, Single The knob sweep measurement will start from 0 V or 0 A. Agilent 4155C/4156C User’s Guide Vol.2, Edition 5 2-13 Knob Sweep Measurements Executing Measurements To Change Measurement Conditions To change the measurement conditions, use the following primary softkeys: Softkey DISPLAY SETUP Description Used to change graph display. The following secondary softkeys are available: X-AXIS REGION Selects the X-axis display range from +, −, or +/-. Y-AXIS REGION Selects the Y-axis display range from +, −, or +/-. X-AXIS DISPLAY Selects the X-axis direction from NORMAL or REVERSE. Y-AXIS DISPLAY Selects the Y-axis direction from NORMAL or REVERSE. GRID VAR1 SETUP 2-14 Sets grid on or off. Used to change VAR1 sweep source setup. The following secondary softkeys are available: SWEEP MODE Sets sweep mode to SINGLE or DOUBLE. POLARITY Sets polarity of VAR1 output to POS, NEG, or BIPOLAR. VAR1 RANGE Sets VAR1 sweep range. This sets X-axis scale. NO OF STEPS Sets number of sweep steps. COMPLIANCE Sets VAR1 compliance value. This sets Y-axis scale. HOLD TIME Sets hold time. STEP TIME Sets step time. Agilent 4155C/4156C User’s Guide Vol.2, Edition 5 Knob Sweep Measurements Executing Measurements Softkey VAR2 SETUP CONST SETUP Description Used to change VAR2 sweep source setup. The following secondary softkeys are available: VAR2 START Sets VAR2 sweep start value. VAR2 STEP Sets VAR2 sweep steps. VAR2 POINTS Sets number of sweep steps. COMPLIANCE Sets VAR2 compliance value. Used to change CONST source setup. Secondary softkeys are available for selecting CONST source. Select a secondary softkey to change the CONST source output value. To copy knob sweep setups Select SETUP COPY primary softkey. This copies knob sweep setups to the MEASURE: SWEEP SETUP and DISPLAY: DISPLAY SETUP screens. Then you can see the setups on the screens, and use the setups for the normal sweep measurement. Note that the power compliance function is not available for the knob sweep measurement. So the POWER COMP column is set to OFF. Agilent 4155C/4156C User’s Guide Vol.2, Edition 5 2-15 Knob Sweep Measurements Executing Measurements 2-16 Agilent 4155C/4156C User’s Guide Vol.2, Edition 5 3 Sampling Measurements Agilent 4155C/4156C User’s Guide Vol.2, Edition 5 Sampling Measurements This chapter explains how to execute sampling measurements, and consists of the following sections: • “Measurement Functions” • “Defining Measurement Conditions” • “Making a Measurement” For details about how to enter or input setup data, refer to Setup Screen Reference manual. 3-2 Agilent 4155C/4156C User’s Guide Vol.2, Edition 5 Sampling Measurements Measurement Functions Measurement Functions For a sampling measurement, you can monitor current or voltage changes at a DUT while forcing constant current, constant voltage, or pulsed constant bias. The 4155C/4156C provides the following three types of sampling measurement according to the sampling interval: • “Linear Sampling Measurement” • “Thinned-out Sampling Measurement” • “Linear Sampling Measurement” Available Units Available units and functions for sampling measurement are shown below: Output Function Meas. Mode Output Mode Pulse Unit VAR1 VAR1' VAR2 CONST STANDBY V I COM SMU n.a. n.a. n.a. • • • • • n.a. • • VSU n.a. n.a. n.a. • • • − − − − − VMU − − − − − − − − − • − GNDU − − − • − − − • − − − PGU − − − • • • − − • − − n.a. means "This is not available for sampling measurement". • means "This is available for sampling measurement". − means "This is not available for this unit". V I For sampling measurements, only the PGU output can be pulsed. The pulse output timing from PGU is not synchronized with the timing of sampling measurement. Agilent 4155C/4156C User’s Guide Vol.2, Edition 5 3-3 Sampling Measurements Measurement Functions Sampling Interval and Measurement Time When the sampling interval enough longer than the actual measurement time, measurement unit repeats measurement every specified sampling interval. However, if the sampling interval is less than the measurement time, measurement unit cannot repeat measurements every specified interval. For example, if the measurement time is one and a half the specified sampling interval, the interval of measurement is two times the sampling interval. See Figure 3-1 which explains the operation of the sampling measurement. Measurement time depends on the measurement condition: integration time, measurement range, and so on. So if you want to execute sampling measurement with the specified sampling interval, you need to know the actual measurement time upon your measurement setup, and set the sampling interval value enough longer than the actual measurement time. You can see typical measurement time by repeating the sampling measurements with several sampling interval settings. See “Sampling Measurement Data” on page 3-7. Measurement time is given by the following fomula: Tmeas = Tinteg + Toh where, Tmeas : Measurement time. Tinteg : Integration time. Toh : Overhead time caused by the following elements: • range changing time during measurement (when measurement ranging mode is set to auto or limited auto) • range changing time at measurement start (when using measurement range less than the compliance value) 3-4 Agilent 4155C/4156C User’s Guide Vol.2, Edition 5 Sampling Measurements Measurement Functions Figure 3-1 Sampling Measurement Operation Summary Case 1. Sampling Interval > Meas. Time SMU Output PGU Output Meas. Time Time 4 Hold Time 6 Sampling Interval 2 3 Sampling Interval 5 Trigger Trigger Trigger Sampling Interval Trigger Trigger Total Sampling Time (TOTAL SAMP. TIME) (TOTAL SAMP. TIME is one of the stop condition.) 1 Starts Sampling Case 2. Stops Sampling Sampling Interval < 7 Meas. Time SMU Output PGU Output Meas. Time Time 4 Hold Time 6 Sampling Sampling Interval Interval 2 3 Trigger 5 Trigger Trigger Sampling Interval Trigger Trigger Total Sampling Time (TOTAL SAMP. TIME) (TOTAL SAMP. TIME is one of the stop condition.) 1 Starts Sampling Agilent 4155C/4156C User’s Guide Vol.2, Edition 5 Stops Sampling 7 3-5 Sampling Measurements Measurement Functions Sampling measurement is executed as explained below: 1. Forces constant current, constant voltage, or pulsed constant bias. 2. Waits hold time. 3. Triggers one point measurement. 4. Measurement unit executes measurement. Measurement result data is stored in memory. 5. Triggers one point measurement. Interval of trigger is same as Sampling Interval. 6. (Case 1) Measurement unit executes measurement if it is ready to measure. Measurement result data is stored in memory. (Case 2) Measurement unit waits next trigger if it is busy or in measurement. 7. Repeats steps 5 and 6 until that a sampling completion condition is satisfied. In Figure 3-1, sampling measurement stops when the completion condition total sampling time is satisfied. Number of measurement data stored in memory depends on the sampling completion condition. Maximum number is specified by the NO. OF SAMPLES field of the MEASURE: SAMPLING SETUP screen. However the measurement will be immediately stopped if a sampling completion condition is satisfied before reaching the maximum number. For the sampling completion condition, see “Sampling Completion” on page 3-9. 3-6 Agilent 4155C/4156C User’s Guide Vol.2, Edition 5 Sampling Measurements Measurement Functions Sampling Measurement Data Measurement parameters of sampling measurement are set to the NAME column of the DISPLAY: DISPLAY SETUP screen. Available parameters and example parameters for the NAME field are listed in the table below: Parameter Name Meanings of Parameter @TIME Measurement start time. This is the time the measurement unit starts one point measurement. This is different from timing of the measurement trigger sent every sampling interval. @INDEX Data index. Integer. This is the index numbered to measurement data stored in memory. V1 for example, SMU1 voltage output value or measured value. I1 for example, SMU1 current output value or measured value. Measurement start time can be expressed by the following fomula. This formula is available for the measurement points before starting the discarding operation for the linear sampling or thinned-out sampling. For logarithmic sampling, this is available for the measurement points in the first decade. @TIME = Thold + Tinterval × [(@INDEX −1) + N] where, @TIME : Measurement start time. Thold : Hold time. Tinterval : Sampling interval. @INDEX : Data index. N: Number of triggers between two nearest measurement points. This value is 0 if the sampling interval is enough longer than the measurement time. Agilent 4155C/4156C User’s Guide Vol.2, Edition 5 3-7 Sampling Measurements Measurement Functions For example, if Thold=10 ms, Tinterval=5 ms, and @TIME values are as shown below, estimated measurement time is 15 ms to 20 ms, and there are 3 triggers between @INDEX=1 and @INDEX=2. • @TIME (for @INDEX=1) = 10 ms = 10 + 5 × [(1 −1) + 0] ms • @TIME (for @INDEX=2) = 30 ms = 10 + 5 × [(2 −1) + 3] ms Sampling Interval Hold Time TIME Meas.time @TIME(at @INDEX=1) @TIME(at @INDEX=2) To Use Multiple Measurement Units If you define multiple measurement parameters in the NAME column of the DISPLAY: DISPLAY SETUP screen, sampling measurement is executed by using multiple measurement units. Differences between this measurement and the measurement using only one unit are shown below: • Measurement Sequence Measurement units start measurement in the order below: • Parameters for GRAPH: X → Y1 → Y2 Parameters for LIST: Order of No. assigned for the parameters Value of @TIME @TIME stores the time the first measurement unit starts measurement. @TIME does not store the time another unit starts measurement. • Measurement Time Measurement time is sum of the measurement time by all units. To execute sampling measurement with the specified sampling interval, the sampling interval must be enough longer than the measurement time. 3-8 Agilent 4155C/4156C User’s Guide Vol.2, Edition 5 Sampling Measurements Measurement Functions Sampling Completion The sampling measurement completes when one of the following conditions is satisfied: • Stop condition The stop condition is satisfied. See below. • Total sampling time The specified total sampling time has elapsed. Available for linear and thinned-out sampling. Setting TOTAL SAMP.TIME to auto or no limit disables this sampling completion condition. • Number of sampling points The specified number of samples has elapsed. Available for logarithmic sampling. For linear sampling, setting TOTAL SAMP.TIME to auto enables this sampling completion condition. • Stop front-panel key The Stop front-panel key is pressed. • GPIB Command The 4155C/4156C receives GPIB command to stop sampling. • Emergency Condition An emergency condition occurs on the 4155C/4156C. • Interlock Open Interlock terminal opens due to high voltage. Stop Condition The stop condition is defined by using the STOP CONDITION table of MEASURE: SAMPLING SETUP screen. This function stops the measurement as shown below. 1. Compares the value of the parameter set to NAME field and the value defined in THRESHOLD field. 2. Counts how many times the selected EVENT occurs. 3. When the count reaches the value defined in EVENT NO. field, sampling is stopped immediately. Agilent 4155C/4156C User’s Guide Vol.2, Edition 5 3-9 Sampling Measurements Measurement Functions To use this function, the INITIAL INTERVAL value must be set to 2 ms or more. The INITIAL INTERVAL is the minimum resolution of the sampling interval. For details about the INITIAL INTERVAL, see “Linear Sampling Measurement” on page 3-13, “Thinned-out Sampling Measurement” on page 3-16, or “Logarithmic Sampling Measurement” on page 3-19. To set up the stop condition, specify the following parameters on the MEASURE: SAMPLING SETUP screen. Parameter Description ENABLE/ DISABLE Enables or disables the stop condition. ENABLE DELAY Delay time. in second. This is the time from starting sampling measurement to enabling this function. Allowable range: 0 to INITIAL INTERVAL × 32767 s. Resolution: INITIAL INTERVAL. NAME Name of measurement data or user function to monitor for stop condition. Val of EVENT. THRESHOLD Threshold value at which to stop sampling measurement. Th of EVENT. EVENT Event for stop condition. Val > Th True if NAME parameter value is greater than THRESHOLD value. Val < Th True if NAME parameter value is less than THRESHOLD value. |Val| > |Th| True if absolute NAME parameter value is greater than absolute THRESHOLD value. |Val| < |Th| True if absolute NAME parameter value is less than absolute THRESHOLD value. EVENT NO. 3-10 Target value of the count the event occurs (true). When the count of true is this value, sampling is immediately stopped. Allowable range: 1 to 200. Agilent 4155C/4156C User’s Guide Vol.2, Edition 5 Sampling Measurements Measurement Functions Source Output Sequence and Time Origin Source unit output sequence and the time origin depends on the setup value of the OUTPUT SEQUENCE MODE OF SAMPLING field in the MEASURE: OUTPUT SEQUENCE screen. The following two modes are available for the field. • SIMULTANEOUS mode All source unit starts output at same timing. This timing is defined as the Time Origin. See figure below. Agilent 4155C/4156C User’s Guide Vol.2, Edition 5 3-11 Sampling Measurements Measurement Functions • SEQUENTIAL mode Source units starts output in the order defined in the OUTPUT SEQUENCE table of the MEASURE: OUTPUT SEQUENCE screen. Time Origin is when the last source reaches the specified output value. See figure below. If there is pulse bias sources (PGUs), they start to force pulse base value in the order shown above, and start to force pulse bias at the Time Origin. 3-12 Agilent 4155C/4156C User’s Guide Vol.2, Edition 5 Sampling Measurements Measurement Functions Linear Sampling Measurement Linear sampling mode keeps a constant sampling interval that is the interval of measurement trigger. And if the measurement units are ready to measure, the units start measurement, and the result data is stored in memory. This is repeated until one of the sampling completion conditions is satisfied. However, if both the following two conditions occur, linear sampling mode changes the sampling interval to two times the previous sampling interval, and continues sampling measurement. • number of sampling points reaches specified NO.OF SAMPLES • sampling completion condition is not satisfied Example Operation This example assumes the following sampling setup: • INITIAL INTERVAL value is longer than the measurement time • NO.OF SAMPLES value is set to 10 • TOTAL SAMP.TIME is long (for example, 50 × INITIAL INTERVAL). Do not set to AUTO which enables the number of sampling points sampling completion condition. 1. Executes one point measurement, and stores data in memory. Repeats this 10 times every sampling interval (INITIAL INTERVAL setting value) because of the sampling interval enough longer than the measurement time. 2. If the sampling completion condition is not satisfied after 10 points measurement, linear sampling mode changes the sampling interval to two times the INITIAL INTERVAL, and continues sampling measurement. To store new measurement data, linear sampling mode discards a data every couple of nearest data as shown above. Data is updated every measurement. Agilent 4155C/4156C User’s Guide Vol.2, Edition 5 3-13 Sampling Measurements Measurement Functions 3. If the sampling completion condition is not satisfied after additional 5 points measurement, linear sampling mode changes the sampling interval to two times the previous interval, and continues sampling measurement. Measurement data is updated as described in step 2. 4. This discarding and doubling of the sampling interval is repeated until the sampling completion condition is satisfied. By the end of the measurement, 10 measurement result data is stored in memory. Parameters To set up the linear sampling measurement, specify the following parameters on MEASURE: SAMPLING SETUP screen. See Table 3-1. Parameter Description MODE Sampling mode. LINEAR. INITIAL INTERVAL The sampling interval for first NO.OF SAMPLES samples. Allowable range: 60 µs to 65.535 s. NO.OF SAMPLES Number of data to be stored by end of measurement. Maximum: 10001. If there are multiple measurement units, this value must be 10001/(number of units) or less. TOTAL SAMP.TIME Total sampling time. Does not include HOLD TIME. This is the time from the 1st trigger to the sampling completion. One of the sampling completion conditions, so sampling stops after this time elapses. • Allowable range when INITIAL INTERVAL ≤ 480 µs: AUTO • Allowable range when INITIAL INTERVAL > 480 µs: INITIAL INTERVAL × (NO.OF SAMPLES −1) sec to 1 × 10¹¹ sec, AUTO, or NO LIMIT. AUTO Enables the number of sampling points sampling completion condition. NO LIMIT Disables the total sampling time sampling completion condition 3-14 Agilent 4155C/4156C User’s Guide Vol.2, Edition 5 Sampling Measurements Measurement Functions HOLD TIME Hold time. This is the time from starting source output to first trigger. If this value is 0, first @TIME value is 0. • Allowable range when INITIAL INTERVAL ≥ 2 ms: 0 to 655.35 s with 100 µs resolution. • Allowable range when INITIAL INTERVAL < 2 ms: −30 ms to 655.35 s with 100 µs resolution. Table 3-1 Effective Parameter Values 60 µs to 480 µs INITIAL INTERVAL 560 µs to 1.92 ms NO.OF SAMPLES Max. 10001/(number of measurement units) TOTAL SAMP.TIME AUTO 2 ms to 65.535 s AUTO/NO LIMIT/ INITIAL INTERVAL × (NO.OF SAMPLES −1) s to 1 × 10¹¹ s HOLD TIME − 30 ms to 655.35 s, 100 µs resolution 0 to 655.35 s, 100 µs resolution Stop Condition DISABLE DISABLE/ENABLE Measurement Units a 1b Max. 8 c Measurement Range d FIX FIX/AUTO/LIMITED Integration Time e Short Short/Medium/Long a Number of units (SMUs or VMUs) used for measurements. b If voltage source SMU is connected to R-BOX, only this SMU can be used for the measurement. c Maximum 8 units if the 41501 is used (6 SMUs and 2 VMUs). If multiple measurement units are used, total measurement time will be more than the sum of the measurement time by all units. d If compliance value is more than the measurement range, range change when starting measurement makes long measurement time. Also if ranging mode is set to AUTO or LIMITED, range changing makes long measurement time. e Integration time is an element of the measurement time. If automatic measurement data compensation is executed, the measurement time will be more than two times the integration time. Agilent 4155C/4156C User’s Guide Vol.2, Edition 5 3-15 Sampling Measurements Measurement Functions Thinned-out Sampling Measurement Thinned-out sampling mode operates like the linear sampling mode. Difference is that the sampling interval is not changed in the thinned-out sampling measurement. So even if both the following two conditions occur, thinned-out sampling mode does not change the sampling interval, and continues sampling measurement. • number of sampling points reaches specified NO.OF SAMPLES • sampling completion condition is not satisfied Example Operation This example assumes the following sampling setup: • INITIAL INTERVAL value is longer than the measurement time • NO.OF SAMPLES value is set to 10 1. Executes one point measurement, and stores data in memory. Repeats this 10 times every sampling interval (INITIAL INTERVAL setting value) because of the sampling interval enough longer than the measurement time. 2. If the sampling completion condition is not satisfied after 10 points measurement, thinned-out sampling mode keeps the sampling interval, and continues sampling measurement. To store new measurement data, thinned-out sampling mode discards a data every couple of nearest data as shown above. Data is updated every measurement. 3-16 Agilent 4155C/4156C User’s Guide Vol.2, Edition 5 Sampling Measurements Measurement Functions 3. If the sampling completion condition is not satisfied after additional 5 points measurement, thinned-out sampling mode keeps the sampling interval, and continues sampling measurement. Data is updated as described in step 2. 4. This discarding is repeated until the sampling completion condition is satisfied. By the end of the measurement, 10 measurement result data is stored in memory. Parameters To set up the thinned-out sampling measurement, specify the following parameters on MEASURE: SAMPLING SETUP screen. See Table 3-2. Parameter Description MODE Sampling mode. THINNED OUT. INITIAL INTERVAL The sampling interval during thinned-out sampling. Allowable range: 720 µs to 65.535 s. NO.OF SAMPLES Number of data to be stored by end of measurement. Maximum: 10001. If there are multiple measurement units, this value must be 10001/(number of units) or less. TOTAL SAMP.TIME Total sampling time. Does not include HOLD TIME. This is the time from the 1st trigger to the sampling completion. One of the sampling completion conditions, so sampling stops after this time elapses. Allowable range: NO LIMIT, or INITIAL INTERVAL × (NO.OF SAMPLES −1) sec to 1 × 10¹¹ sec NO LIMIT Disables the total sampling time sampling completion condition HOLD TIME Hold time. This is the time from starting source output to first trigger. If this value is 0, first @TIME value is 0. • Allowable range when INITIAL INTERVAL ≥ 2 ms: 0 to 655.35 s with 100 µs resolution. • Allowable range when INITIAL INTERVAL < 2 ms: −30 ms to 655.35 s with 100 µs resolution. Agilent 4155C/4156C User’s Guide Vol.2, Edition 5 3-17 Sampling Measurements Measurement Functions Table 3-2 Effective Parameter Values 720 µs to 1.92 ms INITIAL INTERVAL 2 ms to 65.535 s NO.OF SAMPLES Max. 10001/(number of measurement units) TOTAL SAMP.TIME NO LIMIT/ INITIAL INTERVAL × (NO.OF SAMPLES −1) s to 1 × 10¹¹ s HOLD TIME − 30 ms to 655.35 s, 100 µs resolution 0 to 655.35 s, 100 µs resolution Stop Condition DISABLE DISABLE/ENABLE Measurement Units a 1b Max. 8 c Measurement Range d FIX FIX/AUTO/LIMITED Integration Time e Short Short/Medium/Long a Number of units (SMUs or VMUs) used for measurements. b If voltage source SMU is connected to R-BOX, only this SMU can be used for the measurement. c Maximum 8 units if the 41501 is used (6 SMUs and 2 VMUs). If multiple measurement units are used, total measurement time will be more than the sum of the measurement time by all units. d If compliance value is more than the measurement range, range change when starting measurement makes long measurement time. Also if ranging mode is set to AUTO or LIMITED, range changing makes long measurement time. e Integration time is an element of the measurement time. If automatic measurement data compensation is executed, the measurement time will be more than two times the integration time. 3-18 Agilent 4155C/4156C User’s Guide Vol.2, Edition 5 Sampling Measurements Measurement Functions Logarithmic Sampling Measurement Logarithmic sampling mode plots the measurement data on the X-axis (@TIME) set to the logarithmic scale by doing the following operation. See Figure 3-2. 1. Forces constant current, constant voltage, or pulsed constant bias. 2. Waits hold time. 3. Triggers one point measurement. 4. Measurement unit executes measurement. Measurement result data is stored in memory. 5. Triggers one point measurement. Interval of trigger is constant (setting value of INITIAL INTERVAL). 6. Measurement unit executes measurement if it is ready to measure. Measurement result data is stored in memory. Measurement unit waits next trigger if it is busy or in measurement. 7. Repeats steps 5 and 6 until that a sampling completion condition is satisfied. Logarithmic sampling mode retains only the measurement data that can plot the data on the logarithmic X-axis in almost the same interval. Figure 3-2 Example Operation of Logarithmic Sampling Starts Sampling Hold Time 2 Sampling Interval Discard 3 5 Data of second decade Data of first decade 1 4 TIME 6 Measurement 7 1/10 decade This is the example to plot LOG10 data. @TIME First decade Second decade Agilent 4155C/4156C User’s Guide Vol.2, Edition 5 3-19 Sampling Measurements Measurement Functions @TIME Value @TIME value of measurement data is determined by MODE, INITIAL INTERVAL, NO. OF SAMPLES, and HOLD TIME parameters. Where MODE decides number of measurement points in 1 decades. For example, LOG10 mode obtains 10 data per 1 decade. An example to get measurement data in logarithmic sampling measurement is explained below. This example assumes the following settings. See also Figure 3-2. • • • • • MODE = LOG10 (10 data / 1 decade) INITIAL INTERVAL = 10 ms NO.OF SAMPLES = 20 HOLD TIME = 10 ms STOP CONDITION = DISABLE If sampling interval is enough longer than measurement time: INITIAL INTERVAL value decides the range of a decade. 10 ms to 100 ms (1st decade) Sampling is executed at the following @TIME value: 10 ms, 20 ms, 30 ms, 40 ms, 50 ms, 60 ms, 70 ms, 80 ms, 90 ms, 100 ms. LOG10 mode allows to have 10 data in 1 decade. Therefore all measurement data is stored in memory. 100 ms to 1 s There are 90 sampling points in this range. Number of data can remain is only 10. They can plot the data on the X-axis in almost the same interval. @TIME values are as follows: 140 ms, 170 ms, 210 ms, 270 ms, 330 ms, 410 ms, 520 ms, 650 ms, 810 ms, 1.02 s. If sampling interval is less than measurement time: Measurement time decides the range of a decade. If the measurement time is 18 ms, interval of measurement is 20 ms, and the following data are stored in memory: 20 ms to 200 ms (1st decade) Sampling is executed at the following @TIME value: 20 ms, 40 ms, 60 ms, 80 ms, 100 ms, 120 ms, 140 ms, 160 ms, 180 ms, 200 ms. LOG10 mode allows to have 10 data in 1 decade. Therefore all data is stored in memory. 200 ms to 2 s There are 90 sampling points in this range. Number of data can remain is only 10. They can plot the data on the X-axis in almost the same interval. 3-20 Agilent 4155C/4156C User’s Guide Vol.2, Edition 5 Sampling Measurements Measurement Functions Rule to determine @TIME: @TIME value is determined by the following rule. Data measured at @TIME=Tlog are stored in memory. Tlog ≥ Ttarget | Tlog −Ttarget | < | Ttarget −Tprev | where, Tlog Data stored in @TIME. Actual measurement point. Ttarget Target value of @TIME. The values can plot data on the logarithmic X-axis in the same interval completely. Tprev Tlog −sampling interval. Actual measurement point. Discard Tprev Tlog Stored in @TIME Sampling Interval Ttarget < Tlog Ttarget A A > B B TIME Measurement A= | Ttarget −Tprev | B = | Tlog −Ttarget | Agilent 4155C/4156C User’s Guide Vol.2, Edition 5 3-21 Sampling Measurements Measurement Functions Parameters To set up the logarithmic sampling measurement, specify the following parameters on MEASURE: SAMPLING SETUP screen. See Table 3-3. Parameter Description MODE Sampling mode. LOG10, LOG25, or LOG50. INITIAL INTERVAL MODE Number of data in 1 decade LOG10 LOG25 LOG50 10 25 50 The sampling interval during logarithmic sampling. Allowable range: 560 µs to 65.535 s. If this value is 560 µs to 10 ms, number of measurement data may be less than the specified number of data for top 2 decades. Then sampling continues to get all samples. NO.OF SAMPLES Number of data to be stored by end of measurement. One of the sampling completion conditions, so sampling stops after this point elapses. Maximum 11 decades. MODE LOG10 LOG25 LOG50 HOLD TIME Maximum value 111 276 551 Hold time. This is the time from starting source output to first trigger. If this value is 0, first @TIME value is 0. • Allowable range when INITIAL INTERVAL ≥ 2 ms: 0 to 655.35 s with 100 µs resolution. • Allowable range when INITIAL INTERVAL < 2 ms: −30 ms to 655.35 s with 100 µs resolution. Example: HOLD TIME=1.003 s, and measurement interval is 3 ms, decade and its range are as shown below: decade 1st decade 2nd decade 3rd decade 4th decade 5th decade 3-22 Range ( in sec ) 1.003 to 1.030 ( 3 m +1 to 30 m +1 ) 1.030 to 1.300 ( 30 m +1 to 300 m +1 ) 1.300 to 4.00 ( 300 m +1 to 3+1 ) 4 to 31 ( 3+1 to 30+1 ) 31 to 301 ( 30+1 to 300+1 ) Agilent 4155C/4156C User’s Guide Vol.2, Edition 5 Sampling Measurements Measurement Functions Table 3-3 Effective Parameter Values 560 µs to 1.92 ms INITIAL INTERVAL 2 ms to 65.535 s NO.OF SAMPLES Maximum 111 (LOG10), 276 (LOG25), 551 (LOG50) HOLD TIME − 30 ms to 655.35 s, 100 µs resolution 0 to 655.35 s, 100 µs resolution Stop Condition DISABLE DISABLE/ENABLE Measurement Units a 1b Max. 8 c Measurement Range d FIX FIX/AUTO/LIMITED Integration Time e Short Short/Medium/Long a Number of units (SMUs or VMUs) used for measurements. b If voltage source SMU is connected to R-BOX, only this SMU can be used for the measurement. c Maximum 8 units if the 41501 is used (6 SMUs and 2 VMUs). If multiple measurement units are used, total measurement time will be more than the sum of the measurement time by all units. d If compliance value is more than the measurement range, range change when starting measurement makes long measurement time. Also if ranging mode is set to AUTO or LIMITED, range changing makes long measurement time. e Integration time is an element of the measurement time. If automatic measurement data compensation is executed, the measurement time will be more than two times the integration time. Agilent 4155C/4156C User’s Guide Vol.2, Edition 5 3-23 Sampling Measurements Defining Measurement Conditions Defining Measurement Conditions This section covers the tasks for sampling measurements. The basic procedure to test your DUT is as follows: 1 Connecting your DUT to the 4155C/4156C. See Chapter 10 for procedures. 2 C HAN NE LS: CH ANN EL DE FIN IT ION 00 DEC 07 02 :18 PM * ME ASU REM ENT M ODE SA MPL ING * CH ANN ELS MEA SU RE U NIT S TBY VN AM E IN AM E SM U1: MP VB IB CO MMO N C ONS T SM U2: MP VG IG I M ODE S ERI ES F CTN CHA NNE L ASS IGN R ESI ST ANC E 0 oh m C ONS T SM U3: MP SM U4: MP SM U5: HP 0 oh m VS U1 -- -- --- VS U2 -- -- --- VM U1 -- -- --- - --- - - --- VM U2 -- -- --- - --- - - --- PG U1 -- -- --- PG U2 -- -- --- GN DU -- -- --- Defining measurement mode and measurement units that you use to make measurement. See “To Define Measurement Units” on page 3-26. For the user function, standby function, and R-Box, see Chapter 8. DIS CHA RGE ON - --- DEL ETE ROW VB B E nte r Vol tag e N am e. (ma x 6 c har s.) CHA NNE L U SER US ER NEX T DEF F CTN VA R PAG E 3 M EA SU RE : S AM PL ING S E TUP 00 DEC 07 0 2:1 8P M LI NE AR * SA MP LIN G PA RAM ET E R M OD E * ST OP CO ND ITI ON T HIN NE D- OUT I NI TI AL IN TE RVA L N O. O F S AM PL ES 2.0 0m s NA ME T OT AL SA MP . TIM E N O L IM IT 0.0 00 00 0 s F IL TE R LO G1 0 EN ABL E/ DI SAB LE EN AB LE EN ABL E DE LAY 20 H OL D TIM E TH RES HO LD 9 00 .0 000 0m V EV ENT Va l > Th S MU2 :M P IG M OD E I “To Set up Sampling Parameters” EV ENT N O. 3 LO G5 0 • “To Set up Constant Output” TH IN NED OU T • “To Set up PGU Output” • “To Define Stop Conditions” LO G2 5 *C ON ST ANT N AM E • 0 .0 00 000 0 s VG ON U NI T Setting the source parameters of the units. The following tasks are described: S OU RC E 500 .0 n A -- -- --- -- - --- -- -- - - -- --- -- - C OM PL IAN CE 1.0 00 0 V -- -- --- -- - --- -- -- - - -- --- -- - T HI NN ED -OU T B S el ec t Sam pl in g M od e wi th s oft ke y or ro ta ry kn ob. SA MPL NG M E ASU RE OU TP UT P REV NE XT SE TUP S E TUP SE Q P AGE PA GE 3-24 Agilent 4155C/4156C User’s Guide Vol.2, Edition 5 Sampling Measurements Defining Measurement Conditions 4 D IS PL AY : D IS PL AY SE T UP 00 DEC 07 0 2:1 8P M GR AP HIC S * DI SPL AY M ODE Setting the display mode to show measurement results. The following tasks are described: GR APH IC S LI ST * GR APH IC S NA ME X ax is Y 1ax is @ TI ME VG SC ALE L IN EAR Y2a xi s • “To Display Graphics Results” • “To Display List Results” L INE AR MI N 0. 000 00 0 000 s 0.0 00 00 000 0 V MA X 20 0.0 0m s 1.0 00 00 0 V * GR ID *L INE P AR AME TE R ON ON * DA TA VA RI ABL ES @I NDE X * DA TA DI SP LA Y RES OLU TI ON NO RM AL G RA PH IC S B S el ec t Dis pl ay Mo de wit h so ftk ey o r r ot ar y k no b. DI SPL AY AN LY SI S P REV NE XT SE TUP SE TU P P AGE PA GE 5 Executing the measurement. See “To Execute or Stop Measurement” on page 3-35. For the self-calibration and zero offset cancel function, see Chapter 7. 6 G RA PH /L IST : GR APH IC S SH OR T Results. For example, displayed graphically. 00 DEC 07 0 4:5 2P M MA RK ER MARKER( 196ms @INDEX 921.20mV 20 ) ON (V) MA RK ER MI N/ MAX 1.00 o IN TE RP OL ATE OFF VG DI RE CT MA RK ER/ CU RS OR 100.m /div MA RK ER SK IP AU TO AN AL YSI S 0.00 0.00 @TIME (s) 20.0m /div CU RS OR 200.m OFF B MA RK ER / CU RS OR L I NE SC AL ING D IS PL AY SA MP LN G S TOP CO NS T S ET UP SE TU P C OND SE TU P Agilent 4155C/4156C User’s Guide Vol.2, Edition 5 3-25 Sampling Measurements Defining Measurement Conditions To Define Measurement Units 1. Press Chan key in the PAGE CONTROL key group. 2. Select CHANNEL DEF primary softkey. 3. In the MEASUREMENT MODE area, select SAMPLING secondary softkey. 4. In the VNAME column, enter a unique name for voltage variable. For example, enter Vce for collector-emitter voltage. If channel does neither V force nor V measurement, you can omit VNAME. 5. In the INAME column, enter a unique name for current variable. For example, enter "Ic" for collector current. If channel does neither I force nor I measurement, you can omit INAME. 6. In the MODE column, select the following softkey: • V : voltage output (for SMU, VSU, and PGU). V : grounded mode voltage measurement (for VMU). • I : current output (for SMU). • VPULSE : pulsed voltage output (for PGU). • COMMON : circuit common (for SMU and GNDU). • DVOLT : differential mode voltage measurement (for VMU). 7. In the FCTN column, select CONST secondary softkey for all source units. 8. In the DISCHARGE field, select ON secondary softkey to connect the discharge resistor to VMU input, or OFF to disconnect the resistor. The discharge resistor is used to prevent the VMU inputs from charge up in the idle state. When DISCHARGE is ON, the discharge resistor is automatically connected to the VMU input, and disconnected from the input in the measurement state. VNAME and INAME You can use VNAME and INAME in user function definitions or for analysis on the GRAPHICS/LIST screens. These names must be 6 or less alphanumeric characters. First character must be alphabet character. To disable a unit Move the pointer to the row of the unit, then select the DELETE ROW secondary softkey. The settings in the row are deleted. 3-26 Agilent 4155C/4156C User’s Guide Vol.2, Edition 5 Sampling Measurements Defining Measurement Conditions To Set up Sampling Parameters 1. Confirm that SAMPLING is set in the MEASUREMENT MODE field on the CHANNELS: CHANNEL DEFINITION screen. If SAMPLING is not set, select SAMPLING secondary softkey in the MEASUREMENT MODE field. 2. Press Meas key in the PAGE CONTROL key group. 3. Select SAMPLING SETUP primary softkey. 4. In the MODE field of SAMPLING PARAMETER, select: • LINEAR secondary softkey for equally spaced sampling intervals. • LOG XX secondary softkey for logarithmically spaced sampling intervals. XX is 10, 25, or 50 sampling points per decade. • THINNED-OUT secondary softkey for reduced sampling interval of more recent samples (by thinning less recent samples). 5. In the INITIAL INTERVAL field, enter a value for the first sampling interval. 6. In the NO. OF SAMPLES field, enter the number of points at which to sample. 7. If you select LINEAR or THINNED-OUT in MODE field, set the TOTAL SAMP. TIME (total sampling time) which specifies the time from the start of sampling to the end. This field is not available for the logarithmic sampling. In the TOTAL SAMP. TIME field, enter a value or select: • NO LIMIT secondary softkey for excluding the total sampling time from the sampling completion conditions. • AUTO secondary softkey for excluding the total sampling time from the sampling completion conditions, and including the number of samples to the completion conditions. This softkey is available only for the linear sampling. For details about sampling completion conditions, see “To Define Stop Conditions” on page 3-32. Agilent 4155C/4156C User’s Guide Vol.2, Edition 5 3-27 Sampling Measurements Defining Measurement Conditions The following figure shows the relation between the sampling parameters and sampling measurement. You can set a hold time by entering a number (units: seconds) in the HOLD TIME field. 3-28 Agilent 4155C/4156C User’s Guide Vol.2, Edition 5 Sampling Measurements Defining Measurement Conditions To Set up Constant Output 1. Define CONST units as described in “To Define Measurement Units” on page 3-26. 2. Press Meas key in the PAGE CONTROL key group. 3. Select SAMPLNG SETUP primary softkey. 4. In the SOURCE field of the desired unit in the CONSTANT area, enter the desired output value. To modify the UNIT, NAME, and MODE field Modify the UNIT, NAME, and MODE fields on the CHANNELS: CHANNEL DEFINITION screen. To set up compliance value for constant output Set desired value in the COMPLIANCE field of the CONSTANT table. Agilent 4155C/4156C User’s Guide Vol.2, Edition 5 3-29 Sampling Measurements Defining Measurement Conditions To Set up PGU Output 1. Define PGU to be VPULSE and CONST as described in “To Define Measurement Units” on page 3-26. 2. Press Meas key in the PAGE CONTROL key group. 3. Select PGU SETUP primary softkey. 4. In the PERIOD field of PGU1, enter the pulse period value. 5. In the WIDTH field of desired PGU column, enter the pulse width value. 6. In the DELAY TIME field of desired PGU column, enter delay time value. 7. In the PEAK VALUE field of desired PGU column, enter pulse peak value. 8. In the BASE VALUE field of desired PGU column, enter pulse base value. 9. In the LEADING TIME field of desired PGU column, enter the leading-edge transition time. 10. In the TRAILING TIME field of desired PGU column, enter the trailing-edge transition time. 11. In the IMPEDANCE field of desired PGU column, select: • LOW secondary softkey for approximately zero ohm output impedance. • 50 ohm secondary softkey for 50 ohm output impedance. 12. In the PULSE COUNT field, do one of the following: • Select FREE RUN secondary softkey to force the pulse continuously. • Or enter the number of pulses to output (for sampling measurement only). For the pulse period and pulse count values, the values you set for PGU1 are also used for PGU2. The following figure shows the relation between pulse waveform and setup parameters. 3-30 Agilent 4155C/4156C User’s Guide Vol.2, Edition 5 Sampling Measurements Defining Measurement Conditions To modify the UNIT and NAME fields Modify the UNIT and NAME fields on the CHANNELS: CHANNEL DEFINITION screen. Using PGUs as constant voltage source To use a PGU as a constant voltage source, set the desired PGU as follows: • V in MODE column on the CHANNEL DEFINITION screen • Desired output voltage value in SOURCE field on MEASURE: PGU SETUP screen. Agilent 4155C/4156C User’s Guide Vol.2, Edition 5 3-31 Sampling Measurements Defining Measurement Conditions To Define Stop Conditions The measurement stop condition defines the condition to stop the sampling measurement. The stop condition is one of the sampling completion conditions. 1. Press Meas key in the PAGE CONTROL key group. 2. Select SAMPLNG SETUP primary softkey. 3. In the ENABLE/DISABLE field of the STOP CONDITION area, select ENABLE secondary softkey. 4. In NAME field of STOP CONDITION area, select the secondary softkey for the desired variable name or user function name to be used for EVENT comparison. 5. In THRESHOLD field of STOP CONDITION area, enter the threshold value for the name selected in the previous step. 6. In EVENT field of STOP CONDITION area, select: • Val > Th secondary softkey to stop the sampling when the sampled value is greater than the threshold value. • Val < Th secondary softkey to stop the sampling when the sampled value is less than the threshold value. • |Val| > |Th| secondary softkey to stop the sampling when the absolute sampled value is greater than the absolute threshold value. • |Val| < |Th| secondary softkey to stop the sampling when the absolute sampled value is less than the absolute threshold value. 7. In EVENT NO. field, enter a value which specifies the sampling to stop when EVENT occurs EVENT NO. times. If you select DISABLE in the ENABLE/DISABLE field, the sampling measurement continues until: • Stop • Specified total sample time has elapsed. • The 4155C/4156C receives GPIB command to stop sampling. • An emergency condition occurs on the 4155C/4156C. • Interlock terminal opens due to high voltage. 3-32 key in the MEASUREMENT key group is pressed. Agilent 4155C/4156C User’s Guide Vol.2, Edition 5 Sampling Measurements Defining Measurement Conditions To Display Graphics Results 1. Press Display key in the PAGE CONTROL key group. 2. Select DISPLAY SETUP primary softkey. 3. In the DISPLAY MODE field, select GRAPHICS secondary softkey. 4. In the X axis column, enter variable name, select axis scale, and enter minimum and maximum values. In the sampling mode, @TIME (time) is entered initially. 5. In the Y1 axis column, enter variable name, select axis scale, and enter minimum and maximum values. 6. If you use Y2 axis, enter variable name, select axis scale, and enter minimum and maximum values in Y2 axis column. When the pointer is in the NAME row, the allowable variable names appear in the secondary softkey area. To set a variable name, select the desired secondary softkey. The allowable names are names that you already set up on the CHANNEL DEFINITION, USER FUNCTION, and USER VARIABLE screens. To display a grid on the plotting area In the GRID field, select ON to display or OFF to not display. To display line parameters on the plotting area In the LINE PARAMETER field, select ON to display or OFF to not display. Line parameters are the X and Y intercepts and gradient of the analysis lines. To display variables on the data variable area In the DATA VARIABLES fields, select secondary softkey for desired variable. Up to 2 variables can be displayed on the data variable area which is located between the graph area and the marker area. To change resolution of the data to be displayed In the DATA DISPLAY RESOLUTION field, select NORMAL for the resolution shown in the specifications, or EXTEND for the ADC full scale resolution. For example, the data display resolution is 1 fA in NORMAL mode, and 10 aA in EXTEND mode for 10 pA measurement range. Agilent 4155C/4156C User’s Guide Vol.2, Edition 5 3-33 Sampling Measurements Defining Measurement Conditions To Display List Results 1. Press Display key in the PAGE CONTROL key group. 2. Select DISPLAY SETUP primary softkey. 3. In the DISPLAY MODE field, select LIST secondary softkey. 4. In the LIST area, select the secondary softkey of the variables for which you want to list the measurement results. When the pointer is in the NAME row, the allowable variable names appear in the secondary softkey area. To set a variable name, select the desired secondary softkey. The allowable names are names that you already set up on CHANNEL DEFINITION, USER FUNCTION, and USER VARIABLE screens. To set up variable to be displayed on the LIST screen In the DATA VARIABLES fields, select secondary softkey for desired variable. Up to 2 variables can be displayed on the data variable area which is located below the list area. To change resolution of the data to be displayed In the DATA DISPLAY RESOLUTION field, select NORMAL for the resolution shown in the specifications, or EXTEND for the ADC full scale resolution. For example, the data display resolution is 1 fA in NORMAL mode, and 10 aA in EXTEND mode for 10 pA measurement range. 3-34 Agilent 4155C/4156C User’s Guide Vol.2, Edition 5 Sampling Measurements Defining Measurement Conditions To Execute or Stop Measurement • • To execute a measurement, press: key in the MEASUREMENT key group for single measurement. • Single • Repeat • Append key in the MEASUREMENT key group for repeat measurement. key in the MEASUREMENT key group for append measurement. To stop a measurement, press Stop key in the MEASUREMENT key group. Single, Repeat, and Append Measurement There are three measurement execution modes as follows: Single measurement Repeat measurement Append measurement Clears GRAPHICS or LIST screen, then executes measurement one time. Measurement results are displayed on GRAPHICS or LIST screen. Executes measurements continuously. Before each measurement is executed, the GRAPHICS or LIST screen is cleared. Most recent measurement results are displayed on GRAPHICS or LIST screen. Executes measurement one time. Does not clear GRAPHICS or LIST screen. That is, measurement results are added to the existing results. Agilent 4155C/4156C User’s Guide Vol.2, Edition 5 3-35 Sampling Measurements Making a Measurement Making a Measurement In this section, you learn how to execute the sampling measurements using the 4155C/4156C. As an example, you measure charge voltage of capacitor. Measurement circuit and typical characteristics are shown below: Charge Voltage V SMU2 DUT SMU1 Time NOTE For accurate measurements, allow the 4155C/4156C to warm-up for a minimum of 40 minutes after you turn on the instrument, and then execute calibration. For the self-calibration, see Chapter 7. Step 1. Prepare for the measurement Before executing measurement, configure the 4155C/4156C and Agilent 16442A Test Fixture. See “Step 1. Prepare for the measurement” in “Making a Measurement” in Chapter 1. The sampling measurement example uses the connection same as the sweep measurement example connection. Step 2. Mount your DUT on the test fixture 1. Select a suitable socket module for your DUT (capacitor). 2. Mount the socket module on the test fixture. 3. Mount the capacitor on the socket module. 4. Make connections with connection wires (miniature banana to pin plug etc.). The capacitor must be connected between SMU1 and SMU2. 5. After finishing connections, shut the lid of the test fixture. 3-36 Agilent 4155C/4156C User’s Guide Vol.2, Edition 5 Sampling Measurements Making a Measurement Step 3. Define the channel assignments You set the connection information on the CHANNELS: CHANNEL DEFINITION screen. 1. If the 4155C/4156C has turned off, turn on the 4155C/4156C. And wait until the self-test is completed. 2. Make sure that CHANNELS: CHANNEL DEFINITION screen appears on the screen of the 4155C/4156C. If not, press Chan front-panel key. 3. Move the field pointer to the MEASUREMENT MODE field, then select the SAMPLING softkey to set the 4155C/4156C to the sampling measurement mode. 4. Move the field pointer to the CHANNELS table, and set SMU1 and SMU2 as shown below. UNIT VNAME INAME MODE FCTN SMU1 VB IB COMMON CONST SMU2 VG IG I CONST Only the SMU1 and SMU2 are used for this example measurement. Disable other units by selecting the DELETE ROW softkey. CHANNELS: CHANNEL DEFINITION 00DEC07 02:18PM * M E A S U R E M E N T M OD E SAMPLING *CHANNELS MEASURE UNIT STBY VNAME INAME SMU1:MP VB IB COMMON CONST MODE FCTN SMU2:MP VG IG I SERIES RESISTANCE 0 ohm CHANNEL ASSIGN CONST SMU3:MP SMU4:MP SMU5:HP 0 ohm VSU1 ------- VSU2 ------- VMU1 ------- ----- ---- VMU2 ------- ----- ---- PGU1 ------- PGU2 ------- GNDU ------- DISCHARGE ON ---- DELETE ROW VB E n t e r V o l t a g e N a m e. ( m a x 6 c h a r s . ) B CHANNEL USER USER NEXT DEF FCTN VAR PAGE Agilent 4155C/4156C User’s Guide Vol.2, Edition 5 3-37 Sampling Measurements Making a Measurement Step 4. Set up the measurement parameters You set the output parameters on the MEASURE: SAMPLING SETUP screen. The following setup is to force 500 nA to 0.1 µF capacitor as an example. 1. Press Meas front-panel key. The MEASURE: SAMPLING SETUP screen appears. 2. Set the SAMPLING PARAMETER table as shown below: MODE THINNED-OUT INITIAL INTERVAL 2.00 ms NO. OF SAMPLES 20 TOTAL SAMP. TIME NO LIMIT This setup is to repeat one point measurement in 2 ms interval until the stop condition is satisfied, and to hold the result data for 20 measurement points. The stop condition is defined in the next step. 3. Set the STOP CONDITION table as shown below: ENABLE/DISABLE ENABLE ENABLE DELAY 0s NAME VG THRESHOLD 900 mV EVENT Val > Th EVENT NO. 3 This setup enables the stop condition which stops sampling when detects 3 measurement data that the VG value overs 900 mV. 3-38 Agilent 4155C/4156C User’s Guide Vol.2, Edition 5 Sampling Measurements Making a Measurement 4. Set the CONSTANT table as shown below: UNIT SMU2 : MP NAME IG MODE I SOURCE 500 nA COMPLIANCE 1V This setup is to force a constant current of 500 nA. MEASURE: SAMPLING SETUP 00DEC07 02:18PM LINEAR * S A M P L I N G P A R A M ET E R MODE *STOP CONDITION THINNED-OUT INITIAL INTERVAL NO. OF SAMPLES 2.00ms ENABLE DELAY 20 NAME TOTAL SAMP. TIME NO LIMIT HOLD TIME 0.000000 s FILTER LOG10 ENABLE/DISABLE ENABLE 0.0000000 s VG THRESHOLD 900.00000mV EVENT Val > Th EVENT NO. 3 LOG25 LOG50 ON *CONSTANT UNIT S M U 2 :M P NAME IG MODE I THINNED OUT SOURCE 5 0 0 .0 n A COMPLIANCE 1 . 0 00 0 V - - - - - - - - - - - - - - - - - - - - - - - - - - - --------- --------- --------- THINNED-OUT B S e l e c t S a m p l i n g M od e w i t h s o f t k e y o r r o t a r y k n o b . SAMPLNG MEASURE OUTPUT PREV NEXT SETUP SETUP SEQ PAGE PAGE 5. In addition to the SAMPLING SETUP screen, you may need to set the MEASURE SETUP screen to obtain 2 ms sampling interval. Do following: a. Select the MEASURE SETUP primary softkey to change the screen. b. Move the field pointer to the RANGE field of SMU2. c. Set RANGE field to FIXED and 2 V by using the FIXED and 2 V secondary softkeys. Agilent 4155C/4156C User’s Guide Vol.2, Edition 5 3-39 Sampling Measurements Making a Measurement Step 5. Set up the results display You set the results display information on the DISPLAY: DISPLAY SETUP screen. 1. Press Display front-panel key. The DISPLAY: DISPLAY SETUP screen appears. 2. Move the field pointer to the DISPLAY MODE field. Then select GRAPHICS softkey to set the results display mode to the graph mode. 3. Set the X and Y1 axes information as shown below: X-axis Y1-axis NAME @TIME VG SCALE LINEAR LINEAR MIN 0s 0V MAX 200 ms 1V This setup is to assign X-axis to time, and Y1-axis to VG. 4. Move the field pointer to the DATA VARIABLES field. Then select the @INDEX softkey to display the data index above graph in the results display screen (GRAPH/LIST: GRAPHICS screen). D I S P L A Y : D I S P L A Y SE T U P 00DEC07 02:18PM GRAPHICS *DISPLAY MODE GRAPHICS LIST *GRAPHICS NAME Xaxis Y1axis @TIME VG SCALE LINEAR MIN 0 . 0 0 0 00 0 0 0 0 s 0.000000000 V MAX 2 0 0 . 0 0m s 1.000000 V *GRID Y2axis LINEAR *LINE PARAMETER ON ON * D A T A V A R I A B L ES @INDEX * D A T A D I S P L A Y RE S O L U T I O N NORMAL GRAPHICS B S e l e c t D i s p l a y M o de w i t h s o f t k e y o r r o t a r y k n o b . 3-40 DISPLAY ANLYSIS PREV NEXT SETUP SETUP PAGE PAGE Agilent 4155C/4156C User’s Guide Vol.2, Edition 5 Sampling Measurements Making a Measurement Step 6. Execute the measurement Press Single front-panel key to execute the measurement. The 4155C/4156C starts the thinned-out sampling measurement, and repeats one point measurement until the stop condition is satisfied, then stops the sampling. After the sampling measurement, You will get measurement results as shown in the following example: GRAPH/LIST: GRAPHICS SHORT 00DEC07 04:52PM MARKER MARKER( 196ms @INDEX 921.20mV 20 ) ON (V) MARKER MIN/MAX 1.00 o INTERPOLATE OFF VG DIRECT MARKER/ CURSOR 100.m /div MARKER SKIP AUTO ANALYSIS 0.00 0.00 @TIME (s) 20.0m /div CURSOR 200.m OFF B MARKER/ CURSOR LINE SCALING DISPLAY SAMPLNG STOP CONST SETUP SETUP COND SETUP Agilent 4155C/4156C User’s Guide Vol.2, Edition 5 3-41 Sampling Measurements Making a Measurement If you change the results display to the GRAPH/LIST: LIST screen, you will see the screen as shown below: GRAPH/LIST: LIST SHORT 00DEC07 04:52PM MARKER @TIME = NO. 1/ 0.0000 s to @TIME 1 VG s V 6 160ms 754.96mV 7 164ms 773.46mV 8 168ms 791.98mV 9 172ms 810.44mV 10 176ms 828.90mV 11 178ms 838.18mV 12 180ms 847.42mV 13 182ms 856.66mV 14 184ms 865.88mV 15 186ms 875.12mV 16 188ms 884.30mV 17 190ms 893.50mV 18 192ms 902.76mV 19 194ms 911.92mV 20 196ms 921.20mV @INDEX ON 196ms DIRECT MARKER MARKER SKIP NEXT APPEND 20 B MARKER SPREAD SHEET 3-42 RESETUP SAMPLNG STOP CONST SETUP COND SETUP Agilent 4155C/4156C User’s Guide Vol.2, Edition 5 4 Quasi-static C-V Measurements Agilent 4155C/4156C User’s Guide Vol.2, Edition 5 Quasi-static C-V Measurements This chapter consists of the following sections which explains how to execute quasi-static C-V (QSCV) measurements: • “Measurement Functions” • “Defining Measurement Conditions” • “Making a Measurement” • “Maximum Measurement Value” • “Considering Measurement Accuracy” For details about how to enter or input setup data, refer to Setup Screen Reference manual. 4-2 Agilent 4155C/4156C User’s Guide Vol.2, Edition 5 Quasi-static C-V Measurements Measurement Functions Measurement Functions For quasi-static C-V (QSCV) measurements, the sweep source channel performs linear staircase sweep output of voltage, while the monitor channel measures capacitance for each sweep step. Available Units The QSCV measurement uses a voltage sweep source (VAR1), and a voltage constant source. Also, optional constant sources may be used. Units, mode, and function available are shown below: Unit SMU Mode Function V VAR1 V, I, COMMON CONST VSU V CONST PGU V CONST GNDU COMMON CONST Only a SMU can be used for the capacitance measurement. Specify the measurement unit on the MEASURE: QSCV MEASURE SETUP screen. Capacitance Data Calculation The capacitance data at each sweep step is calculated using the following formula. This is available when the leakage current compensation capability is set to ON. C = (cinteg × ( I - (1 - α) × IL - α × IL0)) / (V - V0) [F] where, cinteg is the integration time of the capacitance measurement. I, IL, IL0, V, and V0 are the measurement data at each sweep step, see “Operation”. And a is a coefficient given by the following formula: α = (2k - 1) / 4n where, n is the number of power line cycles required for cinteg. And k is the number of power line cycles until the current becomes stable at each sweep step, and it is the value the 4155C/4156C internally monitors and counts. Agilent 4155C/4156C User’s Guide Vol.2, Edition 5 4-3 Quasi-static C-V Measurements Measurement Functions Operation In the QSCV measurement, the 4155C/4156C executes the capacitance measurement at the sweep steps except for the sweep start voltage and stop voltage. At each sweep step, the capacitance measurement is executed over the voltage range: output voltage ± cvoltage/2 (V). where cvoltage is the capacitance measurement voltage. See Figure 4-1. The operation of the quasi-static CV measurements are explained below. This is the case of start < stop. a. Measurement trigger enables the sweep source output. The sweep source forces start V. b. The sweep source changes the output voltage to the first step output voltage -Vq V, and waits for hold time. where Vq = cvoltage/2 V. c. Repeats d. and e. for the Nth sweep step. where N is integer, 1 to NO. OF STEP (NO. OF STEP = |start-stop| / |step| - 1). d. The sweep source changes the output voltage to the Nth step output voltage -Vq V, and waits for delay time. e. The measurement unit measures the following items: V0 Voltage at the Nth step voltage - Vq V IL0 Leakage current at the Nth step voltage - Vq V I Current at the voltage transition to the Nth step voltage + Vq V V Voltage at the Nth step voltage + Vq V IL Leakage current at the Nth step voltage + Vq V f. After the sweep measurement, the sweep source changes output voltage to 0 V. Measurement data at the Nth sweep step is the Nth step voltage (center value of the voltage range for the Nth measurement) and the capacitance measurement data at the Nth sweep step. NOTE When |step voltage| = capacitance measurement voltage (cvoltage), V0 and IL0 are not measured for the second step and later. The capacitance calculation uses the V and IL values at the previous step, instead. 4-4 Agilent 4155C/4156C User’s Guide Vol.2, Edition 5 Quasi-static C-V Measurements Measurement Functions Figure 4-1 VAR1 Output and Measurement Items of QSCV Measurement stop voltage (limit of sweep source output) last step cvoltage= 2 × Vq Trigger delay time 3rd step 0V 0V Measurement items at Nth sweep step 2nd step hold time V 0 IL 0 step voltage 1st step Vq linteg linteg step voltage start voltage (source output value when starting sweep output) NOTE V IL cinteg Vq delay time I delay time If the following conditions are true, ignore the measurement items IL0 and IL shown above. Leakage current measurement is not executed. • Leakage current name (INAME) is not defined in the user function and the DISPLAY: DISPLAY SETUP screen. • Leakage current compensation (LEAK COMPENSATION) is off. Then the capacitance data is calculated as shown below: C = ( I × cinteg) / (V - V0) [F] The INAME and LEAK COMPENSATION fields appear on the MEASURE: QSCV MEASURE SETUP screen. Agilent 4155C/4156C User’s Guide Vol.2, Edition 5 4-5 Quasi-static C-V Measurements Measurement Functions Parameters Specify the following parameters for VAR1 and CONST channels on the MEASURE: QSCV SETUP screen. Parameter Description sweep mode Single (start to stop) or double sweep (start to stop to start). start Start voltage of sweep. This is the output voltage at the start of the sweep output. The permissible range of start, stop, and step depends on the output range of the source unit. The VAR1 source unit uses the minimum range that covers all sweep output values. For the output range, see Chapter 7. stop Stop voltage of sweep. Upper or lower limit of the sweep output. step Incremental step voltage of sweep. The value must be greater than or equal to double the resolution of the output range. You must set the start, stop, and step values so that the NO. OF STEP value is in the range: 1 to 1001. The value is calculated from the following formula (fractions below decimal point are rounded down). NO. OF STEP = |start−stop| / |step| − 1 If the calculation result is 0, this value is automatically set to 1. compliance QSCV meas voltage Compliance value of source unit (SMU). The permissible range of compliance depends on the output range of the source unit. Capacitance measurement voltage (cvoltage). The value must be ≤ |step|. The minimum value is double the resolution of the output range, and the maximum value is 10 V. hold time Time from the start of the first sweep step to the beginning of the delay time. delay time Time from the start of each sweep step to the start of the measurement. source Constant source output value. The permissible range of source depends on the output range of the source unit. 4-6 Agilent 4155C/4156C User’s Guide Vol.2, Edition 5 Quasi-static C-V Measurements Measurement Functions Specify the following parameters to define the measurement conditions on the MEASURE: QSCV MEASURE SETUP screen. See also Setup Screen Reference for setting these parameters. Parameter Description unit Unit used to measure capacitance range Measurement range. 1 nA or 10 nA for the MPSMU/HPSMU. 10 pA, 100 pA, 1 nA, or 10 nA for the HRSMU. cname Variable name of the capacitance data iname Variable name of the leakage current data. The leakage current data, at each sweep step, is calculated from the following formula: Leakage current = (IL0 + IL) / 2 qscv time Integration time for the capacitance measurement leak time Integration time for the leakage current measurement leak compensation Leakage current compensation ON or OFF zero cancel NOTE Capacitance offset cancel ON or OFF Integration Time The QSCV measurement uses the integration time that is set by the INTEGRATION TIME table on the MEASURE: QSCV MEASURE SETUP screen. The Short, Medium, and Long front-panel keys have no effect for the QSCV measurement. NOTE Leakage Current Compensation For the measurement using the leakage current compensation capability, an error given by the following formula can be included in the measurement data. Cerror = ± ( IL - IL0) / (4 × Freq × (V - V0)) [F] where, Freq is 50 or 60 depending on the line frequency of your site. IL, IL0, V, and V0 are the measurement data, see “Operation”. For example, if IL-IL0= 10 pA and V-V0= 0.1 V in 50 Hz area, maximum ± 0.5 pF of the compensation error may be caused. For the accurate measurement, estimate the characteristics of the leakage current of your device. And select the optimum values of the range, QSCV meas voltage, and the voltage sweep range. The delay time and qscv time settings are also important. Agilent 4155C/4156C User’s Guide Vol.2, Edition 5 4-7 Quasi-static C-V Measurements Defining Measurement Conditions Defining Measurement Conditions This section describes the QSCV measurement tasks. The overall procedure for testing your DUT is as follows: 1 Connecting your DUT to the 4155C/ 4156C. See Chapter 10 for procedures. 2 C H A N NE L S : C H AN N E L D E F IN I T I ON SW E E P * ME A S U RE M EN T M OD E QS C V SA M P L I NG * CH A N N EL S UNIT SM U 1 : HR SM U 2 : HR SM U 3 : HR SM U 4 : HR SM U 5 : HP VS U 1 VS U 2 VM U 1 VM U 2 PG U 1 PG U 2 GN D U M EA S U R E IN A M E I1 I2 VNAME V1 V2 S T BY M OD E FC T N V VA R 1 C O MM O N CO N S T SE R I E S RE S I S TA N C E 0 ohm QS C V DE F A U LT ME A S U RE SE T U P 0 ohm -- - - - --- - - - -- - - - -- - -- - - - -- - - -- - - -- - - - - - -- - - - -- - -- - - - -- - - -- - - -- - - - - - --- - - - --- - - - --- - - - -- - -- ME M 1 M B- T r VC E - I C DI S C H AR G E ON ME M 2 M FE T VD S - I D MO R E 1/ 2 QSCV S e l e ct M e as u re m e n t M o de w i th s o ft k e y o r ro t a ry k no b . C H A N NE L DEF U SE R F CT N USER VAR S E5 2 5 0A PR O P B E 52 5 0 A S ET U P NE X T PA G E 3 M E A S UR E : QS C V S E T UP SI N G L E * V A RI A B L E U N IT N A ME S W EE P M OD E S T AR T S T OP S T EP N O O F S TE P C O MP L I A NC E VAR1 S M U 1 :H R V1 S I N G LE 3 . 1 00 V - 3 . 1 00 V - 1 0 0 .0 m V 61 1 0 0 .0 0 m A * T I MI N G H O LD T I ME D E LA Y T IM E 1 0 . 00 s 1 0 0 .0 m s See “To Define Measurement Units” on pages 4-10. Also, see Chapter 8 for the user function and standby function. Ignore the SERIES RESISTANCE and DISCHARGE fields; they are not available for the QSCV measurements. Setting the source conditions. See the following in this section: DO U B L E * Q SC V M EA S V OL T A GE 80 . 0 m V * Q SC V C O N T IN U E A T AN Y S t at u s * C O NS T A N T U N IT N A ME M O DE S O UR C E - - - - -- - - - - - - -- - - - - - - - -- - - -- - -- - - -- - C O MP L I A NC E - - - - -- - - - - - - -- - - - - - - - -- - - -- - -- - - -- - - S I N G LE S e l e ct S W EE P M o d e w i t h s o f tk e y or r o ta r y k n o b. QSCV SETUP Defining measurement mode and measurement units that you use to do measurement. M E A SU R E S E T UP O UT P U T S EQ S B PREV PAGE NE X T PA G E • “To Set up QSCV Sweep Source” • “To Set up Stop Condition” • “To Set up Constant Output” • “To Set up PGU Output” For setting the measurement conditions, see following in this section: • 4-8 “To Define Measurement Conditions” Agilent 4155C/4156C User’s Guide Vol.2, Edition 5 Quasi-static C-V Measurements Defining Measurement Conditions 4 D I S P LA Y : DI S PL A Y SE T U P GR A P H ICS Setting the display mode to show measurement results. *D I S P LA Y M O D E G R A P HI C S LI S T *G R A P HI C S X ax i s NAME V1 S C A L E L IN E A R MIN - 3. 0 0 0 00 0 0 V MAX 3. 0 0 0 00 0 0 V Y1 a x i s C A P01 LI N E A R 3 6 . 0 00 0 0 p F 1 1 0 . 00 0 0 0 pF *G R I D ON * LI N E PA R A M ET E R ON *D A T A V A RI A B L ES * DA T A DI S P L AY R ES O L UT I O N EX T E N D A NL Y S I S S ET U P “To Display Graphics Results” • “To Display List Results” B PREV PAGE S • See Chapter 6 for the auto analysis function. G R A P HI C S S e l e ct D i sp l ay M o de w it h s of t k e y o r ro t a ry k no b . D I S P LA Y SETUP See following in this section: Y 2 a xi s NE X T PA G E 5 Executing the measurement. See “To Execute or Stop Measurement” on pages 4-17. Also see Chapter 7 for executing self-calibration and zero offset cancel. 6 Results. G R A P H/ L I S T: GR A P H IC S MA R K E R M A RK E R ( 2 . 9 00 V 1 0 8 . 50 8 p F ) ON For example, displayed graphically. (F) 1 1 0 .p MA R K E R MI N / M AX C A P01 IN T E R P O L A TE O FF DI R E C T MA R K E R/ CU R S O R 1 0 . 0p / d iv MA R K E R SK I P AU T O AN A L Y SIS 3 6 . 0p - 3. 0 0 V1 (V) 5 0 0 .m / di v CU R S O R 3 .0 0 O FF B M AR K E R / C UR S O R LINE S CA L I NG S DI S P LA Y SE T U P Q SC V S ET U P T I M IN G S E T UP CO N S T SE T U P Agilent 4155C/4156C User’s Guide Vol.2, Edition 5 4-9 Quasi-static C-V Measurements Defining Measurement Conditions To Define Measurement Units Press the Chan front-panel key to define the measurement units. The CHANNELS: CHANNEL DEFINITION screen appears. 1. MEASUREMENT MODE Select the QSCV secondary softkey for the quasi-static CV (QSCV) measurement. 2. VNAME Enter a unique name for the voltage variable. For example, enter Vg for gate voltage. If the channel does neither V force nor V measurement, you can omit VNAME. 3. INAME Enter a unique name for the current variable. For example, enter Ig for gate current. If the channel does neither I force nor I measurement, you can omit INAME. 4. MODE Select one of the following softkeys: • V: Voltage output (for SMU, VSU, and PGU) • I: Current output (for SMU) • COMMON: Circuit common (for SMU and GNDU) In the QSCV measurements, pulsed output is not available. 5. FCTN Select one of the following softkeys to set the output function: • VAR1: QSCV sweep output function (for the V mode SMU) • CONST: Constant output function (for SMU, VSU, PGU, and GNDU) VNAME and INAME You can use VNAME and INAME names in user function definitions or for analysis on the GRAPHICS/LIST screens. These names must consist of up to six alphanumeric characters. The first character must be a letter of the alphabet. To disable a unit Select the DELETE ROW softkey. The settings for the unit are deleted. 4-10 Agilent 4155C/4156C User’s Guide Vol.2, Edition 5 Quasi-static C-V Measurements Defining Measurement Conditions To Set up QSCV Sweep Source The QSCV sweep source is the source unit defined as VAR1 in the CHANNELS: CHANNEL DEFINITION screen. To set up the sweep source, press the Meas front-panel key. The MEASURE: QSCV SETUP screen appears. 1. VAR1: SWEEP MODE Select one of the following softkeys to set the sweep mode: • SINGLE: single sweep mode (start to stop) • DOUBLE: double sweep mode (start to stop to start) 2. VAR1: START Enter the sweep start voltage. 3. VAR1: STOP Enter the sweep stop voltage. Upper or lower limit of the output voltage. 4. VAR1: STEP Enter the sweep step voltage. The minimum available value is double the resolution of the output range. You must set the START, STOP, and STEP values so that the NO. OF STEP value is in the range: 1 to 1001. The value is calculated from the following formula: NO. OF STEP = |START−STOP| / |STEP| −1 If the NO. OF STEP value is set to 1, the measurement unit executes a one-point capacitance measurement between the START and STOP values. 5. VAR1: COMPLIANCE Enter the compliance value for the sweep source. 6. QSCV MEAS VOLTAGE Enter the capacitance measurement voltage. The minimum value is double the resolution of the output range, and the maximum value is 10 V. The value must be ≤|STEP|. If you enter a value greater than the |STEP| value, this value is automatically set to the same value as the |STEP| value. If you enter the value greater than or equal to |START−STOP|, the measurement unit executes a one-point capacitance measurement between the START and STOP values. 7. HOLD TIME Enter the hold time. 0 to 655.35 seconds, 10 ms resolution. Agilent 4155C/4156C User’s Guide Vol.2, Edition 5 4-11 Quasi-static C-V Measurements Defining Measurement Conditions 8. DELAY TIME Enter the delay time. 0 to 65.535 seconds, 100 µs resolution. You cannot change UNIT and NAME in this screen. To change the values, go to the CHANNELS: CHANNEL DEFINITION screen. NOTE In the QSCV measurement, the 4155C/4156C executes the capacitance measurement at the sweep steps except for the sweep start voltage and stop voltage. At each sweep step, the capacitance measurement is executed over the voltage range: output voltage ± capacitance measurement voltage/2. To Set up Stop Condition 1. Press the Meas key in the PAGE CONTROL key group. 2. Move the field pointer to the QSCV Status field. 3. Select one of the following softkeys: CONT AT ANY Sweep will continue even if an abnormal status occurs. STOP AT ANY ABNORM Sweep will stop if any abnormal status occurs. STOP AT COMPLIANCE Sweep will stop if the abnormal status 1 or 2 listed below occurs. Abnormal status means the following: 1. Integration time too short for the capacitance measurement 2. Compliance on the leakage current measurement unit 3. Compliance on the non-measurement unit 4. Overflow on ADC 5. Oscillation on any unit 4-12 Agilent 4155C/4156C User’s Guide Vol.2, Edition 5 Quasi-static C-V Measurements Defining Measurement Conditions To Set up Constant Output Constant source is the source unit defined as CONST in the CHANNELS: CHANNEL DEFINITION screen. To set up the constant output source, press the Meas front-panel key. The MEASURE: QSCV SETUP screen is displayed. 1. CONSTANT: SOURCE Enter the desired output value of the constant source. 2. CONSTANT: COMPLIANCE Only for SMU. Enter the compliance value for the constant source. You cannot change UNIT, NAME, and MODE in this screen. To change the values, go to the CHANNELS: CHANNEL DEFINITION screen. To Set up PGU Output In the QSCV measurements, you can use the PGU as the DC voltage source, not the pulsed voltage source. To set up the constant voltage source, press the Meas front-panel key, and select the PGU SETUP softkey. The MEASURE: PGU SETUP screen appears. The PGU SETUP softkey is available when you set PGU in the CHANNELS: CHANNEL DEFINITION screen. 1. IMPEDANCE Select a secondary softkey to set the output impedance value: • LOW for approximately zero ohm output impedance • 50 ohm for 50 ohm output impedance 2. CONSTANT: SOURCE Enter the desired output value of the constant voltage source. You cannot change UNIT and NAME in this screen. To change the values, go to the CHANNELS: CHANNEL DEFINITION screen. Agilent 4155C/4156C User’s Guide Vol.2, Edition 5 4-13 Quasi-static C-V Measurements Defining Measurement Conditions To Define Measurement Conditions Press the Meas front-panel key, and select the MEASURE SETUP softkey. The MEASURE: QSCV MEASURE SETUP screen appears. 1. UNIT and FCTN Select one of the secondary softkeys to specify the measurement unit. The FCTN field just displays the function of the unit. 2. RANGE Select one of the secondary softkeys to specify the measurement range. 3. CNAME Enter a unique name for the capacitance measurement data variable. Up to six alphanumeric characters. The first character must be a letter of the alphabet. 4. INAME Enter a unique name for the leakage current measurement data variable. Up to six alphanumeric characters. The first character must be a letter of the alphabet. 5. INTEG TIME: QSCV and LEAK QSCV: Enter the integration time for the capacitance measurement. 0.04 to 400 sec for 50 Hz line frequency, 0.033333 to 333.33 sec for 60 Hz. LEAK: Enter the integration time for the leakage current measurement. 0.02 to 2 sec for 50 Hz line frequency, 0.016667 to 1.6667 sec for 60 Hz. The setting value is rounded to the following value: integ time = NPLC value / selected line frequency where, NPLC value is integer in the range: 2 to 20000 for the capacitance measurement, and 1 to 100 for the leakage current measurement. The Short, Medium, and Long front-panel keys have no effect for the QSCV measurement. 6. LEAK COMPENSATION Select the ON secondary softkey to do the leakage current compensation, or OFF to not perform the compensation. 7. ZERO CANCEL Select the ON secondary softkey to enable the capacitance offset cancel function, or OFF to disable the function. After the setup is completed, press the green-key, then the Stop front-panel key to perform the offset measurement. 4-14 Agilent 4155C/4156C User’s Guide Vol.2, Edition 5 Quasi-static C-V Measurements Defining Measurement Conditions To Display Graphics Results 1. Press the Display key in the PAGE CONTROL key group. 2. Select the DISPLAY SETUP primary softkey. 3. In the DISPLAY MODE field, select the GRAPHICS secondary softkey. 4. In the X axis column, enter the variable name, select the axis scale, and enter minimum and maximum values. 5. In the Y1 axis column, enter the variable name, select the axis scale, and enter minimum and maximum values. 6. If you use the Y2 axis, enter the variable name, select the axis scale, and enter minimum and maximum values in the Y2 axis column. When the pointer is in the NAME row, the permissible variable names appear in the secondary softkey area. Select one to be assigned to the graph axis. The permissible names are the names that you already set up on the CHANNEL DEFINITION, USER FUNCTION, USER VARIABLE, and QSCV MEASURE SETUP screens. To display a grid on the plotting area In the GRID field, select ON to display or OFF to not display. To display line parameters on the plotting area In the LINE PARAMETER field, select ON to display or OFF to not display. Line parameters are the X and Y intercepts and gradient of the analysis lines. To display variables on the data variable area In the DATA VARIABLES fields, select the secondary softkey for the desired variable. Up to two variables can be displayed on the data variable area, which is located between the graph area and the marker area. To change resolution of the data to be displayed In the DATA DISPLAY RESOLUTION field, select NORMAL for the resolution shown in the specifications, or EXTEND for the ADC full scale resolution. For example, the data display resolution is 1 fA in NORMAL mode, and 10 aA in EXTEND mode for the 10 pA measurement range. Agilent 4155C/4156C User’s Guide Vol.2, Edition 5 4-15 Quasi-static C-V Measurements Defining Measurement Conditions To Display List Results 1. Press the Display key in the PAGE CONTROL key group. 2. Select the DISPLAY SETUP primary softkey. 3. In the DISPLAY MODE field, select the LIST secondary softkey. 4. In the LIST area, select the secondary softkey of the variables for which you want to list the measurement results. When the pointer is in the NAME row, the permissible variable names appear in the secondary softkey area. To set a variable name, select the desired secondary softkey. The permissible names are names that you already set up on the CHANNEL DEFINITION, USER FUNCTION, USER VARIABLE, and QSCV MEASURE SETUP screens. To display variables on the data variable area In the DATA VARIABLES fields, select the secondary softkey for the desired variable. Up to two variables can be displayed on the data variable area, which is located below the list area. To change resolution of the data to be displayed In the DATA DISPLAY RESOLUTION field, select NORMAL for the resolution shown in the specifications, or EXTEND for the ADC full scale resolution. For example, the data display resolution is 1 fA in NORMAL mode, and 10 aA in EXTEND mode for the 10 pA measurement range. 4-16 Agilent 4155C/4156C User’s Guide Vol.2, Edition 5 Quasi-static C-V Measurements Defining Measurement Conditions To Execute or Stop Measurement To execute a measurement, press: Single Clears GRAPHICS or LIST screen, then executes measurement one time. Measurement results are displayed on the GRAPHICS or LIST screen. Repeat Executes measurements continuously. Before each measurement is executed, the GRAPHICS or LIST screen is cleared. Most recent measurement results are displayed on the GRAPHICS or LIST screen. Append Executes measurement one time. Does not clear the GRAPHICS or LIST screen. That is, measurement results are added to the existing results. To stop a measurement, press the Stop key in the MEASUREMENT key group. Agilent 4155C/4156C User’s Guide Vol.2, Edition 5 4-17 Quasi-static C-V Measurements Making a Measurement Making a Measurement In this section, you learn how to execute the QSCV measurements using the 4155C/4156C. As an example, you measure MOS capacitor. Measurement circuit and typical characteristics are shown below: MOS Capacitor Capacitance A SMU1 NOTE SMU2 Voltage For accurate measurements, let the 4155C/4156C warm up for at least 40 minutes after you turn on the instrument, and then execute calibration. For self-calibration, see Chapter 7. Step 1. Prepare for measurement Before executing measurement, configure the 4155C/4156C and Agilent 16442A Test Fixture. See “Step 1. Prepare for the measurement” in “Making a Measurement” in Chapter 1. The measurement example uses the same connection as the sweep measurement example connection. Step 2. Mount your DUT on the test fixture 1. Select a suitable socket module for your DUT (MOS capacitor). 2. Mount the socket module on the test fixture. 3. Mount the capacitor on the socket module. 4. Make connections with connection wires (miniature banana to pin plug, etc.). The capacitor must be connected between SMU1 and SMU2. 5. After finishing connections, shut the lid of the test fixture. 4-18 Agilent 4155C/4156C User’s Guide Vol.2, Edition 5 Quasi-static C-V Measurements Making a Measurement Step 3. Define the channel assignments Set the connection information on the CHANNELS: CHANNEL DEFINITION screen. 1. If the 4155C/4156C has been turned off, turn it on and wait until the self-test is completed. 2. Make sure that the CHANNELS: CHANNEL DEFINITION screen appears on the screen of the 4155C/4156C. If not, press the Chan front-panel key. 3. Move the field pointer to the MEASUREMENT MODE field, then select the QSCV softkey to set the 4155C/4156C to QSCV measurement mode. 4. Move the field pointer to the CHANNELS table, and set SMU1 and SMU2 as shown below. UNIT VNAME INAME MODE FCTN SMU1 V1 I1 V VAR1 SMU2 V2 I2 COMMON CONST Only the SMU1 and SMU2 are used for this example measurement. Disable other units by selecting the DELETE ROW softkey. CHANNELS: CHANNEL DEFINITION SWEEP *MEA SURE MENT MO DE QSCV SAMPLING *CHANNELS UNIT SMU1:HR SMU2:HR SMU3:HR SMU4:HR SMU5:HP VSU1 VSU2 VMU1 VMU2 PGU1 PGU2 GNDU VNA ME V1 V2 MEASURE INAME I1 I2 STBY MODE FC TN V VA R1 CO MMON CO NS T SERIES RESI STAN CE 0 ohm QSCV DEFAULT MEASURE SETUP 0 ohm --------------- -- -- - ----- - -- ---- -- -- - ------ -- -- - ----- - -- ---- -- -- - ------------------------- MEM1 M B-Tr VCE-IC DISCHARGE ON MEM2 M FET VDS-ID MORE QSCV Se lect Meas ureme nt Mod e wit h so ftkey o r ro tary knob. CHANNEL DEF USER FCTN USER VAR S E5250A PROP E5250A SETUP Agilent 4155C/4156C User’s Guide Vol.2, Edition 5 1/2 B NEXT PAGE 4-19 Quasi-static C-V Measurements Making a Measurement Step 4. Set up the source parameters Set the output parameters on the MEASURE: QSCV SETUP screen. Define the source parameters as shown below: NOTE In the QSCV measurement, the 4155C/4156C executes the capacitance measurement at the sweep steps except for the sweep start voltage and stop voltage. At each sweep step, the capacitance measurement is executed over the voltage range: output voltage ± capacitance measurement voltage/2. 1. Press the Meas front-panel key. The MEASURE: QSCV SETUP screen appears. 2. Set the VARIABLE table. The following values are just an example. SWEEP MODE SINGLE START 3.1 V STOP − 3.1 V STEP −100 mV COMPLIANCE 100 mA The SWEEP MODE field selects the sweep mode: SINGLE or DOUBLE. START, STOP, and STEP mean the sweep start, stop, and step values. The minimum STEP value is double the resolution of the output range of the source unit. 3. Set the QSCV MEAS VOLTAGE field. The following value is just an example. QSCV MEAS VOLTAGE 80 mV This field specifies the capacitance measurement voltage in each sweep step. The value must be less than or equal to the |STEP| value. If you set the value greater than the |STEP| value, this value is automatically set to the same value as the |STEP| value. If you set the value greater than the |START−STOP| value, NO OF STEP is automatically set to 1, and the QSCV MEAS VOLTAGE and STEP values are ignored. Then the 4155C/4156C executes one-point spot measurement from START to STOP. 4-20 Agilent 4155C/4156C User’s Guide Vol.2, Edition 5 Quasi-static C-V Measurements Making a Measurement 4. Set the TIMING table. The following values are just an example. HOLD TIME 10 s DELAY TIME 100 ms This table sets the hold time and delay time. Hold time: 0 to 655.35 seconds, 10 ms resolution. Delay time: 0 to 65.535 seconds, 100 µs resolution. MEASURE: QSCV SETUP SINGLE *VARIABLE UNIT NAME SWEEP MODE START STOP STEP NO OF STEP COMPLIANCE VAR1 SMU1:HR V1 SINGLE 3.100 V -3.100 V -100.0mV 61 100.00mA *TIMING HOLD TIME DELAY TIME 10.00 s 100.0ms DOUBLE *Q S C V M E AS V OL T A GE 80.0mV *QSCV CONTINUE AT ANY Status *CONSTANT UNIT NAME MODE SOURCE -- - -- -- -- --- - - --- - - -- -- - - -- --- - - -- -CO MP L IA NC E -- - -- -- -- --- - - --- - - -- -- - - -- --- - - -- -- SINGLE Select SWEEP Mode with softkey or rotary knob. QSCV SETUP MEASURE SETUP OUTPUT SEQ S Agilent 4155C/4156C User’s Guide Vol.2, Edition 5 B PREV PAGE NEXT PAGE 4-21 Quasi-static C-V Measurements Making a Measurement Step 5. Set up the measurement parameters Set the output parameters on the MEASURE: QSCV MEASURE SETUP screen. Define the measurement parameters as shown below: 1. Press the Meas front-panel key, and select the MEASURE SETUP softkey. The MEASURE: QSCV MEASURE SETUP screen appears. 2. Set the MEASUREMENT UNIT table. The following values are just an example. UNIT SMU1 FCTN VAR1 RANGE 1 nA CNAME CAP01 INAME LEAK01 The UNIT selects the measurement unit used to measure capacitance. The FCTN just displays the function of the selected unit. The range selects the measurement range. CNAME and INAME specify the variable name of the capacitance measurement data and the leakage current data, where the variable name must be unique. The same name must not be assigned for the VNAME and INAME in the CHANNEL DEFINITION screen, and for the user function. 3. Set the INTEG TIME table. The following values are just an example. TIME NPLC QSCV 100 ms 5 LEAK 100 ms 5 This table sets the integration time for the capacitance measurement (QSCV) and the leakage current measurement (LEAK) independently. QSCV: 0.04 to 400 sec at 50 Hz line frequency, 0.033333 to 333.33 sec at 60 Hz LEAK: 0.02 to 2 sec at 50 Hz line frequency, 0.016667 to 1.6667 sec at 60 Hz 4-22 Agilent 4155C/4156C User’s Guide Vol.2, Edition 5 Quasi-static C-V Measurements Making a Measurement 4. Enable or disable the leakage current compensation function using the LEAK COMPENSATION field. To enable the function, select the ON softkey. To disable the function, select the OFF softkey. 5. Enable or disable the zero offset cancel function using the ZERO CANCEL field. To disable the offset cancel function, select the OFF softkey. The following procedure enables the function. a. Complete the QSCV measurement setup on the MEASURE: QSCV SETUP and MEASURE: QSCV MEASURE SETUP screens. b. Remove the DUT from the socket module to open the measurement terminals. c. Press the green front-panel key and the Stop front-panel key in this order to execute the offset measurement. And wait for the measurement completion. d. Select the ON softkey in the ZERO CANCEL field. e. Mount the DUT on the socket module. MEASURE: QSCV MEASURE SETUP SMU1:HR *MEASUREMENT UNIT UNIT FCTN RANGE SMU1:HR VAR1 1nA *INTEG TIME TIME QSCV 100ms LEAK 100ms CNAME C A P01 INAME L E A K01 SMU2:HR NPLC 5 5 *LEAK COMPENSATION ON *ZERO CANCEL ON 5.416pF SMU1:HR Select Measurement Unit with softkey. QSCV SETUP MEASURE SETUP OUTPUT SEQ S Agilent 4155C/4156C User’s Guide Vol.2, Edition 5 B PREV PAGE NEXT PAGE 4-23 Quasi-static C-V Measurements Making a Measurement Step 6. Set up the results display Set the results display information on the DISPLAY: DISPLAY SETUP screen. 1. Press the Display front-panel key. The DISPLAY: DISPLAY SETUP screen appears. 2. Move the field pointer to the DISPLAY MODE field. Then select the GRAPHICS softkey to set the results display mode to the graph mode. 3. Set the X and Y1 axes information. The following values are just an example. X-axis Y1-axis NAME V1 CAP01 SCALE LINEAR LINEAR MIN −3 V 36 pF MAX 3V 110 pF This setup is to assign the X axis to V1, and the Y1 axis to CAP01. DISPLAY: DISPLAY SETUP GRAPHICS *DISPLAY MODE GRAPHICS LIST *GRAPHICS Xaxis NAME V1 SCALE LINEAR MIN -3.0000000 V MAX 3.0000000 V Y1axis C A P01 LINEAR 36.00000pF 110.00000pF Y2axis *GRID ON *LINE PARAMETER ON *DATA VARIABLES * D A TA D IS PL AY R ES O LUT I O N EXTEND GRAPHICS Se le ct Di sp l ay M od e wi t h s o f tke y o r ro t a ry kno b . DISPLAY SETUP 4-24 ANLYSIS SETUP S B PREV PAGE NEXT PAGE Agilent 4155C/4156C User’s Guide Vol.2, Edition 5 Quasi-static C-V Measurements Making a Measurement Step 7. Execute the measurement Press the Single front-panel key to execute the measurement. The 4155C/4156C starts the QSCV measurement. After the measurement, the measurement results will be as shown in the following example: GR AP H/L IS T: GRA P HI CS MARKER MARKER( 2. 90 0 V 108.508pF ) ON (F) 110.p MARKER MIN/MAX C A P01 INTERPOLATE OFF DIRECT MARKER/ CURSOR 10.0p /div MARKER SKIP AUTO ANALYSIS 36.0p -3.00 V1 (V) 50 0.m / di v CURSOR 3.00 OFF B MA RK ER/ CU RS OR NOTE LI NE SCALING S DI S PLA Y SE T UP Q S CV S E TU P TIMING SETUP CONST SETUP In the QSCV measurement, the 4155C/4156C executes the capacitance measurement at the sweep steps except for the sweep start voltage and stop voltage. This example does not execute the capacitance measurement at 3.1 V and −3.1 V. Agilent 4155C/4156C User’s Guide Vol.2, Edition 5 4-25 Quasi-static C-V Measurements Maximum Measurement Value Maximum Measurement Value NOTE The maximum measurement value is not the specifications but the reference data. The maximum measurement value depends on the settings of the current measurement range, the QSCV measurement voltage, and the integration time. See Figures 4-2 to 4-4. Each figure shows the characteristics of the capacitance value vs. the QSCV measurement voltage by the integration time setting. Each line in the graph specifies the maximum measurement value for each integration time setting. The graph data is applied to the measurement when the QSCV integration time is set to the same value as the LEAK integration time. Maximum Measurement Value Using 10 pA and 100 pA range: HRSMU 1.00E-07 1.00E-08 1.00E-09 Capacitance (F) Figure 4-2 Integration Time 1.00E-10 2s 1.00E-11 1.00E-12 1s 1.00E-13 500 ms 1.00E-14 300 ms 1.00E-15 0.001 0.01 0.1 1 10 QSCV Measurement Voltage (V) 4-26 Agilent 4155C/4156C User’s Guide Vol.2, Edition 5 Quasi-static C-V Measurements Maximum Measurement Value Figure 4-3 Maximum Measurement Value Using 1 nA range: HRSMU/MPSMU/HPSMU 1.00E-05 1.00E-06 Capacitance (F) 1.00E-07 1.00E-08 Integration Time 1.00E-09 2s 1s 500 ms 300 ms 1.00E-10 100 ms 1.00E-11 50 ms 30 ms 1.00E-12 0.001 0.01 0.1 1 10 QSCV Measurement Voltage (V) Maximum Measurement Value Using 10 nA range: HRSMU/MPSMU/HPSMU 1.00E-04 1.00E-05 1.00E-06 Capacitance (F) Figure 4-4 1.00E-07 Integration Time 1.00E-08 2s 1s 500 ms 1.00E-09 300 ms 100 ms 1.00E-10 50 ms 30 ms 1.00E-11 0.001 0.01 0.1 1 10 QSCV Measurement Voltage (V) Agilent 4155C/4156C User’s Guide Vol.2, Edition 5 4-27 Quasi-static C-V Measurements Considering Measurement Accuracy Considering Measurement Accuracy NOTE The measurement accuracy is not the specifications but the reference data. The capacitance measurement accuracy can be calculated by the following formula: Measurement Accuracy = A (%) + B (F) A : Reading accuracy. % accuracy of the measured value. B : Offset accuracy. Tinteg Bp + Cp × Tinteg + Dp × ----------------Tleak A = Ap + ----------------------------------------------------------------------------------Vstep Tinteg Bo + Boc × Cg + ( Co + Coc × Cg ) × Tinteg + ( Do + Doc × Cg ) × ----------------Ao Tleak B = ------------ + --------------------------------------------------------------------------------------------------------------------------------------------------------------------------------------------Rdut Vstep where, Tinteg: Integration time for the capacitance measurement, in seconds Tleak: Integration time for the leakage current measurement, in seconds Vstep: QSCV measurement voltage, in V Rdut: Equivalent parallel resistance of DUT, in Ω Cg: Guard capacitance of the measurement path, in F Ax, Bx, Cx, and Dx values are the constant. For the values, see Table 4-1 for the high resolution SMU (HRSMU), and Table 4-2 for the medium power/high power SMU (MPSMU and HPSMU). Calculation examples of the measurement accuracy are shown in Figures 4-5 through 4-26. Conditions of the calculation are shown in Table 4-3. 4-28 Agilent 4155C/4156C User’s Guide Vol.2, Edition 5 Quasi-static C-V Measurements Considering Measurement Accuracy Table 4-1 Constant Value for calculating the Measurement Accuracy: HRSMU Current Measurement Range Constant 10 pA / 100 pA 1 nA Voltage Output Range 2V 20 V 40 V 100 V Ap 4.0 4.0 4.0 4.0 Bp 0.0025 0.018 0.035 0.088 Cp 0.0023 0.0052 0.008 0.019 Dp 0.0009 0.002 0.003 0.0076 Ao 0.07 Bo 3.7E-15 Boc 2.6E-18 Co 3.1E-15 Coc 6.6E-18 Do 7.2E-16 Doc 2.6E-18 Ap 0.51 0.51 0.52 0.52 Bp 0.0057 0.024 0.047 0.11 Cp 0.003 0.0048 0.0088 0.018 Dp 0.0041 0.008 0.015 0.027 Ao 0.041 Bo 7.0E-15 Boc 8.7E-18 Co 3.0E-14 Coc 6.0E-18 Do 4.0E-15 Doc 8.7E-18 Agilent 4155C/4156C User’s Guide Vol.2, Edition 5 4-29 Quasi-static C-V Measurements Considering Measurement Accuracy Current Measurement Range Constant 10 nA 4-30 Voltage Output Range 2V 20 V 40 V 100 V Ap 0.51 0.51 0.52 0.52 Bp 0.036 0.024 0.047 0.11 Cp 0.003 0.0048 0.0088 0.018 Dp 0.0041 0.008 0.015 0.027 Ao 0.041 Bo 7.3E-15 Boc 8.7E-18 Co 6.0E-14 Coc 6.0E-18 Do 4.3E-15 Doc 8.7E-18 Agilent 4155C/4156C User’s Guide Vol.2, Edition 5 Quasi-static C-V Measurements Considering Measurement Accuracy Table 4-2 Constant Value for calculating the Measurement Accuracy: MPSMU/HPSMU Current Measurement Range Constant 1 nA 10 nA Voltage Output Range (200 V is only for HPSMU) 2V 20 V 40 V 100 V 200 V Ap 0.521 0.52 0.52 0.53 0.54 Bp 0.00398 0.027 0.047 0.12 0.23 Cp 0.000798 0.0072 0.0088 0.022 0.045 Dp 0.00238 0.011 0.015 0.036 0.072 Ao 0.041 Bo 7.2E-15 Boc 6.0E-18 Co 4.3E-14 Coc 5.1E-18 Do 4.2E-15 Doc 6.0E-18 Ap 0.52 0.52 0.52 0.53 0.54 Bp 0.004 0.027 0.047 0.12 0.23 Cp 0.0008 0.0072 0.0088 0.022 0.045 Dp 0.0024 0.011 0.015 0.036 0.072 Ao 0.041 Bo 6.2E-15 Boc 6.0E-18 Co 7.4E-14 Coc 5.1E-18 Do 3.2E-15 Doc 6.0E-18 Agilent 4155C/4156C User’s Guide Vol.2, Edition 5 4-31 Quasi-static C-V Measurements Considering Measurement Accuracy Table 4-3 Conditions for Calculating Measurement Accuracy Conditions Measurement Unit Measurement Range Output Range Equivalent Parallel Resistance of DUT Guard Capacitance of Measurement Path HRSMU 10 pA / 100 pA 2V 10 T ohm 200 pF Figure 4-5 20 V 10 T ohm 200 pF Figure 4-6 20 V 10 T ohm 1 nF Figure 4-7 20 V 100 G ohm 200 pF Figure 4-8 2V 10 T ohm 200 pF Figure 4-9 Figure 4-17 20 V 10 T ohm 200 pF Figure 4-10 Figure 4-18 20 V 10 T ohm 1 nF 20 V 10 G ohm 200 pF Figure 4-11 Figure 4-20 40 V 1 G ohm 200 pF Figure 4-12 Figure 4-21 100 V 1 G ohm 200 pF Figure 4-13 Figure 4-22 200 V 1 G ohm 200 pF 2V 10 T ohm 200 pF 20 V 10 T ohm 200 pF 20 V 10 G ohm 200 pF Figure 4-15 20 V 1 G ohm 200 pF Figure 4-16 1 nA 10 nA MPSMU/ HPSMU Figure 4-19 Figure 4-23 Figure 4-14 Figure 4-24 Figure 4-25 Figure 4-26 Calculation example data shown in Figures 4-5 through 4-26 is applied to the measurement data when the QSCV integration time is set to the same value as the LEAK integration time. 4-32 Agilent 4155C/4156C User’s Guide Vol.2, Edition 5 Quasi-static C-V Measurements Considering Measurement Accuracy Calculation Example of Measurement Accuracy: HRSMU 14 Reading Accuracy (%) 12 10 8 6 4 2 0 0.001 0.01 0.1 1 QSCV Measurement Voltage (V) 1.E-10 1.E-11 Offset Accuracy (F) Figure 4-5 1.E-12 1.E-13 1.E-14 0.001 0.01 0.1 1 QSCV Measurement Voltage (V) Conditions: Measurement Range: 10 pA / 100 pA Output Range: 2 V Integration Time: 2, 1, 0.5, 0.3 s corresponding to the lines from top to bottom Equivalent Parallel Resistance of DUT: 10 T ohm Guard Capacitance of Measurement Path: 200 pF Agilent 4155C/4156C User’s Guide Vol.2, Edition 5 4-33 Quasi-static C-V Measurements Considering Measurement Accuracy Calculation Example of Measurement Accuracy: HRSMU 12 Reading Accuracy (%) 10 8 6 4 2 0 0.001 0.01 0.1 1 10 QSCV Measurement Voltage (V) 1.E-11 1.E-12 Offset Accuracy (F) Figure 4-6 1.E-13 1.E-14 1.E-15 0.001 0.01 0.1 1 10 QSCV Measurement Voltage (V) Conditions: Measurement Range: 10 pA / 100 pA Output Range: 20 V Integration Time: 2, 1, 0.5, 0.3 s corresponding to the lines from top to bottom Equivalent Parallel Resistance of DUT: 10 T ohm Guard Capacitance of Measurement Path: 200 pF 4-34 Agilent 4155C/4156C User’s Guide Vol.2, Edition 5 Quasi-static C-V Measurements Considering Measurement Accuracy Calculation Example of Measurement Accuracy: HRSMU 12 Reading Accuracy (%) 10 8 6 4 2 0 0.001 0.01 0.1 1 10 QSCV Measurement Voltage (V) 1E-11 1E-12 Offset Accuracy (F) Figure 4-7 1E-13 1E-14 1E-15 0.001 0.01 0.1 1 10 QSCV Measurement Voltage (V) Conditions: Measurement Range: 10 pA / 100 pA Output Range: 20 V Integration Time: 2, 1, 0.5, 0.3 s corresponding to the lines from top to bottom Equivalent Parallel Resistance of DUT: 10 T ohm Guard Capacitance of Measurement Path: 1 nF Agilent 4155C/4156C User’s Guide Vol.2, Edition 5 4-35 Quasi-static C-V Measurements Considering Measurement Accuracy Calculation Example of Measurement Accuracy: HRSMU 12 Reading Accuracy (%) 10 8 6 4 2 0 0.001 0.01 0.1 1 10 QSCV Measurement Voltage (V) 1E-11 Offset Accuracy (F) Figure 4-8 1E-12 1E-13 0.001 0.01 0.1 1 10 QSCV Measurement Voltage (V) Conditions: Measurement Range: 10 pA / 100 pA Output Range: 20 V Integration Time: 2, 1, 0.5, 0.3 s corresponding to the lines from top to bottom Equivalent Parallel Resistance of DUT: 100 G ohm Guard Capacitance of Measurement Path: 200 pF 4-36 Agilent 4155C/4156C User’s Guide Vol.2, Edition 5 Quasi-static C-V Measurements Considering Measurement Accuracy Calculation Example of Measurement Accuracy: HRSMU 18 16 Reading Accuracy (%) 14 12 10 8 6 4 2 0 0.001 0.01 0.1 1 QSCV Measurement Voltage (V) 1.E-10 1.E-11 Offset Accuracy (F) Figure 4-9 1.E-12 1.E-13 1.E-14 0.001 0.01 0.1 1 QSCV Measurement Voltage (V) Conditions: Measurement Range: 1 nA Output Range: 2 V Integration Time: 2, 1, 0.5, 0.2, 0.1, 0.05, 0.03 s corresponding to the lines from top to bottom Equivalent Parallel Resistance of DUT: 10 T ohm Guard Capacitance of Measurement Path: 200 pF Agilent 4155C/4156C User’s Guide Vol.2, Edition 5 4-37 Quasi-static C-V Measurements Considering Measurement Accuracy Calculation Example of Measurement Accuracy: HRSMU 10 Reading Accuracy (%) 8 6 4 2 0 0.001 0.01 0.1 1 10 QSCV Measurement Voltage (V) 1.E-10 1.E-11 Offset Accuracy (F) Figure 4-10 1.E-12 1.E-13 1.E-14 1.E-15 0.001 0.01 0.1 1 10 QSCV Measurement Voltage (V) Conditions: Measurement Range: 1 nA Output Range: 20 V Integration Time: 2, 1, 0.5, 0.2, 0.1, 0.05, 0.03 s corresponding to the lines from top to bottom Equivalent Parallel Resistance of DUT: 10 T ohm Guard Capacitance of Measurement Path: 200 pF 4-38 Agilent 4155C/4156C User’s Guide Vol.2, Edition 5 Quasi-static C-V Measurements Considering Measurement Accuracy Calculation Example of Measurement Accuracy: HRSMU 12 Reading Accuracy (%) 10 8 6 4 2 0 0.001 0.01 0.1 1 10 QSCV Measurement Voltage (V) 1.E-10 Offset Accuracy (F) Figure 4-11 1.E-11 1.E-12 0.001 0.01 0.1 1 10 QSCV Measurement Voltage (V) Conditions: Measurement Range: 1 nA Output Range: 20 V Integration Time: 2, 1, 0.5, 0.3, 0.1, 0.05, 0.03 s corresponding to the lines from top to bottom Equivalent Parallel Resistance of DUT: 10 G ohm Guard Capacitance of Measurement Path: 200 pF Agilent 4155C/4156C User’s Guide Vol.2, Edition 5 4-39 Quasi-static C-V Measurements Considering Measurement Accuracy Calculation Example of Measurement Accuracy: HRSMU 10 Reading Accuracy (%) 8 6 4 2 0 0.01 0.1 1 10 QSCV Measurement Voltage (V) 1.E-10 Offset Accuracy (F) Figure 4-12 1.E-11 0.01 0.1 1 10 QSCV Measurement Voltage (V) Conditions: Measurement Range: 1 nA Output Range: 40 V Integration Time: 2, 1, 0.5, 0.3, 0.1, 0.05, 0.03 s corresponding to the lines from top to bottom Equivalent Parallel Resistance of DUT: 1 G ohm Guard Capacitance of Measurement Path: 200 pF 4-40 Agilent 4155C/4156C User’s Guide Vol.2, Edition 5 Quasi-static C-V Measurements Considering Measurement Accuracy Calculation Example of Measurement Accuracy: HRSMU 10 Reading Accuracy (%) 8 6 4 2 0 0.01 0.1 1 10 QSCV Measurement Voltage (V) 1E-10 Offset Accuracy (F) Figure 4-13 1E-11 0.01 0.1 1 10 QSCV Measurement Voltage (V) Conditions: Measurement Range: 1 nA Output Range: 100 V Integration Time: 2, 1, 0.5, 0.3, 0.1, 0.05, 0.03 s corresponding to the lines from top to bottom Equivalent Parallel Resistance of DUT: 1 G ohm Guard Capacitance of Measurement Path: 200 pF Agilent 4155C/4156C User’s Guide Vol.2, Edition 5 4-41 Quasi-static C-V Measurements Considering Measurement Accuracy Calculation Example of Measurement Accuracy: HRSMU 18 16 Reading Accuracy (%) 14 12 10 8 6 4 2 0 0.001 0.01 0.1 1 QSCV Measurement Voltage (V) 1.E-09 1.E-10 Offset Accuracy (F) Figure 4-14 1.E-11 1.E-12 1.E-13 1.E-14 0.001 0.01 0.1 1 QSCV Measurement Voltage (V) Conditions: Measurement Range: 10 nA Output Range: 2 V Integration Time: 2, 1, 0.5, 0.2, 0.1, 0.05, 0.03 s corresponding to the lines from top to bottom Equivalent Parallel Resistance of DUT: 10 T ohm Guard Capacitance of Measurement Path: 200 pF 4-42 Agilent 4155C/4156C User’s Guide Vol.2, Edition 5 Quasi-static C-V Measurements Considering Measurement Accuracy Calculation Example of Measurement Accuracy: HRSMU 10 Reading Accuracy (%) 8 6 4 2 0 0.001 0.01 0.1 1 10 QSCV Measurement Voltage (V) 1.E-10 Offset Accuracy (F) Figure 4-15 1.E-11 1.E-12 0.00 0.01 0.10 1.00 10.00 QSCV Measurement Voltage (V) Conditions: Measurement Range: 10 nA Output Range: 20 V Integration Time: 2, 1, 0.5, 0.3, 0.1, 0.05, 0.03 s corresponding to the lines from top to bottom Equivalent Parallel Resistance of DUT: 10 G ohm Guard Capacitance of Measurement Path: 200 pF Agilent 4155C/4156C User’s Guide Vol.2, Edition 5 4-43 Quasi-static C-V Measurements Considering Measurement Accuracy Calculation Example of Measurement Accuracy: HRSMU 10 Reading Accuracy (%) 8 6 4 2 0 0.001 0.01 0.1 1 10 QSCV Measurement Voltage (V) 1.E-10 Offset Accuracy (F) Figure 4-16 1.E-11 0.001 0.01 0.1 1 10 QSCV Measurement Voltage (V) Conditions: Measurement Range: 10 nA Output Range: 20 V Integration Time: 2, 1, 0.5, 0.3, 0.1, 0.05, 0.03 s corresponding to the lines from top to bottom Equivalent Parallel Resistance of DUT: 1 G ohm Guard Capacitance of Measurement Path: 200 pF 4-44 Agilent 4155C/4156C User’s Guide Vol.2, Edition 5 Quasi-static C-V Measurements Considering Measurement Accuracy Calculation Example of Measurement Accuracy: MPSMU, HPSMU 10 9 8 Reading Accuracy (%) 7 6 5 4 3 2 1 0 0.001 0.01 0.1 1 QSCV Measurement Voltage (V) 1.E-08 1.E-09 1.E-10 Offset Accuracy (F) Figure 4-17 1.E-11 1.E-12 1.E-13 1.E-14 0.001 0.01 0.1 1 QSCV Measurement Voltage (V) Conditions: Measurement Range: 1 nA Output Range: 2 V Integration Time: 2, 1, 0.5, 0.2, 0.1, 0.05, 0.03 s corresponding to the lines from top to bottom Equivalent Parallel Resistance of DUT: 10 T ohm Guard Capacitance of Measurement Path: 200 pF Agilent 4155C/4156C User’s Guide Vol.2, Edition 5 4-45 Quasi-static C-V Measurements Considering Measurement Accuracy Calculation Example of Measurement Accuracy: MPSMU, HPSMU 20 18 16 Reading Accuracy (%) 14 12 10 8 6 4 2 0 0.001 0.01 0.1 1 10 QSCV Measurement Voltage (V) 1.E-09 1.E-10 Offset Accuracy (F) Figure 4-18 1.E-11 1.E-12 1.E-13 1.E-14 0.001 0.01 0.1 1 10 QSCV Measurement Voltage (V) Conditions: Measurement Range: 1 nA Output Range: 20 V Integration Time: 2, 1, 0.5, 0.2, 0.1, 0.05, 0.03 s corresponding to the lines from top to bottom Equivalent Parallel Resistance of DUT: 10 T ohm Guard Capacitance of Measurement Path: 200 pF 4-46 Agilent 4155C/4156C User’s Guide Vol.2, Edition 5 Quasi-static C-V Measurements Considering Measurement Accuracy Calculation Example of Measurement Accuracy: MPSMU, HPSMU 20 18 16 Reading Accuracy (%) 14 12 10 8 6 4 2 0 0.001 0.01 0.1 1 10 QSCV Measurement Voltage (V) 1.E-08 1.E-09 1.E-10 Offset Accuracy (F) Figure 4-19 1.E-11 1.E-12 1.E-13 1.E-14 0.001 0.01 0.1 1 10 QSCV Measurement Voltage (V) Conditions: Measurement Range: 1 nA Output Range: 20 V Integration Time: 2, 1, 0.5, 0.2, 0.1, 0.05, 0.03 s corresponding to the lines from top to bottom Equivalent Parallel Resistance of DUT: 10 T ohm Guard Capacitance of Measurement Path: 1 nF Agilent 4155C/4156C User’s Guide Vol.2, Edition 5 4-47 Quasi-static C-V Measurements Considering Measurement Accuracy Calculation Example of Measurement Accuracy: MPSMU, HPSMU 20 18 16 Reading Accuracy (%) 14 12 10 8 6 4 2 0 0.001 0.01 0.1 1 10 QSCV Measurement Voltage (V) 1.E-09 1.E-10 Offset Accuracy (F) Figure 4-20 1.E-11 1.E-12 0.001 0.01 0.1 1 10 QSCV Measurement Voltage (V) Conditions: Measurement Range: 1 nA Output Range: 20 V Integration Time: 2, 1, 0.5, 0.2, 0.1, 0.05, 0.03 s corresponding to the lines from top to bottom Equivalent Parallel Resistance of DUT: 10 G ohm Guard Capacitance of Measurement Path: 200 pF 4-48 Agilent 4155C/4156C User’s Guide Vol.2, Edition 5 Quasi-static C-V Measurements Considering Measurement Accuracy Calculation Example of Measurement Accuracy: MPSMU, HPSMU 20 18 16 Reading Accuracy (%) 14 12 10 8 6 4 2 0 0.001 0.01 0.1 1 10 QSCV Measurement Voltage (V) 1.E-09 1.E-10 Offset Accuracy (F) Figure 4-21 1.E-11 1.E-12 0.001 0.01 0.1 1 10 QSCV Measurement Voltage (V) Conditions: Measurement Range: 1 nA Output Range: 40 V Integration Time: 2, 1, 0.5, 0.2, 0.1, 0.05, 0.03 s corresponding to the lines from top to bottom Equivalent Parallel Resistance of DUT: 1 G ohm Guard Capacitance of Measurement Path: 200 pF Agilent 4155C/4156C User’s Guide Vol.2, Edition 5 4-49 Quasi-static C-V Measurements Considering Measurement Accuracy Calculation Example of Measurement Accuracy: MPSMU, HPSMU 50 Reading Accuracy (%) 40 30 20 10 0 0.001 0.01 0.1 1 10 QSCV Measurement Voltage (V) 1.E-09 1.E-10 Offset Accuracy (F) Figure 4-22 1.E-11 1.E-12 0.001 0.01 0.1 1 10 QSCV Measurement Voltage (V) Conditions: Measurement Range: 1 nA Output Range: 100 V Integration Time: 2, 1, 0.5, 0.2, 0.1, 0.05, 0.03 s corresponding to the lines from top to bottom Equivalent Parallel Resistance of DUT: 1 G ohm Guard Capacitance of Measurement Path: 200 pF 4-50 Agilent 4155C/4156C User’s Guide Vol.2, Edition 5 Quasi-static C-V Measurements Considering Measurement Accuracy Calculation Example of Measurement Accuracy: HPSMU 80 70 Reading Accuracy (%) 60 50 40 30 20 10 0 0.001 0.01 0.1 1 10 QSCV Measurement Voltage (V) 1.E-09 1.E-10 Offset Accuracy (F) Figure 4-23 1.E-11 1.E-12 0.001 0.01 0.1 1 10 QSCV Measurement Voltage (V) Conditions: Measurement Range: 1 nA Output Range: 200 V Integration Time: 2, 1, 0.5, 0.2, 0.1, 0.05, 0.03 s corresponding to the lines from top to bottom Equivalent Parallel Resistance of DUT: 1 G ohm Guard Capacitance of Measurement Path: 200 pF Agilent 4155C/4156C User’s Guide Vol.2, Edition 5 4-51 Quasi-static C-V Measurements Considering Measurement Accuracy Calculation Example of Measurement Accuracy: MPSMU, HPSMU 10 9 8 Reading Accuracy (%) 7 6 5 4 3 2 1 0 0.001 0.01 0.1 1 QSCV Measurement Voltage (V) 1.E-08 1.E-09 Offset Accuracy (F) Figure 4-24 1.E-10 1.E-11 1.E-12 1.E-13 0.001 0.01 0.1 1 QSCV Measurement Voltage (V) Conditions: Measurement Range: 10 nA Output Range: 2 V Integration Time: 2, 1, 0.5, 0.2, 0.1, 0.05, 0.03 s corresponding to the lines from top to bottom Equivalent Parallel Resistance of DUT: 10 T ohm Guard Capacitance of Measurement Path: 200 pF 4-52 Agilent 4155C/4156C User’s Guide Vol.2, Edition 5 Quasi-static C-V Measurements Considering Measurement Accuracy Calculation Example of Measurement Accuracy: MPSMU, HPSMU 20 18 16 Reading Accuracy (%) 14 12 10 8 6 4 2 0 0.001 0.01 0.1 1 10 1 10 QSCV Measurement Voltage (V) 1.E-09 1.E-10 Offset Accuracy (F) Figure 4-25 1.E-11 1.E-12 1.E-13 1.E-14 0.001 0.01 0.1 QSCV Measurement Voltage (V) Conditions: Measurement Range: 10 nA Output Range: 20 V Integration Time: 2, 1, 0.5, 0.2, 0.1, 0.05, 0.03 s corresponding to the lines from top to bottom Equivalent Parallel Resistance of DUT: 10 T ohm Guard Capacitance of Measurement Path: 200 pF Agilent 4155C/4156C User’s Guide Vol.2, Edition 5 4-53 Quasi-static C-V Measurements Considering Measurement Accuracy Calculation Example of Measurement Accuracy: MPSMU, HPSMU 20 18 Reading Accuracy (%) 16 14 12 10 8 6 4 2 0 0.001 0.01 0.1 1 10 QSCV Measurement Voltage (V) 1.E-09 1.E-10 Offset Accuracy (F) Figure 4-26 1.E-11 1.E-12 0.001 0.01 0.1 1 10 QSCV Measurement Voltage (V) Conditions: Measurement Range: 10 nA Output Range: 20 V Integration Time: 2, 1, 0.5, 0.2, 0.1, 0.05, 0.03 s corresponding to the lines from top to bottom Equivalent Parallel Resistance of DUT: 1 G ohm Guard Capacitance of Measurement Path: 200 pF 4-54 Agilent 4155C/4156C User’s Guide Vol.2, Edition 5 5 Stress Force Agilent 4155C/4156C User’s Guide Vol.2, Edition 5 Stress Force This chapter explains how to execute stress force, and consists of the following sections: • “Stress Function” • “Defining Stress Conditions” For details about the 4155C/4156C setup screens and entry fields, refer to Setup Screen Reference manual. For an example to use the stress force function, refer to Flash EEPROM Test in Sample Application Programs Guide Book. 5-2 Agilent 4155C/4156C User’s Guide Vol.2, Edition 5 Stress Force Stress Function Stress Function The 4155C/4156C can force both dc stress and ac stress (pulsed stress) as shown in the following figure. Stress is defined as the bias that the 4155C/4156C can monitor the bias output time correctly. To start stress force, press Stress front-panel key. displaying the stress force time The STRESS: STRESS FORCE screen is displayed while stress is being forced. On this screen, the time that stress has been forced is displayed and updated every second. Agilent 4155C/4156C User’s Guide Vol.2, Edition 5 5-3 Stress Force Stress Function Stress Output Channels Stress output channel is defined as the unit used to force stress. Available Units The 4155C/4156C can force dc voltage stress, dc current stress, and ac voltage stress (by PGUs in Agilent 41501A/B), but cannot force ac current stress. Table 5-1 shows available units and allowable modes for stress sources. Table 5-1 Available Units and Modes for Stress Force Units DC Voltage Stress SMU yes VSU yes PGU yes DC Current Stress AC Voltage Stress (Pulsed Source) yes yes Also, SMUs can be set to COMMON mode. Setting the Stress Channels You can set up units for the stress force state on the STRESS: CHANNEL DEFINITION screen independently from the measurement and standby states that you set on the CHANNELS: CHANNEL DEFINITION screen. For example, you can use the same SMU as a measurement channel in the measurement state, and as a stress force source in the stress force state. To set a unit to the stress channel, select SYNC in the FCTN field for the unit. If you select NSYNC, the 4155C/4156C does not monitor the bias output time for the unit. The unit is called as non-stress channel or bias channel in this manual. To use the stress force function, at least one unit must be set to the stress channel which the FCTN field is set to SYNC. You can select up to four stress source channels among SMUs, VSUs, and PGUs. If a unit is set to STBY ON on the CHANNELS: CHANNEL DEFINITION screen, the unit cannot be set to the stress channel. If you use two PGUs as ac pulse source, both PGUs must be the stress channel or the non-stress channel. This means that if PGU1 is a stress channel, PGU2 must be a stress channel, not non-stress channel. 5-4 Agilent 4155C/4156C User’s Guide Vol.2, Edition 5 Stress Force Stress Function Switching Channels Connected to DUT The 4155C/4156C can control Agilent 16440A SMU/Pulse Generator Selector to automatically switch units that are connected to a DUT pin. You set up this automatic control on the STRESS: CHANNEL DEFINITION screen. For example, the DUT pin is connected to a PGU for stress force when Stress front-panel key in the MEASUREMENT key group is pressed, then connected to an SMU for measurement when Single front-panel key is pressed. For details about how to control the 16440A selector, refer to Chapter 8. External Stress Source The following trigger functions allow you to force stress from more than 4 channels by using external pulse generators, voltage sources, or current sources. • gate trigger while stress is forced The 4155C/4156C can output a gate trigger while stress channels are forcing stress. For details about this gate trigger, refer to Chapter 8. • gate trigger of PGUs The output trigger terminal of PGUs (41501A/B) can output a gate trigger to external pulse generators. So, use this function if you need more than two ac stress channels. For example, you can use Agilent 8110A pulse generator to force ac stress by using this trigger. PGU outputs a gate trigger that is synchronized with pulse output. For details of the trigger signal, refer to Chapter 8. Agilent 4155C/4156C User’s Guide Vol.2, Edition 5 5-5 Stress Force Stress Function Stress Mode You set stress mode to the pulse count mode or duration mode. Pulse count mode You specify the pulse count (1 to 65535). The total stress time is determined by the pulse count and pulse period. The pulse count mode is used only when a PGU is used to force ac stress (that is, PGU is set to MODE=VPULSE and FCTN=SYNC on the STRESS:CHANNEL DEFINITION screen). Duration mode You specify the total stress time directly in seconds. Allowable range is 500 µs to 1 year (3.1536× 10⁷ s). setting resolution: • When the specified time is 10 s or less: 100 µs • When the specified time is more than 10 s: 10 ms 5-6 Agilent 4155C/4156C User’s Guide Vol.2, Edition 5 Stress Force Stress Function Stress Force Sequence This section explains the source output sequence when starting the stress force, and when finishing the stress force. • Output sequence from idle state to the stress state • Output sequence in the stress state • Output sequence from stress state to the idle state Output sequence (idle state to the stress force state) When the state changes from the idle state to the stress force state, the channels output the following values: ac stress (SYNC) channel: specified base value dc stress (SYNC) channel: 0 V or 0 A non-stress (NSYNC) channel: specified source value or pulse output The output sequence of the channels depends on the order specified on the MEASURE: OUTPUT SEQUENCE screen. For details about output sequence, refer to Chapter 7. Stress force sequence (in the stress force state) • stress output Stress force channels output stress at the same time when the stress start trigger is received. Stress start trigger is sent hold time after the last channel changes from idle state to stress force state. • stress stop Stress force channels stop stress at the same time. When you set up both ac and dc stress on the STRESS: CHANNEL DEFINITION screen, ac stress channels stop several microseconds before the dc stress channels. If you set delay time for pulse stress, finish of stress force time is after the period of the last pulse. (See Figure 5-1.) Agilent 4155C/4156C User’s Guide Vol.2, Edition 5 5-7 Stress Force Stress Function NOTE Pulse Waveform when Stress Stops When you set the duration mode or press the Stop front-panel key, be aware that stress force may stop during the pulse peak output as shown in the following figure: Sequence for returning to 0 V (stress force state to the idle state) When the state changes from the stress state to the idle state, the outputs of the channels are returned to 0 V in opposite order that forcing occurred. Delay time of PGUs When PGUs are set to VPULSE (ac source), you can set a delay time as follows: • If PGU is set to SYNC, the PGU waits the delay time (after the stress start trigger is received), then starts to force ac stress. • If PGU is set to NSYNC, the PGU waits the delay time (after stress force state starts), then starts pulse output. Example Figure 5-1 shows an example of output sequence when forcing stress. Figure 5-1 assumes the output sequence is set on the MEASURE: OUTPUT SEQUENCE screen as follows. 1. 2. 3. 4. 5. PGU1 SMU1 PGU2 SMU2 SMU3 5-8 Agilent 4155C/4156C User’s Guide Vol.2, Edition 5 Stress Force Stress Function Figure 5-1 Example of the Stress Force Sequence • output sequence from idle state to the stress state: • 1. PGU1 2. SMU1 3. PGU2 4. SMU2 5. SMU3 stress force sequence (in the stress force state): The stress force channels (PGU1, PGU2, and SMU3) start stress and stop stress at the same time. • output sequence from stress state to the idle state: 1. 2. 3. 4. 5. SMU3 SMU2 PGU2 SMU1 PGU1 Agilent 4155C/4156C User’s Guide Vol.2, Edition 5 5-9 Stress Force Stress Function Stress Stop Function at Abnormal Status On the STRESS: STRESS SETUP screen, you can select whether the stress stops or continues when an abnormal status occurs. When an 4155C/4156C is stopped by the stress stop function, a message is displayed in the message display area. The stress stop function is not effective until the stress has been forced for 10 seconds. For example, if STOP AT ANY ABNORM or STOP AT COMPLIANCE is selected and abnormal status occurs after forcing stress for 5 seconds, the stop function does not stop stress until stress is forced for 10 seconds. Setting the Stress Stop Function You can select one of the following in the STRESS Status field on the STRESS: STRESS SETUP screen: • STRESS Status = CONT AT ANY Stress continues even if an abnormal status occurs. • STRESS Status = STOP AT ANY ABNORM Stress stops if any abnormal status occurs. • STRESS Status = STOP AT COMPLIANCE Stress stops only if SMU reaches its compliance setting. STOP AT ANY ABNORM and STOP AT COMPLIANCE are available at the following conditions: • in PULSE COUNT mode: when pulse period × pulse count is more than 10 s. • in DURATION mode: when specified duration is more than 10 s. Abnormal Status Abnormal statuses are as follows: • SMU reaches its compliance setting. • Current of a VSU exceeds ±100 mA. • SMU or a VSU oscillates. • A/D converter overflow occurs. • Average current of PGU exceeds ±100 mA. 5-10 Agilent 4155C/4156C User’s Guide Vol.2, Edition 5 Stress Force Defining Stress Conditions Defining Stress Conditions This section covers the tasks for stress forcing. Two types of stress can be forced by the 4155C/4156C: • • dc stress • Dc voltage stress can be forced from SMUs, VSUs, or PGUs. • Dc current stress can be forced from SMUs. ac stress (also called pulsed stress) • Ac voltage stress can be forced from PGUs. • Ac current stress cannot be forced from the 4155C/4156C. Agilent 4155C/4156C User’s Guide Vol.2, Edition 5 5-11 Stress Force Defining Stress Conditions The following illustrates the basic procedures for stress forcing. 1 Connecting your DUT to the 4155C/4156C. See Chapter 10 for procedures. 2 Defining the stress units and constant output units. See “To Set up Stress Source Channels” on page 5-13. To use the selector, see Chapter 8. 3 Setting the stress forcing parameters and constant output value. The following tasks are described: 4 • “To Set up Stress Condition/Timing” • “To Set up ac (Pulse) Output” • “To Set up dc Output” Executing the stress forcing. See “To Force Stress” on page 5-20. 5-12 Agilent 4155C/4156C User’s Guide Vol.2, Edition 5 Stress Force Defining Stress Conditions To Set up Stress Source Channels 1. Press Stress key in the PAGE CONTROL key group. 2. Select CHANNEL DEF primary softkey. 3. In the MODE field of desired unit in CHANNELS area, select: • V secondary softkey for dc voltage stress forcing mode (SMU, VSU, and PGU). • I secondary softkey for dc current stress forcing mode (SMU). • VPULSE secondary softkey for ac voltage stress forcing mode (PGU). • COMMON secondary softkey for circuit common (SMU and GNDU). 4. In the NAME field of desired unit in the CHANNELS area, enter the stress channel name. 5. In the FCTN field of units that will be stress force channels, select SYNC secondary softkey. The stress channel name is only used for reference on the STRESS SETUP screen, not on any results screen. So, you can omit the name if desired. In the FCTN column, you can set up to four units to SYNC. At least one unit must be set to SYNC in the FCTN column. The SYNC (stress force) units all start forcing stress at the same time. The NSYNC (non-stress force units) channels start forcing stress in sequence when state changes to stress force state. For this timing, see “Stress Force Sequence” on page 5-7. If the row of a unit does not have settings, the unit is not used. To disable a unit In the row of the unit, select the DELETE ROW secondary softkey. The settings in the row are deleted. To set up non-stress output channels Perform the following procedure. 1. Perform first 3 steps described above. 2. In the FCTN field, select NSYNC secondary softkey. If you use two PGUs as pulsed sources (VPULSE), both must be SYNC or both NSYNC. Agilent 4155C/4156C User’s Guide Vol.2, Edition 5 5-13 Stress Force Defining Stress Conditions Example The following figure shows an example setup to set two PGUs to ac stress source. 5-14 Agilent 4155C/4156C User’s Guide Vol.2, Edition 5 Stress Force Defining Stress Conditions To Set up Stress Condition/Timing 1. Press Stress key in the PAGE CONTROL key group. 2. Select STRESS SETUP primary softkey. 3. In the MODE field of the STRESS MODE area, select: • DURATION secondary softkey to specify how long to force stress. • PULSE COUNT secondary softkey to specify how many pulses to output for force stress (for ac stress only). 4. In the DURATION or PULSE COUNT field, enter the duration or pulse count. You can select FREE RUN secondary softkey to output stress continuously. 5. In the STRESS Status field, select: • CONT AT ANY secondary softkey to continue forcing the stress even if an abnormal status occurs. • STOP AT ANY ABNORM secondary softkey to stop forcing the stress when any abnormal status occurs. • STOP AT COMPLIANCE secondary softkey to stop forcing the stress only when SMU reaches its compliance setting. STOP AT ANY ABNORM and STOP AT COMPLIANCE secondary softkeys are displayed only when specified duration is more than 10 s. If you set pulse count mode, these secondary softkeys are displayed only when pulse period × pulse count is more than 10 s. Stress stop function is not effective until stress has been forced for 10 s. In the duration mode, you set time (in seconds) for stress forcing. In the pulse count mode, you set an integer to specify how many pulses to output for stress forcing. Abnormal status means the following: • SMU reaches its compliance setting. • Current of VSU exceeds ±100 mA. • SMU or VSU oscillates. • A/D converter overflow occurs. • Average current of PGU exceeds ±100 mA. Agilent 4155C/4156C User’s Guide Vol.2, Edition 5 5-15 Stress Force Defining Stress Conditions To set hold time In the HOLD TIME field, set desired value. For the meaning of hold time, see “Stress Force Sequence” on page 5-7. Setting the Accumulated Stress Time The ACCUMULATED STRESS field shows the total stress that has been forced. If necessary, you can change the value in this field. If so, the ACCUMULATED STRESS field on the STRESS: STRESS FORCE screen also changes to the new value. Example The following figure shows an example setup of stress condition. 5-16 Agilent 4155C/4156C User’s Guide Vol.2, Edition 5 Stress Force Defining Stress Conditions To Set up ac (Pulse) Output 1. Press the Stress key in the PAGE CONTROL key group. Confirm that the following is set on the STRESS: CHANNEL DEFINITION screen for the PGUs that you want to set up for ac stress: • VPULSE is set in the MODE field. • SYNC is set in the FCTN field. 2. Select STRESS SETUP primary softkey. 3. In the PERIOD field, enter the pulse period. 4. In the WIDTH field, enter the pulse width. 5. In the DELAY TIME field, enter the delay time, which is the time from the stress start to the beginning of the pulse leading edge. See “Delay time” on page 5-18. 6. In the PEAK VALUE field, enter the pulse peak value. 7. In the BASE VALUE field, enter the pulse base value. 8. In LEADING TIME field, enter the leading-edge transition time of pulse. 9. In TRAILING TIME field, enter the trailing-edge transition time of pulse. The same period you set for PGU1 is also used for PGU2. For the other parameters, you can set different values for PGU1 and PGU2. To set other areas of the STRESS: STRESS SETUP screen, see “To Set up Stress Condition/Timing” on page 5-15. To modify the UNIT and NAME fields Modify UNIT and NAME fields on STRESS: CHANNEL DEFINITION screen. To set output impedance of PGU1 or PGU2 In the IMPEDANCE field, select: • LOW secondary softkey to set output impedance to low (approximately zero). • 50 ohm secondary softkey to set output impedance to 50 Ω. Agilent 4155C/4156C User’s Guide Vol.2, Edition 5 5-17 Stress Force Defining Stress Conditions Delay time The following figure shows the meaning of delay time. Example The following figure shows an example to set up ac stress. 5-18 Agilent 4155C/4156C User’s Guide Vol.2, Edition 5 Stress Force Defining Stress Conditions To Set up dc Output 1. Press Stress key in the PAGE CONTROL key group. Confirm that the following is set on the STRESS: CHANNEL DEFINITION screen for the units that you want to set up for dc stress: • V or I is set in the MODE field. • SYNC is set in the FCTN field. 2. Select STRESS SETUP primary softkey. 3. In the SOURCE field for the desired unit in the CONSTANT area, enter the desired dc stress value. 4. In the COMPLIANCE field in the CONSTANT area, enter the compliance value. The non-stress (NSYNC) constant units also appear in the CONSTANT area. You can set SOURCE and COMPLIANCE values for these units the same way as you set the dc stress units. To set other areas of the STRESS: STRESS SETUP screen, see “To Set up Stress Condition/Timing” on page 5-15. To modify the UNIT, NAME, and MODE fields Modify the UNIT, NAME, and MODE fields on the STRESS: CHANNEL DEFINITION screen. Example The following figure shows an example setup to set source (SMU1) to 5.00 V and compliance (SMU1) to 1.00 mA. Agilent 4155C/4156C User’s Guide Vol.2, Edition 5 5-19 Stress Force Defining Stress Conditions To Force Stress Press Stress key in the MEASUREMENT key group. The STRESS area shows the specified stress duration time. Even if you set STRESS MODE to PULSE COUNT, the stress duration time is calculated and shown in seconds. The ACCUMULATED STRESS area shows the total stress that has already been forced. To change the stress time (duration mode) Select CHANGE DURATON secondary softkey, then enter desired value. The CHANGE DURATON secondary softkey is displayed only if the DURATION mode is selected on the STRESS: STRESS SETUP screen. To change pulse count (pulse count mode) Select CHANGE PLS CNT secondary softkey, then enter desired value. The CHANGE PLS CNT secondary softkey is displayed only if the PULSE COUNT mode is selected on the STRESS: STRESS SETUP screen. To reset STATUS value to 0 s and 0 % Select RESET STATUS secondary softkey. To reset ACCUMULATED STRESS value to 0 s Select RESET ACCUM STRESS secondary softkey. To change ACCUMULATED STRESS value On the STRESS: STRESS SETUP screen, enter the desired value in the ACCUMULATED STRESS field. 5-20 Agilent 4155C/4156C User’s Guide Vol.2, Edition 5 Stress Force Defining Stress Conditions Example The following figure shows an example of STRESS: STRESS FORCE screen. Agilent 4155C/4156C User’s Guide Vol.2, Edition 5 5-21 Stress Force Defining Stress Conditions 5-22 Agilent 4155C/4156C User’s Guide Vol.2, Edition 5 6 Analyzing Measurement Results Agilent 4155C/4156C User’s Guide Vol.2, Edition 5 Analyzing Measurement Results You can analyze measurement results by using lines, markers, and cursors on the Agilent 4155C/4156C screen. If you want to display lines and marker automatically, set up the DISPLAY: ANALYSIS SETUP screen before starting measurements. Then, after the measurements, the lines and marker are positioned automatically according to the setup. This chapter consists of the following sections: • “Analysis Function” • “Manual Analysis” • “Automatic Analysis” 6-2 Agilent 4155C/4156C User’s Guide Vol.2, Edition 5 Analyzing Measurement Results Analysis Function Analysis Function The 4155C/4156C provides the following functions for analyzing measurement results: • “Marker on the GRAPH/LIST: GRAPHICS screen” • “Marker on the GRAPH/LIST: LIST screen” • “Cursor” • “Line Drawing” • “Scaling Functions” • “Overlay Display Function” • “Automatic Analysis Function” Agilent 4155C/4156C User’s Guide Vol.2, Edition 5 6-3 Analyzing Measurement Results Analysis Function Marker on the GRAPH/LIST: GRAPHICS screen Figure 6-1 Markers on the GRAPH/LIST: GRAPHICS screen You can display the markers on the plotted measurement curves on the GRAPH/LIST: GRAPHICS screen by selecting MARKER/CURSOR primary softkey, then selecting MARKER secondary softkey. The marker for Y1 axis is a circle (o), and the marker for Y2 axis is an asterisk (*). The active marker depends on the selected axis. Markers have the following functions on the GRAPH/LIST: GRAPHICS screen: • displaying values of measurement curve. The X, Y1, or Y2 coordinate values at the marker location are displayed. • specifying a point at which to draw a tangent line For tangent line mode, the marker is used to specify the position at which to draw a tangent to the measurement curve. Refer to “Line Drawing” on page 6-9. • displaying values of data variables The data variable values at the marker location are displayed. 6-4 Agilent 4155C/4156C User’s Guide Vol.2, Edition 5 Analyzing Measurement Results Analysis Function • specifying the position for direct keyboard calculation If you enter an expression that has data variables related to measurement points, the value of the expression at the marker position is displayed. • indicating measurement point determined by auto analysis expression If you set up an expression for the marker on DISPLAY: ANALYSIS SETUP screen, the marker moves to the point determined by the expression after auto analysis is performed. Moving the marker Basically, you can move the markers on measurement points of the measurement curve by using the knob on the front panel. In addition to the basic movement, the following functions allow you to quickly move the marker to the desired position. • Interpolation Mode Enables you to move the marker on lines between adjacent measurement points. • Marker to Min/Max Moves the marker to the maximum or minimum measurement point value. • Direct Movement Moves the marker directly to specified coordinates on measurement curve. • Marker Skip Moves the marker to the next measurement curve. This function only has meaning for subordinate sweep measurements and append measurements. Agilent 4155C/4156C User’s Guide Vol.2, Edition 5 6-5 Analyzing Measurement Results Analysis Function Marker on the GRAPH/LIST: LIST screen Figure 6-2 Marker on the GRAPH/LIST: LIST screen When marker function is enabled on GRAPH/LIST: LIST screen, a marker (highlighted row) is displayed. Marker has following functions on this screen: • displaying values of data variables The data variable values are displayed for the highlighted row. • specifying the position for direct keyboard calculation If you enter an expression that has data variables related to measurement points, the value of the expression for the highlighted row is displayed. • indicating measurement point determined by auto analysis expression If you set up an expression for the marker on DISPLAY: ANALYSIS SETUP screen, the marker moves to the row determined by the expression after auto analysis is performed. 6-6 Agilent 4155C/4156C User’s Guide Vol.2, Edition 5 Analyzing Measurement Results Analysis Function Moving the marker Basically, you can move the marker up or down by using the rotary knob on the front panel or by using the upper arrow and down arrow front-panel keys. If you have defined more than four variable values, you can scroll right or left by using the left arrow or right arrow front-panel key. In addition to the basic movement, the following functions allow you to quickly move the marker to the desired position. For these functions, the row marker becomes a one cell pointer, so these functions are for the column that contains the pointer, not the entire row. • Marker to Min/Max Moves the pointer to the maximum or minimum measurement point value. • Direct Movement Moves the pointer directly to the value that is closest to the specified value. • Marker Skip Moves the pointer to data for the next measurement curve. This function only has meaning for subordinate sweep measurements and append measurements. Agilent 4155C/4156C User’s Guide Vol.2, Edition 5 6-7 Analyzing Measurement Results Analysis Function Cursor Cursors are used to specify the position for line drawing or scaling functions on the GRAPH/LIST: GRAPHICS screen. Refer to “Line Drawing” on page 6-9 and “Scaling Functions” on page 6-11. You can select a short cursor, which is a cross "`+'", or a long cursor, which is a cross with long lines. You can move the cursor anywhere in the plotting area by using arrow keys of the Marker/Cursor key group. Figure 6-3 Cursors on the GRAPH/LIST: GRAPHICS screen 6-8 Agilent 4155C/4156C User’s Guide Vol.2, Edition 5 Analyzing Measurement Results Analysis Function Line Drawing You can draw up to two lines in plotting area on GRAPH/LIST: GRAPHICS screen. To draw lines, you can select one of following four line modes: • Normal line mode: can draw a line through two cursors. • Grad line mode: can draw a line through a cursor with specified gradient. Agilent 4155C/4156C User’s Guide Vol.2, Edition 5 6-9 Analyzing Measurement Results Analysis Function • Tangent line mode: can draw tangent line to marker, which is on measurement curve. • Regression line mode: can draw regression line within area specified by two cursors. 6-10 Agilent 4155C/4156C User’s Guide Vol.2, Edition 5 Analyzing Measurement Results Analysis Function Scaling Functions You can change the axis scales after plotting the measurement results on the GRAPH/LIST: GRAPHICS screen. The following scaling functions are provided: • Autoscaling Changes X and Y-axis scaling to fit the measurement curve. • Zooming in Changes the scaling to half the present scaling. This enlarges the measurement curve on the plot area. • Zooming out Changes the scaling to double the present scaling. This reduces the measurement curve on the plot area. • Centering at cursor Centers the display around the cursor at the same resolution. Agilent 4155C/4156C User’s Guide Vol.2, Edition 5 6-11 Analyzing Measurement Results Analysis Function Overlay Display Function You can overlay a measurement curve (that was previously saved into one of the four internal memories) onto the curve that is presently displayed on the GRAPH/LIST: GRAPHICS screen. This is useful for comparing measurement results. Overlay Display Information You can use following information of overlaid curve instead of present information: • Axis information • Cursor and marker position (x, y1, y2) • Line x interrupt, y1 interrupt and gradient, y2 interrupt and gradient • List of the data variables Adjusting axes You can use the axis scaling of overlaid plane instead of present scaling. Automatic Analysis Function This function can automatically draw up to two lines and position a marker on the plotting area of the graph screen. You set up this function on the DISPLAY: ANALYSIS SETUP screen. This function is performed automatically when: • measurement finishes. • AUTO ANALYSIS secondary softkey is pressed. 6-12 Agilent 4155C/4156C User’s Guide Vol.2, Edition 5 Analyzing Measurement Results Manual Analysis Manual Analysis You can position lines, markers, and cursors by using front-panel keys, rotary knob, and softkeys. This section covers the following manual analysis tasks: Marker and cursor: • Display range: Line: Another graph functions: Analysis on the LIST screen: “To Specify a Measurement Point on Curve” on page 6-14 • “To Specify between Measurement Points on Curve” on page 6-16 • “To Display or Move Cursor” on page 6-18 • “To Adjust Display Range to Measurement Curve Automatically” on page 6-19 • “To Zoom the Display Range” on page 6-19 • “To Center Display at Cursor Location” on page 6-20 • “To Draw Line through Two Specified Points” on page 6-20 • “To Draw Line through Specified Point with Specified Gradient” on page 6-22 • “To Draw Tangent to Specified Point of Measurement Curve” on page 6-24 • “To Draw Regression Line for Specified Region” on page 6-26 • “To Display and Select a Line” on page 6-28 • “To Display Grid on the Graph” on page 6-28 • “To Change Data Variable on Graph” on page 6-29 • “To Change Range of X or Y Axis Scale” on page 6-30 • “To Change Variable Assigned to X, Y1, or Y2 Axis” on page 6-31 • “To Overlay an Internal Memory Measurement Curve onto Plotting Area” on page 6-32 • “To Scroll the LIST screen” on page 6-34 • “To Display or Move Marker on LIST screen” on page 6-35 • “To Change Variables of LIST screen” on page 6-36 Agilent 4155C/4156C User’s Guide Vol.2, Edition 5 6-13 Analyzing Measurement Results Manual Analysis To Specify a Measurement Point on Curve 1. Select MARKER/CURSOR primary softkey. 2. Set MARKER secondary softkey to ON. Marker and marker coordinates are displayed. Selecting MARKER secondary softkey toggles between ON and OFF. 3. (if both Y1 and Y2 axis are set up) Select the desired marker (axis) by using AXIS primary softkey. The selected marker is highlighted. Selecting AXIS primary softkey toggles between Y1 and Y2. 4. Rotate the rotary knob to move the marker to desired measurement point. If both Y1 and Y2 axis are set up, a circle marker (o) is displayed on measurement curve of Y1 axis, and an asterisk marker (*) is displayed on measurement curve of Y2 axis. The MARKER coordinate fields indicate the location of markers. The first, second, and third fields are X, Y1, and Y2 coordinates, respectively. X and Y1 indicate location of marker on Y1 curve. X and Y2 indicate location of marker on Y2 curve. To turn off markers Set MARKER secondary softkey to OFF. To move marker to maximum or minimum value of measurement curve Select MARKER MIN/MAX secondary softkey. The marker searches for minimum or maximum value in measurement order from the present location every time you select the MARKER MIN/MAX secondary softkey. To move marker to next VAR2 step or append curve Select MARKER SKIP secondary softkey. Marker moves to next VAR2 step curve or next append curve every time you select MARKER SKIP secondary softkey. To move marker fast Press Fast front-panel key of the MARKER/CURSOR key group while rotating rotary knob. 6-14 Agilent 4155C/4156C User’s Guide Vol.2, Edition 5 Analyzing Measurement Results Manual Analysis Example The following figure shows an example to move marker to desired measurement point and to set the Y1 axis marker to active. Agilent 4155C/4156C User’s Guide Vol.2, Edition 5 6-15 Analyzing Measurement Results Manual Analysis To Specify between Measurement Points on Curve 1. Select MARKER/CURSOR primary softkey. 2. Set MARKER secondary softkey to ON. Marker and marker coordinates are displayed. Selecting MARKER toggles between ON and OFF. 3. (if both Y1 and Y2 axis are set up) Select the desired marker (axis) by using AXIS primary softkey. The selected marker is highlighted. Selecting AXIS primary softkey toggles between Y1 and Y2. 4. Set INTERPOLATE secondary softkey to ON. Selecting INTERPOLATE secondary softkey toggles between ON and OFF. 5. Rotate rotary knob to move the marker to desired measurement point. If both Y1 and Y2 axis are set up, a circle marker (o) is displayed on measurement curve of Y1 axis, and an asterisk marker (*) is displayed on measurement curve of Y2 axis. The MARKER coordinate fields indicate the location of markers. The first, second, and third fields are X, Y1, and Y2 coordinates, respectively. X and Y1 indicate location of marker on Y1 curve. X and Y2 indicate location of marker on Y2 curve. To turn off markers Set the MARKER secondary softkey to OFF. To move marker to maximum or minimum value of measurement curve Select MARKER MIN/MAX secondary softkey. The marker searches for minimum or maximum value in measurement order from the present location every time you select the MARKER MIN/MAX secondary softkey. To move marker to next VAR2 step or append curve Select MARKER SKIP secondary softkey. Marker moves to next VAR2 step curve or next append curve every time you select MARKER SKIP. To move marker fast Press Fast front-panel key of the MARKER/CURSOR key group while rotating rotary knob. 6-16 Agilent 4155C/4156C User’s Guide Vol.2, Edition 5 Analyzing Measurement Results Manual Analysis Example The following figure shows an example to move marker to points between measurement points by setting INTERPOLATE softkey to ON. Agilent 4155C/4156C User’s Guide Vol.2, Edition 5 6-17 Analyzing Measurement Results Manual Analysis To Display or Move Cursor 1. Select MARKER/CURSOR primary softkey. 2. Set CURSOR secondary softkey to SHORT or LONG. Short or long cursor and cursor coordinates are displayed. Selecting CURSOR secondary softkey toggles as follows: OFF → SHORT → LONG → OFF 3. Move the cursor by using arrow keys of the MARKER/CURSOR key group. The CURSOR coordinate fields indicate the location of cursor. The first, second, and third fields are X, Y1, and Y2 coordinates, respectively. To move cursor diagonally Press two adjacent arrow keys of the MARKER/CURSOR key group simultaneously. To turn off cursor Set CURSOR secondary softkey to OFF. To move cursor fast Press arrow keys and Fast key of the MARKER/CURSOR key group simultaneously. Example The following figure shows an example to display a short cursor. 6-18 Agilent 4155C/4156C User’s Guide Vol.2, Edition 5 Analyzing Measurement Results Manual Analysis To Adjust Display Range to Measurement Curve Automatically 1. Select SCALING primary softkey. 2. (if both Y1 and Y2 axis are set up) Select desired measurement curve by using AXIS primary softkey. 3. Select AUTO SCALING secondary softkey. Scale is changed automatically to fit the selected measurement curve. When you set VAR2 parameter, or when you perform append measurement, the scale is changed so that all measurement curves can be displayed. To cancel auto scaling Select CANCEL SCALING secondary softkey. To Zoom the Display Range 1. Position the cursor at the center of area that you want to zoom. (For details about displaying and moving cursor, see “To Display or Move Cursor” on page 6-18.) 2. Select SCALING primary softkey. 3. Select: • ZOOM IN secondary softkey to change the X and Y scaling to half the present scaling. This enlarges measurement curve on the plot area. • ZOOM OUT secondary softkey to change the X and Y scaling to double the present scaling. This reduces measurement curve on the plot area. • The X and Y scaling is changed, and cursor is moved to the center of the plotting area. If no cursor is displayed before step 3, performing step 3 displays a long cursor at the center of the plotting area, then zoom is performed. To return to original scaling Select CANCEL SCALING secondary softkey. Agilent 4155C/4156C User’s Guide Vol.2, Edition 5 6-19 Analyzing Measurement Results Manual Analysis To Center Display at Cursor Location 1. Position cursor at the point where you want to center the plotting area. (For details about displaying and moving cursor, see “To Display or Move Cursor” on page 6-18.) 2. Select SCALING primary softkey. 3. (if both Y1 and Y2 axis are set up) Select desired measurement curve by using AXIS primary softkey. 4. Select CENTER AT CURSOR secondary softkey. The plotting area is centered around the cursor location. If no cursor is displayed before step 4, performing step 4 displays a long cursor at the center of the plotting area. To return plotting area to original position Select CANCEL SCALING secondary softkey. To Draw Line through Two Specified Points 1. Select LINE primary softkey. 2. Set LINE SELECT softkey to 1 or 2. Selecting this softkey toggles the setting. 3. Set LINE secondary softkey to ON. A line and two cursors are displayed. Selecting LINE secondary softkey toggles as follows: OFF → ON → OFF The line mode should be normal. So (GRAD MODE, TANGENT MODE, or REGRESS MODE) softkeys should not be highlighted. If one of these softkeys is highlighted, turn off by pressing the softkey. 4. Move cursors to desired locations by using arrow keys of the MARKER/CURSOR key group. To select the cursor you want to move, use the SELECT CURSOR secondary softkey. If it seems that only one cursor is displayed, the cursors are at the same location. When lines are displayed and when ON is set in the LINE PARAMETER field on the DISPLAY: DISPLAY SETUP screen, their X and Y intercepts and gradients are also displayed in the plotting area. 6-20 Agilent 4155C/4156C User’s Guide Vol.2, Edition 5 Analyzing Measurement Results Manual Analysis To turn off the line intercept and gradient display Select DISPLAY SETUP primary softkey, then set LINE PRMTRS secondary softkey to OFF. To turn off the data variable display area Use the following procedure: 1. Select DISPLAY SETUP primary softkey. 2. Set DATA VAR secondary softkey to OFF. To move the selected cursor to the selected marker position Select CURSOR TO MARKER secondary softkey. Example The following figure shows an example to draw a line through two specified points. Agilent 4155C/4156C User’s Guide Vol.2, Edition 5 6-21 Analyzing Measurement Results Manual Analysis To Draw Line through Specified Point with Specified Gradient 1. Select LINE primary softkey. 2. Set LINE SELECT softkey to 1 or 2. Selecting this softkey toggles the setting. 3. Set LINE secondary softkey to ON. A line and two cursors are displayed. Selecting LINE secondary softkey toggles as follows: OFF → ON → OFF 4. Select GRAD MODE secondary softkey if it is not highlighted. Softkey becomes highlighted. One cursor disappears (if there are two cursors in the plotting area before this step). Selecting GRAD MODE secondary softkey toggles between highlighted and not highlighted. 5. Move the cursor to desired location by using arrow keys of the MARKER/CURSOR key group. 6. Select GRAD VALUE secondary softkey, then enter gradient value. The line goes through the cursor with specified gradient. When lines are displayed and when ON is set in the LINE PARAMETER field on the DISPLAY: DISPLAY SETUP screen, the X and Y intercepts and gradients of selected line are also displayed in the plotting area. To turn off the line intercept and gradient display Select DISPLAY SETUP primary softkey, then set LINE PRMTRS secondary softkey to OFF. To turn off the data variable display area Use the following procedure: 1. Select DISPLAY SETUP primary softkey. 2. Set DATA VAR secondary softkey to OFF. To move the selected cursor to the selected marker position Select CURSOR TO MARKER secondary softkey. 6-22 Agilent 4155C/4156C User’s Guide Vol.2, Edition 5 Analyzing Measurement Results Manual Analysis Example The following figure shows an example to draw a line through specified point with specified gradient. Agilent 4155C/4156C User’s Guide Vol.2, Edition 5 6-23 Analyzing Measurement Results Manual Analysis To Draw Tangent to Specified Point of Measurement Curve 1. Press LINE primary softkey. 2. Set LINE SELECT softkey to 1 or 2. Selecting this softkey toggles the setting. 3. Set LINE secondary softkey to ON. A line and two cursors are displayed. Selecting the LINE secondary softkey toggles as follows: OFF → ON → OFF 4. Select TANGENT MODE secondary softkey if it is not highlighted. Softkey becomes highlighted. The cursors disappear and marker appears. Selecting TANGENT MODE toggles between highlighted and not highlighted. 5. Move marker to the desired measurement point by rotating rotary knob. When lines are displayed and when ON is set in the LINE PARAMETER field on the DISPLAY: DISPLAY SETUP screen, the X and Y intercepts and gradients of selected line are also displayed in the plotting area. To move marker to next VAR2 or next append curve Select MARKER SKIP secondary softkey. Marker moves to next VAR2 step curve or next append curve every time you press MARKER SKIP. To turn off the line intercept and gradient display Select DISPLAY SETUP primary softkey, then set LINE PRMTRS secondary softkey to OFF. To turn off the data variable display area Use the following procedure: 1. Select DISPLAY SETUP primary softkey. 2. Set DATA VAR secondary softkey to OFF. To move marker between two adjacent measurement points See “To Specify between Measurement Points on Curve” on page 6-16. 6-24 Agilent 4155C/4156C User’s Guide Vol.2, Edition 5 Analyzing Measurement Results Manual Analysis Example The following figure shows an example to draw a tangent to a specified measurement point. Agilent 4155C/4156C User’s Guide Vol.2, Edition 5 6-25 Analyzing Measurement Results Manual Analysis To Draw Regression Line for Specified Region 1. Select MARKER/CURSOR primary softkey, then set the MARKER secondary softkey to ON. 2. Select the desired axis for regression calculation by selecting AXIS primary softkey (if both Y1 and Y2 axis are set up). Then, if necessary, move marker to desired measurement curve by selecting MARKER SKIP secondary softkey. 3. Select LINE primary softkey. 4. Set LINE SELECT softkey to 1 or 2. Selecting this softkey toggles the setting. 5. Set LINE secondary softkey to ON. A line and two cursors are displayed. Selecting LINE secondary softkey toggles as follows: OFF → ON → OFF 6. Select REGRESS MODE secondary softkey if it is not highlighted. Softkey becomes highlighted. Selecting REGRESS MODE secondary softkey toggles between highlighted and not highlighted. 7. Move cursors to specify range of regression calculation. (Use arrow keys of the MARKER/CURSOR key group to move cursors to desired location.) • To select the cursor you want to move, use the SELECT CURSOR secondary softkey. The range used for calculating the regression line is defined by the position of the two cursors as shown in the following figure. 6-26 Agilent 4155C/4156C User’s Guide Vol.2, Edition 5 Analyzing Measurement Results Manual Analysis If it seems that only one cursor is displayed, the cursors are at the same location. When regression lines are displayed and when ON is set in the LINE PARAMETER field on the DISPLAY: DISPLAY SETUP screen, the X and Y intercepts and gradient of selected line are also displayed in the plotting area. To turn off the line intercept and gradient display Select DISPLAY SETUP primary softkey, then set LINE PRMTRS secondary softkey to OFF. To turn off the data variable display area Use the following procedure: 1. Select DISPLAY SETUP primary softkey. 2. Set DATA VAR secondary softkey to OFF. To move selected cursor to the selected marker position Select CURSOR TO MARKER secondary softkey. Example The following figure shows an example to draw a regression line for the specified region. Agilent 4155C/4156C User’s Guide Vol.2, Edition 5 6-27 Analyzing Measurement Results Manual Analysis To Display and Select a Line 1. Select LINE primary softkey. 2. Set LINE SELECT softkey to 1 or 2. Selecting this softkey toggles the setting. 3. Set LINE secondary softkey to ON. Selected line and two cursors are displayed. Selecting the LINE secondary softkey toggles as follows: OFF → ON → OFF Set LINE SELECT secondary softkey to desired line (1 or 2). Selected line is highlighted. To select line to analyze Selecting LINE SELECT secondary softkey toggles as follows: 1 → 2 → NONE → 1 The following are independent for each line. So, changing the active line also changes the following: • locations of marker and cursors • X and Y intercepts and gradient To Display Grid on the Graph 1. Select DISPLAY SETUP primary softkey. 2. Set GRID secondary softkey to ON. Grid is displayed. Selecting GRID secondary softkey toggles between ON and OFF. To turn off grid Set GRID secondary softkey to OFF. 6-28 Agilent 4155C/4156C User’s Guide Vol.2, Edition 5 Analyzing Measurement Results Manual Analysis To Change Data Variable on Graph 1. Select DISPLAY SETUP primary softkey. 2. Select RE-SETUP GRAPH secondary softkey. 3. Move the pointer to desired data variable field by using the arrow keys, then select secondary softkey to enter the desired variable name. 4. Select EXIT primary softkey to exit the RE-SETUP GRAPH mode. To exit without changing data variable Select CANCEL primary softkey. Example The following figure shows an example setup to change the data variable to be displayed. Agilent 4155C/4156C User’s Guide Vol.2, Edition 5 6-29 Analyzing Measurement Results Manual Analysis To Change Range of X or Y Axis Scale 1. Select DISPLAY SETUP primary softkey. 2. Select RE-SETUP GRAPH secondary softkey. 3. Move pointer to maximum or minimum value field of X or Y axis scale by using the arrow keys, then edit the setup value by using ENTRY keys or rotary knob. 4. Select EXIT primary softkey to exit RE-SETUP GRAPH mode. To exit without changing range of X or Y axis scale Select CANCEL primary softkey. Example The following figure shows an example setup to change maximum value of Y1 axis. 6-30 Agilent 4155C/4156C User’s Guide Vol.2, Edition 5 Analyzing Measurement Results Manual Analysis To Change Variable Assigned to X, Y1, or Y2 Axis 1. Select DISPLAY SETUP primary softkey. 2. Select RE-SETUP GRAPH secondary softkey. 3. Move pointer to variable field of X, Y1, or Y2 axis by using arrow keys, then select secondary softkey to set the desired variable. 4. Select EXIT primary softkey to exit RE-SETUP GRAPH mode. To exit without changing variable assigned to X, Y1, or Y2 axis Select CANCEL primary softkey. Example The following figure shows an example setup to change the variable that is assigned to Y1 axis. Agilent 4155C/4156C User’s Guide Vol.2, Edition 5 6-31 Analyzing Measurement Results Manual Analysis To Overlay an Internal Memory Measurement Curve onto Plotting Area This section explains how to overlay a measurement curve (that was stored into an internal memory) onto plotting area. To store a measurement curve into an internal memory, refer to User's Guide General Information. 1. Select DISPLAY SETUP primary softkey. 2. Set OVERLAY PLANE secondary softkey to the desired memory number. Selected measurement curve is overlaid onto plotting area. Selecting OVERLAY PLANE secondary softkey toggles as follows: OFF → 1 → 2 → 3 → 4 → OFF To display information of overlay measurement curve Select SHOW OVERLAY INFO secondary softkey. The following information of overlay measurement curve overwrites the information of the present curve. • axis names and axis scales • cursor and marker coordinates, line x-, y1-, y2-interrupt and gradient • data variables To display information of original curve again, select the EXIT primary softkey. To change the present scale to the same scale as overlay curve Select SCALE TO OVERLAY secondary softkey. To return to the original scale, you need to select SCALING primary softkey, then select CANCEL SCALING secondary softkey. 6-32 Agilent 4155C/4156C User’s Guide Vol.2, Edition 5 Analyzing Measurement Results Manual Analysis Example The following figure shows an example to overlay a measurement curve (that is stored in internal memory 1) onto the presently displayed measurement curve. Agilent 4155C/4156C User’s Guide Vol.2, Edition 5 6-33 Analyzing Measurement Results Manual Analysis To Scroll the LIST screen • Press an arrow key of the MARKER/CURSOR key group. List scrolls in direction of selected arrow. List can be scrolled even while performing measurements. When marker is displayed, marker does not move during scrolling. To scroll list fast Press Fast key of the MARKER/CURSOR key group while pressing an arrow key of the MARKER/CURSOR key group. 6-34 Agilent 4155C/4156C User’s Guide Vol.2, Edition 5 Analyzing Measurement Results Manual Analysis To Display or Move Marker on LIST screen 1. Select MARKER primary softkey. 2. Set MARKER secondary softkey to ON. The marker is displayed. Selecting MARKER secondary softkey toggles between ON and OFF. 3. Rotate rotary knob to move the marker to desired measurement point. To turn off marker Set MARKER secondary softkey to OFF. To move marker to next VAR2 step Select MARKER SKIP secondary softkey. Marker moves to next VAR2 step data or next append data every time you select MARKER SKIP secondary softkey. To move marker to next append data Select NEXT APPEND secondary softkey. Marker moves to next append data every time you select NEXT APPEND secondary softkey. Example The following figure shows an example to display marker. Agilent 4155C/4156C User’s Guide Vol.2, Edition 5 6-35 Analyzing Measurement Results Manual Analysis To Change Variables of LIST screen 1. Select RE-SETUP primary softkey. 2. Move pointer to desired column variable or data variable field by using arrow keys, then select secondary softkey of desired variable. 3. Select EXIT primary softkey to exit RE-SETUP LIST mode. To exit without changing LIST variables Select CANCEL primary softkey. Example The following figure shows an example to change the LIST variables. 6-36 Agilent 4155C/4156C User’s Guide Vol.2, Edition 5 Analyzing Measurement Results Automatic Analysis Automatic Analysis You set up automatic analysis before the measurement by using the DISPLAY: ANALYSIS SETUP screen. Then, after measurement is performed, the marker and lines are automatically positioned according to automatic analysis setup. This section covers the following automatic analysis tasks: NOTE • “To Draw Line by Specifying Two Points” on page 6-38 • “To Draw Line by Specifying Gradient and One Point” on page 6-40 • “To Draw Tangent to Specified Measurement Point” on page 6-42 • “To Draw Regression Line by Specifying Two Points” on page 6-44 • “To Display Marker at Specified Point” on page 6-47 Execution Timing of the Automatic Analysis Function You set up automatic analysis on the DISPLAY: ANALYSIS SETUP screen. Automatic analysis function is executed: • after a measurement is executed by Single or Append front-panel key. • when the Stop front-panel key is pressed to stop the measurement. • after each measurement execution (before the next measurement execution). • when you select the AUTO ANALYSIS secondary softkey after selecting the MARKER/CURSOR primary softkey on the GRAPH/LIST: GRAPH or GRAPH/LIST: LIST screen. • when you return to the GRAPH/LIST: GRAPH or GRAPH/LIST: LIST screen after changing the condition of the automatic analysis function on the DISPLAY: ANALYSIS SETUP screen. If you define both the automatic marker positioning and automatic line drawing functions, the functions are executed in the following order: 1. Automatic line drawing for LINE1. 2. Automatic line drawing for LINE2. 3. Automatic marker positioning. Agilent 4155C/4156C User’s Guide Vol.2, Edition 5 6-37 Analyzing Measurement Results Automatic Analysis To Draw Line by Specifying Two Points 1. Press Display front-panel key. 2. Confirm that ON is set on the LINE secondary softkey on the GRAPH/LIST: GRAPHICS screen. 3. Select ANLYSIS SETUP primary softkey. The DISPLAY: ANALYSIS SETUP screen is displayed. 4. In field (1), select NORMAL secondary softkey. 5. In field (2), select secondary softkey to specify desired axis. 6. In field (3), select: • BY X-Y COORDINATE secondary softkey to specify a point by X-Y coordinate mode. (Go to step 6.) • BY DATA CONDITION secondary softkey to specify a point by data condition mode. (Go to step 7.) 7. If you selected BY X-Y COORDINATE secondary softkey: a. In the X field, enter desired expression to specify X coordinate. b. In the Y field, enter desired expression to specify Y coordinate. c. Go to step 8. 8. If you selected BY DATA CONDITION secondary softkey: a. In field (4), select secondary softkey to set desired data variable name. b. In field (5), enter desired expression. c. In field (6), select: • AFTER secondary softkey if you want to set a search start condition for finding specified point. • DISABLE secondary softkey to disable (clear) the AFTER settings. d. If you selected AFTER, select secondary softkey to enter desired data variable in field (7). e. If you selected AFTER, enter desired expression in field (8). 9. Specify the other point by step 5, then step 6 or 7. 6-38 Agilent 4155C/4156C User’s Guide Vol.2, Edition 5 Analyzing Measurement Results Automatic Analysis Data condition mode specifies a point related to the measurement curve. So, if no measurement data satisfy the specified condition, the nearest measurement point is used. For the meaning of expression that you can enter in step 6 or 7, see Chapter 8. To specify a point between two measurement points Set Interpolate field to ON. To disable (clear) the settings Move the pointer to field (1), then select DISABLE secondary softkey. Setup fields disappear. Example The following figure shows an example setup to automatically draw a line through two specified points. One point is specified by X-Y coordinate mode and other point is specified by data condition mode. Agilent 4155C/4156C User’s Guide Vol.2, Edition 5 6-39 Analyzing Measurement Results Automatic Analysis To Draw Line by Specifying Gradient and One Point 1. Press Display front-panel key. 2. Confirm that ON is set on the LINE secondary softkey on the GRAPH/LIST: GRAPHICS screen. 3. Select ANLYSIS SETUP primary softkey. The DISPLAY: ANALYSIS SETUP screen is displayed. 4. In field (1), select GRAD secondary softkey. 5. In field (2), select secondary softkey to specify desired axis. 6. In field (3), select: • BY X-Y COORDINATE secondary softkey to specify a point by X-Y coordinate mode. (Go to step 6.) • BY DATA CONDITION secondary softkey to specify a point by data condition mode. (Go to step 7.) 7. If you selected BY X-Y COORDINATE secondary softkey: a. In the X field, enter desired expression to specify X coordinate. b. In the Y field, enter desired expression to specify Y coordinate. c. Go to step 8. 8. If you selected BY DATA CONDITION secondary softkey: a. In field (4), select secondary softkey to set desired data variable name. b. In field (5), enter desired expression. c. In field (6), select: • AFTER secondary softkey if you want to set a search start condition for finding specified point. • DISABLE secondary softkey to disable (clear) the AFTER settings. d. If you selected AFTER, select secondary softkey to enter desired data variable in field (7). e. If you selected AFTER, enter desired expression in field (8). 9. In the Gradient field, enter gradient expression. 6-40 Agilent 4155C/4156C User’s Guide Vol.2, Edition 5 Analyzing Measurement Results Automatic Analysis Data condition mode specifies a point related to the measurement curve. So, if no measurement data satisfy the specified condition, the nearest measurement point is used. For the meaning of expression that you can enter in step 6 or 7, see Chapter 8. To specify a point between two measurement points Set Interpolate field to ON. To disable (clear) the settings Move the pointer to field (1), then select DISABLE secondary softkey. Setup fields disappear. Example The following figure shows an example setup to automatically draw a line through the specified point with the specified gradient. Agilent 4155C/4156C User’s Guide Vol.2, Edition 5 6-41 Analyzing Measurement Results Automatic Analysis To Draw Tangent to Specified Measurement Point 1. Press Display front-panel key. 2. Confirm that ON is set on the LINE secondary softkey on the GRAPH/LIST: GRAPHICS screen. 3. Select ANLYSIS SETUP primary softkey. The DISPLAY: ANALYSIS SETUP screen is displayed. 4. In field (1), select TANGENT secondary softkey. 5. In field (2), select secondary softkey to specify desired axis. 6. In field (3), select secondary softkey to select desired data variable name. 7. In field (4), enter desired expression. 8. In field (5), select: • AFTER secondary softkey if you want to set a search start condition for finding specified point. • DISABLE secondary softkey to disable (clear) the AFTER settings. 9. If you selected AFTER, select secondary softkey to enter desired data variable in field (6). 10. If you selected AFTER, enter desired expression in field (7). Data condition mode specifies a point related to the measurement curve. So, if no measurement data satisfy the specified condition, the nearest measurement point is used. For the meaning of expression that you can enter in step 6 and 9, see Chapter 8. To specify a point between two measurement points Set Interpolate field to ON. To disable (clear) the settings Move the pointer to field (1), then select DISABLE secondary softkey. Setup fields disappear. 6-42 Agilent 4155C/4156C User’s Guide Vol.2, Edition 5 Analyzing Measurement Results Automatic Analysis Example The following figure shows an example setup to automatically draw a tangent line to a specified measurement point. Agilent 4155C/4156C User’s Guide Vol.2, Edition 5 6-43 Analyzing Measurement Results Automatic Analysis To Draw Regression Line by Specifying Two Points 1. Press Display front-panel key. 2. Confirm that ON is set on the LINE secondary softkey on the GRAPH/LIST: GRAPHICS screen. 3. Select ANLYSIS SETUP primary softkey. The DISPLAY: ANALYSIS SETUP screen is displayed. 4. In field (1), select REGRESSION secondary softkey. 5. In field (2), select secondary softkey to specify desired axis. 6. In field (3), select: • BY X-Y COORDINATE secondary softkey to specify a point by X-Y coordinate mode. (Go to step 6.) • BY DATA CONDITION secondary softkey to specify a point by data condition mode. (Go to step 7.) 7. If you selected BY X-Y COORDINATE secondary softkey: a. In the X field, enter desired expression to specify X coordinate. b. In the Y field, enter desired expression to specify Y coordinate. c. Go to step 8. 8. If you selected BY DATA CONDITION secondary softkey: a. In field (4), select secondary softkey to set desired data variable name. b. In field (5), enter desired expression. c. In field (6), select: • AFTER secondary softkey if you want to set a search start condition for finding specified point. • DISABLE secondary softkey to disable (clear) the AFTER settings. d. If you selected AFTER, select secondary softkey to enter desired data variable in field (7). e. If you selected AFTER, enter desired expression in field (8). 9. Specify the other point by step 5, then step 6 or 7. 6-44 Agilent 4155C/4156C User’s Guide Vol.2, Edition 5 Analyzing Measurement Results Automatic Analysis Regression calculation is performed in the range defined by the two specified points as shown in the following figure. Data condition mode specifies a point related to the measurement curve. So, if no measurement data satisfy the specified condition, the nearest measurement point is used. For the meaning of expression that you can enter in step 6 and 7, see Chapter 8. To specify a point between two measurement points Set Interpolate field to ON. To disable (clear) the settings Move the pointer to field (1), then select DISABLE secondary softkey. Setup fields disappear. Agilent 4155C/4156C User’s Guide Vol.2, Edition 5 6-45 Analyzing Measurement Results Automatic Analysis Example The following figure shows an example setup to automatically draw a regression line. The range for the regression calculation is specified by two points. One point is specified by X-Y coordinate mode and other point is specified by data condition mode. 6-46 Agilent 4155C/4156C User’s Guide Vol.2, Edition 5 Analyzing Measurement Results Automatic Analysis To Display Marker at Specified Point 1. Press Display front-panel key. 2. Select ANLYSIS SETUP primary softkey. The DISPLAY: ANALYSIS SETUP screen is displayed. 3. Move pointer to field (1), then select secondary softkey to set desired data variable name. 4. In field (2), enter desired expression. 5. In field (3), select: • AFTER secondary softkey if you want to set a search start condition for finding specified point. • DISABLE secondary softkey to disable (clear) the AFTER settings. 6. If you selected AFTER in field (4), select secondary softkey to set desired data variable. 7. If you selected AFTER in field (5), enter desired expression. The marker can be displayed on the measurement curve only. So, if no measurement data satisfy the specified condition, the nearest measurement point is used. For the meaning of expression that you can enter in step 4 and 7, see Chapter 8. To specify a point between two measurement points Set Interpolate field to ON. Agilent 4155C/4156C User’s Guide Vol.2, Edition 5 6-47 Analyzing Measurement Results Automatic Analysis Example The following figure shows an example setup to automatically display marker at specified point. 6-48 Agilent 4155C/4156C User’s Guide Vol.2, Edition 5 7 Measurement Units and Functions Agilent 4155C/4156C User’s Guide Vol.2, Edition 5 Measurement Units and Functions This chapter explains measurement units and measurement functions of the Agilent 4155C/4156C Semiconductor Parameter Analyzer and Agilent 41501A/B Expander. • “Measurement Units” • “Compliance” • “Measurement Ranging Mode” • “Measurement Time” • “SMU Filter” • “Self-calibration” • “Zero Offset Cancel” • “QSCV Zero Offset Cancel” • “Operation States” • “Output Sequence” • “Measurement Sequence” 7-2 Agilent 4155C/4156C User’s Guide Vol.2, Edition 5 Measurement Units and Functions Measurement Units Measurement Units The 4155C/4156C and 41501A/B have the measurement units listed below. This section explains source and measurement functions of the measurement units. • “GNDU - Ground Unit” • “SMU - Source Monitor Unit” • “VSU - Voltage Source Unit” • “VMU - Voltage Monitor Unit” • “PGU - Pulse Generator Unit” GNDU - Ground Unit GNDU is a 0 V constant voltage source, and used for the reference of the measurement ground. Also GNDU can sink up to ±1.6 A, so it is effective for using the HPSMU (high power SMU). Figure 7-1 shows a simplified circuit diagram of GNDU. The GNDU is installed in the 41501A/B Expander. Figure 7-1 Simplified GNDU Circuit Diagram Agilent 4155C/4156C User’s Guide Vol.2, Edition 5 7-3 Measurement Units and Functions Measurement Units SMU - Source Monitor Unit SMU can force a constant voltage, constant current, pulse voltage, or pulse current, and can measure a dc current or dc voltage. Only one SMU can be set to pulsed source. Figure 7-2 shows a simplified SMU circuit diagram. SMU has the following three modes: Figure 7-2 • voltage source and current monitor mode (V source and I monitor mode) • current source and voltage monitor mode (I source and V monitor mode) • source common mode Simplified SMU Circuit Diagram 7-4 Agilent 4155C/4156C User’s Guide Vol.2, Edition 5 Measurement Units and Functions Measurement Units Type of SMUs Following three types of SMUs are available: • • • HRSMU (high resolution SMU) • Only for the 4156C. The 4156C has four HRSMUs. • Force and measure: up to ±100 V or ±100 mA. • Maximum output power: 2 W. • Minimum current measurement range: 10 pA with 1 fA resolution. • Output and measurement ranges: see “HRSMU - High Resolution SMU” on page 7-6. • Kelvin connection is available. MPSMU (medium power SMU) • The 4155C has four MPSMUs, and the 41501A/B option 420 or 422 has two MPSMUs. • Force and measure: up to ±100 V or ±100 mA. • Maximum output power: 2 W. • Output and measurement ranges: see “MPSMU - Medium Power SMU” on page 7-9. HPSMU (high power SMU) • Only for the 41501A/B. The 41501A/B option 410 or 412 has one HPSMU. • Force and measure: up to ±200 V or ±1 A. • Maximum output power: 20 W. • Output and measurement ranges: see “HPSMU - High Power SMU” on page 7-12. • Kelvin connection is available. Each SMU has a compliance feature that limits output voltage or current to prevent damage to your devices. When the SMU forces voltage, you can specify current compliance. When the SMU forces current, you can specify voltage compliance. For details about the compliance setting range and resolution, see “Compliance” on page 7-23. Agilent 4155C/4156C User’s Guide Vol.2, Edition 5 7-5 Measurement Units and Functions Measurement Units HRSMU - High Resolution SMU Figure 7-3 HRSMU Output and Measurement Ranges Table 7-1 HRSMU Output Voltage Ranges and Resolutions 7-6 Range Output Value Output Resolution Current Compliance Range 2V 0 ≤ |V| ≤ 2 V 100 µV ±100 mA 20 V 0 ≤ |V| ≤ 20 V 1 mV ±100 mA 40 V 0 ≤ |V| ≤ 40 V 2 mV ±50 mA 100 V 0 ≤ |V| ≤ 100 V 5 mV ±20 mA Agilent 4155C/4156C User’s Guide Vol.2, Edition 5 Measurement Units and Functions Measurement Units Table 7-2 HRSMU Measurement Voltage Values and Resolutions Measurement Resolutions b Range Measurement Value a Integration Time 1PLC or Longer 640 µs to 1.92 ms 80 µs to 560 µs High Speed Sampling Measurement c 2V 0 ≤ |V| ≤ 2.2 V 2 µV 20 µV 200 µV 2 mV 20 V 0 ≤ |V| ≤ 22 V 20 µV 200 µV 2 mV 20 mV 40 V 0 ≤ |V| ≤ 44 V 40 µV 400 µV 4 mV 40 mV 100 V 0 ≤ |V| ≤ 100 V 100 µV 1 mV 10 mV 100 mV a. This column is applied to the auto ranging or the limited auto ranging. For fixed ranging, maximum measurement value is Range column value. b. Measurement resolution depends on the integration time setting. For Knob sweep measurement, see the column of Integration Time 80 µs to 560 µs. c. This column is applied to the sampling measurement that initial interval is set to 480 µs or shorter. Table 7-3 HRSMU Output Current Ranges and Resolutions Range Output Value Output Resolution Voltage Compliance Range 10 pA 0 ≤ |I| ≤ 10 pA 10 fA ±100 V 100 pA 0 ≤ |I| ≤ 100 pA 10 fA ±100 V 1 nA 0 ≤ |I| ≤ 1 nA 100 fA ±100 V 10 nA 0 ≤ |I| ≤ 10 nA 1 pA ±100 V 100 nA 0 ≤ |I| ≤ 100 nA 10 pA ±100 V 1 µA 0 ≤ |I| ≤ 1 µA 100 pA ±100 V 10 µA 0 ≤ |I| ≤ 10 µA 1 nA ±100 V 100 µA 0 ≤ |I| ≤ 100 µA 10 nA ±100 V 1 mA 0 ≤ |I| ≤ 1 mA 100 nA ±100 V 10 mA 0 ≤ |I| ≤ 10 mA 1 µA ±100 V 100 mA 0 ≤ |I| ≤ 20 mA 10 µA ±100 V 20 mA < |I| ≤ 50 mA 10 µA ±40 V 50 mA < |I| ≤ 100 mA 10 µA ±20 V Agilent 4155C/4156C User’s Guide Vol.2, Edition 5 7-7 Measurement Units and Functions Measurement Units Table 7-4 HRSMU Measurement Current Values and Resolutions Measurement Resolutions b Range Measurement Value a Integration Time 1PLC or Longer 640 µs to 1.92 ms 80 µs to 560 µs High Speed Sampling Measurement c 10 pA 0 ≤ |I| ≤ 10.5 pA 1 fA 1 fA 1 fA 10 fA 100 pA 0 ≤ |I| ≤ 115 pA 1 fA 1 fA 10 fA 100 fA 1 nA 0 ≤ |I| ≤ 1.15 nA 10 fA 10 fA 100 fA 1 pA 10 nA 0 ≤ |I| ≤ 11.5 nA 10 fA 100 fA 1 pA 10 pA 100 nA 0 ≤ |I| ≤ 115 nA 100 fA 1 pA 10 pA 100 pA 1 µA 0 ≤ |I| ≤ 1.15 µA 1 pA 10 pA 100 pA 1 nA 10 µA 0 ≤ |I| ≤ 11.5 µA 10 pA 100 pA 1 nA 10 nA 100 µA 0 ≤ |I| ≤ 115 µA 100 pA 1 nA 10 nA 100 nA 1 mA 0 ≤ |I| ≤ 1.15 mA 1 nA 10 nA 100 nA 1 µA 10 mA 0 ≤ |I| ≤ 11.5 mA 10 nA 100 nA 1 µA 10 µA 100 mA 0 ≤ |I| ≤ 100 mA 100 nA 1 µA 10 µA 100 µA a. This column is applied to the auto ranging or the limited auto ranging. For fixed ranging, maximum measurement value is Range column value. b. Measurement resolution depends on the integration time setting. For Knob sweep measurement, see the column of Integration Time 80 µs to 560 µs. c. This column is applied to the sampling measurement that initial interval is set to 480 µs or shorter. 7-8 Agilent 4155C/4156C User’s Guide Vol.2, Edition 5 Measurement Units and Functions Measurement Units MPSMU - Medium Power SMU Figure 7-4 MPSMU Output and Measurement Ranges Table 7-5 MPSMU Output Voltage Ranges and Resolutions Range Output Value Output Resolution Current Compliance Range 2V 0 ≤ |V| ≤ 2 V 100 µV ±100 mA 20 V 0 ≤ |V| ≤ 20 V 1 mV ±100 mA 40 V 0 ≤ |V| ≤ 40 V 2 mV ±50 mA 100 V 0 ≤ |V| ≤ 100 V 5 mV ±20 mA Agilent 4155C/4156C User’s Guide Vol.2, Edition 5 7-9 Measurement Units and Functions Measurement Units Table 7-6 MPSMU Measurement Voltage Values and Resolutions Measurement Resolutions b Range Measurement Value a Integration Time 1PLC or Longer 640 µs to 1.92 ms 80 µs to 560 µs High Speed Sampling Measurement c 2V 0 ≤ |V| ≤ 2.2 V 2 µV 20 µV 200 µV 2 mV 20 V 0 ≤ |V| ≤ 22 V 20 µV 200 µV 2 mV 20 mV 40 V 0 ≤ |V| ≤ 44 V 40 µV 400 µV 4 mV 40 mV 100 V 0 ≤ |V| ≤ 100 V 100 µV 1 mV 10 mV 100 mV a. This column is applied to the auto ranging or the limited auto ranging. For fixed ranging, maximum measurement value is Range column value. b. Measurement resolution depends on the integration time setting. For Knob sweep measurement, see the column of Integration Time 80 µs to 560 µs. c. This column is applied to the sampling measurement that initial interval is set to 480 µs or shorter. Table 7-7 MPSMU Output Current Ranges and Resolutions Range Output Value Output Resolution Voltage Compliance Range 1 nA 0 ≤ |I| ≤ 1 nA 100 fA ±100 V 10 nA 0 ≤ |I| ≤ 10 nA 1 pA ±100 V 100 nA 0 ≤ |I| ≤ 100 nA 10 pA ±100 V 1 µA 0 ≤ |I| ≤ 1 µA 100 pA ±100 V 10 µA 0 ≤ |I| ≤ 10 µA 1 nA ±100 V 100 µA 0 ≤ |I| ≤ 100 µA 10 nA ±100 V 1 mA 0 ≤ |I| ≤ 1 mA 100 nA ±100 V 10 mA 0 ≤ |I| ≤ 10 mA 1 µA ±100 V 100 mA 0 ≤ |I| ≤ 20 mA 10 µA ±100 V 20 mA < |I| ≤ 50 mA 10 µA ±40 V 50 mA < |I| ≤ 100 mA 10 µA ±20 V 7-10 Agilent 4155C/4156C User’s Guide Vol.2, Edition 5 Measurement Units and Functions Measurement Units Table 7-8 MPSMU Measurement Current Values and Resolutions Measurement Resolutions b Range Measurement Value a Integration Time 1PLC or Longer 640 µs to 1.92 ms 80 µs to 560 µs High Speed Sampling Measurement c 1 nA 0 ≤ |I| ≤ 1.15 nA 10 fA 10 fA 100 fA 1 pA 10 nA 0 ≤ |I| ≤ 11.5 nA 10 fA 100 fA 1 pA 10 pA 100 nA 0 ≤ |I| ≤ 115 nA 100 fA 1 pA 10 pA 100 pA 1 µA 0 ≤ |I| ≤ 1.15 µA 1 pA 10 pA 100 pA 1 nA 10 µA 0 ≤ |I| ≤ 11.5 µA 10 pA 100 pA 1 nA 10 nA 100 µA 0 ≤ |I| ≤ 115 µA 100 pA 1 nA 10 nA 100 nA 1 mA 0 ≤ |I| ≤ 1.15 mA 1 nA 10 nA 100 nA 1 µA 10 mA 0 ≤ |I| ≤ 11.5 mA 10 nA 100 nA 1 µA 10 µA 100 mA 0 ≤ |I| ≤ 100 mA 100 nA 1 µA 10 µA 100 µA a. This column is applied to the auto ranging or the limited auto ranging. For fixed ranging, maximum measurement value is Range column value. b. Measurement resolution depends on the integration time setting. For Knob sweep measurement, see the column of Integration Time 80 µs to 560 µs. c. This column is applied to the sampling measurement that initial interval is set to 480 µs or shorter. Agilent 4155C/4156C User’s Guide Vol.2, Edition 5 7-11 Measurement Units and Functions Measurement Units HPSMU - High Power SMU Figure 7-5 HPSMU Output and Measurement Ranges Table 7-9 HPSMU Output Voltage Ranges and Resolutions 7-12 Range Output Value Output Resolution Current Compliance Range 2V 0 ≤ |V| ≤ 2 V 100 µV ±1000 mA 20 V 0 ≤ |V| ≤ 20 V 1 mV ±1000 mA 40 V 0 ≤ |V| ≤ 40 V 2 mV ±500 mA 100 V 0 ≤ |V| ≤ 100 V 5 mV ±125 mA 200 V 0 ≤ |V| ≤ 200 V 10 mV ±50 mA Agilent 4155C/4156C User’s Guide Vol.2, Edition 5 Measurement Units and Functions Measurement Units Table 7-10 HPSMU Measurement Voltage Values and Resolutions Measurement Resolutions b Range Measurement Value a Integration Time 1PLC or Longer 640 µs to 1.92 ms 80 µs to 560 µs High Speed Sampling Measurement c 2V 0 ≤ |V| ≤ 2.2 V 2 µV 20 µV 200 µV 2 mV 20 V 0 ≤ |V| ≤ 22 V 20 µV 200 µV 2 mV 20 mV 40 V 0 ≤ |V| ≤ 44 V 40 µV 400 µV 4 mV 40 mV 100 V 0 ≤ |V| ≤ 110 V 100 µV 1 mV 10 mV 100 mV 200 V 0 ≤ |V| ≤ 200 V 200 µV 2 mV 20 mV 200 mV a. This column is applied to the auto ranging or the limited auto ranging. For fixed ranging, maximum measurement value is Range column value. b. Measurement resolution depends on the integration time setting. For Knob sweep measurement, see the column of Integration Time 80 µs to 560 µs. c. This column is applied to the sampling measurement that initial interval is set to 480 µs or shorter. Table 7-11 HPSMU Output Current Ranges and Resolutions Range Output Value Output Resolution Voltage Compliance Range 1 nA 0 ≤ |I| ≤ 1 nA 100 fA ±200 V 10 nA 0 ≤ |I| ≤ 10 nA 1 pA ±200 V 100 nA 0 ≤ |I| ≤ 100 nA 10 pA ±200 V 1 µA 0 ≤ |I| ≤ 1 µA 100 pA ±200 V 10 µA 0 ≤ |I| ≤ 10 µA 1 nA ±200 V 100 µA 0 ≤ |I| ≤ 100 µA 10 nA ±200 V 1 mA 0 ≤ |I| ≤ 1 mA 100 nA ±200 V 10 mA 0 ≤ |I| ≤ 10 mA 1 µA ±200 V 100 mA 0 ≤ |I| ≤ 20 mA 10 µA ±200 V 50 mA < |I| ≤ 100 mA 10 µA ±100 V 0 ≤|I| ≤ 50 mA 100 µA ±200 V 50 mA < |I| ≤ 125 mA 100 µA ±100 V 125 mA < |I| ≤ 500 mA 100 µA ±40 V 500 mA < |I| ≤ 1 A 100 µA ±20 V 1A Agilent 4155C/4156C User’s Guide Vol.2, Edition 5 7-13 Measurement Units and Functions Measurement Units Table 7-12 HPSMU Measurement Current Values and Resolutions Measurement Resolutions b Range Integration Time Measurement Value a 1PLC or Longer 640 µs to 1.92 ms 80 µs to 560 µs High Speed Sampling Measurement c 1 nA 0 ≤ |I| ≤ 1.15 nA 10 fA 10 fA 100 fA 1 pA 10 nA 0 ≤ |I| ≤ 11.5 nA 10 fA 100 fA 1 pA 10 pA 100 nA 0 ≤ |I| ≤ 115 nA 100 fA 1 pA 10 pA 100 pA 1 µA 0 ≤ |I| ≤ 1.15 µA 1 pA 10 pA 100 pA 1 nA 10 µA 0 ≤ |I| ≤ 11.5 µA 10 pA 100 pA 1 nA 10 nA 100 µA 0 ≤ |I| ≤ 115 µA 100 pA 1 nA 10 nA 100 nA 1 mA 0 ≤ |I| ≤ 1.15 mA 1 nA 10 nA 100 nA 1 µA 10 mA 0 ≤ |I| ≤ 11.5 mA 10 nA 100 nA 1 µA 10 µA 100 mA 1A 0 ≤ |I| ≤ 50 mA 100 nA 1 µA 10 µA 100 µA 50 mA < |I| ≤ 115 mA 100 nA 1 µA 10 µA 100 µA 0 ≤ |I| ≤ 1 A 1 µA 10 µA 100 µA 1 mA a. This column is applied to the auto ranging or the limited auto ranging. For fixed ranging, maximum measurement value is Range column value. b. Measurement resolution depends on the integration time setting. For Knob sweep measurement, see the column of Integration Time 80 µs to 560 µs. c. This column is applied to the sampling measurement that initial interval is set to 480 µs or shorter. 7-14 Agilent 4155C/4156C User’s Guide Vol.2, Edition 5 Measurement Units and Functions Measurement Units SMU Pulse Output When SMU is pulsed source, set pulse parameters in following ranges: Pulse width 0.5 ms to 100 ms, 100 µs resolution Pulse Period 5 ms to 1 s, 100 µs resolution where pulse period ≥ pulse width + 4 ms Be aware that if any of following are true, pulsed SMU channel may not output the pulse period and pulse width you specified: • Measurement range differs from compliance range (lowest range that includes compliance). • Ranging mode is set to auto range or limited auto range. • Multi-channel measurement is set. Compliance Range for Pulsed SMU If you use an SMU as a pulsed source, the compliance setting range is as follows: • Current Compliance For SMU used as pulsed voltage source, you can set current compliance as follows: Agilent 4155C/4156C User’s Guide Vol.2, Edition 5 7-15 Measurement Units and Functions Measurement Units • Voltage Compliance If you use SMU as pulse current source, you can set voltage compliance as follows: • When |I| ≤ 10 µA, voltage compliance must be 2 V or less. • When |I| > 10 µA, voltage compliance ranges are same as in tables on previous pages. where, meaning of I depends on the pulse output mode. See below: If SMU is pulsed constant source peak or base value, whichever has larger absolute value. If SMU is pulsed sweep source start or stop value, whichever has larger absolute value. 7-16 Agilent 4155C/4156C User’s Guide Vol.2, Edition 5 Measurement Units and Functions Measurement Units VSU - Voltage Source Unit Figure 7-6 shows a simplified VSU circuit diagram. Figure 7-6 Simplified VSU Circuit Diagram • VSU can force up to ±20 V with 1 mV resolution. • Only range available is 20 V range, so output range is automatically set to 20 V. • Current compliance is automatically set to ±100 mA. Agilent 4155C/4156C User’s Guide Vol.2, Edition 5 7-17 Measurement Units and Functions Measurement Units VMU - Voltage Monitor Unit The VMU has two measurement modes: grounded or differential. Grounded mode uses one VMU. Differential mode uses two VMUs. Figure 7-7 is a simplified VMU circuit diagram. The VMU can measure up to 20 V. Table 7-13 shows the voltage measurement range of the VMU. Figure 7-7 Simplified VMU Circuit Diagram NOTE High Impedance DUT A very high-impedance DUT may cause measurement error owing to the input leakage current from the VMU. To check the measurement error, perform voltage measurement as follows: 1. Connect the SMU to the DUT. 2. Force very low current (under 1 pA) to the DUT from the SMU. 3. Measure voltage with the SMU. 4. Compare the voltage measured with the SMU and the VMU. 7-18 Agilent 4155C/4156C User’s Guide Vol.2, Edition 5 Measurement Units and Functions Measurement Units Table 7-13 VMU Voltage Ranges and Resolutions Measurement Resolutions b Measurement Mode Grounded Measurement Differential Measurement Integration Time 1PLC or Longer 640 µs to 1.92 ms 80 µs to 560 µs High Speed Sampling Measurement c 2V 2 µV 20 µV 200 µV 2 mV 20 V 20 µV 200 µV 2 mV 20 mV 0.2 V 0.2 µV 2 µV 20 µV 200 µV 2V 2 µV 20 µV 200 µV 2 mV Range a a. For knob sweep measurement, only the 20 V range for Grounded mode and 2 V range for Differential mode are available. b. Measurement resolution depends on the integration time setting. For Knob sweep measurement, it is 2 mV for Grounded mode, or 200 µV for Differential mode. c. This column applies to the sampling measurement where initial interval is set to 480 µs or less. Agilent 4155C/4156C User’s Guide Vol.2, Edition 5 7-19 Measurement Units and Functions Measurement Units PGU - Pulse Generator Unit Two PGUs (pulse generator units) are available, which are in the 41501A/B Expander. Each PGU provides a pulsed output, and can also function as a dc source. Figure 7-8 shows a simplified PGU circuit diagram. Figure 7-8 Simplified PGU Circuit Diagram When you use two PGUs, the outputs are always synchronized with each other. The PGUs cannot be synchronized with the other measurement units. The following describe each pulse parameter. For more details, open Help screen, or refer to Setup Screen Reference manual. Pulse Base and Peak Table 7-14 shows the peak and base setting ranges and resolutions. PGU output value is defined to be the value that is output if the PGU output terminal is open. Table 7-14 PGU Setting Ranges and Resolutions Range Peak Setting Value a Base Setting Value Resolution Maximum Current b 20 V 0 ≤ |V| ≤ 20 V 0 ≤ |V| ≤ 20 V 4 mV ±100 mA 40 V 0 ≤ |V| ≤ 40 V 0 ≤ |V| ≤ 40 V 8 mV ±100 mA a. Maximum peak-to-peak voltage is 40 V. b. If pulse width ≤ 1 ms, pulse duty is ≤ 50 %, and average current output is ≤ ±100 mA, the peak current output can be up to ±200 mA. 7-20 Agilent 4155C/4156C User’s Guide Vol.2, Edition 5 Measurement Units and Functions Measurement Units Output Impedance For the PGU pulsed outputs, you must select the PGU output impedance from 50 Ω and Low impedance (approx. 0 Ω). And PGU output value is defined to be the value that is output if the PGU output terminal is open. So, when a load is connected and PGU impedance is set to 50 Ω, the actual output value will be different. For example, if connected load is 50 Ω, specified PGU output impedance is 50 Ω, and specified output value is 2 V, the PGU outputs 1 V. If the impedance of the load connected to the PGU is not 50 Ω or low impedance, the average output current may exceed ±100 mA. If so, a warning message is displayed. Pulse Count Allowable range: 1 to 65535. If you use two PGUs, both PGUs are set to the same pulse count. You cannot set different values for each PGU. Pulse Period, Width, Delay Time Each parameter has six setting ranges as shown in Table 7-15. The period, width, and delay time must be set in the same range. Also, if you use two PGUs, both PGUs are set to the same pulse period value. So, these three parameters must be set in the same range for both PGUs. Table 7-15 Ranges of Pulse Period, Pulse Width and Delay Time Range Pulse Period Pulse Width Delay Time a Resolution 1 2.0 µs to 100.0 µs 1.0 µs to 99.9 µs 0 to 100.0 µs 0.1 µs 2 100 µs to 1000 µs 1 µs to 999 µs 0 to 1000 µs 1 µs 3 1.00 ms to 10.00 ms 0.01 ms to 9.99 ms 0 to 10.00 ms 10 µs 4 10.0 ms to 100.0 ms 0.1 ms to 99.9 ms 0 to 100.0 ms 100 µs 5 100 ms to 1000 ms 1 ms to 999 ms 0 to 1000 ms 1 ms 6 1.00 s to 10.00 s 0.01 s to 9.99 s 0 to 10.00 s 10 ms a. The setting range of delay time is 0 ≤ delay time ≤ specified pulse period. Agilent 4155C/4156C User’s Guide Vol.2, Edition 5 7-21 Measurement Units and Functions Measurement Units Leading Edge and Trailing Edge Transition Time The leading-edge and trailing-edge transition times have five setting ranges as shown in Table 7-16. Table 7-16 Ranges and Resolutions of Leading and Trailing Transition Time Range Leading and Trailing Transition Time Resolution 1 100 ns to 1000 ns 1 ns 2 0.50 µs to 10.00 µs 10 ns 3 5.0 µs to 100.0 µs 100 ns 4 50 µs to 1000 µs 1 µs 5 0.5 ms to 10.00 ms 10 µs where, • leading-edge transition time must be pulse width × 0.8 or less. • trailing-edge transition time must be (pulse period −pulse width) × 0.8 or less. • Leading and trailing-edge transition times for a PGU must be in the same range. Trigger Output PGUs output trigger signal to synchronize with external pulse generators. If an 41501A/B has PGUs, you can see a trigger output terminal on its rear panel. For details of trigger functions, see Chapter 8. 7-22 Agilent 4155C/4156C User’s Guide Vol.2, Edition 5 Measurement Units and Functions Compliance Compliance Compliance is available for SMU (HPSMU, MPSMU, HRSMU) and VSU. To prevent damage to the test device due to overcurrent, overvoltage, or overpower, you can set current compliance, voltage compliance, or power compliance for SMU. For VSU, current compliance is automatically set to approximately ±100 mA. You cannot change it. Voltage and Current Compliance Voltage compliance (V compliance) and current compliance (I compliance) are limiters that can be set with the same resolution and accuracy as output current or output voltage. Voltage compliance is for the SMU in current output mode, current compliance is for the SMU in voltage output mode. When a unit reaches compliance, the unit acts as a constant voltage source or a constant current source. The unit keeps the output value when reaching compliance. For compliance setting range and resolution, refer to Table 7-17 to Table 7-20. Polarity and Output Area • Polarity of Voltage compliance The 4155C/4156C automatically sets V compliance polarity to the same polarity as the output current, regardless of the specified V compliance polarity. There is no compliance for the opposite polarity. • Polarity of Current compliance The 4155C/4156C automatically sets I compliance for both the positive and negative polarity, regardless of the I compliance polarity. However, if the output voltage and the current compliance are opposite polarity, the | I compliance | value is increased by an amount that is 2.5 % to 12 % of the range value in the lowest range that includes I compliance. Figure 7-9 shows the relation of the compliance and output. Agilent 4155C/4156C User’s Guide Vol.2, Edition 5 7-23 Measurement Units and Functions Compliance Figure 7-9 Relation of Compliance and Output Current Compliance for COMMON Unit If you set COMMON output mode for the unit, current compliance for the unit is automatically set as follows and you cannot change the setting. Table 7-17 GNDU 1.6 A HRSMU 105 mA MPSMU 105 mA HPSMU 1A V Compliance Setting Range Unit Output Range V Compliance Setting Range HRSMU 10 pA to 10 mA 0 to 100 V 100 mA (0 ≤ |I| ≤ 20 mA) 0 to 100 V 100 mA (20 mA < |I| ≤ 50 mA) 0 to 40 V 100 mA (50 mA < |I| ≤ 100 mA) 0 to 20 V 1 nA to 10 mA 0 to 100 V 100 mA (0 ≤ |I| ≤ 20 mA) 0 to 100 V 100 mA (20 mA < |I| ≤ 50 mA) 0 to 40 V 100 mA (50 mA < |I| ≤ 100 mA) 0 to 20 V MPSMU 7-24 Agilent 4155C/4156C User’s Guide Vol.2, Edition 5 Measurement Units and Functions Compliance Table 7-18 Table 7-19 Unit Output Range V Compliance Setting Range HPSMU 1 nA to 10 mA 0 to 200 V 100 mA (0 ≤ |I| ≤ 50 mA) 0 to 200 V 100 mA (50 mA < |I| ≤ 115 mA) 0 to 100 V 1 A (0 ≤ |I| ≤ 50 mA) 0 to 200 V 1 A (50 mA < |I| ≤ 125 mA) 0 to 100 V 1 A (125 mA < |I| ≤ 500 mA) 0 to 40 V 1 A (500 mA < |I| ≤ 1 A) 0 to 20 V V Compliance Resolution Unit V Compliance Resolution HRSMU 0 V ≤ |V| ≤ 2 V 100 µV MPSMU 2 V < |V| ≤ 20 V 1 mV HPSMU 20 V < |V| ≤ 40 V 2 mV 40 V < |V| ≤ 100 V 5 mV 100 V < |V| ≤ 200 V 10 mV I Compliance Setting Range Unit Output Range I Compliance Setting Range HRSMU 2V 100 fA to 100 mA 20 V 100 fA to 100 mA 40 V 100 fA to 50 mA 100 V 100 fA to 20 mA 2V 1 pA to 100 mA 20 V 1 pA to 100 mA 40 V 1 pA to 50 mA 100 V 1 pA to 20 mA MPSMU Agilent 4155C/4156C User’s Guide Vol.2, Edition 5 7-25 Measurement Units and Functions Compliance Table 7-20 Unit Output Range I Compliance Setting Range HPSMU 2V 1 pA to 1000 mA 20 V 1 pA to 1000 mA 40 V 1 pA to 500 mA 100 V 1 pA to 125 mA 200 V 1 pA to 50 mA I Compliance Resolution Unit I Compliance Resolution HRSMU 100 fA ≤ |I| ≤ 100 pA 10 fA 100 pA < |I| ≤ 1 nA 100 fA 1 nA < |I| ≤ 10 nA 1 pA 10 nA < |I| ≤ 100 nA 10 pA 100 nA < |I| ≤ 1 µA 100 pA 1 µA < |I| ≤ 10 µA 1 nA 10 µA < |I| ≤ 100 µA 10 nA 100 µA < |I| ≤ 1 mA 100 nA 1 mA < |I| ≤ 10 mA 1 µA 10 mA < |I| ≤ 100 mA 10 µA 1 pA ≤ |I| ≤ 1 nA 100 fA 1 nA < |I| ≤ 10 nA 1 pA 10 nA < |I| ≤ 100 nA 10 pA 100 nA < |I| ≤ 1 µA 100 pA 1 µA < |I| ≤ 10 µA 1 nA 10 µA < |I| ≤ 100 µA 10 nA 100 µA < |I| ≤ 1 mA 100 nA 1 mA < |I| ≤ 10 mA 1 µA 10 mA < |I| ≤ 100 mA 10 µA MPSMU 7-26 Agilent 4155C/4156C User’s Guide Vol.2, Edition 5 Measurement Units and Functions Compliance Unit I Compliance Resolution HPSMU 1 pA ≤ |I| ≤ 1 nA 100 fA 1 nA < |I| ≤ 10 nA 1 pA 10 nA < |I| ≤ 100 nA 10 pA 100 nA < |I| ≤ 1 µA 100 pA 1 µA < |I| ≤ 10 µA 1 nA 10 µA < |I| ≤ 100 µA 10 nA 100 µA < |I| ≤ 1 mA 100 nA 1 mA < |I| ≤ 10 mA 1 µA 10 mA < |I| ≤ 100 mA 10 µA 100 mA < |I| ≤ 1 A 100 µA Power Compliance In addition to V compliance or I compliance, you can set power compliance for the VAR1, VAR2, and VAR1' channels of sweep measurement. However, if the pulse output function is used for VAR1 or VAR1' channels, you cannot set power compliance for the VAR1 or VAR1' channel that is set to pulse output. The power compliance setting range for each SMU is as follows: HRSMU 1 to 2 W MPSMU 1 to 2 W HPSMU 1 to 20 W If you specify I compliance and power compliance for a V sweep source, the 4155C/4156C changes the I compliance at every voltage step. The I compliance is set to the smaller value of I compliance and Attempt value below. See Figure 7-10 (a). Icomp = power compliance / step voltage If you specify V compliance and power compliance for an I sweep source, the 4155C/4156C changes the V compliance at every current step. The V compliance is set to the smaller value of V compliance and Vcomp value below. See Figure 7-10 (b). Vcomp = power compliance / step current Agilent 4155C/4156C User’s Guide Vol.2, Edition 5 7-27 Measurement Units and Functions Compliance Figure 7-10 Power Compliance Output Area If you specify power compliance, SMUs can be swept at their maximum output limits because the 4155C/4156C changes the V (or I) output range and I (or V) compliance range during a V (or I) sweep. Figure 7-11 shows an example of the difference in SMU output when power compliance is set and when power compliance is not set. Figure 7-11 Allowable I Output when the MPSMU Sweeps Voltage (0 V to 100 V) If you specify power compliance, the measurement time increases slightly because of the range changing for every step. When the ranges are changed during a sweep to accommodate power compliance, the SMU output is momentarily set to 0 V. 7-28 Agilent 4155C/4156C User’s Guide Vol.2, Edition 5 Measurement Units and Functions Measurement Ranging Mode Measurement Ranging Mode Before executing measurements, you select a ranging mode from the following four modes. You can set the ranging mode for each measurement unit. • “Auto Ranging” • “Limited Auto Ranging” • “Compliance Range” • “Fixed Range” The following table lists the allowable measurement ranging modes for each measurement mode. Table 7-21 Allowable Measurement Ranging Modes Measurement Mode Ranging Mode Sweep Measurement Auto, Limited Auto, Fixed Sampling Measurement (Initial Interval a ≥ 2 ms) Auto, Limited Auto, Fixed Sampling Measurement (Initial Interval a < 2 ms) Fixed Knob Sweep Compliance a. You specify initial interval on the MEASURE: SAMPLING SETUP screen. If you choose sweep measurement or sampling measurement (initial interval ≥ 2 ms) and you do not set a ranging mode, auto ranging is set for voltage measurement mode channel and limited auto (1nA) ranging is set for current measurement mode channel automatically. For sampling measurement (initial interval < 2 ms), an error occurs if fixed range is not set. Agilent 4155C/4156C User’s Guide Vol.2, Edition 5 7-29 Measurement Units and Functions Measurement Ranging Mode Auto Ranging The monitor unit automatically searches for and measures at the range that provides the highest resolution as follows: V measurement The unit changes ranges (up or down one range at a time) until the measurement value is between 10 % and 110 % of the range, then the unit performs the measurement. I measurement • 1 A to 1 µA The unit changes ranges (up or down one range at a time) until the measurement value is between 10 % and 114 % of the range, then the unit performs the measurement. If the measurement value is less than 1 % of the present range and the present range is 100 µA or higher range, the range changes down two ranges instead of one range. • 100 nA to 100 pA The unit changes ranges (up or down one range at a time) until the measurement value is between 10 % and 114 % of the range, then the unit performs the measurement. • 10 pA The unit changes to the next higher range when the measurement value exceeds 104 % of the present range. 7-30 Agilent 4155C/4156C User’s Guide Vol.2, Edition 5 Measurement Units and Functions Measurement Ranging Mode Limited Auto Ranging Limited auto ranging is similar to the auto ranging. But the limited auto ranging does not use the range(s) less than the range you specified. For example, if you select the 10 nA limited auto ranging, measurement unit does not use the 1 nA range or less. So the measurement time for limited auto ranging is less than for auto ranging. Monitor unit automatically searches for and measures at measurement range that provides highest resolution (but is not below the specified range) as follows: V measurement The unit changes ranges (up or down one range at a time, but not below specified range) until the measurement value is between 10 % and 110 % of the range, then the unit performs the measurement. If the specified range is greater than the lowest range that contains V compliance, the measurement is performed at the lowest range that contains V compliance. I measurement If specified range is greater than the lowest range that includes I compliance, an error occurs. • 1 A to 1 µA The unit changes ranges (up or down one range at a time, but not below specified range) until the measurement value is between 10 % and 114 % of the range, then the unit performs the measurement. If the measurement value is less than 1 % of the present range, and if present range is 100 µA or higher range, and if the present range is two or more ranges above the specified range, the range changes down two ranges instead of one range. • 100 nA to 100 pA The unit changes ranges (up or down one range at a time, but not below specified range) until the measurement value is between 10 % and 114 % of the range, then the unit performs the measurement. • 10 pA The unit changes to the next higher range when the measurement value exceeds 104% of the present range. Agilent 4155C/4156C User’s Guide Vol.2, Edition 5 7-31 Measurement Units and Functions Measurement Ranging Mode Compliance Range Compliance range is available for knob sweep measurement only. For details about setting compliance, refer to “Compliance” on page 7-23. V measurement The monitor unit measures at the lowest range that includes V compliance. For VMUs, compliance range is automatically set as follows. grounded mode 20 V differential mode 2V I measurement The monitor unit measures at the lowest range that includes I compliance. Fixed Range The monitor unit measures at the specified range only. For current measurement, if specified range is greater than the lowest range that includes I compliance, an error occurs. 7-32 Agilent 4155C/4156C User’s Guide Vol.2, Edition 5 Measurement Units and Functions Measurement Time Measurement Time Measurement time depends on integration time, measurement range, and other measurement conditions, and can be expressed by the following formula: Measurement time = Integration time + Overhead time Integration time is the time required for measurement, and does not include range changing, data compensation, and so on which would be the overhead time. Integration Time To reduce measurement errors caused by line frequency noise or any other environmental noise source, the 4155C/4156C takes some measurement samples and averages them to obtain measurement data. The number of measurement samples depends on the integration time. Setting a longer integration time increases the number of measurement samples, so you can get more accurate measurement data. The integration time setting is effective for the all measurement units. For the sweep and sampling measurements, integration time is set in the INTEG TIME field of the MEASURE: MEASURE SETUP screen, and selected by using the Integ Time front-panel keys (Long, Medium, and Short). For the quasi-static CV measurements, integration time is the value set in the INTEG TIME field of the MEASURE: QSCV MEASURE SETUP screen. The Short, Medium, and Long front-panel keys have no effect for QSCV mode. NOTE ADC Zero Function for Long/Medium ADC zero function automatically works to cancel the offset of the ADC and extends the integration time to double. This function is available for voltage measurements or current measurements using the 10 nA range or greater. However, in FLEX command control mode, you can disable this function by using the AZ command. LONG Long mode is effective when you need high resolution and noise reduction measurement, but the measurement is slow. To set long mode, press the Long front-panel key. Initial setting 16 PLC Integration time Available values: 2 PLC to 100 PLC with 1 PLC resolution For the current measurements, the integration time is automatically set as shown in Table 7-22. Agilent 4155C/4156C User’s Guide Vol.2, Edition 5 7-33 Measurement Units and Functions Measurement Time MEDIUM Medium mode automatically sets the integration time. You cannot change this value. To set medium mode, press the Medium front-panel key. Integration time 1 PLC For the current measurements, the integration time is automatically set as shown in Table 7-23. SHORT Short mode is effective when you need high-speed measurements, but the measurement data has lower resolution. To set short mode, press the Short front-panel key. In this mode, the ADC zero function is always disabled. Initial setting 640 µs Integration time Available values: 80 µs to 1.92 ms with 80 µs resolution. For the current measurements, if the integration time you set is from 960 µs to 1.92 ms, integration time is automatically set as shown in Table 7-24. Table 7-22 Integration Time in Long Mode (without ADC Zero) Measurement Range Integration Time (max. 100 PLC) 10 pA Always 100 PLC (HRSMU) 100 pA Setting value × 10 (HRSMU) 1 nA Setting value × 5 (HRSMU) Setting value (MPSMU / HPSMU) Table 7-23 10 nA to 100 mA Setting value 1A Setting value (HPSMU) Integration Time in Medium Mode (without ADC Zero) Measurement Range Integration Time 10 pA 50 PLC (HRSMU) 100 pA 10 PLC (HRSMU) 1 nA 5 PLC (HRSMU) 3 PLC (MPSMU / HPSMU) 7-34 10 nA to 100 mA 1 PLC 1A 1 PLC (HPSMU) Agilent 4155C/4156C User’s Guide Vol.2, Edition 5 Measurement Units and Functions Measurement Time Table 7-24 Integration Time in Short Mode (Integ time=0.96 to 1.92 ms) Measurement Range Integration Time Unit and Voltage Range a 10 pA 10 PLC HRSMU 100 pA 2 PLC HRSMU 1 nA 1 PLC HRSMU Setting value MPSMU/HPSMU using 40 V range or less Setting value × 2 MPSMU/HPSMU using 100 V range Setting value × 4 HPSMU using 200 V range Setting value × 4 HRSMU Setting value MPSMU / HPSMU Setting value × 2 HRSMU using 2 or 20 V range Setting value × 4 HRSMU using 40 or 100 V range Setting value MPSMU/HPSMU using 2 or 20 V range Setting value × 2 MPSMU/HPSMU using 40 V range Setting value × 4 MPSMU/HPSMU using 100 V range Setting value × 8 HPSMU using 200 V range Setting value HRSMU / MPSMU Setting value HPSMU using 100 V range or less Setting value × 2 HPSMU using 200 V range Setting value HRSMU using 2 V range Setting value × 2 HRSMU using 20 V range or more Setting value MPSMU/HPSMU using 2 or 20 V range Setting value × 2 MPSMU/HPSMU using 40 V range Setting value × 3 MPSMU/HPSMU using 100 V range Setting value × 6 HPSMU using 200 V range 100 µA to 100 mA Setting value HRSMU / MPSMU / HPSMU 1A Setting value HPSMU 10 nA 100 nA 1 µA 10 µA a. Voltage range is the output range used to force voltage. Agilent 4155C/4156C User’s Guide Vol.2, Edition 5 7-35 Measurement Units and Functions Measurement Time Overhead Time The overhead time is the time required for range changing and so on. This time depends on the measurement condition, and cannot be specified. Major elements of the overhead time are: • Range changing time during measurement (when measurement ranging mode is set to auto or limited auto) • Range changing time at measurement start (when the measurement range is less than the compliance value) To Specify Source Output Time As shown in the discussion of the overhead time, you cannot specify the measurement time. However, in sweep measurement mode, you can specify a source output time that includes the measurement time. To keep source output time constant, the following conditions must be satisfied. • Delay Time ≥ Wait Time • Step Delay Time ≥ Measurement time where, the wait time is the time after the source channel starts output until the measurement channel starts measurement. The wait time is set on the MEASURE: MEASURE SETUP screen. To find the measurement time, execute the sampling measurement in the same measurement conditions except for the source output value. You can find the rough measurement time from the @TIME value of the sampling measurement result. The delay time and hold time are set on the MEASURE: SWEEP SETUP screen, and the step delay time is set on the MEASURE: OUTPUT SEQUENCE screen. The step delay time is available only for sweep measurement mode. For the parameters, refer to Setup Screen Reference. Td Source output time Tsd Step Delay Time (Tsd) Delay Time (Td) Td Tsd Measurement time Hold Time Vstart 7-36 Wait Time Agilent 4155C/4156C User’s Guide Vol.2, Edition 5 Measurement Units and Functions SMU Filter SMU Filter You can set SMU filter to on or off for sampling measurements or stress forcing. If filter is on, noise and overshoot are decreased, but settling time takes longer. • sampling measurement You set the FILTER field on the MEASURE: SAMPLING SETUP screen. If you set initial interval to a short time, and if filter is set to ON, be aware that settling time takes several ms. • stress force You set the FILTER field on the STRESS: STRESS SETUP screen. If you set dc stress to short stress force time, set OFF in this field if you want the stress signal to be more pulsed shaped. • sweep measurement When you perform sweep measurements, the SMU filter conditions are automatically set as follows: For a pulsed SMU Filter is off. For non-pulsed SMUs Filters are on. Agilent 4155C/4156C User’s Guide Vol.2, Edition 5 7-37 Measurement Units and Functions Self-calibration Self-calibration Agilent 4155C/4156C provides the self-calibration function. To execute the self-calibration, do following: 1. Open the measurement terminals, or disconnect the device under test from the measurement terminals to perform the calibration properly. 2. Press System key in the PAGE CONTROL key group. 3. Select CALIB/DIAG primary softkey. The SYSTEM: SELF-CALIBRATION/DIAGNOSTICS screen is displayed. 4. Select CALIB ALL secondary softkey to start the calibration. After the calibration, each test result is displayed in each STATUS field. NOTE While calibration is executed, the 4155C/4156C cannot start the measurement. Auto Calibration The 4155C/4156C also provides the automatic calibration capability that triggers the self-calibration automatically every 30 minutes after the measurements, and executes the calibration. To enable the function, do following: 1. Move the pointer to the AUTO CALIB field on the SYSTEM: SELF-CALIBRATION/DIAGNOSTICS screen. 2. Select the ON secondary softkey. NOTE If you enable the function, do not forget to open the measurement terminals or to disconnect the device under test from the measurement terminals after the measurements. The measurement terminals should be opened during the calibration. 7-38 Agilent 4155C/4156C User’s Guide Vol.2, Edition 5 Measurement Units and Functions Zero Offset Cancel Zero Offset Cancel The 4155C/4156C has zero offset cancel function. This function allows you to minimize measurement error (offset) caused by resistance and leakage current of cables, prober, and so on. You can use the zero offset cancel function for: • low current measurement (measurement range ≤10 nA) by SMUs. • differential mode V measurement by VMUs. To Measure Offset Data To measure the offset data, do following: 1. Open the measurement terminals at the cable end of the device side. 2. Select the measurement range in the MEASUREMENT RANGE table on the MEASURE: MEASURE SETUP screen. See Table 7-25 for the ranging mode available. 3. Press green key and Stop front-panel key in this order. The ZERO CANCEL field is automatically set to ON, and offset data is measured. This data is used for the offset cancel. Allowable offset value is shown in Table 7-26. If offset data is too large, offset measurement for this measurement path is not performed. For this path, an * is marked in the ZERO CANCEL table. Then the previous data is used for the offset cancel. The initial offset data is 0. NOTE During offset measurement, integration time is automatically set to specified time or medium, whichever is longer. After offset data measurement, integration time returns to same setting as before the offset measurement was performed. NOTE After you perform the offset measurement, if you change the ranging mode to 10 nA limited auto or 10 nA fixed and you try to perform the offset measurement again, the offset data is not measured for this unit. But the previous offset data is effective. So the offset cancel can be performed for this unit using the old offset data. Agilent 4155C/4156C User’s Guide Vol.2, Edition 5 7-39 Measurement Units and Functions Zero Offset Cancel Table 7-25 Ranging Mode Available for Offset Measurement Measurement Mode Unit Current Measurement HPSMU, MPSMU Available Ranging Mode Measurement Range a auto 1 nA 1 nA limited or fixed 1 nA auto 10 pA 10 pA limited or fixed 10 pA 100 pA limited or fixed 100 pA 1 nA limited or fixed 1 nA auto, limited auto, fixed 0.2 V b HRSMU Differential Voltage Measurement VMU a. Offset data is measured in the measurement range shown above. b. VMU2 measures voltage in grounded mode to confirm that voltage does not exceed ±20 V. Table 7-26 Allowable Offset Value Measurement Mode Current Measurement Differential Voltage Measurement Unit Measurement Range Allowable Offset Value HPSMU 1 nA less than ±1 % of range MPSMU 1 nA less than ±1 % of range HRSMU 1 nA less than ±1 % of range 100 pA less than ±1 % of range 10 pA less than ±4 % of range 0.2 V less than ±1 % of range a VMU a. If VMU2 grounded mode measurement value is greater than or equal to ±20 V, error occurs. 7-40 Agilent 4155C/4156C User’s Guide Vol.2, Edition 5 Measurement Units and Functions Zero Offset Cancel To Perform Offset Cancel Offset cancel is automatically performed during measurement. The measurement execution and the offset cancel are explained below: 1. Select the measurement range in the MEASUREMENT RANGE table on the MEASURE: MEASURE SETUP screen. See Table 7-25 for the ranging mode available. 10 nA limited auto and 10 nA fixed are also available. When you set 10 nA range, offset cancel function uses the 1 nA range offset data for the data measured in both 1 nA range and 10 nA range. For the 100 nA range or more, offset cancel function is not available. 2. Set the ZERO CANCEL field to ON. Offset cancel is not performed for the measurement paths set to OFF in the ZERO CANCEL table. 3. Press Single, Repeat, or Append front-panel key to execute measurement. The offset cancel is automatically performed while measurement is performed. The measurement data is automatically compensated by using the offset data. And the compensated data is displayed on the GRAPH/LIST screen. To disable the offset cancel function, select the ZERO CANCEL ON/OFF softkey on the ZERO CANCEL field. It toggles ON and OFF. If you select OFF, all paths in the ZERO CANCEL table are set to OFF. If you select ON, only the available paths are set to ON. NOTE If measurement range setup is changed to a lower range than the range at which the offset data was measured, then offset cancel is not performed for the unit. For example, if HRSMU measurement range is changed to auto range from 1 nA fixed range after measuring offset data in 1 nA range, OFF is displayed in the unit's ZERO CANCEL field. Because it is possible that auto range will use range lower than 1 nA. Agilent 4155C/4156C User’s Guide Vol.2, Edition 5 7-41 Measurement Units and Functions QSCV Zero Offset Cancel QSCV Zero Offset Cancel This function is available for the quasi-static CV measurements. This function enables you to minimize measurement error (offset) caused by stray capacitance of cables, prober, and so on. To Measure Offset Data Measure the offset data, as follows: 1. Set the measurement conditions on the MEASURE: QSCV SETUP and MEASURE: QSCV MEASURE SETUP screen. The QSCV measurement setup must be completed before executing the offset measurement. The offset measurement uses setups on the screen. See Table 7-27. 2. Open the measurement terminals at the cable end of the device side. 3. Select the ON softkey in the ZERO CANCEL field on the MEASURE: QSCV MEASURE SETUP screen. 4. Press the green key and Stop front-panel key in this order. The measurement unit executes a one-point capacitance measurement between the start voltage and the stop voltage shown in Table 7-27. And the measured offset data is displayed in the field right next to the ZERO CANCEL field. The initial offset data is 0. NOTE Invalid Offset Data If one of the following conditions is detected during the offset measurement, an error message is displayed, and the offset data measurement is aborted. • Integration time is too short for the offset measurement • Leakage current is more than 70% of the measurement range When this happens, change the measurement conditions and execute the offset measurement again. 7-42 Agilent 4155C/4156C User’s Guide Vol.2, Edition 5 Measurement Units and Functions QSCV Zero Offset Cancel Table 7-27 Measurement Condition for the Offset Measurement Parameter for the offset measurement Internal setup (not the setup on the screen) Start voltage 0V Stop voltage Minimum value of the following values: • |setup value of the QSCV MEAS VOLTAGE field| × 2 • |setup value of the START field| • |setup value of the STOP field| or 5 V (if the all listed above is greater than 5 V) or 10 mV (if the all listed above is less than 10 mV) Hold time setup value of the HOLD TIME field Delay time 0 second Integration time for capacitance measurement a 0.5 sec + |setup value of the STOP field|1/4 sec for the 10 pA or 100 pA range Integration time for leakage current measurement b setup value of the LEAK field 80 msec for the 1 nA or 10 nA range a. If the integration time was too short for the offset measurement, the value is automatically changed to the setup value of the QSCV field, and the offset measurement is executed again. b. The leakage current data is just used for the offset data calculation. Agilent 4155C/4156C User’s Guide Vol.2, Edition 5 7-43 Measurement Units and Functions QSCV Zero Offset Cancel To Perform Offset Cancel Set the ZERO CANCEL field to ON, and start the quasi-static CV measurement. The offset cancel is automatically performed while measurement is performed. The measurement data is automatically compensated by using the offset data. The compensated data is displayed on the GRAPH/LIST screen. To disable the function, select the OFF softkey in the ZERO CANCEL field. NOTE When you change the measurement conditions If you change the following measurement conditions, the offset data will be deemed invalid. The message Offset data for previous setup. will appear. • When UNIT is changed: The ZERO CANCEL field is automatically set to OFF. Execute the offset measurement again. If you set the ZERO CANCEL field to ON without doing it again, the old data will be used for the offset cancel. • When RANGE is changed: Execute the offset measurement again. If you do not do it again, the old data will be used for the offset cancel. 7-44 Agilent 4155C/4156C User’s Guide Vol.2, Edition 5 Measurement Units and Functions Operation States Operation States The 4155C/4156C has the following four operation states. • “Idle State” • “Measurement State” • “Stress Force State” • “Standby State” Idle State In the idle state, the 4155C/4156C is not doing anything: no measurements, forcing current or voltage, forcing stress. An 4155C/4156C is in the idle state after applying power. In this state, output switches of all the measurement units are on, and all of the units output 0 V. In this state, you can modify any setting items on the setup screens. The following are the conditions of each unit and accessories in idle state. SMU 0 V output at 20 V range, and 100 µA compliance at 100 µA range VSU 0 V output at 20 V range PGU 0 V dc output at 20 V range (output impedance: LOW) GNDU 0 V output 16441A R-Box 0 Ω is connected. 16440A selector switching condition is SMU. Measurement State In the measurement state, an 4155C/4156C performs sampling or sweep measurements. The output switches are off for units that do not have entries in the CHANNELS table of the CHANNELS: CHANNEL DEFINITION screen. Agilent 4155C/4156C User’s Guide Vol.2, Edition 5 7-45 Measurement Units and Functions Operation States Stress Force State In the stress force state, the 4155C/4156C outputs stress. The output switches are off for units that do not have entries in the CHANNELS table of the STRESS: CHANNEL DEFINITION screen. Standby State In the standby state, the 4155C/4156C does not perform measurements or stress force, but it outputs dc bias and/or pulses using the measurement units defined as the standby channel. Following settings keep the same conditions as the previous state: • output switch of each unit • output impedance of PGUs • switching condition of the 16440A selector • resistance selection of the 16441A R-Box Changing among Operation States Figure 7-12 shows how to change among the operation states. • From measurement/stress states to idle state: If you perform measurements or force stress from the idle state, then the 4155C/4156C returns to the idle state after one of the following conditions occurs: • Measurement is finished. • Fixture lid is opened while an SMU is outputting more than ±40 V. • Stress is finished. • Stop 7-46 front-panel key is pressed. Agilent 4155C/4156C User’s Guide Vol.2, Edition 5 Measurement Units and Functions Operation States • From measurement/stress states to standby state: If you perform measurements or force stress from the standby state, then the 4155C/4156C returns to the standby state after one of the following conditions occurs: Figure 7-12 • Measurement is finished. • Stress is finished. • Stop front-panel key is pressed. Changing among the Operation States Agilent 4155C/4156C User’s Guide Vol.2, Edition 5 7-47 Measurement Units and Functions Output Sequence Output Sequence When you perform measurements or force stress, or when you use the standby function, you can specify an output sequence for the source channels. The 4155C/4156C has two output sequence modes: • sequential mode The source channels output in the order that you specify in the OUTPUT SEQUENCE table on the MEASURE: OUTPUT SEQUENCE screen. The source outputs are stopped in the opposite order. You can set the output sequence to prevent damage to DUTs. • simultaneous mode (for sampling measurements only) All the source channels output simultaneously. The source outputs are stopped in the opposite order that you specify in the OUTPUT SEQUENCE table on the MEASURE: OUTPUT SEQUENCE screen. For a sampling sequence example, see Chapter 3. For a stress sequence example, see Chapter 5. For a standby sequence example, see Chapter 8. 7-48 Agilent 4155C/4156C User’s Guide Vol.2, Edition 5 Measurement Units and Functions Output Sequence Sequential Mode Default output sequence in the sequential mode is shown below. In the default settings, output channels start the output in this order, and stop the output in the opposite order. 1. 2. 3. 4. 5. 6. 7. 8. SMU1 SMU2 SMU3 SMU4 VSU1 VSU2 PGU1 PGU2 Starting Outputs In the idle state, output switches of all units are on, and the units output 0 V. When moving to the measurement, stress force, or standby state, the units operate as shown below: 1. Disabled units keep 0 V output, and turn the output switch off. where disabled unit means the unit you select the DELETE ROW softkey in the CHANNELS table on the CHANNELS: CHANNEL DEFINITION screen. 2. Output channels start the output in the order specified in the OUTPUT SEQUENCE table. Stopping Outputs When returning to the idle state, the units operate as shown below: 1. Output channels stop the output in the opposite order of the OUTPUT SEQUENCE table. 2. Disabled units keep 0 V output, and turn the output switch on. Agilent 4155C/4156C User’s Guide Vol.2, Edition 5 7-49 Measurement Units and Functions Output Sequence Example Output sequence in the following conditions is shown in Figure 7-13. Figure 7-13 • Units available: SMU1 to SMU 4, VSU1 to VSU2. • Units disabled: SMU4 and VSU2. • Output sequence: No change from the default setting. Output Sequence Example for the Sequential Mode 7-50 Agilent 4155C/4156C User’s Guide Vol.2, Edition 5 Measurement Units and Functions Output Sequence Simultaneous Mode The simultaneous mode is available only for the sampling measurements. In this mode, all enabled units start the specified outputs at the same time, and stop the outputs in the opposite order of the OUTPUT SEQUENCE table. Default output sequence defined in the OUTPUT SEQUENCE table of the MEASURE: OUTPUT SEQUENCE screen is shown below. In the default settings, output channels stop the output in the opposite order of the following: 1. 2. 3. 4. 5. 6. 7. 8. SMU1 SMU2 SMU3 SMU4 VSU1 VSU2 PGU1 PGU2 Starting Outputs In the idle state, output switches of all units are on, and the units output 0 V. When moving to the measurement state, the units operate as shown below: 1. Disabled units keep 0 V output, and turn the output switch off. where disabled unit means the unit you select the DELETE ROW softkey in the CHANNELS table on the CHANNELS: CHANNEL DEFINITION screen. 2. Output channels start the output at the same time. Stopping Outputs When returning to the idle state, the units operate as shown below: 1. Output channels stop the output in the opposite order of the OUTPUT SEQUENCE table. 2. Disabled units keep 0 V output, and turn the output switch on. Agilent 4155C/4156C User’s Guide Vol.2, Edition 5 7-51 Measurement Units and Functions Output Sequence Example Output sequence in the following conditions is shown in Figure 7-14. Figure 7-14 • Units available: SMU1 to SMU 4, VSU1 to VSU2. • Units disabled: SMU4 and VSU2. • Output sequence: No change from the default setting. Default Output Sequence Example for the Simultaneous Mode 7-52 Agilent 4155C/4156C User’s Guide Vol.2, Edition 5 Measurement Units and Functions Measurement Sequence Measurement Sequence The 4155C/4156C performs measurements for the variables or user functions set to the following entry fields on the DISPLAY: DISPLAY SETUP screen. Then measurements will be performed in the following order. For the user functions, measurements will be performed for the variables defined in the functions. 1. NAME for X axis of the GRAPHICS table 2. NAME for Y1 axis of the GRAPHICS table 3. NAME for Y2 axis of the GRAPHICS table 4. NAME for No. 1 of the LIST table 5. NAME for No. 2 of the LIST table 6. NAME for No. 3 of the LIST table 7. NAME for No. 4 of the LIST table 8. NAME for No. 5 of the LIST table 9. NAME for No. 6 of the LIST table 10. NAME for No. 7 of the LIST table 11. NAME for No. 8 of the LIST table 12. Upper field of DATA VARIABLES 13. Lower field of DATA VARIABLES Exceptions If a variable is set to multiple fields or user functions, measurement will be performed only for the first entry. If a variable not set to the fields is defined in a user function not set to the fields, the 4155C/4156C performs measurement for the variable after the measurement for the variable set to the lower field of DATA VARIABLES. For the sampling measurements that use the stop condition, the 4155C/4156C performs measurement for the variable set to the following field before the measurement for the variable set to the NAME for X axis. • NAME, STOP CONDITION table, MEASURE: SAMPLING SETUP screen Agilent 4155C/4156C User’s Guide Vol.2, Edition 5 7-53 Measurement Units and Functions Measurement Sequence 7-54 Agilent 4155C/4156C User’s Guide Vol.2, Edition 5 8 Support Functions Agilent 4155C/4156C User’s Guide Vol.2, Edition 5 Support Functions This chapter explains functions that can be used in measurements. Agilent 4155C/4156C Semiconductor Parameter Analyzer and Agilent 41501A/B Expander has the following useful measurement functions. • “User Function and User Variable” • “Standby Function” • “R-BOX Control” • “SMU/PG Selector Control” • “Switching Matrix Control” • “Trigger Function” 8-2 Agilent 4155C/4156C User’s Guide Vol.2, Edition 5 Support Functions User Function and User Variable User Function and User Variable User function and user variable are kind of the 4155C/4156C internal data variable. The data variables are used for displaying and analyzing measurement results. You use data variables to assign output or measurement data to an axis for display. Each data variable has a name. You refer to a data variable by its name. The following are the three types of data variable: • “Output or Measurement Data” • “User Function” • “User Variable” Output or Measurement Data Data variables are available for the following measurement result data: • Output data that you set for SMU or VSU. • Measurement data of SMU or VMU. • Output data that you set for PGU. • Time data of sampling measurement. • Index of measurement result data. Output data of SMU or VSU The data variable names are the output names that you set in the VNAME or INAME columns of CHANNELS: CHANNEL DEFINITION screen. For a voltage MODE, the output name is specified in the VNAME column. For a current MODE, output name is specified in INAME column. Measurement data of SMU or VMU The data variable names are the measurement result names that you set in the VNAME or INAME columns of CHANNELS: CHANNEL DEFINITION screen. For a voltage MODE, the measurement result name is specified in the INAME column. For a current MODE, measurement result name is specified in VNAME column. Agilent 4155C/4156C User’s Guide Vol.2, Edition 5 8-3 Support Functions User Function and User Variable You can get the measurement results by using the measurement result names. If the corresponding SMU or VMU does not perform a measurement, invalid data is returned. Output data of PGU The data variables for PGU output are as follows: Set data Data variable name pulse peak VNAME for PGU that you defined on CHANNELS: CHANNEL DEFINITION screen is the data variable name for pulse peak voltage. pulse period @PGT is the data variable for pulse period. pulse duration @PGD is the data variable for duration time of pulse stress force. Duration time is the pulse count multiplied by pulse period. pulse delay time @PG1DL is the data variable for pulse delay time of PGU1. @PG2DL is the data variable for pulse delay time of PGU2. pulse width @PG1W is the data variable for pulse width of PGU1. @PG2W is the data variable for pulse width of PGU2. pulse base @PG1B is the data variable for pulse base voltage or current of PGU1. @PG2B is the data variable for pulse base voltage or current of PGU2. pulse leading @PG1LD is the data variable for leading-edge transition time of PGU1. @PG2LD is the data variable for leading-edge transition time of PGU2. pulse trailing @PG1TR is the data variable for trailing-edge transition time of PGU1. @PG2TR is the data variable for trailing-edge transition time of PGU2. Time data of sampling measurement @TIME is the data variable for time data of sampling measurement. Index of the measurement result data @INDEX is the data variable for index number of measurement data. The index number of the first data is 1. For a subordinate sweep measurement, the index number continues to increment by 1 between secondary sweep steps, that is, • last data of a primary sweep: index • first data of next primary sweep: index+1 8-4 Agilent 4155C/4156C User’s Guide Vol.2, Edition 5 Support Functions User Function and User Variable User Function A user function consists of one or more data variables used in an expression. You define the user function name, expression, and unit on the CHANNELS: USER FUNCTION DEFINITION screen. You can use a user function inside another user function. And you can set up the user function on the DISPLAY: DISPLAY SETUP screen to plot the user function values or display the numeric value. To define a user function, you define a name and an expression on the CHANNELS: USER FUNCTION DEFINITION screen. If desired, you can define a unit, such as ms. You can define up to 6 user functions. See example below. • User function name must start with alphabet character and can consist of maximum six alphanumeric characters. Name must be unique. Name is case sensitive. For example, Gm is different from gm. • Unit name is optional. Length: 1 to 6 characters. Valid characters: any characters. For the syntax of an expression, refer to “Expression” on page 8-9. Example To define a user function for mutual conductance gm of an FET, define gm on the CHANNELS: USER FUNCTION DEFINITION screen as follows: NAME gm UNIT S DEFINITION DELTA(Id)/DELTA(Vg) Agilent 4155C/4156C User’s Guide Vol.2, Edition 5 8-5 Support Functions User Function and User Variable User Variable A user variable is a data variable that is a numeric list, which is passed via GPIB commands of PAGE:CHANnels:UVARiable and TRACe|DATA subsystems from an external computer or the Internal IBASIC. For information about the PAGE:CHANnels:UVARiable and TRACe|DATA subsystems, refer to GPIB Command Reference. You can perform calculations between measurement results and the numeric list, or plot the numeric list on the GRAPH/LIST: GRAPHICS screen. To define a user variable, you define a name and an data size on the CHANNELS: USER VARIABLE DEFINITION screen. If desired, you can define a unit, such as ms. You can define up to 6 user variables. See example below. • User variable name must start with alphabet character and can consist of maximum six alphanumeric characters. Name must be unique. Name is case sensitive. For example, Gm is different from gm. • Unit name is optional. Length: 1 to 6 characters. Valid characters: any characters. Example To define a user variable for mutual conductance gm of an FET, define gm on the CHANNELS: USER VARIABLE DEFINITION screen as follows: NAME gm 8-6 UNIT S SIZE 101 Agilent 4155C/4156C User’s Guide Vol.2, Edition 5 Support Functions User Function and User Variable Calculation between variables of different length If you perform calculation between user variables, or between a user variable and a measurement data variable, and the number of data are different, the extra data in the longer variable are invalid. Example Following IBASIC program defines a user variable that has 5 data elements: 10 20 30 40 50 ASSIGN OUTPUT OUTPUT OUTPUT END @Hp4155 TO 800 @Hp4155;":FORM:DATA ASC" @Hp4155;":TRAC:DEF 'UVAR1',5" @Hp4155;":TRAC:DATA 'UVAR1',1.1,1.2,1.3,1.4,1.5" 20 Format of data to be transferred is ASCII format. 30 Defines the name of user variable and number of data. 40 Transfers the data. Agilent 4155C/4156C User’s Guide Vol.2, Edition 5 8-7 Support Functions User Function and User Variable Syntax of Data Variable Name A data variable name must start with alphabet character and can consist of maximum six alphanumeric characters. Refer to Figure 8-1. Figure 8-1 Syntax of Data Variable Name The name must be unique. Name is case sensitive. For example, Gm is different from GM. NOTE Using Built-in Function Name as Data Variable Name You can give a data variable name the same name as a built-in function. But if you use the name in an expression, the system considers the name to be a data variable name, not a built-in function name. So, in this case, you cannot use the built-in function in an expression. For the built-in function, see Chapter 9. 8-8 Agilent 4155C/4156C User’s Guide Vol.2, Edition 5 Support Functions User Function and User Variable Expression An expression can be used for following: NOTE • In a user function definition • As a condition for an automatic analysis function • For direct keyboard calculation Direct Keyboard Calculation You can directly calculate the value of an expression as follows: • Enter the expression by using the front-panel keys, press the green key, then press Enter. The value of the expression is displayed. If the expression contains data variables that are related to measurement points, the calculated value corresponds to the marker position. Figure 8-2 shows the syntax of an expression. Notice that an expression can be used within an expression. Figure 8-2 Expression Syntax Agilent 4155C/4156C User’s Guide Vol.2, Edition 5 8-9 Support Functions User Function and User Variable monadic operator Monadic operator performs operation on expression immediately to its right: − negative + positive dyadic operator Dyadic operator performs operation between two expressions: + addition - subtraction NOTE * multiplication / division ^ exponentiation Operation between data variables Operation between data variables is performed between data at the same measurement points. numeric constant Numeric constant can consist of digits, decimal point, and optional exponent notation. Refer to Figure 8-3 • Mantissa (decimal part) of greater than seven digits is truncated to seven digits. • The following predefined notations are available: 8-10 f 10-15 p 10-12 n 10-9 µ 10-6 u 10-6 m 10-3 k 103 M 106 G 109 Agilent 4155C/4156C User’s Guide Vol.2, Edition 5 Support Functions User Function and User Variable Figure 8-3 Numeric Constant scientific constant The following scientific constants are available: q electric charge. 1.60217710-19 k Boltzmann's constant. 1.38065810-23 e space permittivity. 8.85418810-12 data variable name Any data variable name. read out function keyword A keyword that invokes the 4155C/4156C’s built-in read out function. Refer to Chapter 9. built-in function keyword A keyword that invokes the 4155C/4156C’s built-in function. Refer to Chapter 9. Agilent 4155C/4156C User’s Guide Vol.2, Edition 5 8-11 Support Functions User Function and User Variable Arithmetic operator precedence When an expression contains more than one operation, the order of operation is determined by operator precedence. Operations with the highest precedence are performed first. Multiple operations with the same precedence are performed left to right. The following table shows the arithmetic operator precedence. Precedence Highest Operator Parentheses: (may be used to force any order of operations) Functions: built-in function and data variable Exponentiation: ^ Multiplication and division: * / Lowest 8-12 Addition, subtraction, monadic operators: + − Agilent 4155C/4156C User’s Guide Vol.2, Edition 5 Support Functions Standby Function Standby Function The 4155C/4156C can force standby outputs before starting or after stopping a measurement or stress. You can select dc or pulse bias for the standby output. Standby Channels Standby channels are the measurement units which force the standby output. SMUs, VSUs, and PGUs can be used for the standby channel. VMUs and GNDU are not available. To define a measurement unit as a standby channel, move the field pointer to the STBY field on the CHANNELS: CHANNEL DEFINITION screen, and select the STANDBY ON softkey. You cannot use the standby channel as the stress channel. The standby channels keep the standby output when the 4155C/4156C is in the stress force state. Standby State Before starting or after stopping a measurement or stress, if only the standby channels perform dc or pulse outputs, the 4155C/4156C is in the standby operation state. To start the standby output, press Standby front-panel key. Then the indicator is lit. However, if no units are defined as the standby channel, the 4155C/4156C cannot be in the standby state. To stop the standby output, press Standby front-panel key. The indicator is off. When the 4155C/4156C is in the standby state, you can change setting parameters for non-standby channels without changing the state. But if you modify the settings for the standby channels, the 4155C/4156C changes from the standby state to the idle state. Agilent 4155C/4156C User’s Guide Vol.2, Edition 5 8-13 Support Functions Standby Function Available Units and Output Values Following table shows the output value of the standby channels in the standby state. The specified values are the values that are set on the MEASURE setup screens. FCTN VAR1 VAR2 VAR1’ CONST Unit a MODE SMU VSU PGU V START START - I START - - VPULSE BASE - - IPULSE BASE - - V SOURCE SOURCE SOURCE I SOURCE - - VPULSE BASE - Specified pulses. b IPULSE BASE - - a. VMUs and GNDU cannot be set to the standby channel. b. Pulses as defined in MEASURE: PGU SETUP screen. If both PGUs are set to VPULSE, the STBY settings of both PGUs must be same. Output Values of non-Standby Channels Following table shows the output value of non-standby channels in the standby state. Function of Unit Output Value Voltage Output 0V Current Output Output value in the previous state. a Voltage Measurement - Current Measurement - Range Output Range used in the previous state. Output Range used in the previous state. a. outputs the latest value of previous state. For example, if previous state was measurement state and latest value of VAR1 was stop value, the stop value is output for VAR1 during standby. 8-14 Agilent 4155C/4156C User’s Guide Vol.2, Edition 5 Support Functions Standby Function Output Sequence of Standby Channels Output sequence of measurement units is defined on the MEASURE: OUTPUT SEQUENCE screen. Example output sequence setup is shown in the following table, and Figure 8-4 shows timing diagram of this example: Figure 8-4 Unit Output Sequence STBY SMU1 1 ON SMU3 2 OFF SMU4 3 OFF PGU1 4 ON PGU2 5 ON SMU2 6 ON Example of the Output Sequence of the Standby Channels Agilent 4155C/4156C User’s Guide Vol.2, Edition 5 8-15 Support Functions Standby Function When Getting Setup File Usually, the 4155C/4156C is in the idle state after getting setups from a file or an internal memory. But if all of the following must be true, the 4155C/4156C keeps the standby state: • standby channel assignments do not change • MODE and FCTN setups of standby channels do not change • Following setups of standby channels do not change: FCTN VAR1 VAR2 VAR1’ CONST MODE Parameters V START, STOP, COMPLIANCE a I START, COMPLIANCE VPULSE BASE, START, STOP, COMPLIANCE a IPULSE BASE, COMPLIANCE V START b, STOP b, COMPLIANCE a, OFFSET, RATIO I START b, COMPLIANCE, OFFSET, RATIO VPULSE BASE, START b, STOP b, COMPLIANCE a, OFFSET, RATIO IPULSE BASE, COMPLIANCE V SOURCE, COMPLIANCE a I SOURCE, COMPLIANCE, Pulse setup c VPULSE BASE, PEAK, COMPLIANCE a IPULSE BASE, COMPLIANCE a. This parameter is checked for SMUs only. b. This parameter is checked, even if VAR1 channel is not standby channel. c. PGU setups on the MEASURE: PGU SETUP screen. 8-16 Agilent 4155C/4156C User’s Guide Vol.2, Edition 5 Support Functions Standby Function To Use Standby Function 1. Press Chan key in the PAGE CONTROL key group. 2. Select CHANNEL DEF primary softkey. 3. In the STBY column of the desired unit, select STANDBY ON secondary softkey. 4. Press Standby key in the MEASUREMENT key group. The indicator above the Standby key shows whether the Standby function is enabled. If this indicator is ON, then for the units that you selected STANDBY ON, the units have the following output value during the Standby state (that is, before and after measurements or stress): Function of a Unit Output during Standby State VAR1 VAR1 Start value VAR1' Ratio × Start + Offset VAR2 VAR2 Start value CONSTANT Output value For sampling measurements, only the CONSTANT function is available. From Standby state, you can execute measurements or force stress by pressing Single, Repeat, Append, or Stress key. After measurement or stress, the STANDBY ON units are returned to same output value as before measurement or stress. If Standby indicator is ON, then pressing the Standby key disables the Standby function, and Standby output stops. Pressing the Stop key has no affect on the Standby state. Agilent 4155C/4156C User’s Guide Vol.2, Edition 5 8-17 Support Functions R-BOX Control R-BOX Control Agilent 16441A R-Box must be used for applications which need to connect a series resistor between SMU and DUT. For example, the R-Box is effective for the DUT protection. If sudden voltage change occurs at DUT, excessive current flows to the DUT, and it may damage the DUT without the R-Box. In other case, you may want to measure negative resistance characteristics. This application needs series resistor because SMUs cannot measure negative resistance. The 4155C/4156C automatically compensates for voltage drop of the series resistance value. So, the GRAPH/LIST screen group show the compensated data. For details of the 16441A R-Box, refer to Agilent 16441A R-Box User's Guide. Resistance Value The 16441A R-Box provides two sets of the series resistors. So you can connect two SMU channels to the R-Box. Resistance values of resistors are listed below: • 1 MΩ • 100 kΩ • 10 kΩ • 0Ω You can select the resistance values on the 4155C/4156C setup screen. The LEDs on the 16441A R-Box indicate the present resistance value. Connections Following table is the parts list of cables for connecting the 16441A R-Box. Agilent Model or Part Number Description 04155-61610 Control Cable 1.5 m 04155-61609 Control Cable 3.0 m 04155-61605 Triaxial Cable 0.4 m 16493K-001 Kelvin Triaxial Cable 1.5 m 16493K-002 Kelvin Triaxial Cable 3.0 m 8-18 Agilent 4155C/4156C User’s Guide Vol.2, Edition 5 Support Functions R-BOX Control Non-Kelvin Connections The following figure shows the 16441A R-Box connections using non-Kelvin connections. Kelvin Connections The following figure shows the 16441A R-Box connections using Kelvin connections. Only 0 ohm is available for the Kelvin connection. Agilent 4155C/4156C User’s Guide Vol.2, Edition 5 8-19 Support Functions R-BOX Control Setups You set resistance values in the SERIES RESISTANCE column on the CHANNELS: CHANNEL DEFINITION screen. You can set resistance values for the following SMUs: • SMU1 (to CH1 terminal of R-Box) • SMU2 (to CH2 terminal of R-Box) if the 41501A/B SMU/Pulse Generator Expander is not installed or does not have an HPSMU • SMU5 (to CH2 terminal of R-Box) if the 41501A/B is installed and has an HPSMU If you connect the 16441A R-Box to the SMUs described above, the 4155C/4156C automatically compensates for voltage drop of the resistance values. So, the measured data displayed on the screen and the results of user function are the compensated data. For the following SMUs, you can set 0 Ω only: • SMU that is set to standby channel • SMU that is set to COMMON output mode If the 4155C/4156C is on and an emergency occurs, the resistance value changes to 1 MΩ. There is a possibility that the 4155C/4156C cannot perform measurement circumstances. If you measure device characteristics including negative resistance over 1 MΩ, there is a possibility that they cannot measure it. NOTE If you connect the R-Box to SMUs other than described above, resistance values are not compensated for automatically. You need to compensate for the resistance values manually, such as by using a user function or calculation in the IBASIC program. NOTE To perform automatic compensation of R-Box, the 4155C/4156C automatically uses 1 SMU to measure current through the R-Box. So if the SMU forces voltage, and monitors voltage value or use the monitored value for user function calculation, the 4155C/4156C need additional 1 measurement channel other than the measurement channels defined in the CHANNELS: CHANNEL DEFINITION screen. 8-20 Agilent 4155C/4156C User’s Guide Vol.2, Edition 5 Support Functions R-BOX Control Circuit Diagram Figure 8-5 shows a simplified circuit diagram of an 16441A R-Box. Table 8-1 shows switching conditions for each setting. Table 8-1 Switching Conditions of the 16441A R-Box Switches Settings SW1 SW2 SW3 SW4 0Ω ON ON OFF OFF 10 kΩ OFF OFF OFF ON 100 kΩ OFF OFF ON OFF 1 MΩ OFF OFF OFF OFF Resistance is switched before and after measurement state. In the standby state, the stress state, and the idle state, 0 Ω is connected. Agilent 4155C/4156C User’s Guide Vol.2, Edition 5 8-21 Support Functions R-BOX Control Figure 8-5 Simplified Circuit Diagram of the 16441A R-Box 8-22 Agilent 4155C/4156C User’s Guide Vol.2, Edition 5 Support Functions R-BOX Control To Use R-Box 1. Connect the 16441A R-Box to the 4155C/4156C and to the 16442A/B Test Fixture or connector plate on your shield box. 2. Press Chan front-panel key of the PAGE CONTROL key group. 3. Select CHANNEL DEF primary softkey to display the CHANNELS: CHANNEL DEFINITION screen. 4. In the SERIES RESISTANCE fields, select: • 0 ohm secondary softkey to connect 0 Ω resistance. • 10k ohm secondary softkey to connect 10 kΩ resistance. • 100k ohm secondary softkey to connect 100 kΩ resistance. • 1M ohm secondary softkey to connect 1 MΩ resistance. Resistance is switched just before and just after measurement state. Example The following figure shows an example setup to connect 10 kΩ resistance to SMU1 and SMU2. Agilent 4155C/4156C User’s Guide Vol.2, Edition 5 8-23 Support Functions R-BOX Control To measure negative resistance characteristics The 16441A R-Box allows SMUs to measure current-controlled negative resistance ( 1 MΩ) characteristics. Connect the resistance of the 16441A as shown in following figure. 16441A R-Box R SMU 8-24 DUT Agilent 4155C/4156C User’s Guide Vol.2, Edition 5 Support Functions SMU/PG Selector Control SMU/PG Selector Control The 4155C/4156C can control the 16440A SMU/Pulse Generator Selector to automatically switch units that are connected to a DUT pin. You set up this automatic control using the SMU/PG SELECTOR field on the STRESS: CHANNEL DEFINITION screen. For example, you can specify to connect the PGU to the DUT during stress, and connect the SMU to the DUT during measurement. So, when you press the Stress key in the MEASUREMENT key group, the PGU is automatically connected to the DUT. And when you press a measurement key, the SMU is automatically connected to the DUT. You can use up to two selectors. For details about installation of the selectors, refer to User's Guide General Information. Figure 8-6 shows the simplified circuit diagram of an 16440A selector. Figure 8-6 Simplified Circuit Diagram of the 16440A Selector Agilent 4155C/4156C User’s Guide Vol.2, Edition 5 8-25 Support Functions SMU/PG Selector Control Setup and Switching Conditions Setup of the SMU/PG SELECTOR field and switching conditions are explained below: CH1 (or CH3 for second selector): Setup SW1 SW2 SW3 SMU ON OFF OFF Connects SMU. PGU OFF ON ON Connects PGU. PGU OPEN OFF ON OFF Open. Disconnected. OPEN OFF OFF OFF Open. Disconnected. Description CH2 (or CH4 for second selector): Setup NOTE SW1 SW2 Description SMU ON OFF Connects SMU. PGU OFF ON Connects PGU. OPEN OFF OFF Open. Disconnected. SW1 and SW2 are mechanical relays, and SW3 is a semiconductor switch. Leakage current and stray capacitance of SW1 and SW2 are less than for SW3. However, the switching speed of SW3 is faster and life is longer than SW1 and SW2. If you need to switch PGU many times, use PGU OPEN, not OPEN to disconnect PGU. Restrictions using Selector • 41501A/B Expander equipped with PGU must be connected to 4155C/4156C. • Kelvin connection is not available. 8-26 Agilent 4155C/4156C User’s Guide Vol.2, Edition 5 Support Functions SMU/PG Selector Control To Use Selector 1. Press Stress key in the PAGE CONTROL key group. 2. Select CHANNEL DEF primary softkey. 3. In the MEASURE field of the SMU/PG SELECTOR area, select one of the following softkeys. This field sets the switching status of selector in the measurement state. • SMU secondary softkey to connect SMU to DUT • PGU secondary softkey to connect PGU to DUT • OPEN secondary softkey to disconnect SMU, PGU, and DUT • PGU OPEN secondary softkey to disconnect PGU from DUT by semiconductor switch 4. In the STRESS field of the SMU/PG SELECTOR area, select one of the following softkeys. This field sets the switching status of selector in the stress force state. Example • SMU secondary softkey to connect SMU to DUT • PGU secondary softkey to connect PGU to DUT • OPEN secondary softkey to disconnect SMU, PGU, and DUT • PGU OPEN secondary softkey to disconnect PGU from DUT by semiconductor switch Following shows an example setup that connects two SMUs to DUT during measurement state, and connects two PGUs to DUT during stress force state. Agilent 4155C/4156C User’s Guide Vol.2, Edition 5 8-27 Support Functions Switching Matrix Control Switching Matrix Control The 4155C/4156C can control the Agilent E5250A Low Leakage Switch Mainframe installed with the E5252A matrix card. This section describes how to control the E5250A. • “Requirements” • “To Control Functions” • “To Control Connections” • “To Use Matrix Setup File” Requirements Prepare the instruments and cables listed in Table 8-2 and provide the following environment. For the location of the components on the E5250A rear panel, see Figure 8-7. Also, see Table 8-3 for the cable connections. 1. Install the E5252A card into the E5250A slot 1. The E5252A must be installed in slot 1. If you need more than 12 output ports, install the cards into the E5250A card slot continuously from slot 1. If a blank card or another card is in slot 2, 3, or 4, the 4155C/4156C ignores the cards installed in those slots as well as the cards in the following slots. 2. Set the GPIB address of the E5250A. You will define the value later on the 4155C/4156C CHANNELS: E5250A PROPERTIES screen. 3. Connect the GPIB cable between the E5250A and the 4155C/4156C. If an external computer is connected to the same GPIB bus, disconnect the GPIB cable from the computer, or pass the Active Controller capability to the 4155C/4156C. 4. Connect the triaxial cables between the E5250A SMU INPUT connectors and the 4155C/4156C SMU connectors, or the 41501 HPSMU/MPSMU connectors. 5. Connect the coaxial cables between the E5250A AUX INPUT connectors and the 4155C/4156C VSU/VMU connectors, 41501 PGU connectors, or other instruments. 6. Connect the triaxial cables between the E5252A output connectors and test fixture or prober via the connector plate. 8-28 Agilent 4155C/4156C User’s Guide Vol.2, Edition 5 Support Functions Switching Matrix Control 7. Turn the instruments on. 8. Set the 4155C/4156C to SYSTEM CONTROLLER, as shown below: Press the System front panel key and the MISCELLANEOUS softkey, then select the CONTROLLER softkey in the 4155C is or 4156C is field on the SYSTEM: MISCELLANEOUS screen. Table 8-2 Required Equipment Agilent Model Number Description Quantity 4155C/4156C Semiconductor Parameter Analyzer 1 41501 (optional) SMU/Pulse Generator Expander 1 E5250A Low Leakage Switch Mainframe 1 E5252A 10× 12 Matrix Card 1 to 4 GPIB Cable 1 Triaxial Cable a Coaxial Cable b Test Fixture or Prober with Connector Plate 1 a. Quantity depends on the number of SMU input ports and output ports you use. b. Quantity depends on the number of AUX input ports you use. Figure 8-7 Rear Panel View of Agilent E5250A 1 12 1 12 1 12 1 12 1 3 5 7 9 2 4 6 8 10 slot 1 slot 2 slot 3 slot 4 E5252A output connectors SMU INPUT GPIB connector AUX INPUT GPIB address switch Agilent 4155C/4156C User’s Guide Vol.2, Edition 5 8-29 Support Functions Switching Matrix Control Table 8-3 Connecting E5250A Connectors on E5250A Rear Panel SMU INPUT 1 SMU INPUT 2 Connect to 4155C/4156C SMU connector or 41501 HPSMU/MPSMU connector Entry field name and default setup on the E5250A PROPERTIES screen INPUT1, SMU1 INPUT2, SMU2 SMU INPUT 3 INPUT3, SMU3 SMU INPUT 4 INPUT4, SMU4 SMU INPUT 5 INPUT5, SMU5 SMU INPUT 6 INPUT6, SMU6 AUX INPUT 7 AUX INPUT 8 4155C/4156C VSU/VMU connector, 41501 PGU connector, or other instruments INPUT7, VSU1 INPUT8, VSU2 AUX INPUT 9 INPUT9, VMU1 AUX INPUT 10 INPUT10, VMU2 E5252A output Test fixture or Connector plate connected to prober n.a GPIB connector 4155C/4156C GPIB connector n.a 8-30 Agilent 4155C/4156C User’s Guide Vol.2, Edition 5 Support Functions Switching Matrix Control To Control Functions To control the E5250A functions, use the CHANNELS: E5250A PROPERTIES screen. Press the Chan front panel key, then select the E5250A PROP primary softkey. The E5250A PROPERTIES screen appears. CH AN NE LS : E 5250 A P RO PE RT IES *E 52 5 0A SET UP GPIB ADDRESS C ON T RO L CARD TYPE C ON F IG MOD E 01 JA N15 05: 04PM 22 OFF E5 25 2A NO RM AL *M AT R IX CON NEC TI ON M ODE PORT B IA S COU PLE PORT FCTN P OR T 1 3 5 C AR D 1 NO F CTN - -- - --- --- --C AR D 2 NO F CTN - -- - --- --- --C AR D 3 NO F CTN - -- - --- --- --C AR D 4 NO F CTN - -- - --- --- --*E 52 5 0A INP UT CO NN EC TIO N INPUT 1 SMU1 IN PU T 5 INPUT 2 SMU2 IN PU T 6 INPUT 3 SMU3 IN PU T 7 INPUT 4 SMU4 IN PU T 8 IN PU T 9 IN PU T 1 0 ST AT US 7 9 -- - -- -- - -- -- - -- -- - -- - CO NN RU LE FR EE FR EE FR EE FR EE CONN SEQ BBM BBM BBM BBM SMU5 SMU6 VSU1 VSU2 VMU1 VMU2 22 En te r GP I B addr ess o f E5 250 A (0 to 30) . CHANNEL DEF US ER FC TN US ER VAR S B E5 25 0A PR OP Step 1. To set GPIB address Enter the GPIB address of the E5250A into the GPIB ADDRESS field. Step 2. To set control mode In the CONTROL field, select the ON softkey. Then the 4155C/4156C sends a query for the present setup of the E5250A, and displays it. In the E5250A control ON status: • The E5250A SETUP primary softkey appears. Selecting the softkey displays the CHANNELS: E5250A CONNECTION SETUP screen. • You can access the E5250A setup (extension: MAT) file using the filer function. If you disable the E5250A control, select the OFF softkey. Agilent 4155C/4156C User’s Guide Vol.2, Edition 5 8-31 Support Functions Switching Matrix Control Step 3. To initialize the E5250A In the CONFIG MODE field, select the RESET E5250A softkey. All the E5250A settings will be initialized. Step 4. To select configuration mode In the CONFIG MODE field, select the E5250A configuration mode, either AUTO or NORMAL, using the softkey. Note that changing the mode initializes the E5250A setup except for the configuration mode. AUTO Sets auto configuration mode. In this mode, the installed cards are treated as one card. For example, if the E5252As are installed in slots 1 to 4, the E5250A works as a 48 output matrix. NORMAL Sets normal configuration mode. Each card is considered independently. Each card works as a 12-output matrix. Step 5. To select port function In the PORT FCTN field, select the port function using the following softkeys. You cannot use the bias port function and the couple port function simultaneously. NO FCTN Disables the port function. BIAS PORT Enables the bias port function connecting the input bias port to all output ports that are disconnected from other input ports. Select the bias port using the BIAS PORT field. COUPLE PORT Enables the couple port function that is effective for the kelvin connection. Select the coupled ports in the COUPLE PORT STATUS field. NOTE Connection after port function changed Changing the port function does not change the connection setup of the E5250A. However, by way of exception, changing the port function from the bias port function to the couple port function or no function will disconnect the output ports from the input port that has been used as the bias port. 8-32 Agilent 4155C/4156C User’s Guide Vol.2, Edition 5 Support Functions Switching Matrix Control Step 6. To set bias port (if you use the bias port function) In the BIAS PORT field, enter the port number of the E5250A input port to be used as the bias port. Available values are 1 to 10. Default value is 10. NOTE Connection after input bias port changed Changing the input port number of the bias port will disconnect the output bias ports from the previous input bias port and connect them to the new input bias port. Step 7. To set couple port (if you use the couple port function) In the COUPLE PORT STATUS field, select the ON or OFF softkey to enable/disable the couple port. The following input ports can be coupled: NOTE • INPUT1 and INPUT2 can be coupled to port 1. • INPUT3 and INPUT4 can be coupled to port 3. • INPUT5 and INPUT6 can be coupled to port 5. • INPUT7 and INPUT8 can be coupled to port 7. • INPUT9 and INPUT10 can be coupled to port 9. Operation of couple port Coupled ports work as described below: • When the coupled port is opened, coupled input ports INPUTm-1 and INPUTm are disconnected from all output ports. • When the coupled port is closed, coupled input ports INPUTm-1 and INPUTm are connected as follows: Input port INPUTm-1 is connected to output port n-1. Input port INPUTm is connected to output port n. Where, m and n are integers (even numbers). The maximum value is 10 for m, and 48 for n. Agilent 4155C/4156C User’s Guide Vol.2, Edition 5 8-33 Support Functions Switching Matrix Control Step 8. To select connection rule In the CONN RULE field, select the connection rule, either SROU or FREE, using the softkey. CAUTION SROU Sets the single route connection rule. Each input port can be connected to only one output port on a matrix card. FREE Sets the free connection rule. Each input port can be connected to multiple output ports and each output port can be connected to multiple input ports. Do not connect multiple inputs to an output If the free connection rule has been specified, ensure multiple input ports are not connected to the same output port. Such configurations can cause damage to the instrument connected to the input terminals. NOTE Connection after connection rule changed Changing the connection rule does not change the connection setup of the E5250A. So you may find the unmatched connections for the single rule on the CHANNELS: E5250A CONNECTION SETUP screen after you change the connection rule from free to single. Then select the APPLY OPEN ALL softkey to apply the open to all connections on the E5250A. Step 9. To select connection sequence In the CONN SEQ field, select the connection sequence, either BBM, MBBR, or NSEQ, using the softkey. BBM Sets the break-before-make sequence. This connection sequence breaks the previous connection, waits for an open status, and makes the new connection. MBBR Sets the make-before-break sequence. This connection sequence makes the new connection, waits for a close status, and breaks the previous connection. NSEQ Sets no sequence. This connection sequence breaks the previous connection, and then makes the new connection. 8-34 Agilent 4155C/4156C User’s Guide Vol.2, Edition 5 Support Functions Switching Matrix Control Step 10. To define E5250A input connection In the E250A INPUT CONNECTION fields, enter the unit name, device terminal name, or any identifications. The definitions are used to classify the E5250A input ports on the E5250A CONNECTION SETUP screen. If you define the unit name, use the softkeys. For the default settings, see Table 8-3. NOTE Value of INPUTn The INPUTn fields are labels used to classify the E5250A input ports. You can use another name instead of the unit name. Enter the name using the front-panel keys or keyboard. A maximum four of alphanumeric characters are available. The first character must be a letter of the alphabet. Agilent 4155C/4156C User’s Guide Vol.2, Edition 5 8-35 Support Functions Switching Matrix Control To Control Connections To control the matrix connections, select the E5250A SETUP softkey. The 4155C/4156C sends a query for the present setup of the E5250A, and displays it on the E5250A CONNECTION SETUP screen. CH AN NE LS : E 5250 A C ON NE CT IO N SET UP 01 JA N2 0 04: 13PM ARRAY * SE TU P DIS PLAY MO DE AR RA Y * MA TR IX CO NNEC TIO N ST AT US IN PU T PO RT 1 11 1 11 11 1 1222 22 123 4567 890 12 3 45 67 8 9012 34 X... .. . .... . .. ... .. .. .. . SM U1 .X.. .. . .... . .. ... .. .. .. . SM U2 ..X. .. . .... . .. ... .. .. .. . SM U3 ...X .. . .... . .. ... .. .. .. . SM U4 .... X. . .... . .. ... .. .. .. . SM U5 SM U6 VS U1 VS U2 VM U1 VM U2 LIST 2 222 23 33 33 33 5 678 90 12 34 56 ............ ............ ............ ............ ............ 3 33 4 4444 4444 7 89 0 1234 5678 . ... .. .. .. .. . ... .. .. .. .. . ... .. .. .. .. . ... .. .. .. .. . ... .. .. .. .. .... .x x xxxx x xx xxx xx xx xx x x xxxx xxx xxxx x xxx xx xx xx xx . :OPEN X :CLOSE _ : B I A S D IS A B L E D x : CLOS E O N BI AS P O RT ARRAY Se le ct S etu p Di spl ay M ode w it h so ft key or rota ry k n ob . CHANNEL DEF US ER FC TN US ER VAR S E5 25 0A PR OP B E5250A SETUP Step 1. To select the setup display mode In the SETUP DISPLAY MODE field, select the display mode using the following softkeys: ARRAY Sets the array display mode. You can define the matrix connections by using the softkeys. LIST Sets the list display mode. You can define the matrix connections by specifying the output port numbers. Step 2. To select card number (only for LIST display mode) When the CONFIG MODE is NORMAL and the SETUP DISPLAY MODE is LIST, the CARD NUMBER field is displayed. In this field, select the card for which you are going to set up the connection information on the screen. Use the CARD1, CARD2, CARD3, or CARD4 softkey to select the card. 8-36 Agilent 4155C/4156C User’s Guide Vol.2, Edition 5 Support Functions Switching Matrix Control Step 3. To change the enable input ports (for ARRAY display mode, optional) INPUT 1 to INPUT 4 are always enabled. INPUT 5 to INPUT 10 are selectable. You can select one from INPUT 5, 7, and 9 and you can also select one from INPUT 6, 8, and 10. To change the enable input port, move the pointer on the field of the input port that you are going to enable, then select the ENABLE PORT softkey. This softkey is not available for the enabled input port, the bias port, and the input ports that are internally connected to the bias port. For example, if you select the ENABLE PORT softkey on INPUT 7, then INPUT 5 and INPUT 9 are disabled, and INPUT 7 is enabled. The information for the disabled ports is cleared. In the figure on page 8-36, INPUT 1 to INPUT 5 and INPUT 8 are enabled. And INPUT 6, 7, 9, and 10 are disabled. Step 4. To change the enable input ports (for LIST display mode, optional) INPUT 1 to INPUT 4 are always enabled. INPUT 5 to INPUT 10 are selectable. You can select one from INPUT 5, 7, and 9 and you can also select one from INPUT 6, 8, and 10. To change the enable input port, move the pointer to the field of the INPUT 5 or INPUT 6 (SMU5 or SMU6 in the following figure). Then select the softkey that specifies the input port you want to enabled. For the bias port, only the softkey that specifies the bias port is available. The softkeys have the label you defined in the E5250A INPUT CONNECTION fields on the CHANNELS: E5250A PROPERTIES screen. INPUT PORT OUTPUT PORT NO. SMU1 1 SMU2 2 SMU3 3 SMU4 SMU5 SMU6 Can be replaced with input 7 or 9. 4-48 Can be replaced with input 8 or 10. Agilent 4155C/4156C User’s Guide Vol.2, Edition 5 8-37 Support Functions Switching Matrix Control Step 5. To define the matrix connection (for ARRAY display mode) Repeat the following steps until the connection setup definition is completed. To apply the definition to the E5250A, select the APPLY SETUP softkey. 1. Move the pointer to the point whose status you want to change. 2. Select the CLOSE softkey to define the close status. “X” will be displayed at this point. Select the OPEN softkey to define the open status. “.” will be displayed at this point. For the bias port, repeat the following steps until the bias status definition is completed. To apply the definition to the E5250A, select the APPLY SETUP softkey. 1. Move the pointer to the point whose bias status you want to change. 2. Select the BIAS DISABLE softkey to disable the bias port function. “_” will be displayed at this point. Select the BIAS ENABLE softkey to enable the bias port function. “x” or “.” will be displayed at this point. NOTE After defining the E5250A setup on the screen After defining the E5250A setup on the setup screen, do Step 7, Step 8, or Step 9. Then you can change the screen page, or execute the measurements. NOTE Output Port Numbers Output port numbers available are 1 to 12 for normal configuration mode. In auto configuration mode, available numbers are 1 to 12 (with 1 card), 1 to 24 (with 2 cards), 1 to 36 (with 3 cards), or 1 to 48 (with 4 cards). NOTE Setup Example The figure on page 8-36 shows an example to control the E5250A which installs three E5252As and in the AUTO configuration mode. The setup connects INPUT 1 (SMU1) through INPUT 5 (SMU5) to the output ports 1 through 5, respectively. Also the setup connects INPUT 8 (VSU2) to the output ports 6 to 36. The INPUT 8 (VSU2) is the input bias port. 8-38 Agilent 4155C/4156C User’s Guide Vol.2, Edition 5 Support Functions Switching Matrix Control Step 6. To define the matrix connection (for LIST display mode) Enter the output port numbers to be connected. Use a comma to specify multiple numbers. Use a hyphen for a continuous range of numbers. For example, 1, 6 specifies the output ports 1 and 6, and 1-12 specifies output ports 1 through 12. To apply the setup to the E5250A, select the APPLY SETUP softkey. NOTE After defining the E5250A setup on the screen After defining the E5250A setup on the setup screen, do Step 7, Step 8, or Step 9. Then you can change the screen page, or execute the measurements. NOTE Output Port Numbers Output port numbers 1 through 12 are available in NORMAL mode. In AUTO mode, the available numbers are 1 through 12 (with 1 card), 1 through 24 (with 2 cards), 1 through 36 (with 3 cards), or 1 through 48 (with 4 cards). NOTE Setup Example In the following example, the E5250A controls four E5252As in the AUTO configuration mode. Input port 6 (SMU6) is used as the bias port. INPUT 1 (SMU1) through INPUT 3 (SMU3) are connected to output port 1 through 3, respectively. INPUT 6 (SMU6) is connected to output ports 4 to 48. INPUT PORT OUTPUT PORT NO. SMU1 1 SMU2 2 SMU3 3 SMU4 SMU5 SMU6 4-48 Agilent 4155C/4156C User’s Guide Vol.2, Edition 5 8-39 Support Functions Switching Matrix Control Step 7. To apply the connection information to the E5250A Select the APPLY SETUP softkey to apply the setup to the E5250A. Step 8. To apply the open to all connections to the E5250A Select the APPLY OPEN ALL softkey to apply the open to all connections on the E5250A. The setup on the screen will be also changed to open all connections. Step 9. To cancel the setup changes on the screen Select the CANCEL SETUP CHANGE softkey to cancel the changes you made on the screen. The setup on the screen will be changed to the setup prior to the change. The E5250A connection setup is not changed. To Use Matrix Setup File The 4155C/4156C can save/get/copy/purge/rename the matrix setup file (extension: MAT). To access the matrix setup file, set the 4155C/4156C to the SYSTEM CONTROLLER, and set the E5250A control mode to ON; then use the filer function or press the Save/Get front panel keys. On the file operation screen, select the MAT secondary softkey in the TYPE field to specify the matrix setup file. The TYPE must be MAT. 8-40 Agilent 4155C/4156C User’s Guide Vol.2, Edition 5 Support Functions Trigger Function Trigger Function Trigger function is used to perform measurements synchronized with the measurements or source outputs by external instruments. Connection The following figure shows the connection between an 4155C/4156C and an external instrument. Agilent 4155C/4156C User’s Guide Vol.2, Edition 5 8-41 Support Functions Trigger Function Setup and restrictions • You cannot perform trigger outputs together with trigger inputs. You must select either trigger output or trigger input. • To use a trigger function, you must enable the trigger function and select either TRIG OUT or TRIG IN in the TRIGGER SETUP table on the MEASURE: OUTPUT SEQUENCE screen. Then the trigger inputs or outputs are performed automatically after you start a measurement by selecting a measurement front-panel key (Single, Repeat, or Append). • The trigger output function is not available for sampling measurements. • When you perform knob sweep measurements, the trigger function is not available. • For the electrical specifications of trigger signals, refer to User's Guide General Information. 8-42 Agilent 4155C/4156C User’s Guide Vol.2, Edition 5 Support Functions Trigger Function Trigger Input The 4155C/4156C can receive an edge trigger from external instruments via the trigger input terminal, and initiate a sweep or sampling measurement. Following figure shows examples of externally-triggered sampling and sweep measurements. For the trigger polarity, you can select positive or negative. Figure 8-8 Examples of Externally Triggered Measurements After you press the Single, Repeat, or Append front-panel key, the 4155C/4156C waits for the trigger signal only once. When the 4155C/4156C receives the trigger signal, the 4155C/4156C starts measurements. For staircase sweep measurements, you can specify the step delay time shown in Figure 8-8. Agilent 4155C/4156C User’s Guide Vol.2, Edition 5 8-43 Support Functions Trigger Function Trigger Output The 4155C/4156C triggers external instruments via the trigger output terminal. For the trigger polarity, you can select positive or negative. The trigger output function is not available for sampling measurements. Gate Trigger Output The 4155C/4156C can output gate triggers when forcing stress. When stress forcing starts, the trigger signal changes to the active level. When stress forcing finishes, the trigger signal changes to the non-active level. To use the gate trigger function, set the TRIGGER SETUP fields on the STRESS: CHANNEL DEFINITION screen. Edge Trigger Output For sweep measurements, the 4155C/4156C can output edge triggers, which are synchronized with each sweep step. To set the trigger output timing, use the following field on the MEASURE: OUTPUT SEQUENCE screen. Name of entry field depends on the measurement mode. Measurement Mode 8-44 Entry Field Pulse sweep measurement TRIG OUT DELAY Sweep measurement STEP DELAY Agilent 4155C/4156C User’s Guide Vol.2, Edition 5 Support Functions Trigger Function Trigger output delay time for pulsed sweep measurements. When using an SMU as a pulse source, the 4155C/4156C can output edge triggers at each pulse leading edge. Trigger output delay time (TRIG OUT DELAY) specifies how much to delay the trigger after the leading edge. So, you set the trigger output delay time to wait until the 4155C/4156C outputs a stable pulse peak value. Available setting range for the trigger output delay time is: Range: 0 to specified pulse width, maximum 32.7 ms Resolution: 100 µs Trigger output delay time is shown as T1 in the following figure. If you want the external instruments to make a measurement while the pulse peak value is being forced, the specified T1 and pulse width must satisfy the following equation: pulse width > T1 + Tex where, Tex means the measurement time. Agilent 4155C/4156C User’s Guide Vol.2, Edition 5 8-45 Support Functions Trigger Function Step delay time for staircase sweep measurements. When performing sweep measurements without a pulsed SMU, the 4155C/4156C outputs an edge trigger at the time when the 4155C/4156C starts performing measurement in each sweep step as shown in the following figure. The step delay time you specify for trigger is the time from when the trigger is output to when the next step occurs. This is to make sure the external instrument has enough time to make the measurement. Available setting range for the step delay time is: Range: 0 to 1 s Resolution: 100 µs Trigger output delay time is shown as T2 in the following figure. If the specified T2 is shorter than the measurement time of the 4155C/4156C, the 4155C/4156C waits until the measurement completes, then outputs the next step. 8-46 Agilent 4155C/4156C User’s Guide Vol.2, Edition 5 Support Functions Trigger Function Trigger output function of PGU Using the Agilent 41501A/B contains PGUs, the 4155C/4156C can output a gate trigger through the 41501A/B Ext Pulse Generator Trig Out terminal. The trigger signal is synchronized with the PGU output pulses, and you cannot control trigger timing. The polarity of the trigger is positive and the output level is TTL. The following figure shows the trigger signal. The leading-edge and tailing-edge of the trigger are synchronized with the leading-edge and tailing-edge of PGU1. This function allows you to perform multiple pulse outputs using external pulse generators synchronized with the PGUs. Agilent 4155C/4156C User’s Guide Vol.2, Edition 5 8-47 Support Functions Trigger Function 8-48 Agilent 4155C/4156C User’s Guide Vol.2, Edition 5 9 Built-in Functions Agilent 4155C/4156C User’s Guide Vol.2, Edition 5 Built-in Functions This chapter explains the following functions built in the Agilent 4155C/4156C, that are used for calculating or reading the measurement setup data and the measurement result data: • “Built-in Function” • “Read Out Function” 9-2 Agilent 4155C/4156C User’s Guide Vol.2, Edition 5 Built-in Functions Built-in Function You can use built-in functions for the following: • In the expression that is used to define a user function on the CHANNELS: USER FUNCTION DEFINITION screen. • As the condition for an automatic analysis function on the DISPLAY: ANALYSIS SETUP screen. • For direct keyboard calculations. The following functions are available: • ABS • AT • AVG • COND • DELTA • DIFF • EXP • INTEG • LGT • LOG • MAVG • MAX • MIN • SQRT Agilent 4155C/4156C User’s Guide Vol.2, Edition 5 9-3 Built-in Functions ABS ABS Returns the absolute value of the expression. Syntax ABS(expression) Example To return the absolute value of ID: ABS(ID) AT Returns the value of 1st expression at the index number specified by the 2nd expression. Syntax AT(1st expression,2nd expression) If 2nd expression is not integer, linear interpolated value of 1st expression will be returned. Example To return difference of Id from its first value: Id-AT(Id,1) AVG Returns the average value of sweep data or sampling data. Syntax AVG(expression) For subordinate sweep measurement, this function returns the average value of the primary sweep for the secondary sweep step. Example To return the absolute value of ID: AVG(ID) 9-4 Agilent 4155C/4156C User’s Guide Vol.2, Edition 5 Built-in Functions COND COND This function does the following: Syntax • If 1st expression < 2nd expression, returns 3rd expression. • If 1st expression ≥ 2nd expression, returns 4th expression. COND(1st expression,2nd expression,3rd expression,4th expression) If value of 1st expression or a 2nd expression is invalid, the value for the previous measurement index number is used for the comparison. Example COND(ID-VG,SQRT(ID)-VG,VD,VGS-VTH) returns: • VD if ID-VG < SQRT(ID)-VG. • VGS-VTH if ID-VG ≥ SQRT(ID)-VG. Agilent 4155C/4156C User’s Guide Vol.2, Edition 5 9-5 Built-in Functions DELTA DELTA Returns the difference of the expression. Syntax DELTA(expression) The difference is defined as follows: δn = (a2 −a1) δn = (an+1 −an−1)/2 δn = (aN −aN−1) when n = 1 when 1 < n < N when n = N Where, δn: an: value of an expression for measurement index number n. N: number of sweep steps or number of samples. difference for measurement index number n. For each primary sweep, use same definition as for basic sweep measurement and assume measurement index number 1 for the first step of each primary sweep. If expression is a data variable for a secondary sweep source, this function returns the sweep step value of the secondary sweep. Example To return the difference of ID: DELTA(ID) 9-6 Agilent 4155C/4156C User’s Guide Vol.2, Edition 5 Built-in Functions DIFF DIFF Returns differential coefficient of 1st expression by 2nd expression. Syntax DIFF(1st expression,2nd expression) The differential coefficient is defined as follows: y’n = (y2 −y1)/(x2 −x1) y’n = (yn+1 −yn−1)/(xn+1 −xn−1) y’n = (yN −yN−1)/(xN −xN−1) when n = 1 when 1 < n < N when n = N Where, y’n: yn: xn: differential coefficient for measurement index number n. N: number of sweep steps or number of samples. value of 1st expression for measurement index number n. value of 2nd expression for measurement index number n. For each primary sweep, use same definition as for basic sweep measurement and assume measurement index number 1 for the first step of each primary sweep. Example To return the 2nd order differential coefficient of ID by VG: DIFF(DIFF(ID,VG),VG) Agilent 4155C/4156C User’s Guide Vol.2, Edition 5 9-7 Built-in Functions EXP EXP Raises e to the power of expression. Syntax EXP(expression) Example To raise e to the power of the ID: EXP(ID) INTEG Performs numerical integration of the 1st expression by the 2nd expression. Syntax INTEG(1st expression,2nd expression) This operation is defined as follows: when n = 1, σn = 0 when n > 1, σn is presented by the following equation: n Σ αn = 1 (y +y )(x - x ) 2 i = 2 i i- 1 i i- 1 Where, σn: ri: xi: integral of 1st expression for measurement index number n. value of 1st expression for measurement index number i. value of 2nd expression for measurement index number i. If there are some invalid values in the expressions, the invalid values are ignored for the calculation. For each primary sweep, use same definition as for basic sweep measurement and assume measurement index number 1 for the first step of each primary sweep. Example To integrate ID by VD: INTEG(ID,VD) 9-8 Agilent 4155C/4156C User’s Guide Vol.2, Edition 5 Built-in Functions LGT LGT Returns the logarithm (base 10) of expression. Syntax LGT(expression) If the expression is: Example 0 -Overflow is returned with status of "Arithmetic error". negative value logarithm of absolute value is returned with status of "Arithmetic error". To return the logarithm of ID: LGT(ID) LOG Returns the logarithm (base e) of expression. Syntax LOG(expression) If the expression is: Example 0 -Overflow is returned with status of "Arithmetic error". negative value logarithm of absolute value is returned with status of "Arithmetic error". To return the logarithm of ID: LOG(ID) Agilent 4155C/4156C User’s Guide Vol.2, Edition 5 9-9 Built-in Functions MAVG MAVG Returns the moving average value of 1st expression. The 2nd expression specifies how many measurement points to use for average. Syntax MAVG(1st expression,2nd expression) This operation is defined as follows: The moving average at measurement index number n is defined as follows: when n ≤ r xn = 1 r+n n+r Σ xi i=1 when r < n ≤ N-r xn = 1 2r + 1 n+r Σ xi i = n- r when N-r < n xn = 1 r + N - n+1 N Σ xi i=n- r Where, xn : moving average of the 1st expression for measurement index number n. xi : value of the 1st expression for measurement index number i. r: value of the 2nd expression. N: number of sweep steps or number of samples. If there are some invalid values in the 1st expression, the invalid values are ignored for the calculation. For each primary sweep, use same definition as for basic sweep measurement and assume measurement index number 1 for the first step of each primary sweep. Example To return the moving average value of ''ID'' by using five measurement values: MAVG(ID,5) 9-10 Agilent 4155C/4156C User’s Guide Vol.2, Edition 5 Built-in Functions MAX MAX Returns the maximum sweep or sampling value. Syntax MAX(expression) For subordinate sweep measurement, this function returns the maximum value of the primary sweep for the secondary sweep step. If there are invalid values in expression, invalid values are ignored. Example To return the maximum value of ID: MAX(ID) MIN Returns the minimum sweep or sampling value. Syntax MIN(expression) For subordinate sweep measurement, this function returns the minimum value of the primary sweep for the secondary sweep step. If there are invalid values in expression, invalid values are ignored. Example To return the minimum value of ID: MIN(ID) SQRT Returns the square root of the expression. Syntax SQRT(expression) Example To return the square root of ID: SQRT(ID) Agilent 4155C/4156C User’s Guide Vol.2, Edition 5 9-11 Built-in Functions Read Out Function The read out functions are built-in functions for reading various values related to the maker, cursor, or line. You can use these functions to perform complex analysis of the measurement results. You can use read out functions for the following: • In the expression that is used to define a user function on the CHANNELS: USER FUNCTION DEFINITION screen. • As a condition for an automatic analysis function on the DISPLAY: ANALYSIS SETUP screen. • For direct keyboard calculations. The following functions are available: Function Read Out Function Marker @MI, @MX, @MY, @MY1, @MY2 Cursor @CX, @CY, @CY1, @CY2 Line @IX, @IY, @IY1, @IY2, @L1CO, @L1G, @L1G1, @L1G2, @L1X, @L1Y, @L1Y1, @L1Y2, @L2CO, @L2G, @L2G1, @L2G2, @L2X, @L2Y, @L2Y1, @L2Y2 The following are restrictions for using read out functions: • GRAPHICS must be selected in the DISPLAY MODE field on the DISPLAY: DISPLAY SETUP screen when you use the read out function. If not, invalid data is returned. (@MI is an exception. @MI can be used in GRAPHICS or LIST mode.) • If the marker, cursor, or line that are referred to by the read out function are not displayed, the read out function uses the position at which it was most recently displayed. If the marker, cursor, and line have not been displayed, the read out function returns invalid data. • You cannot assign a data variable that includes a read out function to an axis of graphics plot. 9-12 Agilent 4155C/4156C User’s Guide Vol.2, Edition 5 Built-in Functions @CX @CX Returns the value of X coordinate at the active cursor position. Syntax: @CX @CY Returns the value of Y coordinate at the active cursor position. Syntax: @CY If there are Y1 and Y2 axes, this function returns the value for selected axis. @CY1 Returns the value of Y1 coordinate at the active cursor position. Syntax: @CY1 @CY2 Returns the value of Y2 coordinate at the active cursor position. Syntax: @CY2 Agilent 4155C/4156C User’s Guide Vol.2, Edition 5 9-13 Built-in Functions @IX @IX Returns the value of X coordinate at the cross point of LINE1 and LINE2. Syntax: @IX This function calculates the cross point by using the following formula: x =(y2-y1)/(α2-α1) Where, x: Value of X coordinate at the cross point. If the X axis is logarithmic scale, this function returns 10x. yn : Y-intercept value of LINEn. If the Y axis is logarithmic scale, yn is the log value of the y intercept of LINEn. αn : Slope of LINEn. If LINE1 is parallel to LINE2, this function returns invalid data with the status "Arithmetic error". @IY Returns the value of Y coordinate at the cross point of LINE1 and LINE2. Syntax: @IY If there are Y1 and Y2 axes, this function returns the value for selected axis. This function calculates the cross point by using the following formula: y = y1+α1 × (y2-y1)/(α1-α2) Where, y: Value of Y coordinate at the cross point. If the Y axis is logarithmic scale, this function returns 10y. yn : Y-intercept value of LINEn. If the Y axis is logarithmic scale, yn is the log value of the y intercept of LINEn. αn : Slope of LINEn. If LINE1 is parallel to LINE2, this function returns invalid data with the status "Arithmetic error". 9-14 Agilent 4155C/4156C User’s Guide Vol.2, Edition 5 Built-in Functions @IY1 @IY1 Returns the value of Y1 coordinate at the cross point of LINE1 and LINE2. Syntax: @IY1 This function calculates the cross point by using the following formula: y1= y1+α1 × (y2-y1)/(α1-α2) Where, y1 : Value of Y1 coordinate at the cross point. If the Y1 axis is logarithmic scale, this function returns 10y1. yn : Y1-intercept of LINEn. If the Y1 axis is logarithmic scale, yn is the log value of the Y1 intercept of LINEn. αn : Slope of LINEn. If LINE1 is parallel to LINE2, this function returns invalid data with the status "Arithmetic error". @IY2 Returns the value of Y2 coordinate at the cross point of LINE1 and LINE2. Syntax: @IY2 This function calculates the cross point by using the following formula: y2= y1+α1 × (y2-y1)/(α1-α2) Where, y2 : Value of Y2 coordinate at the cross point. If the Y2 axis is logarithmic scale, this function returns 10y2. yn : Y2-intercept of LINEn. If the Y2 axis is logarithmic scale, yn is the log value of the Y2 intercept of LINEn. αn : Slope of LINEn. If LINE1 is parallel to LINE2, this function returns invalid data with the status "Arithmetic error". Agilent 4155C/4156C User’s Guide Vol.2, Edition 5 9-15 Built-in Functions @L1CO @L1CO Returns the correlation coefficient of the regression for LINE1. Syntax: @L1CO LINE1 must be in regression mode. If not, this function returns invalid data. @L1G Returns the slope of LINE1. Syntax: @L1G If there are Y1 and Y2 axes, this function returns the value for selected axis. This function calculates the slope by using the following formula: • If X and Y axes are both linear scaling: α = (y1 −y0)/(x1 −x0) • If X axis is logarithmic scaling, and Y axis is linear scaling: α = (y1 −y0)/(log x1 −log x0) • If X axis is linear scaling, and Y axis is logarithmic scaling: α = (log y1 − log y0)/(x1 −x0) • If X and Y axes are both logarithmic scaling: α = (log y1 − log y0)/(log x1 −log x0) Where, α: Slope of LINE1. x0 ,y0 ,x1 ,y1 : X and Y coordinate values at the two points where LINE1 intercepts the perimeter of the plotting area. 9-16 Agilent 4155C/4156C User’s Guide Vol.2, Edition 5 Built-in Functions @L1G1 @L1G1 Returns the slope of LINE1 for Y1 axis. Syntax: @L1G1 This function calculates the slope by using the following formula: • If X and Y1 axes are both linear scaling: α = (y1 −y0)/(x1 −x0) • If X axis is logarithmic scaling, and Y1 axis is linear scaling: α = (y1 −y0)/(log x1 −log x0) • If X axis is linear scaling, and Y1 axis is logarithmic scaling: α = (log y1 − log y0)/(x1 −x0) • If X and Y1 axes are both logarithmic scaling: α = (log y1 − log y0)/(log x1 −log x0) Where, α: Slope of LINE1. x0 ,y0 ,x1 ,y1 : X and Y1 coordinate values at the two points where LINE1 intercepts the perimeter of the plotting area. Agilent 4155C/4156C User’s Guide Vol.2, Edition 5 9-17 Built-in Functions @L1G2 @L1G2 Returns the slope of LINE1 for Y2 axis. Syntax: @L1G2 This function calculates the slope by using the following formula: • If X and Y2 axes are both linear scaling: α = (y1 −y0)/(x1 −x0) • If X axis is logarithmic scaling, and Y2 axis is linear scaling: α = (y1 −y0)/(log x1 −log x0) • If X axis is linear scaling, and Y2 axis is logarithmic scaling: α = (log y1 − log y0)/(x1 −x0) • If X and Y2 axes are both logarithmic scaling: α = (log y1 − log y0)/(log x1 −log x0) Where, α: Slope of LINE1. x0 ,y0 ,x1 ,y1 : X and Y2 coordinate values at the two points where LINE1 intercepts the perimeter of the plotting area. 9-18 Agilent 4155C/4156C User’s Guide Vol.2, Edition 5 Built-in Functions @L1X @L1X Returns the X intercept value (Y=0) of LINE1. Syntax: @L1X If LINE1 is horizontal, this function returns invalid data. @L1Y Returns the Y intercept value (X=0) of LINE1. Syntax: @L1Y If there are Y1 and Y2 axes, this function returns the value for selected axis. If LINE1 is vertical, this function returns invalid data. @L1Y1 Returns the Y1 intercept value (X=0) of LINE1. Syntax: @L1Y1 If LINE1 is vertical, this function returns invalid data. @L1Y2 Returns the Y2 intercept value (X=0) of LINE1. Syntax: @L1Y2 If LINE1 is vertical, this function returns invalid data. @L2CO Returns the correlation coefficient of the regression for LINE2. Syntax: @L2CO LINE2 must be in regression mode. If not, this function returns invalid data. Agilent 4155C/4156C User’s Guide Vol.2, Edition 5 9-19 Built-in Functions @L2G @L2G Returns the slope of LINE2. Syntax: @L2G If there are Y1 and Y2 axes, this function returns the value for selected axis. This function calculates the slope by using the following formula: • If X and Y axes are both linear scaling: α = (y1 −y0)/(x1 −x0) • If X axis is logarithmic scaling, and Y axis is linear scaling: α = (y1 −y0)/(log x1 −log x0) • If X axis is linear scaling, and Y axis is logarithmic scaling: α = (log y1 − log y0)/(x1 −x0) • If X and Y axes are both logarithmic scaling: α = (log y1 − log y0)/(log x1 −log x0) Where, α: Slope of LINE2. x0 ,y0 ,x1 ,y1 : X and Y coordinate values at the two points where LINE2 intercepts the perimeter of the plotting area. 9-20 Agilent 4155C/4156C User’s Guide Vol.2, Edition 5 Built-in Functions @L2G1 @L2G1 Returns the slope of LINE2 for Y1 axis. Syntax: @L2G1 This function calculates the slope by using the following formula: • If X and Y1 axes are both linear scaling: α = (y1 −y0)/(x1 −x0) • If X axis is logarithmic scaling, and Y1 axis is linear scaling: α = (y1 −y0)/(log x1 −log x0) • If X axis is linear scaling, and Y1 axis is logarithmic scaling: α = (log y1 − log y0)/(x1 −x0) • If X and Y1 axes are both logarithmic scaling: α = (log y1 − log y0)/(log x1 −log x0) Where, α: Slope of LINE2. x0 ,y0 ,x1 ,y1 : X and Y1 coordinate values at the two points where LINE2 intercepts the perimeter of the plotting area. Agilent 4155C/4156C User’s Guide Vol.2, Edition 5 9-21 Built-in Functions @L2G2 @L2G2 Returns the slope of LINE2 for Y2 axis. Syntax: @L2G2 This function calculates the slope by using the following formula: • If X and Y2 axes are both linear scaling: α = (y1 −y0)/(x1 −x0) • If X axis is logarithmic scaling, and Y2 axis is linear scaling: α = (y1 −y0)/(log x1 −log x0) • If X axis is linear scaling, and Y2 axis is logarithmic scaling: α = (log y1 − log y0)/(x1 −x0) • If X and Y2 axes are both logarithmic scaling: α = (log y1 − log y0)/(log x1 −log x0) Where, α: Slope of LINE2. x0 ,y0 ,x1 ,y1 : X and Y2 coordinate values at the two points where LINE2 intercepts the perimeter of the plotting area. 9-22 Agilent 4155C/4156C User’s Guide Vol.2, Edition 5 Built-in Functions @L2X @L2X Returns the X intercept value (Y=0) of LINE2. Syntax: @L2X If LINE2 is horizontal, this function returns invalid data. @L2Y Returns the Y intercept value (X=0) of LINE2. Syntax: @L2Y If there are Y1 and Y2 axes, this function returns the value for selected axis. If LINE2 is vertical, this function returns invalid data. @L2Y1 Returns the Y1 intercept value (X=0) of LINE2. Syntax: @L2Y1 If LINE2 is vertical, this function returns invalid data. @L2Y2 Returns the Y2 intercept value (X=0) of LINE2. Syntax: @L2Y2 If LINE2 is vertical, this function returns invalid data. @MI Returns the index number of measurement data at the marker location. Syntax: @MI This function can be used in both GRAPHICS and LIST display modes. If the interpolation mode is enabled in GRAPHICS display and the marker is located between the measurement data, this function returns a non-integer value. Agilent 4155C/4156C User’s Guide Vol.2, Edition 5 9-23 Built-in Functions @MX @MX Returns the value of the X coordinate at the marker location. Syntax: @MX @MY Returns the value of the Y coordinate at the marker location. Syntax: @MY If there are Y1 and Y2 axes, this function returns the value for selected axis. @MY1 Returns the value of the Y1 coordinate at the marker location. Syntax: @MY1 @MY2 Returns the value of the Y2 coordinate at the marker location. Syntax: 9-24 @MY2 Agilent 4155C/4156C User’s Guide Vol.2, Edition 5 10 Connecting Measurement Devices Agilent 4155C/4156C User’s Guide Vol.2, Edition 5 Connecting Measurement Devices This section describes how to connect device under test (DUT) to the 16442A/B test fixture, and how to connect cables to the connector plate. For connecting the test fixture or the connector plate to the 4155C/4156C, see User's Guide General Information. If you use a wafer prober, see wafer prober manuals. Note that you must set the 4155C/4156C to the idle state when connecting or disconnecting DUTs. If not, the DUTs may be damaged. To set to idle state, press Stop key and make sure Standby indicator is off. This section has the following descriptions: • “Using Test Fixture” • “Using Connector Plate” 10-2 Agilent 4155C/4156C User’s Guide Vol.2, Edition 5 Connecting Measurement Devices Using Test Fixture Using Test Fixture 1. Press the Stop front-panel key to set your 4155C/4156C to idle state. If the standby indicator is lit, press the Standby front-panel key. 2. Select a proper socket module for your DUT, then set the module on the test fixture. 3. Mount your DUT on the socket module. 4. Connect between the socket module and the test fixture by using the proper test leads. 5. Close the lid of the test fixture. To force more than ±40 V, close the lid of the test fixture. Otherwise, the interlock function will stop the 4155C/4156C output. To connect between the socket module and the test fixture, you can use test leads that have the following terminals: • Miniature banana miniature banana • Miniature banana pin plug • Miniature banana miniature clip CAUTION Do not connect or disconnect your DUT while the 4155C/4156C is forcing voltage or current. Otherwise, your DUT may be damaged. CAUTION Do not touch the terminals of the test leads. Oil, perspiration, and dirt prevent good electrical contact, deteriorate insulation, and degrade measurement accuracy. Agilent 4155C/4156C User’s Guide Vol.2, Edition 5 10-3 Connecting Measurement Devices Using Test Fixture Connections for High Current Measurements When you force or measure a large current, you may want to use a Kelvin (4-wire) connection to eliminate the residual resistance effects of test leads and contacts. For example, you can use the following connections as Kelvin connections on the test fixture. The Kelvin connection is available for the 4156C’s HRSMU and 41501A/B’s HPSMU. Examples: Kelvin Connection SMU(±200V= 1A Max) 1 2 3 (Selected) Force Sense Force Sense Force Sense Guard Guard Guard Guard Guard Guard Drain Gate Substrate Source To cancel the effects of the residual resistance, test leads must be connected as close as possible to the DUT. 10-4 Agilent 4155C/4156C User’s Guide Vol.2, Edition 5 Connecting Measurement Devices Using Connector Plate Using Connector Plate This section provides the information useful for connecting cables and probing needles to a connector plate. • “To Reduce Leakage Current” • “To Measure Low Resistance” To Reduce Leakage Current To reduce the leakage current caused by connection cables, the guard technique is effective. Connect the probing needles to the terminals of the connector plate by using coaxial cables as shown below: 1. At end of cable, connect coaxial center conductor to force terminal of connector plate, and connect coaxial outer conductor to guard terminal of connector plate. 2. At another end, connect coaxial center conductor to tail of the probing needle. Never connect the outer conductor at this cable end. Extend the outer conductor as close as possible to the probing needle. WARNING Do not touch the guard terminal with bare hands because you may be shocked by high voltage. The potential of the guard terminal is equal to the output voltage. CAUTION Never connect the guard terminal to any other output, including circuit common, frame ground, or the terminals of any other unit. Doing so may damage the unit. Agilent 4155C/4156C User’s Guide Vol.2, Edition 5 10-5 Connecting Measurement Devices Using Connector Plate Example The following example connection can be used to reduce the leakage current. Extend the outer conductor as close as possible to the probing needle. This also reduces the induced noise. Guarding Guarding reduces the leakage current between the measurement points and instrument. This is important when you measure low current. The following figure shows the theory of guarding. The buffer amplifier (× 1) keeps the potential of the guard conductor at the same potential as the force conductor, so current does not flow between the force and guard conductors. Therefore, the current measured by SMU is same as current at measurement point because no current is leaked. 10-6 Agilent 4155C/4156C User’s Guide Vol.2, Edition 5 Connecting Measurement Devices Using Connector Plate To Measure Low Resistance When you measure a low resistance, high current flows through the DUT. This high current increases the measurement error caused by the residual resistance of cables. To cancel the effect of this resistance, you can use Kelvin connections (4-wire), which means the force and sense lines are extended separately to the DUT. The Kelvin connection is available for the 4156C’s HRSMU and the 41501A/B’s HPSMU. Connect the probing needles to the terminals of the connector plate by using test leads or coaxial cables. Following instruction uses the coaxial cables: 1. At end of cable, connect coaxial center conductor to force terminal of connector plate, and connect coaxial outer conductor to guard terminal of connector plate. 2. At another end, connect coaxial center conductor to tail of the probing needle. Never connect the outer conductor at this cable end. Extend the outer conductor as close as possible to the probing needle. 3. Repeat 1 and 2 for the sense terminal of connector plate. 4. Contact the probing needles from force and sense terminals as close as possible to the DUT. Example The following example connection can be used to measure low resistance. The sense line is extended to the probing pad, and contacts the force line through the pad, so the voltage drop due to the residual resistance caused by cables and test leads is canceled. This example uses test leads. To reduce the leakage current, use coaxial cables. Agilent 4155C/4156C User’s Guide Vol.2, Edition 5 10-7 Connecting Measurement Devices Using Connector Plate Kelvin Connection Kelvin connections give good measurement results when you force high-current. The following figure shows the equivalent circuits for Kelvin and non-Kelvin connections. • For the non-Kelvin connection, the voltmeter measures the voltage drop of resistances rF1, RDUT, and rF2. • For the Kelvin connection, the voltmeter measures the voltage drop of resistance RDUT only. The impedance of the voltmeter is very high, so the voltage drop of resistances rS1 and rS2 can be ignored. R DUT R DUT r F2 r F1 V r F1 r S1 r S2 V (a) non-Kelvin connection r F2 V (b) Kelvin connection The Kelvin connection is effective even when forcing voltage. The voltage drop due to the residual resistance of the force line wiring is fed back to the voltage source via a comparator in the sense line. The input impedance of comparator is high, and current flow into the sense line is very low. So output error is not significant if the sense line wiring has a residual resistance of 10 Ω or less. Therefore, the specified voltage appears at the sense point (point where sense line contacts force line) 10-8 Agilent 4155C/4156C User’s Guide Vol.2, Edition 5