1
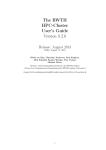
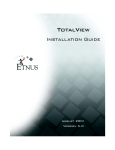
Figure 171 shows a sine wave displayed in three different ways:
Figure 171: Sine wave Displayed in Three Ways
To see the value of a dataset’s element, place your cursor near a graph marker, and
type “P ”. The bottom graph in Figure 171 shows the value of a data point.
Using the Surface Window
The Surface Window displays two-dimensional datasets as a surface in two or three
dimensions. The dataset’s array indices map to the first two dimensions (X and Y
axes) of the display. Figure 172 shows a surface view:
ROGUEWAVE.COM
Visualizing Programs and Data
292