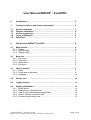
1
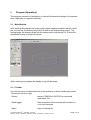
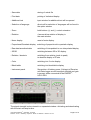
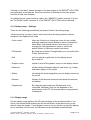
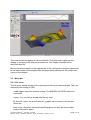
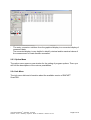
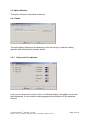
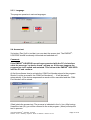
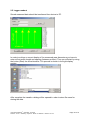
User Manual EMFAD® - ScanPRO 0. Introduction …………………………………………………………………… 2 1. System conditions and license agreements …………………………… 2 1.1 1.2 1.3 1.4 1.5 System conditions ………………………………………………………...... Program installation…………………………………………………………. License agreements ………………………………………………………… Terms of utilization …………………………………………………………. Disclaimer ……………………………………………………………………. 2. Working with EMFAD®-ScanPRO ……………………. …………………. 4 2 2 2 3 3 2.1 Main window …………………………………………………………………. 2.1.1 Toolbar ……………………………………………………………………… 2.1.2 Setting range ………………………………………………………………. 2.1.3 Display range ………………………………………………………………. 4 4 6 6 2.2 Menu bar ……………………………………………………………………… 2.2.1 File menu ………………………………………………………………….. 2.2.2 View menu ………………………………………………………………… 2.2.3 Option menu ………………………………………………………………. 2.2.4 Info menu ………………………………………………………………….. 7 7 8 8 9 2.3 Option window ………………………………………………………………. 2.3.1 Paths ……………………………………………………………………….. 2.3.2 Colors and coordinates …………………………………………………… 2.3.3 Language ………………………………………………………………….. 9 9 9 10 2.4 Access test …………………………………………………………………… 10 2.5 Logger readout ……………………………………………………………… 11 2.6 Display possibilities ……………………………………………………….. 2.6.1 Single profile …………………………………………………………........ 2.6.2 Proportional or quadrate view …………………………………………… 2.6.3 View of raw or abraded/interpolated data ……………………………… 2.6.4 View of absolute or relative data ………………………………………… 2.6.5 Colored or black/white view ……………………………………………… User Manual EMFAD® - ScanPRO, July 2008 Detector - Scout / Detecting - Systems - Röher / © EMFAD® - GmbH & Co. KG 12 12 12 13 13 13 Page 1 of 14 0. Introduction Welcome to EMFAD® - ScanPRO EMFAD® - ScanPRO is data processing software that performs both the processing and display of measurements of abnormal variations in conductivity in the subsoil. It provides representations in 2D or 3D views, interpretations, modelling, and documentation/printing of the measured results. The operation of the program and its processes are simple to use and in most cases the individual menus are self-explanatory 1. System conditions and license agreements 1.1 System conditions The EMFAD®-ScanPRO program works as a 32-Bit-Application, which runs on Windows 98, Windows 2000, Windows NT, Windows Vista or Windows XP. Your PC should be equipped at least to make the operation reasonable as follows: - Processor with frequency >1000 MHz or more Fixed disc with approx. 10.. 20 MByte free disc space Graphic board with a minimum resolution of 640 x 480 pixel Serial or USB interface for connection of the EMFAD®-UG12 PRO 1.2 Program installation First copy all data of the Program – CD in a file. Then create a connecting Icon of EMFAD-ScanPRO.exe and place it on the desktop. A double-click on that icon will start the program. 1.3 License Agreement EMFAD®-ScanPRO program as well as the complete accompanying electronic or printed documentations is subject to the copyright of EMFAD® Company. Should some sections of the available license terms feature amendments or upgradings compared to the elder program versions of the existing license terms so you are asked to use them also for earlier program versions beginning from the day they came into force. The legal validity for the available license terms is May 1st, 2008 User Manual EMFAD® - ScanPRO, July 2008 Detector - Scout / Detecting - Systems - Röher / © EMFAD® - GmbH & Co. KG Page 2 of 14 By using the software the user agrees to the existing license terms. The right of use will be automatically expire by violation of the license terms. 1.4 Terms of utilization The user is granted a non exclusive right for using the program indicated in the invoice. This right is restricted on the owner of the original software. Therefore the software can be used at the same time only on a single computer system. The copy of software is only allowed because of backup reasons. All actual and projected copyrighted and/or commercial protection rights of the program and all programs, program sections derived from these or documentations in this context remain with EMFAD® Company. EMFAD is a trademark of EMFAD – GmbH & Co. KG. 1.5 Disclaimer The program presented was carefully tested although exceptions cannot be excluded. There is no guarantee granted for the applicability of the program for certain use. Especially liability will be excluded for consequential damages and loss of profit and capital which could result from the use of the program as well as the documentation related. Modifications of any kind concerning software and documentation are subject to change without prior notice. User Manual EMFAD® - ScanPRO, July 2008 Detector - Scout / Detecting - Systems - Röher / © EMFAD® - GmbH & Co. KG Page 3 of 14 2. Program (Operation) The program serves the visualization of colored 3dimensional designs of measured data, especially of magnetic field data. 2.1 Main Window After starting the program the empty main window appears together with the menu bar, the tool bar, the setting range (left) as well as the display range (right). The setting range, the display range and the simple profile (see below 2.6.1) allow the adjustment in size by using the mouse. When starting the program the display range will be empty. 2.1.1 Toolbar You will find some combined buttons in the toolbar for a faster handling by mouse. These are from left to right: - Device search if EMFAD®-UG12PRO is connected (see below 2.4) - Read logger Data acquisition will be started with the EMFAD®UG12 PRO hardware - Open import of stored file User Manual EMFAD® - ScanPRO, July 2008 Detector - Scout / Detecting - Systems - Röher / © EMFAD® - GmbH & Co. KG Page 4 of 14 - Save data storing of actual file - Print data printing of indicated display - Additional text input window for additional text will be opened - Selection of language direct call for selection of languages will be found in the option window - Zoom both buttons (+) and (-) control extension - Rotation 4 arrows allow rotation of display in the main window - Norm display reset of main display - Proportional/Quadrate display switching of proportional to quadratic display - Raw data/smoothed data switching of interpolated to non interpolated display - 2D/3D switching between 2D to 3D display - Relative / absolute switching from relative (peak to peak) to absolute display of Z-axis - Color switching into 3 color display - Black/white switching into black/white display - Instrument panel Supervision of battery power (Voltage) of Receiver and Data logger as well as signal strength and gain in percent while connected to the EMFAD®UG12 PRO The signal strength is also viewed in a separated window. Activating and deactivating with the start and stop button. User Manual EMFAD® - ScanPRO, July 2008 Detector - Scout / Detecting - Systems - Röher / © EMFAD® - GmbH & Co. KG Page 5 of 14 Clicking on “test data” deletes the data in the data logger of the EMFAD®-UG12 PRO and generates a test data set. With this function it is possible to check the proper function of hard- and software. In addition the red, green and blue caliber, the “SMOOTH” switch (channel 1-3) and the “AUT/MAN” switch (channel 5) of the EMFAD®-UG12 PRO can be checked. 2.1.2 Setting range – Settings There are the following possibilities (top down) found in the setting range 3 bottoms on top (no frame, faces, wire frame) allow choosing between various designs of the neighborhood cube. - Color control there are 3 buttons to choice the colors for low, middle and high measured values. Between colors interpolation takes place. Associated with the scroll bar you can manage the fine adjustment in order to accent the details. Button (0) allows a medium allocation. - Z-Extension By using the scroll bar Z-magnification you can extend the Z-Axis (vertical axis) - Grid you can switch on grid lines on the display screen by on and off - Graphic cursor switch on and off the graphic cursor on the display screen - Distances will be switched between distance (real units, e.g. Yards) and Index display of the scales - Scales will switch the scale designations on the display screen by on and off - Extreme Display of the absolute maximum and absolute minimum on dataset - Progress bar By using the signal selection 3D data have to be converted. Necessary time for this depends on the performance of the PC. During calculation a progress bar is displayed. 2.1.3 Display range On the display range appears the 3D colored design of the measured data. If you move your mouse whilst pressing the left mouse button at the same time you are able to rotate the design. If your graphic cursor is on you will see up right the display for co-ordinates for the cursor co-ordinates and the available measured data. User Manual EMFAD® - ScanPRO, July 2008 Detector - Scout / Detecting - Systems - Röher / © EMFAD® - GmbH & Co. KG Page 6 of 14 The chart shows the display of a demo data file. The color scale (right) and the display of a single profile (top) are switched on. The display functions will be described later on. Moving the mouse pointer to the right border of the configuration window respectively to the lower border of the single profile windows whilst pressing the left mouse their size can be changed. 2.2 Menu bar 2.2.1 File menu The file menu shows entries for the opening and storing of measured data. They are marked by the ending of GRD. - <read logger> starts the transfer of data. The EMFAD®-UG12PRO has to be connected. - <open> You can call up stored data files by open. - By first call <save> the actual data file / graphic will be stored in the window <save as> - Later on by <save as> the actual data file/graphic can then be stored under another title and/or place User Manual EMFAD® - ScanPRO, July 2008 Detector - Scout / Detecting - Systems - Röher / © EMFAD® - GmbH & Co. KG Page 7 of 14 - By <export (DAT)> the data file will be stored in ASCII format which also can be processed under other programs, e.g., SURFER (by GOLDEN Software) and Excel (Microsoft). - <Preview> generates a preview on pages for print. - <print> opens the window print - < copy to clipboard > copies actual graphics into the clipboard for a possible further take over/processing into other programs. - <Notice text> opens a window in which you can write your text which will be printed with actual graphic. - With <edit data> the length of profiles and/or the distance between the profiles of previous saved files can be corrected and will be saved automatically. - The entry <end> determinates the program 2.2.2 View Menu You can switch the single elements of the view window to visible respectively invisible. - The entry <toolbar> switches the toolbar to visible respectively invisible. - The entry <statusbar> switches the statusbar to visible respectively invisible. - The entry <configuration> is fading in respectively blanking all possibilities of settings. - The entry <single profile> is displaying respectively blanking the display of a single profile above main window. - The entry <color scale> is fading on respectively off a scale with the relative/absolute measured data. User Manual EMFAD® - ScanPRO, July 2008 Detector - Scout / Detecting - Systems - Röher / © EMFAD® - GmbH & Co. KG Page 8 of 14 - The entry <numeric> switches from the graphical display to a numerical display of measured data. The numerical display is very helpful to identify minimal and/or maximal values of the measurement to locate smaller anomalies. 2.2.3 Option Menu The option menu opens a new window for the setting of program options. There you will find the descriptions of the various possibilities. 2.2.4 Info Menu The info menu delivers information about the available version of EMFAD®ScanPRO. User Manual EMFAD® - ScanPRO, July 2008 Detector - Scout / Detecting - Systems - Röher / © EMFAD® - GmbH & Co. KG Page 9 of 14 2.3 Option Window The option window is structured as follows: 2.3.1 Paths The path display determines the directory for the file storing. A selection dialog appears after activating the browser button. 2.3.2 Colors and Co-ordinates Here you can choose the colors for the co-ordinates display, the graphic cursor and the background. A color selection dialog appears after activation of the adequate buttons. User Manual EMFAD® - ScanPRO, July 2008 Detector - Scout / Detecting - Systems - Röher / © EMFAD® - GmbH & Co. KG Page 10 of 14 2.3.3 Language The program operates in various languages. 2.4 Access test Via button (Dev) (left in tool bar) you can start the access test. The EMFAD®UG12PRO should be already connected and switched on!! Comment: If the EMFAD®-UG12PRO has not been connected with the PC via interface cable the message “no device found” will pop up. If this case happens the program has to be exited and restarted. Then connect the EMFAD®-UG12PRO with the PC and continue. At first the software tries to activate the COM-Port-Number stored in the program. Should it not be successful the COM-Port-Numbers 1 – 16 will be tested automatically. If the device responses the search will be cancelled and the COMPort-Number will be stored. (Start) starts the access test. The process is indicated in the 1st line. After having closed the test (Ok) you will be returned to the main program. (Abort) will stop the test in process. User Manual EMFAD® - ScanPRO, July 2008 Detector - Scout / Detecting - Systems - Röher / © EMFAD® - GmbH & Co. KG Page 11 of 14 2.5 Logger readout Stored measured data should be transferred from device to PC. In order to achieve a correct display of the measured area dimensions you have to enter at first profile length and spacing (between profiles). Then you will start by using the button (Start) the actual transfer. The process is shown in the right display section. After complete the transfer a dialog will be opened in order to store file name for storing the data. User Manual EMFAD® - ScanPRO, July 2008 Detector - Scout / Detecting - Systems - Röher / © EMFAD® - GmbH & Co. KG Page 12 of 14 2.6 Display possibilities 2.6.1 Single profile For better evaluation of your data there can be additional shown a single profile to your 2D or 3D display. It will appear above the main display window. You will see the signal process along the measurement line (profile). The selection of the displayed profile occurs by the use of the mouse via both buttons marked with arrows or with a double click with the mouse pointer on the wanted spot in the 3D-Display. The 3Ddisplay shows a red line cursor according to the actual profile. Moving the mouse pointer along the selected profile there will be indicated in three windows on the left side the measured value (Z-axis), the position of the profile on the x-axis and the distance of the measuring point to the x-axis. 2.6.2 Proportional and quadratic view By button you can switch the display between a proportional and quadratic version. The display will show in the quadratic display quadratic elements. The proportion of profile length to field width is not considered. Partly details are better presented. By using the proportional version the display will shown under regard of the real profile length and field width as it was set by logger readout. Reference note: The actual measured profile length / field width is only possible by this adjustment. A wrong allocation cannot be recognized. User Manual EMFAD® - ScanPRO, July 2008 Detector - Scout / Detecting - Systems - Röher / © EMFAD® - GmbH & Co. KG Page 13 of 14 2.6.3 View of raw or abraded/interpolated data Switching is possible between the display of raw or abraded data. Raw data show data as they were measured. The display will be relatively raw if you have a low amount of pixels and will serve orientation. The abraded data will show the raw data in a display with softer transitions. 2.6.4 View of absolute or relative data Switching is possible between an absolute or relative exposition. By using the absolute exposition the Z-axis is extended on the measured data which are completely available. The relative exposition shows the measured data with their minimum respectively maximum data. Thus reports a maximum release of details also in connection to the colored display. 2.6.5 Colored or black/white view For print outs it makes partly sense to use only a black/white design. The color selection will be converted into black, grey or white and will not any more variable in this mode. User Manual EMFAD® - ScanPRO, July 2008 Detector - Scout / Detecting - Systems - Röher / © EMFAD® - GmbH & Co. KG Page 14 of 14