1
V. How to Use
the
Graph
Any time you are using the Healing Rhythms program,
whether you are at the Main Screen or participating in a
Guided Training or Practice Event, you may choose to
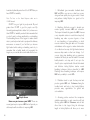
view a live graph of your body's rhythms as they are
captured through the biofeedback hardware. Click the
Graph button in the top right corner or in the
lower right portion of the screen during Guided Training
to activate the Graph. The
Graph is also able
to open the bio-data from saved training sessions for
printing or viewing.
Note: If you are taking part in a Practice Event and open the
Graph, when you return to the event you will have to start again at the
beginning. Practice Events are the final part of every step and are
the areas where you are able to participate in exercises where you
actively move objects on the screen using the biofeedback hardware.
Guided Trainings which make up the middle two parts of every step
where you receive guidance from Healing Rhythms expert mentors will
not be interrupted by opening the
Graph.
What I am watching on the
Graph Screen:
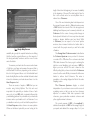
For an instant help screen with definitions of each of
the measurements on the
Graph screen, click the
Information button on the lower left portion if the
Graph Screen.To close, click the Close Info button.
Heart Rate Variability (HRV) is a measurement of the
beat to beat changes in your heart rate. HRV is one of the
fastest growing types of biofeedback, and is leading a
renaissance in the understanding of the heart and its role
in emotional and physical health. The traditional idea that
the heart is a pump and should beat steadily and without
26
27