1
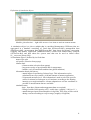
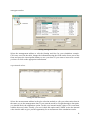
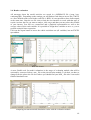
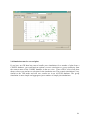
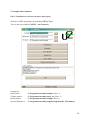
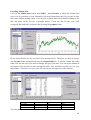
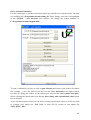
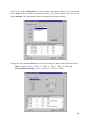
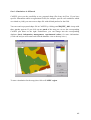
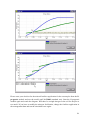
Clicking the button ‘ show map’ will produce a map view for the selected attribute. Colouring
of the classes can be changed after doubleclick on the colour in the legend table.
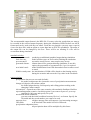
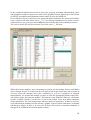
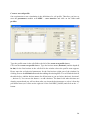
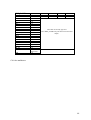
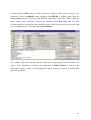
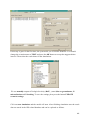
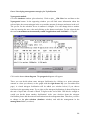
The GIS database provides space for up to 10 variables for a statistical analysis. Starting a
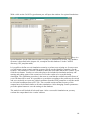
new analysis you should clear these tables ( ‘reset stat’ button). New items will be added after
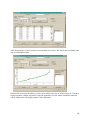
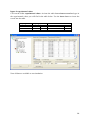
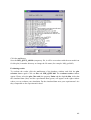
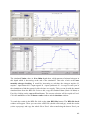
clicking the ‘add 2 stat’ button. Within the statistics tableau you can create an x-y-plot from
this variables and export the whole dataset to an EXCEL file for further analysis.
20