1
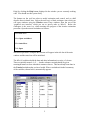
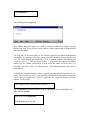
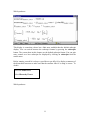
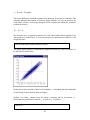
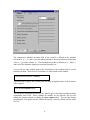
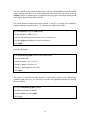
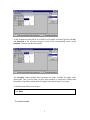
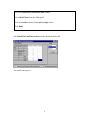
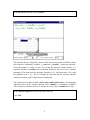
The last line of the display contains a quantity known as twice the log likelihood. This
will prove to be useful in comparing alternative models for the data and carrying out
significance tests. It can be ignored for the time being.
This is another place where you would do well to save the worksheet.
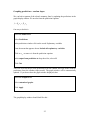
Graphing Predictions : Variance components
We have now constructed and fitted a variance components model in which schools
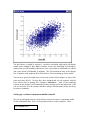
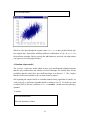
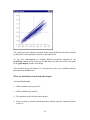
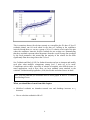
vary only in their intercepts. It is a model of simple variation at level 2, which gives rise
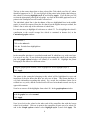
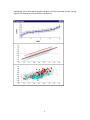
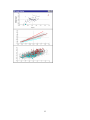
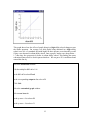
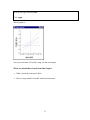
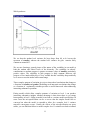
to the parallel lines illustrated in figure 1.2.
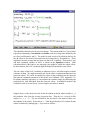
To demonstrate how the model parameters we have just estimated combine to produce
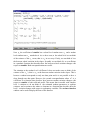
the parallel lines of figure 1.2 we now introduce two new windows the Predictions
window that can be used to calculate predictions from the model and the Customised
graphs window which is a general purpose window for building graphs that can be
used to graph our predicted values.
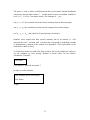
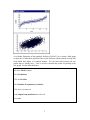
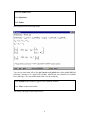
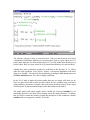
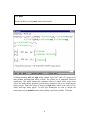
Lets start by calculating the average predicted line produced from the fixed part
intercept and slope coefficients( β 0 , β 1 ).
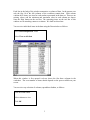
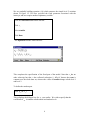
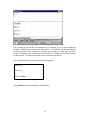
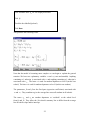
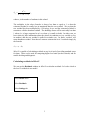
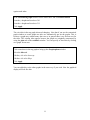
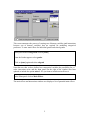
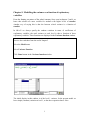
Select the Model menu
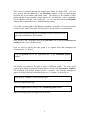
Select Predictions
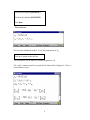
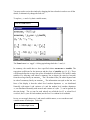
Which produces :
15