1
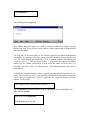
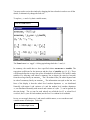
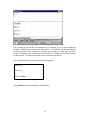
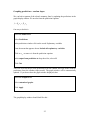
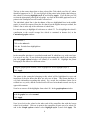
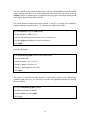
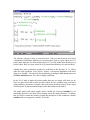
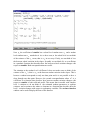
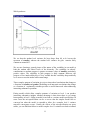
From the equations window we can see that { σ 2e 0 , σ e 01 , σ 2e 2 }={0.583, -0.012, -.054}.
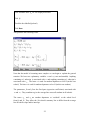
Substituting these values into the function shown in the variance function window we
get the student level variance for the boys is :
0.583 - 0.024 * standlrt
and for the girls is:
0.583 - 0.054 - 0.024*standlrt
Note that we can get the mathematically equivilent result fitting the model with the
following terms at level 1 : σ 2e 0 , σ e 01 , σ e 02 . This is left as an exercise for the reader.
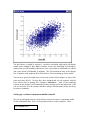
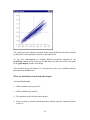
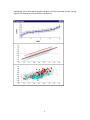
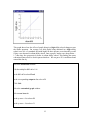
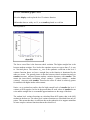
The line describing the between student variation for girls is lower than the boys line
by 0.054. It could be that the lines have different slopes. We can see if this is the case
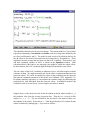
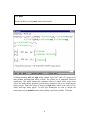
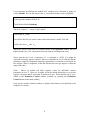
by fitting a more complex model to the level 1 variance. In the equations window:
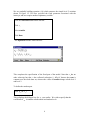
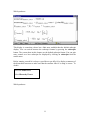
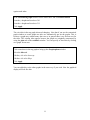
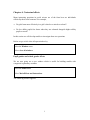
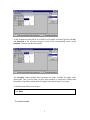
In the level 1 covariance matrix click on the right hand 0 on the bottom line.
You will be asked if you want to add term girl/standlrt. Click Yes.
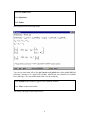
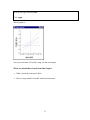
Run the model
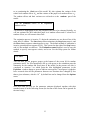
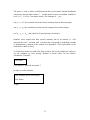
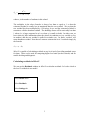
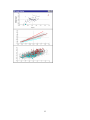
We obtain estimates for the level 1 parameters { σ 2e 0 , σ e 01 , σ e12 , σ 2e 2 }={0.584, -0.032,
0.031,-0.058}
9