1
BEFORE USING THE CALCULATOR
FOR THE FIRST TIME...
This calculator does not contain any main batteries when you purchase it. Be sure to perform
the following procedure to load batteries, reset the calculator, and adjust the contrast before
trying to use the calculator for the first time.
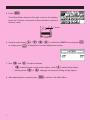
1. Remove the back cover from the calculator by pressing it in the direction indicated by
arrow 1, and then sliding it in the direction indicated by arrow 2.
P
1
2
2. Load the four batteries that come with calculator.
• Make sure that the positive (+) and negative (–) ends of the batteries are facing correctly.
P
MAIN
BACK UP
3. Remove the insulating sheet at the location marked “BACK UP” by pulling in the direction
indicated by the arrow.
P
MAIN
BACK UP
4. Replace the back cover onto the calculator and turn the calculator front side up, which
should automatically turn on power and perform the memory reset operation.
P
MAIN
i
5. Press
m.
If the Main Menu shown to the right is not on the display,
press the P button on the back of the calculator to perform
memory reset.
P
P button
f, c, d, e) to select the CONT icon and press w
or simply press s to display the contrast adjustment screen.
6. Use the cursor keys (
D
7. Use
d and e to adjust contrast.
• d makes figures on the screen lighter, while e makes them darker.
• Holding down d or e changes the contrast setting at high speed.
8. After adjusting the contrast, press
ii
mto return to the Main Menu.
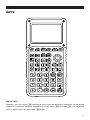
KEYS
Alpha Lock
Normally, once you press a and then a key to input an alphabetic character, the keyboard
reverts to its primary functions immediately. If you press ! and then a, the keyboard
locks in alpha input until you press a again.
iii
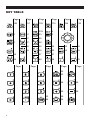
KEY TABLE
Page
Page
Page
Page
Page
Page
146
151
129
174
164
136
2
31
333
33
4
3
57
56
57
56
56
56
55
55
55
56
56
55
55
55
59
57
57
59
46
46
2
Page
Page
Page
25
Page
Page
24
23
55
46
iv
46
46
46
46
49
46
Quick-Start
Switching Power On And Off
Auto Power Off Function
Using Modes
Basic Calculations
Replay Features
Fraction Calculations
Exponents
Graph Functions
Dual Graph
Box Zoom
Dynamic Graph
Table Function
Quick-Start
Welcome to the world of graphing calculators and the CASIO fx-9750G.
Quick-Start is not a complete tutorial, but it takes you through many of the most common
functions, from turning the power on to graphing complex equations. When you’re done, you’ll
have mastered the basic operation of the fx-9750G and will be ready to proceed with the rest
of this manual to learn the entire spectrum of functions available.
Each step of the examples in Quick-Start is shown graphically to help you follow along
quickly and easily. When you need to enter the number 57, for example, we’ve indicated it as
follows:
Press
fh
Whenever necessary, we’ve included samples of what your screen should look like.
If you find that your screen doesn’t match the sample, you can restart from the beginning by
pressing the “All Clear” button
.
o
SWITCHING POWER ON AND OFF
o.
OFF
To switch power off, press ! o.
To switch power on, press
AUTO POWER OFF FUNCTION
Note that the unit automatically switches power off if you do not perform any operation for
about six minutes (about 60 minutes when a calculation is stopped by an output command
(^)).
USING MODES
The fx-9750G makes it easy to perform a wide range of calculations by simply selecting
the appropriate mode. Before getting into actual calculations and operation examples, let’s
take a look at how to navigate around the modes.
To select the RUN Mode
1. Press
m to display the Main Menu.
vi
Quick-Start
defc to highlight RUN and then
press w.
2. Use
This is the initial screen of the RUN mode, where you
can perform manual calculations, and run programs.
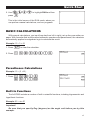
BASIC CALCULATIONS
With manual calculations, you input formulas from left to right, just as they are written on
paper. With formulas that include mixed arithmetic operators and parentheses, the calculator
automatically applies true algebraic logic to calculate the result.
Example: 15 × 3 + 61
1. Press
o to clear the calculator.
2. Press
bf*d+gbw.
Parentheses Calculations
Example: 15 × (3 + 61)
1. Press
bf*(d
+gb)w.
Built-In Functions
The fx-9750G includes a number of built-in scientific functions, including trigonometric and
logarithmic functions.
Example: 25 × sin 45˚
Important!
Be sure that you specify Deg (degrees) as the angle unit before you try this
example.
vii
Quick-Start
1. Press
o.
SET UP
2. Press
! m to switch the set up display.
cccc1 (Deg) to specify
3. Press
degrees as the angle unit.
4. Press
J to clear the menu.
5. Press
o to clear the unit.
6. Press
cf*sefw.
REPLAY FEATURES
d e
With the replay feature, simply press
or
to recall the last calculation that was
performed. This recalls the calculation so you can make changes or re-execute it as it is.
Example: To change the calculation in the last example from (25 × sin 45˚) to (25 × sin 55˚)
1. Press
d to display the last calculation.
2. Press
d twice to move the cursor under the 4.
3. Press
f.
4. Press
w to execute the calculation again.
viii
Quick-Start
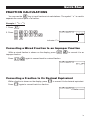
FRACTION CALCULATIONS
$
You can use the
key to input fractions into calculations. The symbol “ { ” is used to
separate the various parts of a fraction.
Example: 1 15/16 + 37/9
1. Press
o.
2. Press
b$bf$
bg+dh$
jw.
Indicates 6 7/ 144
Converting a Mixed Fraction to an Improper Fraction
d/c
While a mixed fraction is shown on the display, press
improper fraction.
! $ to convert it to an
d/c
Press
!$ again to convert back to a mixed fraction.
Converting a Fraction to Its Decimal Equivalent
While a fraction is shown on the display, press
Press
M to convert it to its decimal equivalent.
M again to convert back to a fraction.
ix
Quick-Start
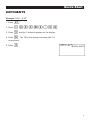
EXPONENTS
Example: 1250 × 2.065
1. Press
o.
2. Press
bcfa*c.ag.
3. Press
M and the ^ indicator appears on the display.
f
4. Press
. The ^5 on the display indicates that 5 is
an exponent.
5. Press
w.
x
Quick-Start
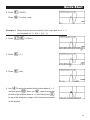
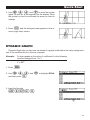
GRAPH FUNCTIONS
The graphing capabilities of this calculator makes it possible to draw complex graphs
using either rectangular coordinates (horizontal axis: x ; vertical axis: y) or polar coordinates
(angle: θ ; distance from origin: r).
Example 1: To graph Y = X(X + 1)(X – 2)
1. Press
m.
d, e, f, and c to highlight GRAPH,
and then press w.
2. Use
3. Input the formula.
v(v+b)
(v-c)w
1 2 3 4 5 6
4. Press
6 (DRAW) or w to draw the graph.
Example 2: To determine the roots of Y = X(X + 1)(X – 2)
1. Press
! 5 (G-Solv).
1 2 3 4 5 6
xi
Quick-Start
1 (ROOT).
Press e for other roots.
2. Press
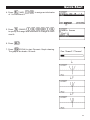
Example 3: Determine the area bounded by the origin and the X = –1
root obtained for Y = X(X + 1)(X – 2)
1. Press
!5 (G-Solv).
1 2 3 4 5 6
2. Press
6 (g).
1 2 3 4 5 6
3. Press
3 (∫dx).
e to move the pointer to the location where X = –1,
and then press w. Next, use e again to move the
pointer to the location where X = 0, and then press w
4. Use
to input the integration range, which becomes shaded
on the display.
xii
Quick-Start
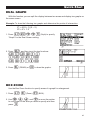
DUAL GRAPH
With this function you can split the display between two areas and display two graphs on
the same screen.
Example: To draw the following two graphs and determine the points of intersection
Y1 = X(X + 1)(X – 2)
Y2 = X + 1.2
!Zcc1
1. Press
(Grph) to specify
“Graph” for the Dual Screen setting.
1 2 3 4 5 6
J, and then input the two functions.
v(v+b)
(v-c)w
v+b.cw
2. Press
3. Press
1 2 3 4 5 6
6 (DRAW) or w to draw the graphs.
BOX ZOOM
Use the Box Zoom function to specify areas of a graph for enlargement.
1. Press
! 2 (Zoom) 1 (BOX).
def
c
2. Use
,
,
, and
to move the pointer
to one corner of the area you want to specify and then
.
press
w
xiii
Quick-Start
def
c
3. Use
,
,
, and
to move the pointer
again. As you do, a box appears on the display. Move
the pointer so the box encloses the area you want to
enlarge.
w
4. Press
, and the enlarged area appears in the inactive (right side) screen.
DYNAMIC GRAPH
Dynamic Graph lets you see how the shape of a graph is affected as the value assigned to
one of the coefficients of its function changes.
Example:
To draw graphs as the value of coefficient A in the following
function changes from 1 to 3
Y = AX2
1. Press
m.
d, e, f, and c to highlight DYNA,
and then press w.
2. Use
3. Input the formula.
aAvxw
1 2 3 4 5 6
xiv
Quick-Start
4
bw to assign an initial value
4. Press
(VAR)
of 1 to coefficient A.
1 2 3 4 5 6
2
bwdwbw
5. Press
(RANG)
to specify the range and increment of change in coefficient A.
6. Press
J.
6
7. Press
(DYNA) to start Dynamic Graph drawing.
The graphs are drawn 10 times.
↓
↓↑
↓↑
xv
Quick-Start
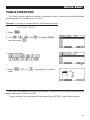
TABLE FUNCTION
The Table Function makes it possible to generate a table of solutions as different values
are assigned to the variables of a function.
Example: To create a number table for the following function
Y = X (X+1) (X–2)
1. Press
m.
d, e, f, and c to highlight TABLE,
and then press w.
2. Use
3. Input the formula.
v(v+b)
(v-c)w
1 2 3 4 5 6
4. Press
table.
6 (TABL) or w to generate the number
After you’ve completed this Quick-Start section, you are well on your way to becoming an
expert user of the CASIO fx-9750G.
To learn all about the many powerful features of the fx-9750G, read on and explore!
xvi
Handling Precautions
• Your calculator is made up of precision components. Never try to take it apart.
• Avoid dropping your calculator and subjecting it to strong impact.
• Do not store the calculator or leave it in areas exposed to high temperatures or humidity, or large
amounts of dust. When exposed to low temperatures, the calculator may require more time to display
results and may even fail to operate. Correct operation will resume once the calculator is brought back
to normal temperature.
• The display will go blank and keys will not operate during calculations. When you are operating the
keyboard, be sure to watch the display to make sure that all your key operations are being performed
correctly.
• Replace the main batteries once every 2 years regardless of how much the calculator is used during
that period. Never leave dead batteries in the battery compartment. They can leak and damage the
unit.
• Keep batteries out of the reach of small children. If swallowed, consult with a physician immediately.
• Avoid using volatile liquids such as thinner or benzine to clean the unit. Wipe it with a soft, dry cloth, or
with a cloth that has been dipped in a solution of water and a neutral detergent and wrung out.
• In no event will the manufacturer and its suppliers be liable to you or any other person for any damages,
expenses, lost profits, lost savings or any other damages arising out of loss of data and/or formulas
arising out of malfunction, repairs, or battery replacement. The user should prepare physical records of
data to protect against such data loss.
• Never dispose of batteries, the liquid crystal panel, or other components by burning them.
• When the “Low battery!” message appears on the display, replace the main power supply batteries as
soon as possible.
• Be sure that the power switch is set to OFF when replacing batteries.
• If the calculator is exposed to a strong electrostatic charge, its memory contents may be damaged or
the keys may stop working. In such a case, perform the All Reset operation to clear the memory and
restore normal key operation.
• If the calculator stops operating correctly for some reason, use a thin, pointed object to press the P
button on the back of the calculator. Note, however, that this clears all the data in calculator memory.
• Note that strong vibration or impact during program execution can cause execution to stop or can
damage the calculator’s memory contents.
• Using the calculator near a television or radio can cause interference with TV or radio reception.
• Before assuming malfunction of the unit, be sure to carefully reread this manual and ensure that the
problem is not due to insufficient battery power, programming or operational errors.
xvii
Be sure to keep physical records of all important data!
The large memory capacity of the unit makes it possible to store large amounts of data. You should note,
however, that low battery power or incorrect replacement of the batteries that power the unit can cause
the data stored in memory to be corrupted or even lost entirely. Stored data can also be affected by
strong electrostatic charge or strong impact.
Since this calculator employs unused memory as a work area when performing its internal calculations,
an error may occur when there is not enough memory available to perform calculations. To avoid such
problems, it is a good idea to leave 1 or 2 kbytes of memory free (unused) at all times.
In no event shall CASIO Computer Co., Ltd. be liable to anyone for special, collateral, incidental, or
consequential damages in connection with or arising out of the purchase or use of these materials.
Moreover, CASIO Computer Co., Ltd. shall not be liable for any claim of any kind whatsoever against the
use of these materials by any other party.
• The contents of this manual are subject to change without notice.
• No part of this manual may be reproduced in any form without the express written consent of the
manufacturer.
• The options described in Chapter 20 of this manual may not be available in certain geographic
areas. For full details on availability in your area, contact your nearest CASIO dealer or distributor.
xviii
• • • • • • • • • • • • • • • • • • •
• • • • • • • • • • • • • • • • • • •
• • • • • • • • • • • • • • • • • • •
•• • • • • • • • • • • • • • • • • •
•• • • • • • • • • • • • • • • • • •
•• • • • • • • • • • • • • • • • • •
fx-9750G
•• • • • • • • • • • • • • • • • • •
•• • • • • • • • • • • • • • • • • •
•• • • • • • • • • • • • • • • • • •
• • • • • • • • • • • • • • • • • • •
• • • • • • • • • • • • • • • • • • •
• • • • • • • • • • • • • • • • • • •
• • • • • • • • • • • • • • • • • • •
• • • • • • • • • • • • • • • • • • •
• • • •
• • • • •
• • • • •
• • • • •
• •
•
•
•
•
•
•
•
•
•
•
•
•
•
•
•
•
•
•
•
•
•
•
•
•
•
•
•
•
•
•
•
•
•
•
•
•
•
•
•
•
•
•
•
•
•
•
•
•
•
•
•
•
•
•
•
Contents
Getting Acquainted — Read This First!........................................ 1
1. Key Markings.......................................................................................... 2
2. Selecting Icons and Entering Modes ................................................... 3
Using the Set Up Screen ............................................................................... 4
Set Up Screen Function Key Menus ............................................................. 5
3. Display .................................................................................................. 10
About the Display Screen ............................................................................ 10
About Menu Item Types ............................................................................... 10
Exponential Display ..................................................................................... 11
Special Display Formats .............................................................................. 12
Calculation Execution Screen ...................................................................... 12
4. Contrast Adjustment ............................................................................ 13
5. When you keep having problems… ................................................... 14
Get the Calculator Back to its Original Mode Settings ................................ 14
In Case of Hang Up ..................................................................................... 14
Low Battery Message .................................................................................. 14
Chapter 1 Basic Operation ......................................................... 15
1-1
Before Starting Calculations... ..................................................... 16
Setting the Angle Unit (Angle) ..................................................................... 16
Setting the Display Format (Display) ........................................................... 16
Inputting Calculations .................................................................................. 19
Calculation Priority Sequence ..................................................................... 19
Multiplication Operations without a Multiplication Sign ................................ 20
Stacks .......................................................................................................... 21
Input, Output and Operation Limitations ...................................................... 21
Overflow and Errors ..................................................................................... 22
Memory Capacity ........................................................................................ 22
Graphic Display and Text Display ................................................................ 23
Editing Calculations ..................................................................................... 23
1-2
Memory ........................................................................................... 25
Variables ...................................................................................................... 25
Function Memory ......................................................................................... 26
Memory Status (MEM) ................................................................................ 28
Clearing Memory Contents ......................................................................... 30
1-3
1-4
1-5
xx
Option (OPTN) Menu ..................................................................... 31
Variable Data (VARS) Menu ........................................................... 33
Program (PRGM) Menu ................................................................. 43
Contents
Chapter 2 Manual Calculations .................................................. 45
2-1
Basic Calculations ......................................................................... 46
Arithmetic Calculations ................................................................................ 46
Number of Decimal Places, Number of Significant Digits, Exponential
Notation Range ...................................................................................... 46
Calculations Using Variables ....................................................................... 48
2-2
Special Functions .......................................................................... 49
Answer Function .......................................................................................... 49
Performing Continuous Calculations ........................................................... 49
Using the Replay Function .......................................................................... 50
Making Corrections in the Original Calculation ........................................... 50
Using Multistatements ................................................................................. 51
2-3
Function Calculations ................................................................... 52
Function Menus ........................................................................................... 52
Angle Units .................................................................................................. 55
Trigonometric and Inverse Trigonometric Functions .................................... 55
Logarithmic and Exponential Functions ...................................................... 56
Hyperbolic and Inverse Hyperbolic Functions ............................................. 56
Other Functions ........................................................................................... 57
Coordinate Conversion ................................................................................ 58
Permutation and Combination ..................................................................... 58
Fractions ...................................................................................................... 59
Engineering Notation Calculations .............................................................. 60
Logical Operators (AND, OR, NOT) ............................................................ 61
Chapter 3 Solve, Differential/Quadratic Differential, Integration,
Maximum/Minimum Value, and Σ Calculations ....... 63
3-1
3-2
3-3
Function Analysis Menu ............................................................... 64
Solve Calculations ......................................................................... 65
Differential Calculations ................................................................ 67
Applications of Differential Calculations ...................................................... 69
3-4
Quadratic Differential Calculations .............................................. 70
Quadratic Differential Applications .............................................................. 71
3-5
Integration Calculations ................................................................ 72
Application of Integration Calculation .......................................................... 73
3-6
3-7
Maximum/Minimum Value Calculations ....................................... 75
Σ Calculations ................................................................................ 77
Example Σ Calculation ................................................................................. 77
Σ Calculation Applications ........................................................................... 78
xxi
Contents
Σ Calculation Precautions ............................................................................ 78
Chapter 4 Complex Numbers ..................................................... 79
4-1
4-2
Before Beginning a Complex Number Calculation ..................... 80
Performing Complex Number Calculations ................................. 81
Arithmetic Operations .................................................................................. 81
Reciprocals, Square Roots, and Squares ................................................... 81
Absolute Value and Argument ..................................................................... 82
Conjugate Complex Numbers ..................................................................... 82
Extraction of Real and Imaginary Number Parts ......................................... 83
4-3
Complex Number Calculation Precautions ................................. 84
Chapter 5 Binary, Octal, Decimal, and Hexadecimal
Calculations ............................................................... 85
5-1
5-2
5-3
5-4
Before Beginning a Binary, Octal, Decimal, or Hexadecimal
Calculation ..................................................................................... 86
Selecting a Number System ......................................................... 88
Arithmetic Operations ................................................................... 89
Negative Values and Logical Operations ..................................... 90
Negative Values ........................................................................................... 90
Logical Operations ...................................................................................... 90
Chapter 6 Matrix Calculations.................................................... 91
6-1
Before Performing Matrix Calculations ....................................... 92
About Matrix Answer Memory (MatAns) ...................................................... 92
Creating a Matrix ......................................................................................... 92
Deleting Matrices ......................................................................................... 93
6-2
Matrix Cell Operations................................................................... 95
Row Calculations ......................................................................................... 95
Row Operations ........................................................................................... 97
Column Operations ..................................................................................... 99
6-3
Modifying Matrices Using Matrix Commands ........................... 101
Matrix Data Input Format ........................................................................... 101
Modifying Matrices Using Matrix Commands ............................................ 103
6-4
Matrix Calculations ...................................................................... 106
Matrix Arithmetic Operations ..................................................................... 106
Matrix Scalar Product ................................................................................ 108
Determinant ............................................................................................... 109
xxii
Contents
Matrix Transposition ................................................................................... 110
Matrix Inversion ......................................................................................... 110
Squaring a Matrix ...................................................................................... 111
Raising a Matrix to a Power ....................................................................... 112
Determining the Absolute Value, Integer Part, Fraction Part, and
Maximum Integer of a Matrix ............................................................... 113
Chapter 7 Equation Calculations ............................................. 115
7-1
Before Beginning an Equation Calculations ............................. 116
Entering an Equation Calculation Mode .................................................... 116
Clearing Equation Memories ..................................................................... 116
7-2
Linear Equations with Two to Six Unknowns ............................ 117
Entering the Linear Equation Mode for Two to Six Unknowns ................... 117
Solving Linear Equations with Three Unknowns ....................................... 118
Changing Coefficients ............................................................................... 119
Clearing All the Coefficients ...................................................................... 119
7-3
Quadratic and Cubic Equations ................................................. 120
Entering the Quadratic/Cubic Equation Mode ........................................... 120
Solving a Quadratic or Cubic Equation ..................................................... 120
Quadratic equations that produce multiple root (1 or 2) solutions or
imaginary number solutions ................................................................. 121
Changing Coefficients ............................................................................... 122
Clearing All the Coefficients ...................................................................... 122
7-4
What to Do When an Error Occurs ............................................. 123
Chapter 8 Graphing .................................................................. 125
8-1
Before Trying to Draw a Graph ................................................... 126
Entering the Graph Mode .......................................................................... 126
8-2
View Window (V-Window) Settings ............................................ 127
Initializing and Standardizing the View Window ........................................ 129
View Window Memory ............................................................................... 130
8-3
Graph Function Operations ........................................................ 132
Specifying the Graph Type ........................................................................ 132
Storing Graph Functions ........................................................................... 132
Editing Functions in Memory ..................................................................... 134
Drawing a Graph ....................................................................................... 135
8-4
8-5
Graph Memory ............................................................................. 138
Drawing Graphs Manually ........................................................... 140
xxiii
Contents
8-6
Other Graphing Functions .......................................................... 146
Connect Type and Plot Type Graphs (Draw Type) ..................................... 146
Trace .......................................................................................................... 146
Scroll ......................................................................................................... 149
Graphing in a Specific Range .................................................................... 149
Overwrite ................................................................................................... 149
Zoom ......................................................................................................... 151
Using the Auto View Window ..................................................................... 154
Adjusting the Ranges of a Graph (SQR) ................................................... 155
Rounding Coordinates (RND) ................................................................... 156
Converting x- and y-axis Values to Integers (INTG) .................................. 157
Returning the View Window to Its Previous Settings ................................. 158
8-7
8-8
Picture Memory ............................................................................ 159
Graph Background ...................................................................... 161
Chapter 9 Graph Solve ............................................................. 163
9-1
9-2
Before Using Graph Solve .......................................................... 164
Analyzing a Function Graph ....................................................... 165
Determining Roots ..................................................................................... 165
Determining Maximums and Minimums .................................................... 166
Determining y-intercepts ........................................................................... 167
Determining Points of Intersection for Two Graphs.................................... 168
Determining a Coordinate (x for a given y/y for a given x) ......................... 169
Determining the Integral for Any Range .................................................... 171
9-3
Graph Solve Precautions ............................................................ 172
Chapter 10 Sketch Function ..................................................... 173
10-1 Before Using the Sketch Function ............................................. 174
10-2 Graphing with the Sketch Function ........................................... 176
Tangent ...................................................................................................... 176
Line Normal to a Curve ............................................................................. 177
Graphing an Inverse Function ................................................................... 178
Plotting Points ............................................................................................ 179
Turning Plot Points On and Off .................................................................. 181
Drawing a Line ........................................................................................... 182
Drawing a Circle ........................................................................................ 184
Drawing Vertical and Horizontal Lines ....................................................... 185
Freehand Drawing ..................................................................................... 185
Comment Text ............................................................................................ 186
Turning Pixels On and Off ......................................................................... 187
xxiv
Contents
Clearing Drawn Lines and Points .............................................................. 188
Chapter 11 Dual Graph ............................................................. 189
11-1 Before Using Dual Graph ............................................................ 190
About Dual Graph Screen Types ............................................................... 190
11-2 Specifying the Left and Right View Window Parameters ......... 192
11-3 Drawing a Graph in the Active Screen ....................................... 194
11-4 Displaying a Graph in the Inactive Screen ................................ 195
Before Displaying a Graph in the Inactive Screen ..................................... 195
Copying the Active Graph to the Inactive Screen ...................................... 195
Switching the Contents of the Active and Inactive Screens ...................... 196
Drawing Different Graphs on the Active Screen and Inactive Screen ....... 196
Other Graph Functions with Dual Graph ................................................... 199
Chapter 12 Graph-to-Table ....................................................... 201
12-1 Before Using Graph-to-Table ...................................................... 202
12-2 Using Graph-to-Table .................................................................. 203
12-3 Graph-to-Table Precautions ........................................................ 206
Chapter 13 Dynamic Graph ...................................................... 207
13-1 Before Using Dynamic Graph ..................................................... 208
13-2 Storing, Editing, and Selecting Dynamic Graph Functions ..... 209
13-3 Drawing a Dynamic Graph .......................................................... 210
10-time Continuous Drawing ..................................................................... 213
Continuous Drawing .................................................................................. 215
Stop & Go Drawing .................................................................................... 216
13-4 Using Dynamic Graph Memory .................................................. 218
13-5 Dynamic Graph Application Examples ...................................... 220
Chapter 14 Implicit Function Graphs ...................................... 223
14-1 Before Graphing an Implicit Function ....................................... 224
Entering the CONICS Mode ...................................................................... 224
14-2 Graphing an Implicit Function .................................................... 225
14-3 Implicit Function Graph Analysis ............................................... 228
14-4 Implicit Function Graphing Precautions ................................... 233
xxv
Contents
Chapter 15 Table & Graph......................................................... 235
15-1 Before Using Table & Graph ....................................................... 236
15-2 Storing a Function and Generating a Numeric Table ............... 237
Variable Specifications .............................................................................. 237
Generating a Table .................................................................................... 238
Specifying the function type ...................................................................... 240
15-3 Editing and Deleting Functions .................................................. 241
15-4 Editing Tables and Drawing Graphs ........................................... 242
Row Operations ......................................................................................... 243
Deleting a Table ......................................................................................... 244
Graphing a Function .................................................................................. 245
15-5 Copying a Table Column to a List .............................................. 248
Chapter 16 Recursion Table and Graph ................................... 249
16-1 Before Using the Recursion Table and Graph Function........... 250
16-2 Inputting a Recursion Formula and Generating a Table ........... 251
16-3 Editing Tables and Drawing Graphs ........................................... 256
Before Drawing a Graph for a Recursion Formula .................................... 257
Drawing a Convergence/Divergence Graph (WEB graph) ........................ 258
Chapter 17 List Function .......................................................... 263
List Data Linking .................................................................................... 264
17-1 List Operations ............................................................................ 265
17-2 Editing and Rearranging Lists.................................................... 268
Editing List Values ..................................................................................... 268
Sorting List Values ..................................................................................... 270
17-3 Manipulating List Data ................................................................ 272
Accessing the List Data Manipulation Function Menu ............................... 272
17-4 Arithmetic Calculations Using Lists .......................................... 278
Error Messages ......................................................................................... 278
Inputting a List into a Calculation .............................................................. 278
Recalling List Contents .............................................................................. 280
Graphing a Function Using a List .............................................................. 280
Inputting Scientific Calculations into a List ................................................ 280
Performing Scientific Function Calculations Using a List .......................... 281
17-5 Switching Between List Files ..................................................... 282
xxvi
Contents
Chapter 18 Statistical Graphs and Calculations .................... 283
18-1 Before Performing Statistical Calculations ............................... 284
18-2 Paired-Variable Statistical Calculation Examples ..................... 285
Inputting Data into Lists ............................................................................. 285
Plotting Data .............................................................................................. 285
Plotting a Scatter Diagram ......................................................................... 286
Changing Graph Parameters ..................................................................... 286
1. Graph draw/non-draw status (SELECT) ................................................ 287
2. General graph settings (SET) ................................................................ 288
Drawing an xy Line Graph ......................................................................... 292
Selecting the Regression Type .................................................................. 292
Displaying Statistical Calculation Results .................................................. 293
Graphing Statistical Calculation Results ................................................... 293
18-3 Calculating and Graphing Single-Variable Statistical Data ..... 294
Drawing a Histogram (Bar Graph) ............................................................. 294
Med-Box Graph (Med-Box) ....................................................................... 294
Mean-box Graph ........................................................................................ 294
Normal Distribution Curve ......................................................................... 295
Line Graph ................................................................................................. 295
Displaying Single-Variable Statistical Results ........................................... 296
18-4 Calculating and Graphing Paired-Variable Statistical Data ..... 297
Linear Regression Graph .......................................................................... 297
Med-Med Graph ........................................................................................ 297
Quadratic/Cubic/Quartic Regression Graph .............................................. 298
Logarithmic Regression Graph .................................................................. 299
Exponential Regression Graph .................................................................. 299
Power Regression Graph .......................................................................... 300
Displaying Paired-Variable Statistical Results ........................................... 301
Copying a Regression Graph Formula to the Graph Mode ....................... 302
Multiple Graphs ......................................................................................... 302
18-5 Other Graphing Functions .......................................................... 304
Manual Graphing ....................................................................................... 304
Setting the Width of a Histogram/Line Graph ............................................ 304
18-6 Performing Statistical Calculations ........................................... 305
Single-Variable Statistical Calculations ..................................................... 305
Paired-Variable Statistical Calculations ..................................................... 306
Regression Calculation ............................................................................. 306
Estimated Value Calculation ( , ) ............................................................ 307
Probability Distribution Calculation and Graphing ..................................... 308
Probability Graphing .................................................................................. 311
xxvii
Contents
Chapter 19 Programming ......................................................... 313
19-1 Before Programming ................................................................... 314
19-2 Programming Examples .............................................................. 315
19-3 Debugging a Program ................................................................. 321
19-4 Calculating the Number of Bytes Used by a Program ............. 322
19-5 Secret Function............................................................................ 323
19-6 Searching for a File...................................................................... 325
19-7 Searching for Data Inside a Program ......................................... 327
19-8 Editing File Names and Program Contents ............................... 328
19-9 Deleting a Program ...................................................................... 332
19-10 Useful Program Commands ....................................................... 333
19-11 Command Reference ................................................................... 337
Command Index ........................................................................................ 337
Basic Operation Commands ..................................................................... 338
Program Commands (COM) ...................................................................... 339
Program Control Commands (CTL) ........................................................... 343
Jump Commands (JUMP) ......................................................................... 345
Clear Commands (CLR) ............................................................................ 347
Display Commands (DISP) ........................................................................ 347
Input/Output Commands (I/O) ................................................................... 350
Conditional Jump Relational Operators (REL) .......................................... 352
19-12 Text Display .................................................................................. 353
19-13 Using Calculator Functions in Programs .................................. 354
Using Matrix Row Operations in a Program .............................................. 354
Using Graph Functions in a Program ........................................................ 355
Using Dynamic Graph Functions in a Program ......................................... 356
Using Table & Graph Functions in a Program ........................................... 357
Using Recursion Table & Graph Functions in a Program .......................... 358
Using List Sort Functions in a Program ..................................................... 359
Using Statistical Calculations and Graphs in a Program ........................... 359
Performing Statistical Calculations ............................................................ 361
Chapter 20 Data Communications ........................................... 363
20-1
20-2
20-3
20-4
Connecting Two Units ................................................................. 364
Connecting the Unit with a Personal Computer ....................... 365
Connecting the Unit with a CASIO Label Printer ...................... 366
Before Performing a Data Communication Operation ............. 367
xxviii
Contents
20-5 Performing a Data Transfer Operation ....................................... 368
20-6 Screen Send Function ................................................................. 372
20-7 Data Communications Precautions ........................................... 373
Chapter 21 Program Library ..................................................... 375
1.
2.
3.
4.
5.
Prime Factor Analysis ....................................................................... 376
Greatest Common Measure .............................................................. 378
t -Test Value ......................................................................................... 380
Circle and Tangents ........................................................................... 382
Rotating a Figure ............................................................................... 389
Appendix
.................................................................................. 393
Appendix A Resetting the Calculator.................................................. 394
Appendix B Power Supply ................................................................... 396
Replacing Batteries ................................................................................... 396
About the Auto Power Off Function ........................................................... 398
Appendix C Error Message Table ........................................................ 399
Appendix D Input Ranges .................................................................... 401
Appendix E 2-byte Command Table .................................................... 404
Appendix F Specifications ................................................................... 405
Index ....................................................................................................... 410
Command Index ..................................................................................... 416
Key Index ................................................................................................ 417
xxix
— Read This First!
The symbols in this manual indicate the
following messages.
: Important notes
: Notes
: Reference pages
P.000
Getting Acquainted — Read This First!
Getting Acquainted
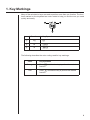
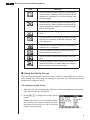
1. Key Markings
Many of the calculator’s keys are used to perform more than one function. The functions marked on the keyboard are color coded to help you find the one you need
quickly and easily.
Function
Key Operation
1
log
l
2
10 x
!l
3
B
al
The following describes the color coding used for key markings.
Color
Key Operation
Orange
Press ! and then the key to perform the marked
function.
Red
Press a and then the key to perform the marked
function.
2
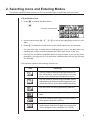
2. Selecting Icons and Entering Modes
This section describes how to select an icon in the Main Menu to enter the mode you want.
uTo select an icon
1. Press m to display the Main Menu.
m
Currently selected icon
2. Use the cursor keys (d, e, f, c) to move the highlighting to the icon you
want.
3. Press w to display the initial screen of the mode whose icon you selected.
• You can also enter a mode without highlighting an icon in the Main Menu by
inputting the number or letter marked in the lower right corner of the icon.
• Use only the procedures described above to enter a mode. If you use any other
procedure, you may end up in a mode that is different than the one you thought
you selected.
The following explains the meaning of each icon.
Icon
Meaning
Use this mode for arithmetic calculations and function calculations, and for calculations involving
binary, octal, decimal and hexadecimal values.
Use this mode to perform single-variable (standard deviation) and paired-variable (regression) statistical calculations, and to draw statistical graphs.
Use this mode for storing and editing matrices.
Use this mode for storing and editing numeric
data.
Use this mode to store graph functions and to
draw graphs using the functions.
Use this mode to store graph functions and to
draw multiple versions of a graph by changing the
values assigned to the variables in a function.
3
2
Selecting Icons and Entering Modes
Icon
Meaning
Use this mode to store functions, to generate a
numeric table of different solutions as the values
assigned to variables in a function change, and
to draw graphs.
Use this mode to store recursion formulas, to generate a numeric table of different solutions as the
values assigned to variables in a function change,
and to draw graphs.
Use this mode to draw graphs of implicit functions.
Use this mode to solve linear equations with two
through six unknowns, quadratic equations, and
cubic equations.
Use this mode to store programs in the program
area and to run programs.
Use this mode to transfer memory contents or
back-up data to another unit.
Use this mode to adjust the contrast of the display.
Use this mode to check how much memory is
used and remaining, to delete data from memory,
and to initialize (reset) the calculator.
k Using the Set Up Screen
The first thing that appears when you enter a mode is the mode’s set up screen,
which shows the current status of settings for the mode. The following procedure
shows how to change a set up.
uTo change a mode set up
1. Select the icon you want and press w enter a mode and display its initial screen.
Here we will enter the RUN Mode.
2. Press !Z to display the mode’s set up
screen.
• This set up screen is just one possible example. Actual set up screen contents will differ
according to the mode you are in and that
mode’s current settings.
1 2 3 4 5 6
4
Selecting Icons and Entering Modes
2
3. Use the f and c cursor keys to move the highlighting to the item whose
setting you want to change.
4. Press the function key (1 to 6) that is marked with the setting you want to
make.
5. After you are finished making any changes you want, press J to return to the
initial screen of the mode.
k Set Up Screen Function Key Menus
This section details the settings you can make using the function keys in the set up
display.
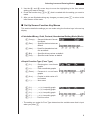
uCalculation/Binary, Octal, Decimal, Hexadecimal Setting Mode (Mode)
1 (Comp) ..... General Arithmetic Calculation Mode
2 (Dec) ........ Specifies decimal values as
default
3 (Hex) ........ Specifies hexadecimal values as default
1 2 3 4 5 6
4 (Bin) ......... Specifies binary values as default
5 (Oct) ......... Specifies octal values as default
uGraph Function Type (Func Type)
1 (Y=) .......... Rectangular coordinate
graphs
2 (r=) ........... Polar coordinate graphs
3 (Parm) ...... Parametric coordinate
graphs
1 2 3 4 5 6
4 (X=c) ........ Graphs in which value of X
is constant
6 (g) ........... Next menu
1 (Y>) .......... y > f(x) inequality graph
2 (Y<) .......... y < f(x) inequality graph
3 (Y≥) .......... y > f(x) inequality graph
4 (Y≤) .......... y < f(x) inequality graph
1 2 3 4 5 6
6 (g) ........... Previous menu
• The setting you make for Func Type determines the variable name that is input
when you press v.
5
2
Selecting Icons and Entering Modes
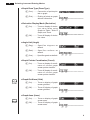
uGraph Draw Type (Draw Type)
1 (Con) ........ Connection of points plotted on graph.
2 (Plot) ........ Plotting of points on graph
without connection.
1 2 3 4 5 6
uDerivative Display Mode (Derivative)
1 (On) .......... Turns on display of derivative value when using
Graph-to-Table, Table &
Graph, and Trace.
2 (Off) .......... Turns off display of derivative value.
1 2 3 4 5 6
uAngle Unit (Angle)
1 (Deg) ........ S p e c i f i e s d e g r e e s a s
default.
2 (Rad) ........ S p e c i f i e s r a d i a n s a s
default.
3 (Gra) ........ Specifies grads as default.
1 2 3 4 5 6
uGraph Pointer Coordinates (Coord)
1 (On) .......... Turns on display of coordinates of current graph
screen pointer location.
2 (Off) .......... Turns off display of coordinates of current graph
screen pointer location.
1 2 3 4 5 6
uGraph Gridlines (Grid)
P.136
1 (On) .......... Turns on display of graph
screen gridlines.
2 (Off) .......... Turns off display of graph
screen gridlines.
1 2 3 4 5 6
uGraph Axes (Axes)
1 (On) .......... Turns on display of graph
screen axes.
P.136
2 (Off) .......... Turns off display of graph
screen axes.
1 2 3 4 5 6
6
Selecting Icons and Entering Modes
2
uGraph Axis Labels (Label)
P.136
1 (On) .......... Turns on display of graph
screen axis labels.
2 (Off) .......... Turns off display of graph
screen axis labels.
1 2 3 4 5 6
uDisplay Format (Display)
1 (Fix) .......... Displays screen for specification of number of decimal places.
2 (Sci) ......... Displays screen for specification of number of significant digits.
1 2 3 4 5 6
3 (Norm) ...... Switches exponential format display range.
P.18
4 (Eng) ........ Engineering mode.
uStatistical Graph View Window Setting (Stat Wind)
1 (Auto) ....... Automatic setting of view
window values for statistical
graph drawing.
2 (Man) ....... Manual setting of view window values for statistical
graph drawing.
1 2 3 4 5 6
uGraph Function Display (Graph Func)
1 (On) .......... Turns on display of function
during graph drawing and
trace.
2 (Off) .......... Turns off display of function
during graph drawing and
trace.
P.161
1 2 3 4 5 6
uGraph Background (Background)
1 (None) ...... No graph background.
2 (PICT) ...... Displays screen for specification of picture for graph
background.
1 2 3 4 5 6
7
2
Selecting Icons and Entering Modes
uList File Specification (List File)
P.282
1(File 1)~
6(File 6) .... List file number (1 to 6) specification.
1 2 3 4 5 6
uDual Screen Mode (Dual Screen)
The Dual Screen Mode setting you can select differs depending upon whether you
are using the GRAPH Mode set up screen or the TABLE/RECUR Mode set up screen.
GRAPH Mode
P.190
1 (Grph) ...... Divides screen into two
parts, each of which can be
used for graphing.
P.202
2 (GtoT) ...... Divides screen into two
parts for generation of numeric table from graph.
1 2 3 4 5 6
3 (Off) .......... Dual Screen off.
TABLE/RECUR Mode
P.247
1 (T+G) ....... Divides screen into two
parts, one for graphing and
one for a numeric table.
2 (Off) .......... Dual Screen off.
1 2 3 4 5 6
uSimultaneous Graph Mode (Simul Graph)
1 (On) .......... Turns on simultaneous
graphing of all functions in
memory.
2 (Off) .......... Simultaneous graphing off
(graphs drawn one-byone).
1 2 3 4 5 6
uDynamic Graph Type (Dynamic Type)
P.215
1 (Cnt) ......... Continuous drawing of Dynamic Graphs.
2 (Stop) ....... Automatic stopping of Dynamic Graph drawing after
10 draws.
1 2 3 4 5 6
8
Selecting Icons and Entering Modes
2
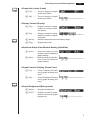
uTable & Graph Generation Settings (Variable)
P.238
1 (Rang) ...... Table generation and graph
drawing using numeric table range.
P.238
2 (LIST) ....... Table generation and graph
drawing using list data.
1 2 3 4 5 6
uΣ Data Display Mode (Σ Display)
1 (On) .......... Turns on display of Σ value
on recursion numeric table.
2 (Off) .......... Turns off display of Σ value.
1 2 3 4 5 6
uImplicit Function Graph Derivative Display Mode (Slope)
1 (On) .......... Turns on display of derivative at current pointer location on implicit function
graph screen.
2 (Off) .......... Turns off display of derivative.
1 2 3 4 5 6
Abbreviations
STAT ............... Statistics
MAT ................ Matrix
DYNA ............. Dynamic Graph
RECUR .......... Recursion
EQUA ............. Equation
PRGM ............ Program
CONT ............. Contrast
MEM ............... Memory
9
3. Display
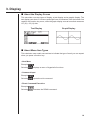
k About the Display Screen
This calculator uses two types of display: a text display and a graphic display. The
text display can show 21 columns and eight lines of characters, with the bottom line
used for the function key menu, while the graph display uses an area that measures
127 (W) × 63 (H) dots.
Text Display
Graph Display
k About Menu Item Types
This calculator uses certain conventions to indicate the type of result you can expect
when you press a function key.
• Next Menu
Example:
Selecting
displays a menu of hyperbolic functions.
• Command Input
Example:
Selecting
inputs the sinh command.
• Direct Command Execution
Example:
Selecting
executes the DRAW command.
10
Display
3
k Exponential Display
The calculator normally displays values up to 10 digits long. Values that exceed this
limit are automatically converted to and displayed in exponential format. You can
specify one of two different ranges for automatic changeover to exponential display.
Norm 1 ........... 10–2 (0.01) > |x|, |x| > 1010
Norm 2 ........... 10–9 (0.000000001) > |x|, |x| > 1010
uTo change the exponential display range
1. Press !Z to display the Set Up Screen.
2. Use f and c to move the highlighting to “Display”.
3. Press 3 (Norm).
The exponential display range switches between Norm 1 and Norm 2 each time you
perform the above operation. There is no display indicator to show you which exponential display range is currently in effect, but you can always check it by seeing
what results the following calculation produces.
Ab/caaw
(Norm 1)
(Norm 2)
All of the examples in this manual show calculation results using Norm 1.
uHow to interpret exponential format
1.2E+12 indicates that the result is equivalent to 1.2 × 10 12. This means that you
should move the decimal point in 1.2 twelve places to the right, because the exponent is positive. This results in the value 1,200,000,000,000.
1.2E–03 indicates that the result is equivalent to 1.2 × 10 –3. This means that you
should move the decimal point in 1.2 three places to the left, because the exponent
is negative. This results in the value 0.0012.
11
3
Display
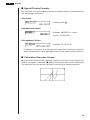
k Special Display Formats
This calculator uses special display formats to indicate fractions, hexadecimal values, and sexagesimal values.
uFractions
12
..... Indicates: 456 ––––
23
uHexadecimal Values
..... Indicates: ABCDEF12(16), which
equals –1412567278(10)
uSexagesimal Values
..... Indicates: 12° 34’ 56.78"
• In addition to the above, this calculator also uses other indicators or symbols,
which are described in each applicable section of this manual as they come up.
k Calculation Execution Screen
Whenever the calculator is busy drawing a graph or executing a long, complex calculation or program, a black box (k) flashes in the upper right corner of the display.
This black box tells you that the calculator is performing an internal operation.
12
4. Contrast Adjustment
Adjust the contrast whenever objects on the display appear dim or difficult to see.
uTo display the contrast adjustment screen
Highlight the CONT icon in the Main Menu and then press w.
Use d and e to adjust contrast.
• d makes figures on the screen lighter, while e makes them darker.
• Holding down d or e changes the contrast setting at high speed.
After adjusting the contrast, press m to return to the Main Menu.
13
5. When you keep having problems…
If you keep having problems when you are trying to perform operations, try the following before assuming that there is something wrong with the calculator.
k Get the Calculator Back to its Original Mode Settings
1. In the Main Menu, select the RUN icon and press w.
2. Press ! Z to display the Set Up Screen.
3. Highlight “Angle” and press 2 (Rad).
4. Highlight “Display” and press 3 (Norm) to select the exponential display range
(Norm 1 or Norm 2) that you want to use.
P.3
5. Now enter the correct mode and perform your calculation again, monitoring the
results on the display.
k In Case of Hang Up
P.395
• Should the unit hang up and stop responding to input from the keyboard, press
the P button on the back of the calculator to reset the memory. Note, however,
that this clears all the data in calculator memory.
k Low Battery Message
The low battery message appears while the main battery power is below a certain
level whenever you press o to turn power on or m to display the Main Menu.
o or m
↓ About 3 seconds later
P.396
If you continue using the calculator without replacing batteries, power will automatically turn off to protect memory contents. Once this happens, you will not be able to
turn power back on, and there is the danger that memory contents will be corrupted
or lost entirely.
• You will not be able to perform data communications operations once the low
battery message appears.
14