1
PeriReporter User’s Guide 2.1
Avaya Business Communications Manager
Release 6.0
Document Status: Standard
Document Number: P0988093
Document Version: 02.12
Date: July 2010
© 2010 Avaya Inc.
All Rights Reserved.
Notices
While reasonable efforts have been made to ensure that the information in this document is complete and accurate at the time of printing,
Avaya assumes no liability for any errors. Avaya reserves the right to make changes and corrections to the information in this document
without the obligation to notify any person or organization of such changes.
Documentation disclaimer
Avaya shall not be responsible for any modifications, additions, or deletions to the original published version of this documentation
unless such modifications, additions, or deletions were performed by Avaya. End User agree to indemnify and hold harmless Avaya,
Avaya’s agents, servants and employees against all claims, lawsuits, demands and judgments arising out of, or in connection with,
subsequent modifications, additions or deletions to this documentation, to the extent made by End User.
Link disclaimer
Avaya is not responsible for the contents or reliability of any linked Web sites referenced within this site or documentation(s) provided by
Avaya. Avaya is not responsible for the accuracy of any information, statement or content provided on these sites and does not
necessarily endorse the products, services, or information described or offered within them. Avaya does not guarantee that these links will
work all the time and has no control over the availability of the linked pages.
Warranty
Avaya provides a limited warranty on this product. Refer to your sales agreement to establish the terms of the limited warranty. In
addition, Avaya’s standard warranty language, as well as information regarding support for this product, while under warranty, is
available to Avaya customers and other parties through the Avaya Support Web site: http://www.avaya.com/support
Please note that if you acquired the product from an authorized reseller, the warranty is provided to you by said reseller and not by Avaya.
Licenses
THE SOFTWARE LICENSE TERMS AVAILABLE ON THE AVAYA WEBSITE, HTTP://SUPPORT.AVAYA.COM/LICENSEINFO/
ARE APPLICABLE TO ANYONE WHO DOWNLOADS, USES AND/OR INSTALLS AVAYA SOFTWARE, PURCHASED FROM
AVAYA INC., ANY AVAYA AFFILIATE, OR AN AUTHORIZED AVAYA RESELLER (AS APPLICABLE) UNDER A
COMMERCIAL AGREEMENT WITH AVAYA OR AN AUTHORIZED AVAYA RESELLER. UNLESS OTHERWISE AGREED TO
BY AVAYA IN WRITING, AVAYA DOES NOT EXTEND THIS LICENSE IF THE SOFTWARE WAS OBTAINED FROM ANYONE
OTHER THAN AVAYA, AN AVAYA AFFILIATE OR AN AVAYA AUTHORIZED RESELLER, AND AVAYA RESERVES THE
RIGHT TO TAKE LEGAL ACTION AGAINST YOU AND ANYONE ELSE USING OR SELLING THE SOFTWARE WITHOUT A
LICENSE. BY INSTALLING, DOWNLOADING OR USING THE SOFTWARE, OR AUTHORIZING OTHERS TO DO SO, YOU,
ON BEHALF OF YOURSELF AND THE ENTITY FOR WHOM YOU ARE INSTALLING, DOWNLOADING OR USING THE
SOFTWARE (HEREINAFTER REFERRED TO INTERCHANGEABLY AS "YOU" AND "END USER"), AGREE TO THESE
TERMS AND CONDITIONS AND CREATE A BINDING CONTRACT BETWEEN YOU AND AVAYA INC. OR THE
APPLICABLE AVAYA AFFILIATE ("AVAYA").
Copyright
Except where expressly stated otherwise, no use should be made of the Documentation(s) and Product(s) provided by Avaya. All content
in this documentation(s) and the product(s) provided by Avaya including the selection, arrangement and design of the content is owned
either by Avaya or its licensors and is protected by copyright and other intellectual property laws including the sui generis rights relating
to the protection of databases. You may not modify, copy, reproduce, republish, upload, post, transmit or distribute in any way any
content, in whole or in part, including any code and software. Unauthorized reproduction, transmission, dissemination, storage, and or
use without the express written consent of Avaya can be a criminal, as well as a civil offense under the applicable law.
Third Party Components
Certain software programs or portions thereof included in the Product may contain software distributed under third party agreements
("Third Party Components"), which may contain terms that expand or limit rights to use certain portions of the Product ("Third Party
Terms"). Information regarding distributed Linux OS source code (for those Products that have distributed the Linux OS source code),
and identifying the copyright holders of the Third Party Components and the Third Party Terms that apply to them is available on the
Avaya Support Web site: http://support.avaya.com/Copyright.
Trademarks
The trademarks, logos and service marks ("Marks") displayed in this site, the documentation(s) and product(s) provided by Avaya are the
registered or unregistered Marks of Avaya, its affiliates, or other third parties. Users are not permitted to use such Marks without prior
written consent from Avaya or such third party which may own the Mark. Nothing contained in this site, the documentation(s) and
product(s) should be construed as granting, by implication, estoppel, or otherwise, any license or right in and to the Marks without the
express written permission of Avaya or the applicable third party. Avaya is a registered trademark of Avaya Inc. All non-Avaya
trademarks are the property of their respective owners.
Downloading documents
For the most current versions of documentation, see the Avaya Support. Web site: http://www.avaya.com/support
Contact Avaya Support
Avaya provides a telephone number for you to use to report problems or to ask questions about your product. The support telephone
number is 1-800-242-2121 in the United States. For additional support telephone numbers, see the Avaya Web site: http://
www.avaya.com/support
3
Table of Contents
Preface . . . . . . . . . . . . . . . . . . . . . . . . . . . . . . . . . . . . . . . . . . . . 7
Scope . . . . . . . . . . . . . . . . . . . . . . . . . . . . . . . . . . . . . . . . . . . . . . . 8
Intended Audience . . . . . . . . . . . . . . . . . . . . . . . . . . . . . . . . . . . . . 8
How to Use This Manual . . . . . . . . . . . . . . . . . . . . . . . . . . . . . . . . 8
Organization of this Manual . . . . . . . . . . . . . . . . . . . . . . . . . . . . . 9
Conventions Used in This Manual . . . . . . . . . . . . . . . . . . . . . . . . 10
Solaris and Windows Conventions . . . . . . . . . . . . . . . . . . . . . . . 12
Trademark Conventions . . . . . . . . . . . . . . . . . . . . . . . . . . . . . . . . 12
Introduction . . . . . . . . . . . . . . . . . . . . . . . . . . . . . . . . . . . . . . 13
What is PeriReporter? . . . . . . . . . . . . . . . . . . . . . . . . . . . . . . . . . 14
Three Components of PeriReporter . . . . . . . . . . . . . . . . . . . . . . . 15
PeriConsolidator . . . . . . . . . . . . . . . . . . . . . . . . . . . . . . . . . . 15
PeriDefiner . . . . . . . . . . . . . . . . . . . . . . . . . . . . . . . . . . . . . . 15
PeriReporter . . . . . . . . . . . . . . . . . . . . . . . . . . . . . . . . . . . . . 15
Sharing Data Between Solaris and Windows . . . . . . . . . . . . . . . 16
Time Zones . . . . . . . . . . . . . . . . . . . . . . . . . . . . . . . . . . . . . . . . . 17
Statistical Maintenance . . . . . . . . . . . . . . . . . . . . . . . . . . . . . 19
Collection and Maintenance of Statistical Data . . . . . . . . . . . . . . 20
Single vs. Multi-node Environments . . . . . . . . . . . . . . . . . . 21
Defining Stat Events in a Single Node Environment . . . 22
Application Stat Events in a Multi-Node Environment . 23
PeriReporter and the Avaya MPS Network . . . . . . . . . . . . . 25
System and Application Statistics. . . . . . . . . . . . . . . . . . . . . 27
System Statistics . . . . . . . . . . . . . . . . . . . . . . . . . . . . . . . 27
Application Statistics . . . . . . . . . . . . . . . . . . . . . . . . . . . 32
The PeriProducer Application . . . . . . . . . . . . . . . . . . . . 34
Gathering Application Statistics (Block Execution Statistics) . .
35
Defining Application (Block Execution) Statistics . . . . 36
Determining Blocks Associated With a Counter . . . . . . 37
Passing Statistics Folders to a Linked Application . . . . . 37
PeriConsolidator . . . . . . . . . . . . . . . . . . . . . . . . . . . . . . . . . . . 39
Purpose . . . . . . . . . . . . . . . . . . . . . . . . . . . . . . . . . . . . . . . . . . . . . 40
Configuration . . . . . . . . . . . . . . . . . . . . . . . . . . . . . . . . . . . . . . . . 41
Data Maintenance . . . . . . . . . . . . . . . . . . . . . . . . . . . . . . . . . 42
Parameters. . . . . . . . . . . . . . . . . . . . . . . . . . . . . . . . . . . . . . . 43
Logging . . . . . . . . . . . . . . . . . . . . . . . . . . . . . . . . . . . . . . . . . 44
pchistory.log . . . . . . . . . . . 44
Command Line Options . . . . . . . . . . . . . . . . . . . . . . . . . . . . . . . . 45
PeriReporter’s User Guide P0988093
July 2010
4
PeriDefiner . . . . . . . . . . . . . . . . . . . . . . . . . . . . . . . . . . . . . . . 47
Purpose . . . . . . . . . . . . . . . . . . . . . . . . . . . . . . . . . . . . . . . . . . . . . 48
Launch PeriDefiner. . . . . . . . . . . . . . . . . . . . . . . . . . . . . . . . 48
Launch PeriDefiner through PeriReporter . . . . . . . . . . . 48
PeriDefiner Tool Bar . . . . . . . . . . . . . . . . . . . . . . . . . . . . . . . . . . 49
Open a Report Definition . . . . . . . . . . . . . . . . . . . . . . . . . . . . . . . 50
Defining a Report . . . . . . . . . . . . . . . . . . . . . . . . . . . . . . . . . . . . . 51
Save the Report Definition . . . . . . . . . . . . . . . . . . . . . . . . . . 51
Update the Report Settings . . . . . . . . . . . . . . . . . . . . . . . . . . 52
Lines for Report Title . . . . . . . . . . . . . . . . . . . . . . . . . . . 52
Report Title . . . . . . . . . . . . . . . . . . . . . . . . . . . . . . . . . . . 52
Column Heading Rows . . . . . . . . . . . . . . . . . . . . . . . . . . 53
Rows per Page . . . . . . . . . . . . . . . . . . . . . . . . . . . . . . . . 53
Rows for Subtotals . . . . . . . . . . . . . . . . . . . . . . . . . . . . . 53
Rows for Totals . . . . . . . . . . . . . . . . . . . . . . . . . . . . . . . . 53
Report Mode . . . . . . . . . . . . . . . . . . . . . . . . . . . . . . . . . . 53
Default Detail Level . . . . . . . . . . . . . . . . . . . . . . . . . . . . 53
Default Start/End Time . . . . . . . . . . . . . . . . . . . . . . . . . . 53
Define Column Formulas and Mappings . . . . . . . . . . . . . . . 54
Column Formulas . . . . . . . . . . . . . . . . . . . . . . . . . . . . . . 54
Data Mapping . . . . . . . . . . . . . . . . . . . . . . . . . . . . . . . . . 55
Update Individual Columns and Cells . . . . . . . . . . . . . . . . . 58
Display Filters . . . . . . . . . . . . . . . . . . . . . . . . . . . . . . . . . 58
Column Appearance . . . . . . . . . . . . . . . . . . . . . . . . . . . . 60
Define Subtotals . . . . . . . . . . . . . . . . . . . . . . . . . . . . . . . . . . 62
Define Totals. . . . . . . . . . . . . . . . . . . . . . . . . . . . . . . . . . . . . 62
Options . . . . . . . . . . . . . . . . . . . . . . . . . . . . . . . . . . . . . . . . . . . . . 63
Column Mappings. . . . . . . . . . . . . . . . . . . . . . . . . . . . . . . . . 63
Column Filters . . . . . . . . . . . . . . . . . . . . . . . . . . . . . . . . . . . 63
Global Settings . . . . . . . . . . . . . . . . . . . . . . . . . . . . . . . . . . . 65
Screen Colors . . . . . . . . . . . . . . . . . . . . . . . . . . . . . . . . . . . . 66
Fill/Empty Report . . . . . . . . . . . . . . . . . . . . . . . . . . . . . . . . . 67
Print the Report Definition . . . . . . . . . . . . . . . . . . . . . . . . . . 68
Command Line Options . . . . . . . . . . . . . . . . . . . . . . . . . . . . 71
Help Menu . . . . . . . . . . . . . . . . . . . . . . . . . . . . . . . . . . . . . . 71
PeriReporter . . . . . . . . . . . . . . . . . . . . . . . . . . . . . . . . . . . . . . 73
Purpose . . . . . . . . . . . . . . . . . . . . . . . . . . . . . . . . . . . . . . . . . . . . . 74
Launch PeriReporter . . . . . . . . . . . . . . . . . . . . . . . . . . . . . . . 74
PeriReporter Tool Bar . . . . . . . . . . . . . . . . . . . . . . . . . . . . . . . . . 75
Generating a Report . . . . . . . . . . . . . . . . . . . . . . . . . . . . . . . . . . . 76
Open a Report Definition . . . . . . . . . . . . . . . . . . . . . . . . . . . 76
Select a Report Scope . . . . . . . . . . . . . . . . . . . . . . . . . . . . . . 78
Start Date and End Date . . . . . . . . . . . . . . . . . . . . . . . . . 78
Start Time and End Time . . . . . . . . . . . . . . . . . . . . . . . . 79
PeriReporter’s User Guide P0988093
July 2010
5
Override Column Avaya MPS/VPS Numbers . . . . . . . . 79
Avaya MPS/VPS Range . . . . . . . . . . . . . . . . . . . . . . . . . 80
Detail Level . . . . . . . . . . . . . . . . . . . . . . . . . . . . . . . . . . . 80
List Files in Range . . . . . . . . . . . . . . . . . . . . . . . . . . . . . 80
Generate the Report . . . . . . . . . . . . . . . . . . . . . . . . . . . . . . . 80
Web-Based Reports . . . . . . . . . . . . . . . . . . . . . . . . . . . . . . . . . . . 81
Report . . . . . . . . . . . . . . . . . . . . . . . . . . . . . . . . . . . . . . . . . . 81
Start Date and End Date . . . . . . . . . . . . . . . . . . . . . . . . . . . . 82
Start Time and End Time . . . . . . . . . . . . . . . . . . . . . . . . . . . 82
Detail Level. . . . . . . . . . . . . . . . . . . . . . . . . . . . . . . . . . . . . . 82
Avaya MPS Override . . . . . . . . . . . . . . . . . . . . . . . . . . . . . . 82
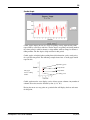
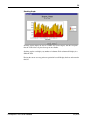
Graphs . . . . . . . . . . . . . . . . . . . . . . . . . . . . . . . . . . . . . . . . . . . . . 86
Graph Type . . . . . . . . . . . . . . . . . . . . . . . . . . . . . . . . . . . . . . 87
Plot Graph . . . . . . . . . . . . . . . . . . . . . . . . . . . . . . . . . . . . 87
Bar Graph . . . . . . . . . . . . . . . . . . . . . . . . . . . . . . . . . . . . 88
Area Graph . . . . . . . . . . . . . . . . . . . . . . . . . . . . . . . . . . . 89
Candle Graph . . . . . . . . . . . . . . . . . . . . . . . . . . . . . . . . . 90
Hilo Graph . . . . . . . . . . . . . . . . . . . . . . . . . . . . . . . . . . . 91
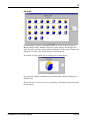
Pie Graph . . . . . . . . . . . . . . . . . . . . . . . . . . . . . . . . . . . . 92
Scatter Graph . . . . . . . . . . . . . . . . . . . . . . . . . . . . . . . . . 93
Stacking Graph . . . . . . . . . . . . . . . . . . . . . . . . . . . . . . . . 94
Grid Lines . . . . . . . . . . . . . . . . . . . . . . . . . . . . . . . . . . . . 95
Columns Available . . . . . . . . . . . . . . . . . . . . . . . . . . . . . 95
Titles Available . . . . . . . . . . . . . . . . . . . . . . . . . . . . . . . . 95
Selected Columns . . . . . . . . . . . . . . . . . . . . . . . . . . . . . . 95
Options . . . . . . . . . . . . . . . . . . . . . . . . . . . . . . . . . . . . . . . . . . . . . 96
Global Settings . . . . . . . . . . . . . . . . . . . . . . . . . . . . . . . . . . . 96
Screen Colors . . . . . . . . . . . . . . . . . . . . . . . . . . . . . . . . . . . . 97
Preview a Report. . . . . . . . . . . . . . . . . . . . . . . . . . . . . . . . . . 98
Export/Import . . . . . . . . . . . . . . . . . . . . . . . . . . . . . . . . . . . . 98
Print a Generated Report. . . . . . . . . . . . . . . . . . . . . . . . . . . 100
Other Functions. . . . . . . . . . . . . . . . . . . . . . . . . . . . . . . . . . 104
Command Line Options . . . . . . . . . . . . . . . . . . . . . . . . . . . 104
Help Menu . . . . . . . . . . . . . . . . . . . . . . . . . . . . . . . . . . . . . 105
Step-by-Step
Sample Report . . . . . . . . . . . . . . . . . . . . . . . . . . . . . . . . . . . 107
Step-by-Step Sample Report . . . . . . . . . . . . . . . . . . . . . . . . . . . 108
Index . . . . . . . . . . . . . . . . . . . . . . . . . . . . . . . . . . . . . . . . . . . 121
PeriReporter’s User Guide P0988093
July 2010
6
PeriReporter’s User Guide P0988093
July 2010
Preface
8
Scope
The PeriReporter User’s Guide provides information for the use of the PeriReporter
tool. It gives step-by-step instructions on gathering and displaying data from the
Avaya Media Processing Series system.
In addition to this document, the PeriView Reference Manual may be particularly
helpful when working with PeriReporter. It describes how to work within PeriView’s
Graphical User Interface (GUI) and individually documents each of PeriView’s tools.
Intended Audience
This document is targeted at any PeriView user. That is, any person responsible for
using PeriView to interact with the Avaya Media Processing Server (Avaya MPS)
Series could use this information. This guide assumes that PeriView users have
completed a Periphonics training program conducted as part of the initial system
installation.
How to Use This Manual
This manual uses many standard terms relating to computer system and software
application functions. However, it contains some terminology that can only be
explained in the context of the Avaya MPS system. See the Glossary of Avaya MPS
Terminology for definitions of Avaya MPS-specific terms.
Initially, you should read this manual at least once, from start to finish. Later, you can
use the Table of Contents to locate topics of interest for reference and review.
If you are reading this document online, use the cross-reference links (shown in blue)
to quickly locate related topics. <LEFT> click once with your mouse while positioned
with your cursor over the cross-reference link. Click on any point in a Table of
Contents entry to move to that topic. Click on the page number of any Index entry to
access that topic page.
To familiarize yourself with various specialized textual references within the manual,
, see Conventions Used in This Manual on page 10.
Periphonics is part of Avaya. The name Periphonics, and variations thereof, appear in
this manual only where it is referred to in a product. (For examples, a PeriProducer
application, the PERImps package, the perirev command, etc.)
At certain points in this manual, Avaya MPS is analogous with Voice Processing
Series (VPS). This is reflected in specific file names and directories, as well as certain
software features.
PeriReporter’s User Guide P0988093
July 2010
9
Organization of this Manual
This manual contains separate sections that describe the features and functions of the
PeriReporter tool.
•
Chapter 1 - Introduction
This chapter discusses the general characteristics of the PeriReporter tool,
including function, terminology, and individual components.
•
Chapter 2 - Statistical Maintenance
This chapter discusses the differences between single and multi node
environments along with System and Application statistics. This chapter
further discusses the collection and storage of statistical information for the
Avaya MPS system.
•
Chapter 3 - PeriConsolidator
This chapter discusses the various ways statistical data is gathered for use by
the PeriReporter tool.
•
Chapter 4 - PeriDefiner
This chapter discusses how reports are designed for generation at a later time.
•
Chapter 5 - PeriReporter
This chapter discusses how reports are generated for specific dates and times.
•
Chapter 6 - Step-by-Step Sample Report
This chapter contains a step-by-step construction of a sample report.
PeriReporter’s User Guide P0988093
July 2010
10
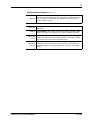
Conventions Used in This Manual
This manual uses different fonts and symbols to differentiate between document
elements and types of information. These conventions are summarized in the
following table.
Conventions Used in This Manual Sheet 1 of 2
Notation
Description
Normal text
Normal text font is used for most of the document.
important term
The Italics font is used to introduce new terms, to highlight
meaningful words or phrases, or to distinguish specific terms from
nearby text.
system
command
This font indicates a system command and/or its arguments. Such
keywords are to be entered exactly as shown (i.e., users are not to
fill in their own values).
command,
condition
and alarm
Command, Condition and Alarm references appear on the screen
in magenta text and reference the Command Reference Manual,
the PeriProducer User’s Guide, or the Alarm Reference Manual,
respectively. See these documents for detailed information about
Commands, Conditions, and Alarms.
file name /
directory
This font is used for highlighting the names of disk directories, files,
and extensions for file names. It is also used to show displays on
text-based screens (e.g., to show the contents of a file.)
on-screen field
This font is used for field labels, on-screen menu buttons, and
action buttons.
<KEY NAME>
A term that appears within angled brackets denotes a terminal
keyboard key, a telephone keypad button, or a system mouse
button.
Book Reference
This font indicates the names of other publications referenced
within the document.
cross reference
A cross reference appears on the screen in blue text. Click on the
cross reference to access the referenced location. A cross
reference that refers to a section name accesses the first page of
that section.
The Note icon identifies notes, important facts, and other keys to
understanding.
The Caution icon identifies procedures or events that require
special attention. The icon indicates a warning that serious
problems may arise if the stated instructions are improperly
followed.
PeriReporter’s User Guide P0988093
July 2010
11
Conventions Used in This Manual Sheet 2 of 2
Notation
Description
The flying Window icon identifies procedures or events that apply
to the Windows operating system only.a
The Solaris icon identifies procedures or events that apply to the
Solaris operating system only.b
a. Windows and the flying Window logo are either trademarks or registered trademarks of the Microsoft Corporation.
b. Solaris is a trademark or registered trademark of Sun Microsystems, Inc. in the
United States and other countries.
PeriReporter’s User Guide P0988093
July 2010
12
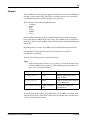
Solaris and Windows Conventions
This manual depicts examples (command line syntax, configuration files, and screen
shots) in Solaris format. In certain instances Windows specific commands,
procedures, or screen shots are shown where required. The following table lists
examples of general operating system conventions to keep in mind when using this
manual with either the Solaris or Windows operating system.
Solaris
Windows
Environment
$MPSHOME
%MPSHOME%
Paths
$MPSHOME/common/etc
%MPSHOME%\common\etc
Command
<command> &
start /b <command>
Trademark Conventions
The following trademark information is presented here and applies throughout for
third party products discussed within this manual. Trademarking information is not
repeated hereafter.
Solaris is a trademark or registered trademark of Sun Microsystems, Inc. in the United
States and other countries.
Microsoft, Windows, Internet Explorer, and the Flying Windows logo are either
trademarks or registered trademarks of Microsoft Corporation.
Netscape® and Netscape Navigator® are registered trademarks of Netscape
Communications Corporation in the United States and other countries. Netscape's
logos and Netscape product and service names are also trademarks of Netscape
Communications Corporation, which may be registered in other countries.
PeriReporter’s User Guide P0988093
July 2010
Introduction
This chapter covers:
1. What is PeriReporter?
2. Three Components of
PeriReporter
3. Sharing Data Between
Solaris and Windows
4. Time Zones
14
What is PeriReporter?
PeriReporter is a PeriView tool, consisting of three subtools - PeriConsolidator,
PeriDefiner, and PeriReporter - each contributing to the process of collecting,
maintaining, defining, and reporting statistical data for the Avaya Media Processing
Server (Avaya MPS) Series network. Using a Graphical User Interface (GUI), it
allows a point and click specification of multiple report formats for each statistics
record type. A report is viewed as a set of columns, with each column representing an
application or system statistics defined counter. There is a row of cells for each time
interval recorded in a statistics file.
When the PeriReporter Tools package is installed a .perireporter file is created
in the default PeriReporter home directory ($MPSHOME/PERIprpt/prpt). When
any changes are made in the Global Settings, Screen Colors, or Print Setup portions of
the PeriDefiner or PeriReporter components a new .perireporter file is created
in your home directory. These changes are then saved in this new file. The original
.perireporter file will remain unchanged. Eliminating the file residing in your
home directory will reset all parameters back to their default settings.
For additional information on the installation of the PeriReporter Tools package, refer
to the Avaya Installing Graphical Tools on a Customer Supplied Workstation
(9090504(I)) manual.
In a single node environment, each of PeriView’s tools reside on
the Avaya MPS node and all tools will display on the tool bar. In a
multi-node environment, PeriView tools reside on each node in
the Avaya MPS network, but the PeriReporter tool typically
resides only on the node that is designated as the site for statistical
collection and reporting. Therefore, in a multi-node environment,
the PeriReporter tool will only display on the tool bar at the
node(s) at which PeriReporter resides.
For additional information on single node environments, see
Defining Stat Events in a Single Node Environment on page 22.
PeriReporter’s User Guide P0988093
July 2010
15
Three Components of PeriReporter
PeriReporter consists of three parts, each dependent on previous input for required
information.
PeriConsolidator
This program gathers all system and application statistics and consolidates them into
15 minute, hourly, daily, weekly, monthly and yearly files. PeriConsolidator should be
configured in the crontab and set to run once a day at a convenient time, preferably
when the Avaya MPS system load is relatively light.
For additional information, see the PeriConsolidator chapter.
PeriDefiner
This program is a graphical utility which is used to set up the contents and the display
of a specific report. After a report definition is created and saved it can be generated
using the PeriReporter tool.
For additional information, see the PeriDefiner chapter.
PeriReporter
This program is a graphical utility which is used to generate reports. The report
(created in PeriDefiner) must be specified, along with the date and the consolidation
type, after which it can be generated and printed.
For additional information, see the PeriReporter chapter.
PeriReporter’s User Guide P0988093
July 2010
16
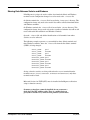
Sharing Data Between Solaris and Windows
If PeriReporter is going to be used to collect data from both Solaris and Windows
terminals certain configuration changes have to be made to the .rhosts file.
On Solaris terminals the .rhosts file is located in the /home/peri directory. This
configuration change only needs to be made if data will be collected from both Solaris
and Windows terminals.
On Windows terminals the .rhosts file is located in the \WinNT directory. This
configuration change always needs to be made, regardless of whether data will or will
not be collected from both Solaris and Windows terminals.
Open the .rhosts file and add the identifications of all terminals from where
statistics are to be collected.
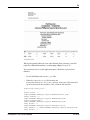
The following example represents a system which has three Solaris terminals and
three Windows terminals, where the .rhosts file from the first Solaris terminal
(UNIX1) is being changed.
UNIX2_NAME
UNIX2_NAME
UNIX3_NAME
UNIX3_NAME
WINDOWS1_NAME
WINDOWS1_NAME
WINDOWS2_NAME
WINDOWS2_NAME
WINDOWS3_NAME
WINDOWS3_NAME
peri
SYSTEM
peri
SYSTEM
peri
SYSTEM
peri
SYSTEM
peri
SYSTEM
Seeing as how the statistics are being collected on the UNIX1 terminal from the
terminals UNIX2, UNIX3, WINDOWS1, WINDOWS2 and WINDOWS3, only those
terminals need be listed.
Microsoft Services for UNIX (SFU) must be installed for PeriReporter collections
scripts to function correctly.
Symantec pcAnywhere cannot be installed, for any reason, on a
node where the SFU utilities reside. There is a conflict between
pcAnywhere and the Avaya software that produces system errors.
PeriReporter’s User Guide P0988093
July 2010
17
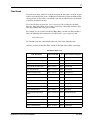
Time Zones
In certain areas of the world, Java will not recognize the time zones set on the system
which it is installed. If this occurs, PeriReporter will default to Greenwich Mean Time
and report times will be off by several hours. It is also possible that the consolidation
will not be performed correctly.
To be sure this does not occur the .perireporter file, residing in your home
directory, must be modified. A line stating timezone= along with your three-digit
time zone identification code must be added.
For example, if your system is installed in Hong Kong, and runs on China Standard
Time, the following line would need to be added to the .perireporter file.
timezone=CTT
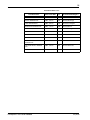
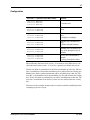
To determine your time zone identification code, refer to the following table.
All times are listed in Standard Time. Adjust for Daylight Saving Time accordingly.
Time Zones Sheet 1 of 2
Time Zone Name
Offset From GMT
ID
Countries/Cities/Regions
Greenwich Mean Time
GMT + 0 hours
GMT
Africa/Casablanca
Romance Standard Time
GMT + 1 hour
ECT
Europe/Paris
Egypt Standard Time
GMT + 2 hours
EET
Arica/Cairo
Saudi Arabia Standard Time
GMT + 3 hours
EAT
Asia/Riyadh
Iran Standard Time
GMT + 3 1/2 hours
MET
Asia/Tehran
Arabian Standard Time
GMT + 4 hours
NET
Asia/Yerevan
West Asia Standard Time
GMT + 5 hours
PLT
Asia/Karachi
India Standard Time
GMT + 5 1/2 hours
IST
Asia/Calcutta
Central Asia Standard Time
GMT + 6 hours
BST
Asia/Dacca
Bangkok Standard Time
GMT + 7 hours
VST
Asia/Bangkok
China Standard Time
GMT + 8 hours
CTT
Asia/Shanghai
Tokyo Standard Time
GMT + 9 hours
JST
Asia/Tokyo
Central Australia Standard
Time
GMT + 9 1/2 hours
ACT
Australia/Adelaide
Sydney Standard Time
GMT + 10 hours
AET
Australia/Sydney
Central Pacific Standard Time
GMT + 11 hours
SST
Pacific/Guadalcanal
New Zealand Standard Time
GMT + 12 hours
NST
Pacific/Auckland
Samoa Standard Time
GMT - 11 hours
MIT
Pacific/Apia
PeriReporter’s User Guide P0988093
July 2010
18
Time Zones Sheet 1 of 2
Time Zone Name
Offset From GMT
ID
Countries/Cities/Regions
Hawaiian Standard Time
GMT - 10 hours
HST
Pacific/Honolulu
Alaskan Standard Time
GMT - 9 hours
AST
America/Anchorage
Pacific Standard Time
GMT - 8 hours
PST
America/Los Angeles
US Mountain Standard Time
GMT - 7 hours
MST
America/Denver
Central Standard Time
GMT - 6 hours
CST
America/Chicago
Eastern Standard Time
GMT - 5 hours
EST
America/New York
Atlantic Standard Time
GMT - 4 hours
PRT
America/Halifax
Newfoundland Standard Time
GMT - 3 1/2 hours
CNT
America/St. Johns
South America Eastern
Standard Time
GMT - 3 hours
AGT
America/Buenos Aires
East South America Standard
Time
GMT - 3 hours
BET
America/San Paulo
Azores Standard Time
GMT - 1 hours
CAT
Atlantic/Azores
PeriReporter’s User Guide P0988093
July 2010
Statistical
Maintenance
This chapter covers:
1. Collection and Maintenance
of Statistical Data
20
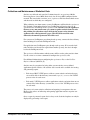
Collection and Maintenance of Statistical Data
Statistics are collected and stored in 15-minute intervals, on a per Avaya Media
Processing Server (Avaya MPS) Series basis, for all Avaya MPS configured for the
network. The $MPSHOME/common/etc/vpshosts file lists all networked servers
and the nodes at which they are configured.
When collecting stats from remote systems, PeriReporter will look in the vpshosts
file. For both system and application stats, PeriReporter will retrieve data for all
systems that are of TYPE vps in the vpshosts file. In some cases, the vpshosts
file may or may not contain some vps systems to gather statistics from. To solve
this problem, the collections scripts check for the presence of an alternate
vpshosts file called vpshosts.prpt. This file will be used if it exists.
Otherwise, the normal vpshosts file will be read.
For system stats, PeriReporter goes through each vps entry, converts the data to binary
form and brings it back to the PeriReporter node.
For application stats, PeriReporter goes through each vps entry. If it is not the local
node and it has not already been copied from another vps entry, the data is brought
back to the PeriReporter node.
The vpshosts file determines which systems will be used to gather statistics from.
Use the vhman or xvhman command to configure the vpshosts file.
For additional information on configuring the vpshosts file, see the PeriView
Reference Manual (9090722 (I)).
Statistics may be categorized as being either system statistics or user-defined,
application-specific statistics. All statistics data is stored and is available for creating
and generating reports.
•
Each Avaya MPS’ VSTAT process collects system statistics and writes them to
raw statistics files in the directory $MPSHOME/vps(#)/stats. One VSTAT
process exists for each server.
•
Each node’s VSUPD process collects application statistics and writes them to raw
statistics files in the directory: $ASEHOME/stats. One VSUPD process exists
for each node.
The process of system statistics collection and reporting is transparent to the user.
However, the process of collecting and reporting application statistics requires user
intervention.
Once a report is generated, report data is always static. Statistical updates can only be
displayed by generating a new report.
PeriReporter’s User Guide P0988093
July 2010
21
Single vs. Multi-node Environments
In a single node environment, the PeriReporter tool, statistics files and applications all
exist on the same node. (Stat events are defined, generated and collected on this same
node.)
In a multi-node environment, applications can execute on nodes where PeriReporter
does not reside. Statistics are transferred from the node at which they are generated to
the statistics node via scripts which run on the collection node.
PeriReporter’s User Guide P0988093
July 2010
22
Defining Stat Events in a Single Node Environment
This process applies to a configuration in which application statistics are to be
collected from Avaya MPS Series and VAS resources that reside on the statistics node.
The node’s VSUPD process is responsible for collecting application statistics from all
resources on the node. Each server’s VSTAT process is responsible for collecting
system statistics for the unit.
A single Avaya MPS consists of Telephony Media Server (TMS) hardware and both
Application Services Environment (ASE) and Voice Operating Software (Avaya VOS)
software processes. The UNIX node consists of Avaya MPS Series elements common
to all units configured for the node.
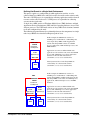
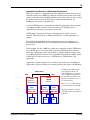
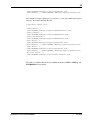
The following diagrams illustrate the relationships between the components in a single
node Avaya MPS Series from the PeriReporter point of view.
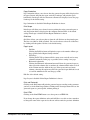
In this example, the UNIX node consists of a
VSUPD process and PeriView—with PeriReporter,
and a single Avaya MPS on which applications
execute. The Avaya MPS consists of a VSTAT
process; applications; ASE and VOS processes; and
TMS hardware.
MPS
UNIX Node
VSUPD
PeriView &
PeriReporter
MPS 1
Application stat events are defined within each
application, to the statistics node, and to the VSUPD
process. The VSUPD process collects application
statistics for the node and writes them to
$ASEHOME/stats as raw statistics files.
VSTAT
Application(s)
ASE / VOS
After System statistics for the Avaya MPS are
collected they are converted and stored in
$ASEHOME/stats as raw statistics files.
TMS
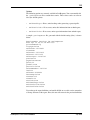
In this example, the UNIX node consists of a
VSUPD process and PeriView—with PeriReporter,
and two Avaya MPSs on which applications execute.
The Avaya MPSs each consist of a VSTAT process;
applications; ASE and VOS processes; and TMS
hardware.
MPS
UNIX Node
VSUPD
PeriView &
PeriReporter
MPS 1
VSTAT
Application(s)
ASE / VOS
TMS
PeriReporter’s User Guide P0988093
MPS 2
VSTAT
Application(s)
ASE / VOS
TMS
Application stat events are defined within each
application, to the statistics node, and to the VSUPD
process. The VSUPD process collects application
statistics for the node and writes them to
$ASEHOME/stats as raw statistics files.
After System statistics for the Avaya MPS are
collected they are converted and stored in
$ASEHOME/stats as raw statistics files.
July 2010
23
Application Stat Events in a Multi-Node Environment
This process applies to a configuration in which application statistics may have to be
collected from the Avaya MPS Series Network and VAS resources that reside on the
statistics node and from Avaya MPS and VAS resources that reside on nodes at which
the statistics files do not reside. Typically, in a multi-node environment, the
PeriReporter tool resides at one node only.
A node’s VSUPD process is responsible for collecting application statistics from all
Avaya MPS and VAS resources on the node. Each servers VSTAT process is
responsible for collecting system statistics for the unit.
VSUPD must be running on all nodes at which application statistics are to be
collected. This includes all Avaya MPS and VAS nodes at which applications are
running.
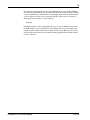
The following diagram illustrates the relationship between the components in a
multi-node Avaya MPS Series Network configuration, from the PeriReporter tool
point of view.
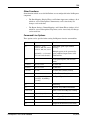
In this example, the Avaya MPS Series Network is configured with two UNIX nodes,
and a VSUPD process is associated with each node. Although PeriView resides at
both nodes, PeriReporter resides only on Node A, which is configured with a single
Avaya MPS 100. Node B consists of two Avaya MPS 100s. Each Avaya MPS consists
of ASE and VOS software processes, a VSUPD process, TMS hardware, and
applications.
Applications assigned to Node A are executing locally with respect to PeriReporter.
Applications assigned to Node B are executing remotely with respect to PeriReporter.
MPS network
MPS
MPS
Node A
VSUPD
PeriView &
PeriReporter
MPS 1
VSTAT
Application(s)
ASE / VOS
TMS
PeriReporter’s User Guide P0988093
Node B
VSUPD
PeriView
MPS 2
VSTAT
MPS 3
VSTAT
Application(s) Application(s)
ASE / VOS
ASE / VOS
TMS
Stat Events are defined within
each application and to each
node’s VSUPD process (which
collects application statistics for
the node and writes them to the
directory $ASEHOME/stats as
raw statistics files).
The strec#.sre files must be
copied from Node A to Node B.
Application statistics, collected
at Node B, need to be transferred
to Node A.
TMS
July 2010
24
In a multi-node environment, the stat event definition process may involve defining
stat events for applications that are executing on both local and remote nodes. Fields in
a stat record file must be defined once for each unique application for which statistics
are to be collected, whereas stat record code stub files must exist on each node at
which application statistics are to be collected.
Example:
If multiple instances of the same application are to execute on different nodes in the
network, fields in a stat record file have to be defined only once for the application,
regardless of the number of locations at which it will execute. However, stat record
code stub files must be located on all nodes running applications for which statistics
are to be collected.
PeriReporter’s User Guide P0988093
July 2010
25
PeriReporter and the Avaya MPS Network
Typically, a single node in a Avaya MPS Series Network is designated to collect and
report statistical data. PeriReporter resides on the node designated for this purpose.
System statistics are collected from each Avaya MPS Series by the server’s VSTAT
process. One VSTAT process exists for each unit.
•
•
In a single node environment, all Avaya MPS Series exist on the same (local)
node. System statistics are collected once each hour by each unit’s VSTAT
process. The script pr-sys-v5.plx runs and collects the raw data files from
the $MPSHOME/vpsN/stats directory and creates binary files in the
$ASEHOME/stats directory.
In a multi-node environment, Avaya MPS Series can be configured for nodes at
which PeriReporter does not reside (remote) as well as for the statistics collection
node (local). Scripts run on the collection node only and are transferred from the
remote nodes to the $ASEHOME/stats directory of the collection node.
•
System statistics generated at remote nodes are collected by each remote
Avaya MPS Series’ VSTAT process, transferred to the statistics node and
stored in sysstats and accstats files.
•
System statistics generated by Avaya MPS Series configured for the statistics
node (local) are collected by each local server’s VSTAT process and stored in
sysstats and accstats files. Two types of files are created by the script
pr-sys-v5.plx.
• sysstats - system statistics files by Avaya MPS, line, span, and host
• accstats - system statistics files by time
•
The System Variables are predefined. Of the System Variables available, each
report definition can specify only one of the following.
• System.VPS
• System.Line
• System.Host
• System.Span
If one of the above system variables is chosen in a report then all variables for
the report definition will be collected from sysstats files. Counters for the
rest of the report definition can be any combination of remaining System
Variables.
These variables are usually mapped to the first column of a report in place of
the date. When these variables are used, no column may be mapped to record
the date. If one of these variables is chosen for a particular column and Date is
chosen for another column an error message will appear.
•
With the exception of the above variables, report definitions can be mapped to
any combination of Application and System Variables.
For additional information on mapping of columns for report definitions, see the Data
Mapping section of this manual.
PeriReporter’s User Guide P0988093
July 2010
26
Application statistics are generated during an application’s execution cycle and
collected by each node’s VSUPD process. One VSUPD process exists for each node.
•
In a single node environment, all Avaya MPS Series exist on the same (local)
node. Application statistics are collected by the node’s VSUPD process and
written to raw statistics files in the directory $ASEHOME/stats.
•
Application statistics generated at remote nodes are collected by each remote
node’s VSUPD process, transferred to the statistics node and stored in
appstats files in $ASEHOME/stats. The script pr-app-v5.plx is
used to collect remote statistics for the application data.
•
•
appstats - application statistics files
Application statistics generated by Avaya MPS Series configured for the
statistics node (local) are collected by the node’s VSUPD process and stored
in appstats files.
To view these files, use the vsupdump -f command.
The VSUPD process must be running on all nodes at which applications are executing
and statistics are to be collected. If VSUPD is not running on a node at which
applications are executing, any statistics that are generated at that node will not be
collected.
To run the VSUPD process, uncomment the VSUPD line within the gen.cfg file in
the $MPSHOME/common/etc directory.
PeriReporter’s User Guide P0988093
July 2010
27
System and Application Statistics
Statistical data originates from user defined, application-specific stat events and
system defined stat events.
System statistics and application statistics reports can be generated individually for
each Avaya MPS, or for all units configured for the network.
On systems configured with more than one node, application statistics will be
collected for all of the node’s resources by a single VSUPD process. However, system
statistics will be collected for each Avaya MPS by individual VSTAT processes.
System Statistics
System statistics report data related to phone line usage, digital span activity, and host
interaction. System statistics are Avaya MPS-specific and include all statistics
generated by all applications on each unit.
System stat events are predefined by Avaya. System statistical reports are predefined
by Avaya and should not be modified without consulting Avaya. System statistics can
be viewed with PeriReporter, which is used to select and generate a report.
VSTAT is the VOS (Voice Operating Software) process responsible for collecting
system statistics. System stat events are maintained by stat event counters. Each Avaya
MPS Series designates one counter for each unique occurrence of a specified event.
System statistics are collected on a per Avaya MPS Series basis, by each unit’s VSTAT
process. At regular intervals, data is collected from each unit to the collection node
and transferred to binary files, where it is stored on a per unit basis.
These files are located in $ASEHOME/stats and are called sysstats and
accstats.
PeriReporter’s User Guide P0988093
July 2010
28
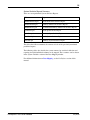
System Statistics Reports Summary
There are seven predefined System Statistics Reports.
Filename
Report
MPSPhoneDetail.prd
Detail Phone Line Statistics Report
MPSPhoneSum.prd
Summary Phone Line Statistics Report
MPSPhoneAcc.prd
Accumulated Summary Phone Line Statistics Report
SpanDetail.prd
Detail Span Statistics Report
SpanSum.prd
Summary Span Statistics Report
HostDetail.prd
Detail System Statistics Report
HostSum.prd
Summary System Statistics Report
The tables that follow summarize the contents of each of the previously mentioned
predefined reports.
The following tables also describe the system counters for statistical collection and
reporting for which individual columns can be mapped. These counters can be chosen
in the System Variables section of the Data Mapping window.
For additional information on Data Mapping, see the PeriDefiner section of this
manual.
PeriReporter’s User Guide P0988093
July 2010
29
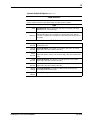
System Statistical Reports Sheet 1 of 3
SPAN REPORTS
Span statistics indicate span activity for digital T-1 systems in both summary and detail
format. Reports include the Span Detail Report and Span Summary Report.
Type
Detail
Summary
SpanDetail.prd: Data is reported for each span on selected or all Avaya
MPS Series, for a specified range.
SpanSum.prd: Data is collectively summarized for all spans, for selected or
all Avaya MPS Series, then reported for a specified date range. Data for
each unit is summarized on a single line. Totals reflect span activity inclusive
of all units.
Statistics
Busy
Seconds
System.SpanBusy: The number of seconds the span was in an inservice/busy state.
Errored
Seconds
System.SpanError: The number of seconds the span was in an errored
signal state. (The span could not take calls.)
Severe
Seconds
System.SpanSevere: The number of seconds the span was in an errored
signal state and the severity of the state was high. (The span could not take
calls.)
Failed
Seconds
System.SpanFailed: The number of seconds the span was in a failed
signal state. (The span could not take calls.)
Yellow
Seconds
System.SpanYellow: The number of seconds the span was in a yellow
signal state. (The span could not take calls.)
Max Bit
Change
Degraded
Minutes
PeriReporter’s User Guide P0988093
System.SpanMaxBit: The number of “MAX a and b” bit changes per
second that occurred on the span.
System.SpanDegraded: This variable is not implemented at this time.
July 2010
30
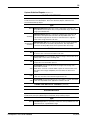
System Statistical Reports Sheet 2 of 3
PHONE LINE REPORTS
Phone line statistics indicate phone line usage in both a summary and detail format. Reports
include the Phone Line Detail Report, Phone Line Summary Report, and Phone Line
Accumulated Summary Report.
Type
Detail
Summary
Accumulated
Summary
MPSPhoneDetail.prd: Phone line usage is reported for selected or all
Avaya MPS Series and phone lines, for a specified date range. Totals reflect
usage per individual units.
MPSPhoneSum.prd: Data is collectively summarized for selected or all
phone lines, then reported for selected or all Avaya MPS Series, for a
specified date range. Data for each unit is summarized on a single line.
Totals reflect usage inclusive of all units.
MPSPhoneAcc.prd: Data is summarized per the time period specified by
the user collectively for selected or all phone lines, then reported for
selected or all Avaya MPS Series for the specified date–time range.
Statistics
MIS
System.MIS: Minutes In Service: The number of minutes the line was in an
in-service state—connected and able to take calls.
%U
System.Utilized: Percent Utilization: The percentage of time the line was in
a busy state—out of service or taking calls.
#CE
System.Calls: Number of Calls Ended: The total number of calls ended—
irrespective of the termination process.
ACS
System.ACS: Average Call Seconds: The length of the average call—
measured in seconds.
While this is correct for a column within a report, the actual counter stores
the data as the average multiplied by the total number of calls for that
period.
UAB
System.UAB: User Abandoned Calls: The number of user abandoned
calls—the user elects not to follow through with the call.
SAB
System.SAB: System Abandoned Calls: The number of system abandoned
calls—the Avaya MPS Series application terminates the call.
PHONE LINE REPORTS - Statistics (continued)
SYSTEM REPORTS
System Statistics indicate overall system activity in both summary and detail format. Reports
include the System (Host) Detail Report and System (Host) Summary Report.
Type
Detail
PeriReporter’s User Guide P0988093
HostDetail.prd: Data is reported for selected or all Avaya MPS Series and
external hosts for a specified date range.
July 2010
31
System Statistical Reports Sheet 3 of 3
Summary
HostSum.prd: Data is cumulatively summarized by external host for
selected or all Avaya MPS Series, then reported for a specified date range.
Data for each unit is summarized on a single line. Totals reflect system
activity inclusive of all units.
Statistics
Total Calls
All Busy
System.TotalCalls: The number of calls processed by selected or all Avaya
MPS Series.
System.AllBusy: The number of minutes that selected or all Avaya MPS
Series were all in an in-service/busy state and not available to take calls.
# Messages
to Host
System.MessagesTo: The detail report displays the number of messages
sent to each host and the summary report displays the cumulative number
of messages sent to all hosts per Avaya MPS Series.
# Messages
from Host
System.MessagesFrom: The detail report displays the number of
messages received from each host and the summary report displays the
cumulative number of messages received from all hosts per Avaya MPS
Series.
PeriReporter’s User Guide P0988093
July 2010
32
Application Statistics
Application-specific stat events are generated during an application’s execution cycle.
Application stat events must be defined within each application and identified as a stat
event to VSUPD (the process responsible for collecting application statistics data).
Application statistic reports may be defined to include system statistics data along
with application-specific statistics.
VSUPD is the ASE (Application Services Environment) process responsible for
collecting application-specific statistics. Application stat events are tracked by stat
event counters. One counter must be defined for each unique occurrence of a specified
event. On each node, counters are incremented as the corresponding events occur.
Application statistics are collected on a per Avaya MPS Series basis (if they have been
generated), by each node’s VSUPD process (if it is running). Each hour, data is
collected from each node and transferred to the statistics node, where it is stored in
binary files on a per Avaya MPS Series basis in the $ASEHOME/stats directory and
named appstats.
The VSUPD process must be running on each node where applications are executing
and statistics are to be collected. If VSUPD is not running, statistics will not be
collected.
Application-specific reports are created with the PeriDefiner component.
PeriReporter’s User Guide P0988093
July 2010
33
The Process of Defining Application Stat Events
Although the process of system statistics collection and reporting is transparent to the
user, the process of application statistics collection and reporting is user dependent.
Application stat events must be defined within each application and to the VSUPD
process (on the node where the applications will execute). Once application stat events
are defined, application statistics reports must be created, using PeriDefiner to first
define the reports and then PeriReporter to subsequently generate the statistical
information.
Application stat events are defined in PeriPro. The vexdump utility, with the -s
option, can be used to create .sre files and move them into $ASEHOME/copy.
These files can then be read by VSUPD.
Typically, the issues relating to application statistics are addressed during application
development.
•
The stat events that are to be collected must be defined within the application.
•
Once defined in the application, statistics will be generated during the
application’s execution cycle. Before application stat events can be collected, they
must be defined to the VSUPD process.
Application stat events are defined using the vexdump -s <appname>
command. A stat record code stub (.sre) file is created in the
$ASEHOME/copy directory. This .sre file must be manually copied to the
$ASEHOME/copy directory of all nodes where this application will be running.
•
Application statistics that have been completely defined will only be collected if
VSUPD is running on the node at which applications are executing and statistics
are to be collected. If VSUPD is not running, any application statistics that are
generated, will not be collected.
In a single node environment, all applications will be executing locally. In a multinode environment, some applications may be executing on the statistics node while
others may be on remote nodes. Each hour a collection script runs on the stats node
and transfers the appstats files to the statistics node’s $ASEHOME/stats
directory. These appstats files are stored on a per Avaya MPS Series basis.
PeriReporter’s User Guide P0988093
July 2010
34
The PeriProducer Application
Application statistics are collected and stored using stat record code stub (.sre) files.
Stat record code stub files must exist on each node at which application statistics are to
be collected.
•
Stat events are defined and stored in appstats files.
•
Stat record code stub files (e.g. strec#.sre) contain stat event definitions,
which are used by VSUPD during application statistics collection (regularly, at 15
minute intervals).
Example:
If multiple instances of the same application are to execute on different nodes in
the network, the stat record code stub files must be located on the statistics node as
well as at all other nodes running applications for which statistics are to be
collected.
The method by which stat record files are defined and code stub files are created is
dependent upon how the application itself was created as well as on the network
configuration.
Applications can be created with PeriProducer. PeriProducer is a graphical user
interface (GUI) tool used to create and validate applications.
The following information on enabling application statistics collection and reporting
is presented from the point of view of the type of development tool you are working
with (PeriProducer) and the network configuration (single or multi-node).
PeriProducer
Stat events are defined, in an application, as special data cards (called counters) within
a folder of scope statistics.
For additional information, see Gathering Application Statistics (Block Execution
Statistics) on page 35.
Vexdump
The vexdump utility, with the -s option, is used to, initially, add the definitions from
the Folder of Sevents to stat record files in appstats. This process both specifies the
stat record file(s) and creates the stat record code stub (.sre) files.
PeriReporter’s User Guide P0988093
July 2010
35
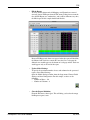
Gathering Application Statistics (Block Execution Statistics)
You can customize each application to record the number of times any single block is
executed during runtime.
Every 15 minutes, VSUPD broadcasts a statistics request to all executing applications
and collects available application statistics. This statistics collection daemon stores
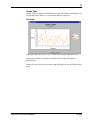
these statistics for future reference.
To use block execution statistics (application statistics), create one or more Statistics
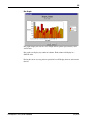
folders (Folders of Sevents) for the application and special statistics data cards (called
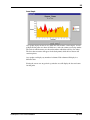
counters or stat events) for selected blocks. When PeriProducer executes the block
during runtime, it increments counters (stat events) associated with that block by one;
it does not re-initialize statistics folders when the application restarts. This allows
statistics to accumulate over many calls.
PeriProducer allows you to assign any legal name to Statistics folders.
If it is possible, use a single, unique statistics folder to gather the statistics from each
application. For example, gather all the statistics for application_1 in strec1
and all the statistics for application_2 in strec2.
PeriReporter’s User Guide P0988093
July 2010
36
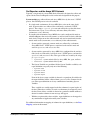
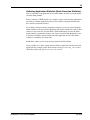
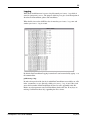
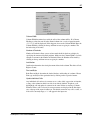
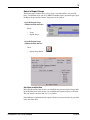
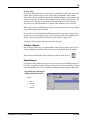
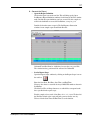
Defining Application (Block Execution) Statistics
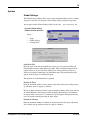
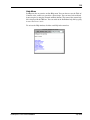
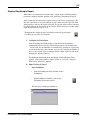
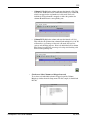
1. Create a Statistics folder (Folder of Sevents) for the application. From the Tool
Kit, select Folders.
To use the system wide
statistics collection utility,
assign any legal name to
the folder (e.g. name the
Statistics Folders strec1,
strec 2,...)
Select Statistics
Select Add
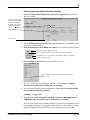
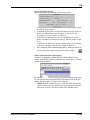
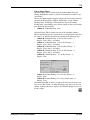
2. Access the Block menu for the block you want to reference. Click <MENU> on the
block in the construction area.
3. From the Block menu, click <MENU> on Counters. Select from the counter options:
Show the currently configured counters.
Create and attach a default counter to the selected statistics folder.
Select/Define a new counter. This counter must be numeric, length nine.
Detach an existing counter.
4. Save the folder to a file. Follow the menu path File—Save As.
Supply a descriptive name for the file. PeriProducer adds the
suffix .folder
5. To create a basic report in PeriReporter, copy the .folder file to a working
directory on each node where PeriReporter is executing.
6. To create a more detailed report in PeriReporter, create a stat record code stub file
by executing the following command:
vexdump -s app.vex
7. Copy the stat record code stub file (strec#.sre) from $ASEHOME/copy to
$ASEHOME/copy on each node where PeriReporter is executing.
You can create multiple statistics folders (folders of sevents) for each application. This
can be helpful, for instance, in an application that allows the caller to choose between
English and Spanish. The Spanish blocks can increment counters in one folder
PeriReporter’s User Guide P0988093
July 2010
37
(strec1), while the English blocks increment counters in another (strec2).
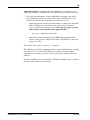
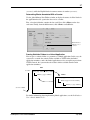
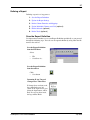
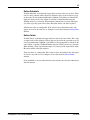
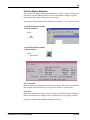
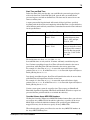
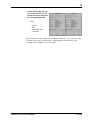
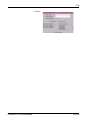
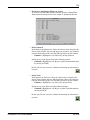
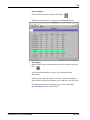
Determining Blocks Associated With a Counter
Use the global Manage Data Folders window to display the names of all the blocks in
the application that use a particular data card as a counter.
First, select the folder that contains the data card. Next, click <MENU> on the data
card name. Finally, from the hidden menu, click <MENU> on StatBlocks.
Block that uses
sRhost1_1 as a
counter
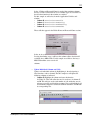
Passing Statistics Folders to a Linked Application
You can pass a statistics folder as a parameter to a linked application. In this case, the
system does not make the statistics folder available to VSUPD when the linked
application terminates, unless the linked application receives an explicit request from
VSUPD. Instead, the system makes the statistics folder available when the main
application terminates.
Main
execution
strec2 [type: statistics folder]
sRHost1_1 [type: number]
Linked
LPstats: [type: parameter folder]
LFstrec2: [type: lower-level folder]
sRHost1_1: [type: number]
strec2 is available
For further information about implementing linked applications, see the PeriProducer
User’s Guide (#9090752 (I)).
PeriReporter’s User Guide P0988093
July 2010
38
This page has been intentionally left blank.
PeriReporter’s User Guide P0988093
July 2010
PeriConsolidator
This chapter covers:
1. Purpose
2. Configuration
3. Command Line Options
40
Purpose
PeriConsolidator reads in the binary application statistics files created by VSUPD and
the binary system statistics files. These files are typically read in every evening and
consolidated based on the PeriConsolidator crontab setup.
These files have six possible consolidation levels:
• 15 minute
• hourly
• daily
• weekly
• monthly
• yearly
PeriConsolidator should be set up to run daily through crontab during off-peak
hours, when the Avaya Media Processing Server (Avaya MPS) Series system load is
light. Every day the weekly, monthly, and yearly files will be consolidated through the
current day.
Depending on the size of the Avaya MPS system, consolidation run-time will vary.
It is important to realize that there will be a level of detail lost each time a
consolidation is performed.
A file of each defined type may be produced each day.
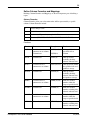
Setup
• Update $MPSHOME/common/etc/vpshosts to include all of the VASs
and Avaya Media Processing Servers. The following programs should be set
up in crontab upon installation.
Program
Frequency
Function
pr_app_v5.sh
hourly
collects application statistics
from all VASs
pr_sys_v5.sh
hourly
collects system statistics from all
Avaya MPS nodes
PeriConsolidator
nightly (at off-peak
time)
consolidates statistics to
specified level
At certain points in this manual, Avaya MPS Series (Avaya MPS) is analogous with
Voice Processing Series (VPS). This is reflected in specific file names and directories,
as well as certain software features.
PeriReporter’s User Guide P0988093
July 2010
41
Configuration
Stats File (“X” represents Avaya MPS number)
Content
appstats.X.MMDDYYHH
accstats.X.MMDDYYHH
sysstats.X.MMDDYYHH
15 minute data
Happstats.X.MMDDYYHH
Haccstats.X.MMDDYYHH
Hsysstats.X.MMDDYYHH
Hourly data consolidated by
hour
Dappstats.X.MMDDYYHH
Daccstats.X.MMDDYYHH
Dsysstats.X.MMDDYYHH
Daily data consolidated by
day
(midnight to midnight)
Wappstats.X.MMDDYYHH
Waccstats.X.MMDDYYHH
Wsysstats.X.MMDDYYHH
Weekly data consolidated by
day
(Sunday through Saturday)
Mappstats.X.MMDDYYHH
Maccstats.X.MMDDYYHH
Msysstats.X.MMDDYYHH
Monthly data consolidated by
day (First through last day of
month)
Yappstats.X.MMDDYYHH
Yaccstats.X.MMDDYYHH
Ysysstats.X.MMDDYYHH
Yearly data consolidated by
month
(January through December)
When collecting data from a local system, “X” need not be used. When data is to be
collected from a remote system, “X” is used as a parameter to identify that system.
Weekly data which is gathered mid-week will be consolidated up to that day. The next
time a consolidation is run for that month the new data will overwrite the existing data.
Monthly data which is gathered mid-month will be consolidated up to that date. The
next time a consolidation is run for that month the new data will overwrite the existing
data. Yearly data which is gathered mid-year will be consolidated up to that date. The
next time a consolidation is run for that year the new data will overwrite the existing
data.
You must wait for an ample amount of time for statistics to finish consolidating before
attempting to generate a report.
PeriReporter’s User Guide P0988093
July 2010
42
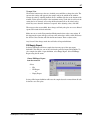
Data Maintenance
Data maintenance can be performed automatically and is governed by both the period
of time for which data is collected and the source from which data originated.
Parameters for Data Maintenance are set up in the .conspr file within your $HOME
directory.
For additional information on Data Maintenance, see Parameters.
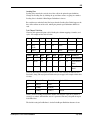
Data maintenance is defined in the following two tables.
Data Period
Data Maintenance
For a 24 hour period
Data is maintained in 15 minute increments.
Data is maintained in hourly increments.
Data is maintained in daily increments.
For a weekly period
Data is maintained in daily increments.
(Sunday - Saturday)
For a monthly period
Data is maintained in daily increments.
(1st day - last day of month)
For a yearly period
Data is maintained in monthly increments.
(Jan. - Dec.)
Data Source
Data Maintenance
System (Host) Statistics
Data is maintained on a per Avaya MPS basis. It is possible to
report System Statistics for each unit configured for the
network.
System Statistics report data related to phone line usage,
digital span activity, and host interaction.
Phone Line Statistics
Data is maintained on a per Phone Line basis. It is possible to
report System Phone Line Statistics for each phone line
assigned to each Avaya MPS in the network.
Span Statistics
Data is maintained on a per span basis. It is possible to report
System Span Statistics for each span assigned to each Avaya
MPS in the network. Span Statistics applies only to digital
phone line system configurations.
Application Statistics and all
User Defined Reports
PeriReporter’s User Guide P0988093
Data is maintained on a per Avaya MPS basis.
July 2010
43
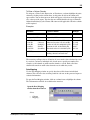
Parameters
PeriConsolidator allows you to set configurable parameters to automatically handle
file maintenance. These parameters are set up in the .conspr file. This will allow
specification of the number of days files are saved before they are automatically
deleted.
The .conspr file is located in the default PeriReporter home directory. To make
changes to this file, make a copy and place it in your $HOME directory. Make all
changes to the copied file, leaving the default file unchanged.
•
•
Leaving the default setting, True, at the maintainStats command line
will allow files to be maintained for a set number of days. These days can be
customized by the user or left to the defaults. If no specified number of days is
entered for a file type then the default takes precedence.
Entering False at the maintainStats command line will disable
maintenance of any files. PeriConsolidator will continue to collect data
without removing any of the old files. Files will continue to be created until
manually removed.
The default number of days for each file type to be saved:
15 minute - 2 days
Hourly - 5 days
Daily - 40 days
Weekly - 60 days
Monthly - 400 days
Yearly - 1800 days
PeriReporter’s User Guide P0988093
July 2010
44
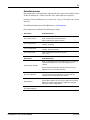
Logging
When PeriConsolidator runs it creates a log file named pericons.log which is
stored in $ASEHOME/stats. The purpose of this log is to give a brief description of
what data PeriConsolidator gathers and consolidates.
When the file size reaches 100K, the data is moved to pericons.log.BAK and
another pericons.log is created.
By default, PeriConsolidator Logging is turned on. It can be turned off by typing -n at
the command line.
pchistory.log
In order to keep track of the last day in which PeriConsolidator successfully ran, a file
in the $ASEHOME/stats directory, called pchistory.log, is used. After each
successful execution of PeriConsolidator, the date last ran is appended to this file.
Before any subsequent run starts, PeriConsolidator checks this date. If any days are
missing, it will run for those days, appending the file as it runs.
PeriReporter’s User Guide P0988093
July 2010
45
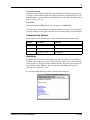
Command Line Options
Option
Function
PeriConsolidator
Run consolidation for previous day
PeriConsolidator -d MMDDCCYY
Run consolidation for specified date
PeriConsolidator -n
Turn off Logging
PeriConsolidator -s
Show .conspr file settings
PeriConsolidator -version
Show current Version running
PeriConsolidator -h
Show help message
If you re-run PeriConsolidator for any day using the -d option, the
pchistory.log file will be appended, causing other days to be re-run.
PeriReporter’s User Guide P0988093
July 2010
46
This page has been intentionally left blank.
PeriReporter’s User Guide P0988093
July 2010
PeriDefiner
This chapter covers:
1. Purpose
2. PeriDefiner Tool Bar
3. Open a Report Definition
4. Defining a Report
5. Options
48
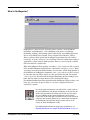
Purpose
PeriDefiner is a graphical utility which is used to set up the contents and the display of
a specific report. It allows you to map statistics variables to columns of data. Each
column can have its own heading in relation to the data to be displayed there.
For each column which is mapped to a variable, you can specify the allowable range
for the variable, sort the data in that column by ascending or descending order, and set
which columns take precedence over others.
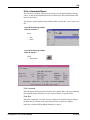
Launch PeriDefiner
You can choose to launch PeriDefiner in one of two ways - by typing PeriDefiner
at the command line, or through PeriReporter.
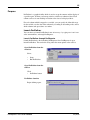
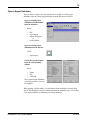
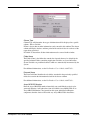
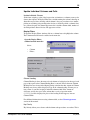
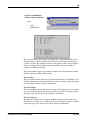
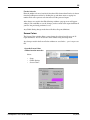
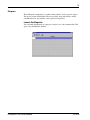
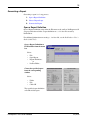
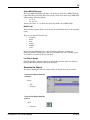
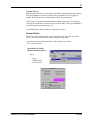
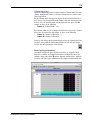
Launch PeriDefiner through PeriReporter
Launch PeriDefiner by first launching PeriReporter. Once PeriReporter is open,
launch PeriDefiner. You can do this using either the menu options or the tool bar.
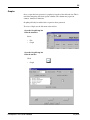
Open PeriDefiner from the
menu bar
Select:
•
•
Setup
Run PeriDefiner
Open PeriDefiner from the
tool bar
Click:
• PeriDefiner button
PeriDefiner launches
Begin defining report
PeriReporter’s User Guide P0988093
July 2010
49
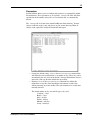
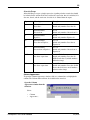
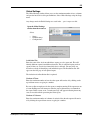
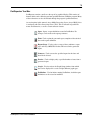
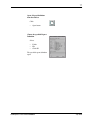
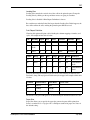
PeriDefiner Tool Bar
PeriDefiner contains a tool bar at the top of its graphical display. This consists of
buttons which can be clicked to perform specified functions within the program. Many
of these functions can also be initiated through the program’s pull-down menus.
At certain points in this manual, Avaya Media Processing Server (Avaya MPS) Series
is analogous with Voice Processing Series (VPS). This is reflected in specific file
names and directories, as well as certain software features.
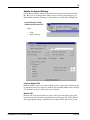
Open - Opens a previously created report, in which changes can then be
made.
Save - Used to save changes made to a new or previously created report.
Print - Used to print a filled report or report definition. This function will
list columns along with their headings, assigned Avaya MPS/VPS
numbers, etc. No true statistical data will appear in these printouts.
Cut - An editing tool used to remove a column or cell from the report and
place it in the clipboard for later use.
Copy - An editing tool used to reproduce an existing column or cell
which has been placed in the clipboard.
Paste - An editing tool used to move a cut or copied column or cell from
the clipboard and insert it preceding the current column.
Left Justify - Moves all text and numbers within a specified column to
the left-most side of the cells.
Center Justify - Moves all text and numbers within a specified
column to the center of the cells.
Right Justify - Moves all text and numbers within a specified
column to the right-most side of the cells.
Plain - Causes all text and numbers in a specified column or cell to
display with normal font.
Bold - Causes all text and numbers in a specified column or cell to
display with bold font.
Italics - Causes all text and numbers in a specified column or cell
to display with italicized font.
PeriReporter’s User Guide P0988093
July 2010
50
Open a Report Definition
You can choose to begin a new report definition or modify an existing report
definition. Open an existing report definition from the File menu or tool bar.
Open an existing report
definition or PeriPro folder
from the menu bar
Select:
•
•
•
•
File
Open Report
Report Definition...
or
PeriPro Folder...
Open an existing report
definition from the tool bar
Click:
•
Open button
Choose the specified report
from the corresponding
window
Select:
•
•
•
Folder
File
Click OK
The specified report definition
opens and parameters can now
be modified.
When opening a PeriPro folder, a pre-determined report definition is opened along
with it. This definition can then be changed through the following steps, as if creating
a new report definition, or modifying an existing definition.
PeriReporter’s User Guide P0988093
July 2010
51
Defining a Report
Defining a report is a 6 step process.
1. Save the Report Definition
2. Update the Report Settings
3. Define Column Formulas and Mappings
4. Update Individual Columns and Cells (optional)
5. Define Subtotals (optional)
6. Define Totals (optional)
Save the Report Definition
It is important to remember to save your Report Definition periodically as you proceed
through the following steps. You can save the report definition by using either the file
menu or the tool bar.
Save the Report Definition
from the File Menu
Select:
•
•
File
Save/Save As...
Save the Report Definition
from the tool bar
Click:
• Save button
Determine If Any Unsaved
Changes Have Taken Place
If changes have not been saved,
the symbol in the top, left
corner of the report screen, just
below the Open button, will be
Red. If a save has been made,
the logo will be Black.
PeriReporter’s User Guide P0988093
July 2010
52
Update the Report Settings
Use the Report Settings window to determine what your generated report will look
like. Here you can set Report Title, number of rows used for various purposes, the
Report Mode (Standard or Summary), the Detail Level, and the Start and End Time.
Open the Report Settings
window from the menu bar
Select:
•
•
Setup
Report Settings...
Lines for Report Title
Enter the number of lines to be made available to enter a report title by clicking on the
up and down arrows or by typing in a number. The maximum number of lines allowed
is 5. Each line can have a separate title or be left blank.
Report Title
Enter the title of the report which is to appear at the top of each printed page of the
report. If more than one line has been designated for the report title, choose OK and
then reopen Report Settings. Additional areas for Report Titles will now be present.
PeriReporter’s User Guide P0988093
July 2010
53
Column Heading Rows
Enter the number of rows to be made available to enter a column heading by clicking
on the up and down arrows or by typing in a number.
Rows per Page
Enter the number of rows to be displayed on each page of the report by clicking on the
up and down arrows or by typing in a number. Each row will typically represent one
time interval of the specified consolidation level. A report page will contain the
specified number of rows, ending in a Subtotal row. This will continue to the end of
the report where a Total row will then be displayed.
Rows for Subtotals
Enter the number of rows to be used to display subtotals at the bottom of each page of
the report by clicking on the up and down arrows or by typing in a number.
Rows for Totals
Enter the number of rows to be used to display totals at the end of the report by
clicking on the up and down arrows or by typing in a number.
Report Mode
Report mode is Standard or Summary.
Standard mode means that report data will be displayed by individual time periods in
chronological, or Key Priority, order. For example, a report set to consolidate for 15
minute intervals will display data in one row for each 15 minute period of the day.
Most reports will be in Standard mode.
Summary mode processes multiple days of data and totals them with corresponding
time periods from all included days. For example, a report set to consolidate in hourly
intervals in Summary mode will gather the data from each day and display the totals
from each hour in its corresponding row. This is useful if you would like to find out
the busiest time period of a given week, month or year.
Standard is the default mode.
Default Detail Level
Enter the type of report that will act as a default when opening this report definition.
Detail level can be overridden in PeriReporter.
Default Start/End Time
Enter the Start and End time, which will act as the default when this report definition
is opened, by typing the time in the boxes. Enter time in 24-hour military format.
Start and End time can be overridden in PeriReporter.
PeriReporter’s User Guide P0988093
July 2010
54
Define Column Formulas and Mappings
Defining Column Formulas and Mappings are the most important part of defining a
report.
Column Formulas
Column Formulas allow you to determine what will be represented by a specific
column. Column Formulas include:
v
Float or Integer value
l
Text label
=
Mathematical Expression (example- A2+B2)
@
Function (SUM, TOT, AVG, TAVG, MIN, TMIN, MAX, TMAX)
Functions
Function
Parameters
Example
Result
@SUM
2 cells that share a
common row or column;
Column letter
@SUM(A3,D3)
Adds up all data in
specified cells or
column
@TOT
Column letter
@TOT(A)
Adds up all data
excluding heading,
subtotal and total rows
@AVG
2 cells that share a
common row or column
@AVG(A3,D3)
Adds up all data within
the specified cells and
produces average
@TAVG
Column letter
@TAVG(A)
Adds up all data
excluding heading,
subtotal and total rows
and produces average
@MIN
2 cells that share a
common row or column
@MIN(A3,D3)
Finds the smallest
number within the
range of specified cells
@TMIN
Column letter
@TMIN(A)
Finds the smallest
number excluding title,
subtotal and total rows
@MAX
2 cells that share a
common row or column
@MAX(A3,D3)
Finds the largest
number within the
range of specified cells
@TMAX
Column letter
@TMAX(A)
Finds the largest
number excluding title,
subtotal and total rows
PeriReporter’s User Guide P0988093
@SUM(A)
July 2010
55
To Enter a Column Formula
To designate a Value, Label, Expression, or Function to a column, highlight the entire
column by clicking on the column letter. At this point all cells in the column will
appear white. You can then enter text which will appear as black text in the blue input
area at the top of the report. Type the character which identifies the type of Formula,
followed immediately by the contents. Hit return and all applicable cells in the column
will be updated.
Examples
Formula
Updated Column
v123
123
lAugust 20, 1997
August 20, 1997
=A2+B2+C2
=A2-B2
=A2*B2
=A2/B2
=A2%B2
Sum of cells A2, B2, and C2
Difference between cells A2 and B2
Product of cells A2 multiplied by B2
Quotient of cells A2 divided by B2
Remainder after A2 is divided by B2
(add)
(subtract)
(multiply)
(divide)
(modulus)
@TOT(A)
Example
15+4+6=25
23-14=9
17*3=51
42/6=7
20%3=2
The sum of column A, excluding
heading, subtotal, and total rows
When entering an Expression or a Function, if you want the value calculated on a row
by row basis, and not by individual cells, do not enter a specific row number. For
example, to add columns A and B enter the formula as =A+B. Each cell of that
column will sum the A and B values from the row in which they reside.
Data Mapping
Use the Data Mapping window to specify what data will be shown in individual
columns. This can be the date and time period for each row on the generated report or
statistical information.
To open the Data Mapping window, click on a column letter to highlight the column.
The Column menu will now be enabled on the menu bar.
Open the Data Mapping
window from the menu bar
Select:
•
•
Column
Mapping...
PeriReporter’s User Guide P0988093
July 2010
56
Column Type
Column Type will determine what type of information will be displayed in a specific
column - Date or Variable.
If Date is chosen than no other information can be entered in this window. The chosen
column will display the date and time period of the statistical data for each row of the
report being generated.
If Variable is chosen then all other information must be entered in this window.
Folder Name
The Folder Name is the folder that contains the datacard that may be desired for the
specified column. Folders containing Application Variables are created in PeriPro.
System Variables are predefined counters which are automatically incremented by the
system.
For additional information, see the PeriProducer User’s Guide (9090752(I)).
Datacard Name
The DataCard Name identifies the sub-folder, contained in the previously specified
folder, that contains the information desired for the chosen column.
For additional information, see the PeriProducer User’s Guide (9090752(I)).
Avaya MPS/VPS Number
Enter the Avaya MPS/VPS number from which you would like the statistics to be
generated. Entering 0 will gather data from all available Avaya MPSs/VPSs. If an
Avaya MPS/VPS number is designated for this report within the PeriReporter
component, then that choice will override any Avaya MPSs/VPSs chosen here.
PeriReporter’s User Guide P0988093
July 2010
57
Application Variables and System Variables
The Application Variables and System Variables include all currently available
variables on the system. Double clicking on an item will automatically fill in the data
in the Folder Name and Datacard Name sections of the window.
•
The available Application Variables are determined from the
$ASEHOME/copy directory. PeriDefiner reads in any files ending with
.sre.
•
The System Variables are predefined. Of the System Variables available, each
report definition can have only one of the following.
System.VPS
System.Line
System.Host
System.Span
If the report is based on one of the above variables then all variables for the
report definition will be collected from sysstats files. Counters for the rest
of the report definition can be any combination of remaining System
Variables.
These System Variables are usually mapped to the first column in place of the
date. When these variables are used, no column may be mapped to record the
date. If one of these reports is chosen for a particular column and Date is
chosen for another column, an error message will appear.
•
With the exception of a report based on one of the above System Variables,
report definitions can be mapped to any combination of Application and
System Variables.
PeriReporter’s User Guide P0988093
July 2010
58
Update Individual Columns and Cells
Update Individual Columns
Aside from assigning a value, label, expression, or function to a column you may also
choose other options. In Display Filters these include naming the column, choosing an
allowable range of data, choosing which column’s data gets precedence over another,
picking an ascending or descending order for data, or choosing to hide a column’s data
in a generated report. In Column Appearance these include column width, number of
decimal positions allowed in data and appearance of data.
Display Filters
To open the Display Filters window, click on a column letter to highlight the column.
The Column menu will now be enabled on the menu bar.
Open the Display Filters
window from the menu bar
Select:
•
•
Column
Filters...
Column Heading
Column Heading is where the name of each column, to be displayed at the top of each
page of the report in the Column Heading Row, is entered. If more than one Column
Heading Row was chosen in the Report Settings window then that amount of Column
Heading entry boxes will be displayed. Type in the column heading. You may use as
long a name as you like, keeping in mind the column width. If the amount of
characters exceeds the space of the column then a series of question marks
(??????????) will be displayed in place of the heading. If this happens, increase
Column Width.
For additional information on setting column width, see the Column Appearance
section of this manual.
Key Priority
Key Priority allows you to choose which columns take precedence over others. This is
PeriReporter’s User Guide P0988093
July 2010
59
accomplished by assigning a priority number to each column that is to be sorted.
Entering a zero will not assign the column to a Key Priority and it will be sorted
normally. Lower numbered Key Priorities will be given precedence over higher
numbered or zero Key Priorities. Each column must have a unique Key Priority, unless
it is entered as zero. Enter a Key Priority by clicking on the up and down arrows or
typing in a number.
Order
The Order field only has meaning if a non-zero Key Priority is chosen. This will
determine if the column’s data is to be sorted in an Ascending or Descending order.
Display
This function will allow a specified column to be hidden from view. Show is the
default setting for all columns. To prevent a column from appearing on a report click
Hide. This is useful if you would like to perform calculations in a column that you do
not want to display in a generated report. In PeriDefiner a hidden column will display
in black. Hidden columns will not appear at all in the PeriReporter component or in a
generated report.
PeriReporter’s User Guide P0988093
July 2010
60
Allowable Range
Allowable Range accepts a simple expression, signaling whether certain data should
be included in the column. If the data satisfies the expression, then it is included; if it
does not, then it, and the entire row it resides in, is omitted from the report.
Expression
Meaning
Example
<
Include numbers
Less than...
# < 10
Include only numbers Less than 10
>
Include numbers
Greater than...
# > 10
Include only numbers Greater than 10
=
Include numbers
Equal to...
# = 10
Include only numbers Equal to 10
<=
Include numbers
Less than or Equal to...
# <= 10
Include only numbers Less than or
Equal to 10
>=
Include numbers
Greater than or Equal to...
# >= 10
Include only numbers Greater than or
Equal to 10
AND
Combine two of
the above expressions
# < 10 AND #> 5
Include only numbers Less than 10
AND Greater than 5 (include numbers
within that range)
OR
Combine two of
the above expressions
# < 10 OR #> 20
Include only numbers Less than 10 OR
Greater than 20 (leave out all numbers
in between that range)
Column Appearance
To open the Column Appearance window, click on a column letter to highlight the
column. The Column menu will now be enabled on the menu bar.
Open the Column
Appearance window from the
menu bar
Select:
•
•
Column
Appearance...
PeriReporter’s User Guide P0988093
July 2010
61
Column Width
Column Width determines how wide the cells of the column will be. If a Column
Heading or value does not fit in the allotted column size a series of question marks
(??????????) will be displayed. If this happens, increase the Column Width. Enter the
Column Width by clicking on the up and down arrows or typing in a number. The
default setting is 103 units.
Number of Decimals
Number of Decimals allows you to set how much detail for the data to display by
specifying the amount of decimal positions. Make sure the Column Width is set wide
enough to account for the Number of Decimals. Enter the Number of Decimals by
clicking on the up and down arrows or typing in a number.
Justification
Justification determines the visual placement of data in the column. The choice is Left,
Right or Center.
Font and Style
Both Font and Style determine the look of the data and heading of a column. Choose
Font type and Style of that particular font by clicking on the respective buttons.
Update Individual Cells
Any individual cell can have its contents set to a value, label, expression, or function,
as long as the column in which it resides is not already defined. To update a cell,
highlight the cell and update its contents in the same fashion as entering a Column
Formula. When a cell is selected, its current contents are displayed in the blue input
area at the top of the report in white text. The default content of any cell is a value, so
if the cell is currently empty a “v” will appear in the input area.
PeriReporter’s User Guide P0988093
July 2010
62
Define Subtotals
To define Subtotals, scroll down the report until you come to the rows in green. These
cells are where subtotals will be displayed. Subtotals appear at the end of every page
of the report. To enter Subtotal information, highlight a cell defined as Subtotal and
update its contents in the same fashion as entering a Column Formula using the
@SUM(column letter) function. When defining a Subtotal the text in the blue input
area at the top of the report will be white. Hit return and the cell will be updated.
Subtotal row colors are configurable. If the color has been adjusted then they will
appear on screen as the color last set. Configure screen colors from the Screen Colors
window.
Define Totals
To define Totals, scroll down the report until you come to the rows in blue. These cells
are where totals will be displayed. Totals appear at the end of the generated report. To
enter Total information, highlight a cell defined as Total and update its contents in the
same fashion as entering a Column Formula using the @TOT(column letter) function.
When defining a Total, text in the blue input area at the top of the report will be white.
Hit return and the cell will be updated.
Total row colors are configurable. If the color has been adjusted then they will appear
on screen as the color last set. Configure screen colors from the Screen Colors
window.
If you would like a total or subtotal for the entire column, enter only the column letter
after the function.
PeriReporter’s User Guide P0988093
July 2010
63
Options
Column Mappings
The Column Mappings window allows you to view the parameters that have been set
to all columns at the same time. To open the Column Mappings window, use the menu
bar.
Open the Column Mappings
window from the menu bar
Select:
•
•
Setup
Column Mappings...
The report definition shown in the above example has column A mapped to a Date.
Column F is mapped to the SUM function. Columns G and H are mapped to calculate
mathematical expressions. The remaining columns are mapped to variables and are set
to record Application Statistics. All columns are mapped to record data from all
available Avaya MPSs/VPSs. No editing can be done in the Column Mappings
window.
Column Filters
The Column Filters window allows you to view the filters assigned to all columns with
an Allowable Range and/or Key Priority and to see if the columns are to be Shown or
Hidden, at the same time. To open the Column Filters window use the menu bar.
PeriReporter’s User Guide P0988093
July 2010
64
Open the Column Filters
window using the menu bar
Select:
•
•
SetUp
Column Filters...
The report definition shown in the above example has columns B, D and G set to an
Allowable Range. All other columns will gather all data from their assigned places
regardless of value. The window also shows which columns will be sorted to display
data in Ascending and Descending order along with Key Priority and whether a
column is to be Hidden or Shown.
The top sub-window displays the columns in column order. The bottom sub-window
displays columns according to Key Priority.
Clear All Keys
The Clear All Keys button will remove all current Key Priorities. If no columns are set
with Key Priorities then the button will not be enabled. A window prompt will appear
after choosing this option asking for confirmation.
Clear All Ranges
The Clear All Ranges button will remove all current Allowable Ranges. If no columns
are set for Allowable Ranges then the button will not be enabled. A window prompt
will appear after choosing this option asking for confirmation.
Show All Columns
The Show All Columns button will make all Hidden columns visible in the report
definition. If no columns are set to Hide then the button will not be enabled. A window
prompt will appear after choosing this option asking for confirmation.
PeriReporter’s User Guide P0988093
July 2010
65
Global Settings
The Global Settings window allows you to set the maximum number of rows, columns
and preview intervals for all report definitions. Select Global Settings using the Setup
menu.
Any changes made in Global Settings are saved in the .perireporter file.
Open the Global Settings
window from the menu bar
Select:
•
•
•
Setup
Global Settings
Configuration...
Installation Site
Enter the name of the site from which these reports are to be generated. This will
identify different reports from different locations. This is useful in keeping track of
reports if there are several sites from which data is collected. You may enter any
desired text to help in identifying each individual report. The Installation Site will
appear on the first page of each printed report.
The inclusion of an Installation Site is optional.
Number of Rows
Enter the maximum number of rows that the report will consist of by clicking on the
up and down arrows or typing in a number.
Be sure to allow enough rows for the report to complete running. If the report runs out
of room PeriReporter will attempt to make the proper adjustments to accommodate
the report. If this can not occur, a warning message will appear indicating how many
rows are needed to finish generating the entire report.
Number of Columns
Enter the maximum number of columns of statistical data that the report will consist
of by clicking the up and down arrows or typing in a number.
PeriReporter’s User Guide P0988093
July 2010
66
Preview Intervals
Enter the number of rows of statistical data that will be shown when Preview is chosen
from the PeriReporter tool bar by clicking the up and down arrows or typing in a
number. Each row represents one time interval of the generated report.
After changes are made in the Global Settings window a pop-up screen will appear
asking if you would like to save the changes you have made to this report definition if
you have not previously performed a save.
Any Global Setting changes made here will affect all report definitions.
Screen Colors
The Screen Colors window allows you to change the color of specific areas of all
report definitions. Access the Screen Colors window using the Setup menu.
Any changes made in the Screen Colors window are saved in the .perireporter
file.
Open the Screen Colors
window from the menu bar
Select:
•
•
•
Setup
Global Settings
Screen Colors...
PeriReporter’s User Guide P0988093
July 2010
67
Change Color
Click on the button next to the area of which you would like to change the color. The
current color setting will appear in the sample cube in the middle of the window.
Change the color by adjusting the Red, Green, and Blue slide bars at the bottom of the
window. To the right of each bar is the maximum setting. To the left of each bar is the
setting the bar is currently at. Pressing the Reset button will set all colors back to
where they were when the window was opened. After adjusting colors, click OK.
When report colors are modified, these changes will only take place on-screen. Printed
reports will remain in black and white.
Make sure not to set the Foreground and Background colors to the same settings. If
this happens the report will appear all one color and no data will be visible. Return to
the Screen Colors window and click the Restore button. Then re-adjust colors.
Any Screen Color changes made here will affect all report definitions.
Fill/Empty Report
Selecting Fill Report will insert sample data into one page of the open report
definition. This will give you an idea of what the generated report will look like. To
clear sample data from a report definition, select Empty Report. Select Fill/Empty
Report using the file menu.
Choose Fill/Empty Report
from the menu bar
Select:
•
•
•
File
Fill Report
or
Empty Report
Saving a filled report definition will cause the sample data to be removed from all cells
before the save takes place.
PeriReporter’s User Guide P0988093
July 2010
68
Print the Report Definition
You can choose to print the filled report definition to see what a generated report will
look like or print the definition itself to see how each column is mapped. Open the
Print Setup window from the File menu or the tool bar.
Any changes made in the Print Setup window are saved in the .perireporter file.
Open the Print Setup window
from the menu bar
Select:
•
•
File
Print...
Open the Print Setup window
from the tool bar
Click:
• Print button
Print Command
Enter the printer destination of the document to be printed. This is the same command
that would be entered elsewhere on your system to allocate a specific printer.
Point Size
Point Size controls the size of the data to be displayed in the printed report definition.
Change the Point Size by clicking on the up and down arrows or typing in a number.
Point Size is disabled if Print Report Definition is chosen.
PeriReporter’s User Guide P0988093
July 2010
69
Leading Size
Leading Size controls the vertical size of the cells in the printed report definition.
Change the Leading Size by clicking the up and down arrows or typing in a number.
Leading Size is disabled if Print Report Definition is chosen.
Be careful not to make the Point Size larger than the Leading Size. If this happens, the
data will overflow out of the cells, making the printed report definition difficult to
read.
Print Report Definition
Choosing this option will print a table labeling the column mappings, formulas, and
styles. An example of this table is below.
Col.
Heading
Mps#
Date
A
Date
0
T
B
# of
Calls
0
F
C
Total
0
F
Order
Range
A
B
#>20
C
Folder
Variable
Formula
Key
0
Test
Calls
0
Total
SUM(B,G)
0
Show
Dec.
Align
Height
Width
FontStyle
true
0
C
33
131
TimesRoman
true
0
C
33
103
TimesRoman
Italic
true
0
C
33
103
TimesRoman
Bold
Choosing Print Report Definition will also create a table labeling the Subtotal and
Total rows, along with any Special Cells that may be mapped. An example of this table
is below.
Column:
Subtotals Rows:
Totals Rows:
A
Subtotal
Total
B
SUM(B)
TOT(B)
C
SUM(C)
TOT(C)
Special Cells:
B4+C6
Turning off the Print Report Definition button will allow the report to be printed so
you may see what it will look like once it is generated. You may also print the report
with Filled data.
The default setting in PeriDefiner is for the Print Report Definition button to be on.
PeriReporter’s User Guide P0988093
July 2010
70
Paper Size
Page Size allows you to choose the paper the report definition will be printed on.
Letter is standard 8 1/2 x 11 paper. A4 is a European paper size standard. Letter is the
default setting.
Page Orientation
Page Orientation allows you to choose how the report definition will be displayed on
the paper. Portrait will print the report definition vertically. Landscape will print the
report definition horizontally. Landscape will also allow more columns to be displayed
across the page. Landscape is the default setting.
Page Orientation is disabled if Print Report Definition is chosen.
Print Scope
Print Scope will allow you to choose between printing one entire page of a Filled
report or only what is displayed on the monitor. Entire is the default setting.
Entire will only print one page of the report in PeriDefiner, as opposed to the fully
generated report in the PeriReporter component. This is simply to give an example of
what a generated report may look like.
Print Scope is disabled if Print Report Definition is chosen.
Grid Lines
Grid Lines allows you to choose how to show the cell divisions on the printed report
definition. The lines can either be Solid or Dashed. You can also choose to have no
visible lines by clicking off both options. No lines is the default setting.
Page Layout
• Full Size
Clicking the Full Size button will print the report with the number of Rows
per Page specified in the Report Settings window.
• Fit To Page
Clicking the Fit To Page button will fit as many rows vertically and as many
columns horizontally on the page as possible, before starting a new page.
• Horizontal Adjustment
Clicking the Horizontal Adjustment button will force the report to either
spread the columns out or condense the column width in order to fit all of the
columns onto the width of the page. If the report consists of many columns,
choosing this option may make the generated report difficult to read as it will
be minimized to fit onto the page width.
Full Size is the default setting.
Page Layout is disabled if Print Report Definition is chosen.
PeriReporter’s User Guide P0988093
July 2010
71
Print and Postscript
Clicking on the Print button will print the report definition according to the parameters
you have set in the Print Setup window. Clicking on the Postscript button will save the
print definition to a postscript file, but will not print the report. This file will be named
Reportname.prd.ps.
Print HTML
Clicking on the Print HTML button saves the report to an HTML file.
If you change the report definition, and would still like to save this version, remember
to change the name of the report or else this one will overwrite the previous definition.
Command Line Options
These options can be specified when starting PeriDefiner from the command line.
Option
Parameter
Function
-h
Show Help
-version
Show version of PeriDefiner running
report[.prd]
Load Report
Help Menu
PeriDefiner has an extensive on-line Help menu. You can choose to use the Table of
Contents or the scroll bars to search for a desired topic. You can move back and forth
between topics by using the Forward and Back buttons. The name of the current help
file is displayed in the URL box. You can switch to the PeriReporter help file by
typing in PeriReporter.html.
To activate the Help window, click the word Help in the menu bar.
PeriReporter’s User Guide P0988093
July 2010
72
This page has been intentionally left blank.
PeriReporter’s User Guide P0988093
July 2010
PeriReporter
This chapter covers:
1. Purpose
2. PeriReporter Tool Bar
3. Generating a Report
4. Web-Based Reports
5. Graphs
6. Options
74
Purpose
The PeriReporter component is a graphical utility which is used to generate reports.
The report (created in PeriDefiner) must be specified, along with the date and the
consolidation level, after which it can be generated and printed.
Launch PeriReporter
You can launch PeriReporter by typing PeriReporter at the command line. This
opens a new PeriReporter window.
PeriReporter’s User Guide P0988093
July 2010
75
PeriReporter Tool Bar
PeriReporter contains a tool bar at the top of its graphical display. This consists of
buttons which can be clicked to perform specified functions within the program. Many
of these functions can also be initiated through the program’s pull-down menus.
At certain points in this manual, Avaya Media Processing Server (Avaya MPS) Series
is analogous with Voice Processing Series (VPS). This is reflected in specific file
names and directories, as well as certain software features.
Open - Opens a report definition created in PeriDefiner. No
changes can be made to the report parameters.
Print - Used to print the generated report, complete with statistical
data or the report definition.
Report Scope - Used to select a range of dates and times, report
type, and Avaya MPS/VPS #s that will be used in the generated
report.
Generate - Used to create the specified report for the dates and
detail level selected.
Preview - Used to display only a specified number of rows from a
generated report.
Graph - Used to activate the Graph Setup window, from which
data can be displayed in a series of eight different graph types.
PeriDefiner - Used to initiate running PeriDefiner, in which report
definitions can be created or modified.
PeriReporter’s User Guide P0988093
July 2010
76
Generating a Report
Generating a report is a 3 step process.
1. Open a Report Definition
2. Select a Report Scope
3. Generate the Report
Open a Report Definition
Open a Report Definition using either the File menu or the tool bar. PeriReporter will
accept specification of either a report definition or a .folder file created by
PeriProducer.
For additional information on creating a .folder file, see the PeriProducer User’s
Guide (9090752(I)).
Open a Report Definition or
PeriPro folder from the menu
bar.
Select:
•
•
•
•
File
Open Report
Report Definition...
or
PeriPro Folder...
Choose the specified report
from the corresponding
window
Select:
•
•
•
Folder
File
Click OK
The specified report definition
or PeriPro folder opens
PeriReporter’s User Guide P0988093
July 2010
77
Open a Report Definition
from the tool bar
Click:
•
Open button
Choose the specified Report
Definition
Select:
•
•
•
Folder
File
Click OK
The specified report definition
opens
PeriReporter’s User Guide P0988093
July 2010
78
Select a Report Scope
The Report Scope window allows you to select a start and end date, start and end
times, consolidation level, and Avaya MPS/VPS number for the specified report. Open
the Report Scope window from the Setup menu or the tool bar.
Open the Report Scope
window from the menu bar
Select:
•
•
Setup
Report Scope...
Open the Report Scope
window from the tool bar
Click:
•
Report Scope button
Start Date and End Date
In the Start Date field, enter the date you would like the generated report to begin with.
In the End Date field, enter the date you would like the generated report to end with.
The date must be entered in MM/DD/CCYY format.
If the End Date is left blank then the report will only be generated for the day specified
in the Start Date field.
PeriReporter’s User Guide P0988093
July 2010
79
Start Time and End Time
In the Start Time field, enter the time you would like the generated report to begin
with on the Start Date. In the End Time field, enter the time you would like the
generated report to end with on the End Date. The time must be entered in HH:MM
format as military time.
A report generated in Standard mode will contain all data for all dates specified,
beginning with the Start Time and completing with the End Time. A report defined to
run in Summary mode will only contain data accumulated between the hours indicated
for the specified dates.
Report Mode
Start/End Date/Time
Generated Report Data
Standard
01/05/1997 - 02/10/1997
08:00 - 17:00
All statistical data
gathered between 8am,
Jan. 5, 1997 and 5pm,
Feb. 10, 1997.
Summary
01/05/1997 - 02/10/1997
08:00 - 17:00
Statistical data gathered
between the hours of 8am
and 5pm will be summed
for each like time period,
from Jan. 5, 1997 to Feb.
10, 1997.
The default times are: Start - 00:00 / End - 23:59.
Start and End times are only used for 15 minute and hourly consolidated reports.
In a 15 minute consolidated report, Start Time will round backward to the nearest
quarter hour, while End Time will round forward to the nearest quarter hour.
For example, if a Start Time of 02:17 is entered the report will adjust to begin
gathering data at 02:15. If an End Time of 05:23 is entered the report will adjust to
finish gathering data at 05:29.
In an hourly consolidated report, Start Time will round backward to the nearest hour,
while End Time will round forward to the nearest hour.
For example, if a Start Time of 02:17 is entered the report will adjust to begin
gathering data at 02:00. If an End Time of 05:23 is entered the report will adjust to
finish gathering data at 05:59.
Certain system reports cannot be scoped by time. These reports are PhoneDetail,
PhoneSum, SpanDetail, SpanSum, HostDetail and HostSum. When these reports are
generated the time period should be set to include the entire day.
Override Column Avaya MPS/VPS Numbers
Clicking the Override Column Avaya MPS/VPS Numbers button allows you to choose
one or more Avaya MPSs/VPSs from which to gather data, regardless of the Avaya
MPSs/VPSs to which the individual columns of the specified report definition are
mapped. Zero may also be chosen to specify all Avaya MPSs/VPSs.
When choosing this option, you will need to enter the Avaya MPS/VPS numbers in
the Avaya MPS/VPS Range box.
PeriReporter’s User Guide P0988093
July 2010
80
Avaya MPS/VPS Range
The Avaya MPS/VPS Range box allows you to choose which Avaya MPSs/VPSs the
report will collect data from. In this box you may enter one or more Avaya MPS/VPS
numbers in the following fashions.
• 1, 2, 4, 6, ...
• 1-4, 6, 8-10, ...
You may also enter “0” to collect data from all available Avaya MPSs/VPSs.
Detail Level
The Detail Level option allows you to choose the consolidation level for the specified
report.
There are six different Detail Levels:
• 15-minute
• hourly
• daily
• weekly
• monthly
• yearly
Reports run for all Detail Levels, except 15-minute, will not be available for
generation until the following day, after PeriConsolidator has run. 15-minute reports
are available every hour for the previous hour.
List Files in Range
Click the List Files in Range button to see which files meet the criteria for the Start
Date and End Date you have selected for this report.
Generate the Report
To Generate the Report with true statistical data, use the file menu or the tool bar.
Generate the Report from the
menu bar
Select:
•
•
File
Generate
Generate the Report from the
tool bar
Click:
•
Generate
PeriReporter’s User Guide P0988093
July 2010
81
Web-Based Reports
You can use the PeriReporter tool to generate web-based reports.
If your workstation runs the Apache server (PERIdist), you can launch a web browser
window and type either “localhost” or the host name of the machine into the URL and
get to the main web page. This page that has links to PeriView, PeriReporter, and
Avaya MPS-related documentation. Click on “PeriReporter” to access the web reports
utility.
Within Perireporter, use the pull-down menus to select the following parameters:
Report
Select the kind of report that you need to generate from the pull-down menu. There are
seven kinds of reports:
•
•
•
•
•
•
•
Host Detail
Host Summary
Phone Accumulated
Phone Detail
Phone Summary
Span Detail
Span Summary
PeriReporter’s User Guide P0988093
July 2010
82
Start Date and End Date
Use the Start Date field to specify the date when you want the report to begin. Enter a
date on which you want the report to end, using the End Date field. The standard date
format is mm/dd/ccyy.
If the End Date is left blank, then the report is only be generated for the day specified
in the Start Date field.
Start Time and End Time
In the Start Time field, enter the time you would like the generated report to begin
with on the Start Date. In the End Time field, enter the time you would like the
generated report to end with on the End Date. The time must be entered in HH:MM
format as military time.
The default times are: Start - 00:00 / End - 23:59.
Start and End times are only used for 15 minute and hourly consolidated reports.
In a 15 minute consolidated report, Start Time will round backward to the nearest
quarter hour, while End Time will round forward to the nearest quarter hour.
For example, if a Start Time of 02:17 is entered the report will adjust to begin
gathering data at 02:15. If an End Time of 05:23 is entered the report will adjust to
finish gathering data at 05:29.
In an hourly consolidated report, Start Time will round backward to the nearest hour,
while End Time will round forward to the nearest hour.
For example, if a Start Time of 02:17 is entered the report will adjust to begin
gathering data at 02:00. If an End Time of 05:23 is entered the report will adjust to
finish gathering data at 05:59.
Detail Level
This option allows you to choose the consolidation level for the specified report.
There are six different detail levels:
•
•
•
•
•
•
15-minute
hourly
daily
weekly
monthly
yearly
Reports for all detail levels, except the 15-minute, cannot be generated till the
following day, after PeriConsolidator has run. 15-minute reports are available every
hour for the previous hour.
Avaya MPS Override
Enter a numerical value in the Avaya MPS Override field to indicate a specific Avaya
PeriReporter’s User Guide P0988093
July 2010
83
Avaya MPS (or a set of Avaya MPSs) for each column. If you use this field, it will
override all the settings in the report definition.
The resulting page shows a consolidated report for the selected parameters.
Click on the links in the top portion of the browser window to view specific sections of
the report. Click on the Generate Another Report link to go back and create a
different report.
PeriReporter’s User Guide P0988093
July 2010
84
Web-based reporting follows the same rules followed when generating a standard
report. For additional information, see Generating a Report on page 76.
You can also insert user created application reports. The below steps need to be
followed:
•
Use the PeriDefiner tool to create a .prd file.
•
Update the reportlist.pl file located in the
$VPSHOME/PERIdist/dist-bin directory. Insert your visible name and
report location inside the parentheses. This is what the file looks like:
%reportlist'report_list =
(
"Phone Detail" =>
"$ENV{VPSHOME}/PERIprpt/reports/MPSPhoneDetail.prd",
"Phone Summary" =>
"$ENV{VPSHOME}/PERIprpt/reports/MPSPhoneSum.prd",
"Phone Accumulated"=>
"$ENV{VPSHOME}/PERIprpt/reports/MPSPhoneAcc.prd",
"Host Detail" =>
"$ENV{VPSHOME}/PERIprpt/reports/HostDetail.prd",
"Host Summary" => "$ENV{VPSHOME}/PERIprpt/reports/HostSum.prd",
"Span Detail" =>
PeriReporter’s User Guide P0988093
July 2010
85
"$ENV{VPSHOME}/PERIprpt/reports/SpanDetail.prd",
"Span Summary" => "$ENV{VPSHOME}/PERIprpt/reports/SpanSum.prd",
);
For example, if a report called MyFirstReport.prd is to be added to the reports
directory, the result would look like this:
%reportlist'report_list =
(
"Phone Detail" =>
"$ENV{VPSHOME}/PERIprpt/reports/MPSPhoneDetail.prd",
"Phone Summary" =>
"$ENV{VPSHOME}/PERIprpt/reports/MPSPhoneSum.prd",
"Phone Accumulated"=>
"$ENV{VPSHOME}/PERIprpt/reports/MPSPhoneAcc.prd",
"Host Detail" =>
"$ENV{VPSHOME}/PERIprpt/reports/HostDetail.prd",
"Host Summary" => "$ENV{VPSHOME}/PERIprpt/reports/HostSum.prd",
"Span Detail" =>
"$ENV{VPSHOME}/PERIprpt/reports/SpanDetail.prd",
"Span Summary" => "$ENV{VPSHOME}/PERIprpt/reports/SpanSum.prd",
"My First Report" =>
"$ENV{VPSHOME}/PERIprpt/reports/MyFirstReport.prd",
);
The utility is available only for the Avaya MPS and requires PERIdist, PERIprpt and
PatchBundle 8 to be installed.
PeriReporter’s User Guide P0988093
July 2010
86
Graphs
Once a report has been generated, a graph may be made of the collected data. This is
useful for comparing data from separate columns. The columns may represent
counters, formulas or functions.
Graphing will only be enabled after a report has been generated.
To create a Graph, use the file menu or the tool bar.
Open the Graph Setup box
from the menu bar
Select:
•
•
File
Graph
Open the Graph Setup box
from the tool bar
Click:
•
Graph
PeriReporter’s User Guide P0988093
July 2010
87
Graph Type
Choose the type of graph you would like to have your data displayed in through use of
the pull-down menu. There are a total of eight different graph types.
Plot Graph
Plot graphs display the data in a series of high and low points connected by lines.
Plot graphs can display any number of columns. Each column will display in a
different color.
Placing the cursor over any point on the graph will display the date and count for that
point.
PeriReporter’s User Guide P0988093
July 2010
88
Bar Graph
Bar graphs display the data in a series of high and low points represented by solid
vertical bars.
Bar graphs can display any number of columns. Each column will display in a
different color.
Placing the cursor over any point on a particular bar will display the date and count for
that bar.
PeriReporter’s User Guide P0988093
July 2010
89
Area Graph
Area graphs display the data in very much the same manner as Plot Graphs. A series
of high and low points are shown as filled areas, with each counter overlaying another.
The order in which counters are chosen determines which data will lay over others.
The first chosen counter will appear in the background, while the last chosen will
remain up front.
Area graphs can display any number of columns. Each column will display in a
different color.
Placing the cursor over any point in a particular area will display the date and count
for that point.
PeriReporter’s User Guide P0988093
July 2010
90
Candle Graph
Candle graphs display the data in a series of opening, closing, high and low points
represented by vertical bars and lines. The bar depicts an opening and closing number
for a time period. A solid bar denotes a rising number, while an empty bar denotes a
falling number. The line depicts a high and low for that period.
Candle graphs are helpful when tracking financial information, such as stock prices,
for a specific time period. The following example shows how a Candle graph would
represent this.
High during period
Opening number
This graph
denotes a falling
number
Closing number
Low during period
Candle graphs must be set to display a series of four separate columns. Any number of
columns above four, must be divisible by four. (8, 12, 16...)
Placing the cursor over any point on a particular line will display the date and count
for that point.
PeriReporter’s User Guide P0988093
July 2010
91
Hilo Graph
Hilo graphs display the data in a similar way to Candle graphs, with a series of vertical
lines. The high and low points of the data are represented by the top and bottom points
of the lines.
Hilo graphs must be set to display a series of two separate columns. Any number of
columns above two, must be divisible by two. (4, 6, 8...)
Placing the cursor over any point on a particular line will display the date and count
for that point.
PeriReporter’s User Guide P0988093
July 2010
92
Pie Graph
Pie graphs display the data as individual sections of a circle, or slices of a pie. 15
Minute, Hourly, Weekly, Monthly, and Yearly reports will have data displayed in a
series of graphs, each representing a different time period. Daily reports will have data
displayed as a single graph, representing the entire time period.
An example of a Pie graph based on a Daily report is shown below.
Pie graphs must display a minimum of two columns. Each column will display in a
different color.
Placing the cursor over any section on a particular pie will display the date and count
for that section.
PeriReporter’s User Guide P0988093
July 2010
93
Scatter Graph
Scatter graphs display the data in a similar way to Plot graphs, with the exception that
there are no lines connecting the individual points.
Scatter graphs can display any number of columns. Each column will display in a
different color.
Placing the cursor over any point in the graph will display the date and count for that
point.
PeriReporter’s User Guide P0988093
July 2010
94
Stacking Graph
Stacking graphs display the data in a similar way to Bar Graphs, with the exception
that the vertical bars are placed on top of one another.
Stacking graphs can display any number of columns. Each column will display in a
different color.
Placing the cursor over any point on a particular bar will display the date and count for
that bar.
PeriReporter’s User Guide P0988093
July 2010
95
Grid Lines
Grid Lines allows you to choose how to show the grid lines on the specified graph.
You can also choose to have either solid grid lines or no grid lines displayed.
Columns Available
The Columns Available field shows which columns are able to be chosen for the
specified graph. These will generally be the columns for which data has been collected
or formula columns for the generated report.
Add
To add a column to be graphed, click on the column letter within the box and then
click ADD.
Titles Available
Titles available indicates the titles of a highlighted column. These are the titles which
can be used to identify the column within the graph. The titles listed in the Titles
Available menu will be names given to the columns in the Report Settings window,
located in PeriDefiner.
If only one Line For Report Title was specified in the Report Settings window then
there will only be one title listed.
If more than one Line For Report Title was specified in the Report Settings window,
then a choice of titles, one from each Title Line plus one combining all titles, will be
available.
Selected Columns
Columns selected to be included in the graph will be displayed in this box.
Change
To change the title of a selected column, choose the specified column to highlight it,
choose the desired title in the Titles Available pull down menu and then click
CHANGE.
Delete
You may choose to remove a column that has been selected by clicking on the
specified column to highlight it, and then clicking DELETE.
Graph
Click the GRAPH button when you are ready to view the graph.
PeriReporter’s User Guide P0988093
July 2010
96
Options
Global Settings
The Global Settings window allows you to set the maximum number of rows, columns
and preview intervals for all reports. Select Global Settings using the Setup menu.
Any changes made in Global Settings will be saved in the .perireporter file.
Open the Global Settings
window from the menu bar
Select:
•
•
•
Setup
Global Settings
Configuration...
Installation Site
Enter the name of the site from which these reports are to be generated. This will
identify different reports from different locations. This is useful in keeping track of
reports if there are several sites from which data is collected. You may enter any
desired text to help in identifying each individual report. The Installation Site will
appear on the first page of each printed report.
The inclusion of an Installation Site is optional.
Number of Rows
Enter the maximum number of rows that the report will consist of by clicking on the
up and down arrows or typing in a number.
Be sure to allow enough rows for the report to complete running. If the report runs out
of room PeriReporter will attempt to make the proper adjustments to accommodate
the report. If this can not occur, a warning message will appear indicating how many
rows are needed to finish generating the entire report.
Number of Columns
Enter the maximum number of columns of statistical data that the report will consist
of by clicking the up and down arrows or typing in a number.
PeriReporter’s User Guide P0988093
July 2010
97
Preview Intervals
Enter the number of rows of statistical data that will be shown when Preview is chosen
from the PeriReporter tool bar by clicking the up and down arrows or typing in a
number. Each row represents one time interval of the generated report.
After changes are made in the Global Settings window a pop-up screen will appear
asking if you would like to save the changes you have made to this report definition if
you have not previously performed a save.
Any Global Setting changes made here will affect all reports.
Screen Colors
The Screen Colors window allows you to change the color of specific areas of all
reports. Access the Screen Colors window using the Setup menu.
Any changes made in the Screen Colors window will be saved in the
.perireporter file.
Open the Screen Colors
window from the menu bar
Select:
•
•
•
Setup
Global Settings
Screen Colors...
PeriReporter’s User Guide P0988093
July 2010
98
Change Color
Click on the button next to the area of which you would like to change the color. The
current color setting will appear in the sample cube in the middle of the window.
Change the color by adjusting the Red, Green, and Blue slide bars at the bottom of the
window. To the right of each bar is the maximum setting. To the left of each bar is the
setting the bar is currently at. Pressing the Reset button will set all colors back to
where they were when the window was opened. After adjusting colors, click OK.
When report colors are modified, these changes will only take place on-screen. Printed
reports will remain in black and white.
Be sure not to set the Foreground and Background colors to the same settings. If this
happens the report will appear all one color and no data will be visible. Return to the
Screen Colors window and click the Restore button. Then re-adjust colors.
Any Screen Color changes made here will affect all reports.
Preview a Report
Choose Preview when only a specified number of time intervals of the report are to be
viewed. Configure the number of Preview intervals in the Global Settings window.
Select Preview from the File menu or the Preview button on the tool bar.
Export/Import
Using Export will reformat the report and create a tab separated ASCII file which can
be read by a spreadsheet program. Import can be used to reload a previously exported
report into PeriReporter. Access the Export and Import functions from the File menu.
Open the Export and Import
windows from the menu bar
Select:
•
•
•
File
Export
or
Import
PeriReporter’s User Guide P0988093
July 2010
99
Choose the file where the tab
separated ASCII file is to be
written to or retrieved from in
the corresponding window
Select:
•
•
•
•
Folder
File
Enter File Name
Click OK
You can change the export separator by manually editing the .perireporter file.
To do this, add an entry using the name ‘exportSeparator.’ Set this value as the
separator you would like to use in your export.
PeriReporter’s User Guide P0988093
July 2010
100
Print a Generated Report
You can chose to print the entire generated report, only the portion displayed on the
screen, or only the report definition of the specified report. Select Print from the File
menu or the tool bar.
Any changes made in the Print Setup window will be saved in the .perireporter
file.
Open the Print Setup window
from the menu bar
Select:
•
•
File
Print...
Open the Print Setup window
from the tool bar
Click:
• Print button
Print Command
Enter the printer destination of the document to be printed. This is the same command
that would be entered elsewhere on your system to allocate a specific printer.
Point Size
Point Size controls the size of the data to be displayed in the printed report. Change
the Point Size by clicking on the up and down arrows or typing in a number.
Point Size is disabled if Print Report Definition is chosen.
PeriReporter’s User Guide P0988093
July 2010
101
Leading Size
Leading Size controls the vertical size of the cells in the printed report. Change the
Leading Size by clicking on the up and down arrows or typing in a number.
Leading Size is disabled if Print Report Definition is chosen.
Be careful not to make the Point Size larger than the Leading Size. If this happens, the
data will overflow the cells, making the printed report difficult to read.
Print Report Definition
Choosing this option will print a table labeling the column mappings, formulas, and
styles. An example of this table is below.
Col.
Heading
Mps#
Date
A
Date
0
T
B
# of
Calls
0
F
C
Total
0
F
Order
Range
A
B
#>20
C
Folder
Variable
Formula
Key
0
Test
Calls
0
Total
SUM(B,G)
0
Show
Dec.
Align
Height
Width
FontStyle
true
0
C
33
131
TimesRoman
true
0
C
33
103
TimesRoman
Italic
true
0
C
33
103
TimesRoman
Bold
Choosing Print Report Definition will also create a table labeling the Subtotal and
Total rows, along with any Special Cells that may be mapped. An example of this table
is below.
Column:
Subtotals Rows:
Totals Rows:
A
Subtotal
Total
B
SUM(B)
TOT(B)
C
SUM(C)
TOT(C)
Special Cells:
B4+C6
The default setting in PeriReporter is for the Print Report Definition button to be off.
Paper Size
Paper Size allows you to specify the paper the generated report will be printed on.
Letter is standard 8 1/2 x 11 paper. A4 is a European standard of paper size. Letter is
the default setting.
PeriReporter’s User Guide P0988093
July 2010
102
Page Orientation
Page Orientation allows you to choose how the generated report will be displayed on
the paper. Portrait will print the report vertically. Landscape will print the report
horizontally. Landscape will also allow more columns to be displayed across the page.
Landscape is the default setting.
Page Orientation is disabled if Print Report Definition is chosen.
Print Scope
Print Scope will allow you to choose between printing the entire generated report or
only the portion which is displayed on the computer monitor. Entire is the default
setting. Print Scope is disabled if Print Report Definition is chosen.
Grid Lines
Grid Lines allows you to choose how to show the cell divisions on the printed report.
The lines can either be Solid or Dashed. You can also choose to have no visible lines
by clicking off both options. No lines is the default setting.
Page Layout
• Full Size
Clicking the Full Size button will print the report as the number of Rows per
Page specified in the Report Settings window.
• Fit To Page
Clicking the Fit To Page button will fit as many rows vertically and as many
columns horizontally on the page as possible, before starting a new page.
• Horizontal Adjustment
Clicking the Horizontal Adjustment button will force the generated report to
either spread the columns out or condense the column width in order to fit all
of the columns onto the width of the page. If the report consists of many
columns, choosing this option may make the generated report difficult to read
as it will be minimized to fit onto the page width.
Full Size is the default setting.
Page Layout is disabled if Print Report Definition is chosen.
Print and Postscript
Clicking on the Print button will print the generated report according to the parameters
you have set in the Print Setup window. Clicking on the Postscript button will save the
generated report to a postscript file, without printing it.
Print HTML
Clicking on the Print HTML button saves the report to an HTML file.
If you change the report definition, and would still like to save this version, remember
to change the name of the report or else this one will overwrite the previous definition.
PeriReporter’s User Guide P0988093
July 2010
103
Options
The following options are currently available in PeriReporter. You can manually edit
the .perireporter file to contain these entries. These values can be set to true or
false (the default option):
•
omitheadings -> If true, omits headings when generating a postscript file.
•
omithtmltitle -> If set to true, omits title information from an html report.
•
omithtmlinfo -> If set to true, omits report information from an html report.
A sample .perireporter file, generated with the default setting (false), is shown
below:
#Environment settings for PeriReporter
#Thu Apr 10 09:15:19 EDT 2003
printcommand=lp
fitpage=false
colorSub=-16776961
sitename=
colorTot=-16711936
colorFG=-16777216
colorInput=-10197791
preview=10
pagesize=Letter
point=12
global=true
portrait=false
colorMenubar=-1973791
lead=12
colorBG=-4144960
horzcomp=false
numrows=115
numcols=30
actsize=true
omitheadings=false
omithtmltitle=false
omithtmlinfo=false
If you change the report definition, and would still like to save this version, remember
to change the name of the report. If not, this one will overwrite the previous definition.
PeriReporter’s User Guide P0988093
July 2010
104
Other Functions
Some functions which are used in PeriDefiner are not configurable in the PeriReporter
component.
•
The Data Mapping, Display Filters, and Column Appearance windows, all of
which are accessed through the Column menu, can be viewed only. No
changes can be made here.
•
The Report Settings, Column Mappings, and Column Filters windows, all of
which are accessed through the Setup menu, can be viewed only. No changes
can be made here.
Command Line Options
These options can be specified when starting PeriReporter from the command line.
Option
Parameter
Function
-b
report[.prd]
-sdate MM/DD/CCYY
-edate MM/DD/CCYY
Batch mode (print report without
viewing)
(optionally -stime and
-etime can be chosen)
Multiple reports can be generated by
typing additional report names at the
command line.
Create postscript file (runs in batch
mode)
-ps
-sdate
MM/DD/CCYY
Set Start date
-edate
MM/DD/CCYY
Set End date
-stime
HH:MM
Set Start Time (military format)
-etime
HH:MM
Set End Time (military format)
-t
h(hourly), d(daily),
w(weekly), m(monthly),
y(yearly)
Set Report Type (default - 15 minute)
Show Help
-h
-v
#
Override Avaya MPS/VPS number
Show version of PeriReporter running
-version
report[.prd]
Load Report
-ex
Create Export File (batch mode)
-html
Create HTML File (batch mode)
-o
Output Destination File (batch mode)
PeriReporter’s User Guide P0988093
July 2010
105
Help Menu
PeriReporter has an extensive on-line Help menu. You can choose to use the Table of
Contents or the scroll bar to search for a desired topic. You can move back and forth
between topics by using the Forward and Back buttons. The name of the current help
file is displayed in the URL box. You can switch to the PeriDefiner help file by typing
in PeriDefiner.html.
To activate the Help window, click the word Help in the menu bar.
PeriReporter’s User Guide P0988093
July 2010
106
This page has been intentionally left blank.
PeriReporter’s User Guide P0988093
July 2010
Step-by-Step
Sample Report
This chapter covers:
1. Step-by-Step Sample Report
108
Step-by-Step Sample Report
What follows are instructions for constructing a sample report, including defining
parameters, mapping columns, updating cells, generating, and printing the report.
After certain steps of constructing a report you may want to save your progress. The
first time you choose to save you will have to enter a name for your report file. Each
subsequent Save will save the report to that file. To save the work you have done thus
far, simply click on the Save button on the tool bar. The first time we save this sample
report we will name it sample.prd.
Throughout this sample, the Save icon will be inserted at specific points
to remind you to use the Save function.
1. Configure PeriConsolidator
After the PeriReporter Tools package is installed, PeriConsolidator is
automatically run in crontab. The default parameters are installed in the
.conspr file. If you would like to customize these parameters, copy the file
to your home directory, then edit that .conspr file, changing the number of
days to save each file type accordingly. For this sample report we will not be
changing the default parameters.
For additional information on the installation of the PeriReporter Tools
package, refer to the Installing Graphical Tools on a Customer Supplied
Workstation (9090504(I)) manual.
2. Begin Defining A Report
•
Open PeriDefiner
•
From the PeriReporter Tools window, choose
PeriReporter.
•
When PeriReporter launches, click on the
PeriDefiner icon on the tool bar.
This will open a blank report definition.
PeriReporter’s User Guide P0988093
July 2010
109
•
Update the Report Settings
Open the Report Settings window using the Setup menu.
•
•
•
•
•
At the Report Title line, enter the name of the report. For this sample
we will use Sample Report.
At the Rows per Page line, enter the amount of rows to be displayed
before each Subtotal line. For this sample, so that we may see
everything necessary on screen, we will use 8.
At the Rows for Subtotals line, enter the amount of rows used to
display subtotals at the bottom of each page. For this sample we will
use 1.
At the Rows for Totals line, enter the amount of rows used to display
totals at the end of the report. For this sample we will use 1.
Lines for Report Title, Column Heading Rows, and Report Mode can
also be set. For this sample we will use the default settings.
•
Define Column Formulas and Mappings
Open the Data Mappings window from the Column Menu. For each
column, highlight the column by clicking on the column letter, so that the
Column menu is enabled.
From the Column menu select Mapping. Choose one column to represent
the date and time intervals for this report. This will typically be the first
column. For this sample, we have used the following.
• Column A: In the Column Type area, click Date. This will map this
column to display the date and time interval in each row of the report.
When Date is selected, all other sections of this window will be
PeriReporter’s User Guide P0988093
July 2010
110
disabled.
PeriReporter’s User Guide P0988093
July 2010
111
Select a Folder and Datacard Name for each of the remaining columns
that are to collect statistical data. Leave Column Type set to Variable so
that all other functions in the window are enabled.
For this sample we will select, from the Application Variables subwindow:
• Column B: Statistics.NumCalls
• Column C: Statistics.NumSaving
• Column D: Statistics.NumChecking
• Column E: Statistics.NumRefers
These will then appear in the Folder Name and Datacard Name sections.
Select an Avaya MPS/VPS Number for each of the above columns.
Leaving the number set to 0 will have the column collect data from all
available Avaya MPSs/VPSs. For this sample we will leave the Avaya
MPS/VPS number set to zero for all
columns.
•
Update Individual Columns and Cells
Update each individual column by highlighting it, then designating a
label, function, value or formula. For this sample we will update the
following columns as indicated.
• Column F: Highlight the column and enter the function
@SUM(C,D). This will collect the total, in each row, of columns C
and D. This will give us the total number of calls made that were in
reference to savings and checking accounts. Now each individual cell
in column F is mapped to collect the SUM of columns C and D from
its corresponding row.
PeriReporter’s User Guide P0988093
July 2010
112
•
•
Column G: Highlight the column and enter the formula =F/B. This
will take the SUM collected in column F and divide it by column B,
which is mapped to the total number of calls made. Now each
individual cell in column G is mapped to collect the quotient for
columns B and F from its corresponding row.
•
Column H: Highlight the column and enter the formula =G*100.
This will take the quotient from column G and multiply it by 100. We
will now have a percentage of the total calls made that were for
savings and checking purposes. Now each individual cell in column
H is mapped to collect the percentage of savings and checking calls
from its corresponding row.
Check to see if the Columns are Mapped correctly
To see how each individual column is mapped, open the Column
Mappings window from the Setup menu. For this sample, it should look
like this:
PeriReporter’s User Guide P0988093
July 2010
113
•
Update Display Filters
Open the Display Filters window from the Column Menu. For each
column, highlight the column, so that the Column menu is enabled, and
select Filters.
Choose the column which is mapped to display the date and time intervals
and open the Display Filters window. All functions, except Column
Heading, Show, and Display, will be disabled. Type in the column
heading in the corresponding space. For this sample we have used column
A to display the date and time.
• Column A: Column Heading - Date
Open the Display Filters window for each of the remaining columns.
Choose the functions that best suit the needs of your particular report. For
this sample, we will filter the following columns in the following ways.
• Column B: Column Heading - # of Calls; Key Priority - 1;
Display - Show; Order - Ascending
• Column C: Column Heading - Savings; Key Priority - 3;
Display - Show; Order - Ascending
• Column D: Column Heading - Checking; Key Priority - 2;
Display - Show; Order - Ascending
• Column E: Column Heading - Referrals; Key Priority - 4;
Display - Show; Order - Ascending
• Column F: Column Heading - C + D; Key Priority - 0;
Display - Hide
•
Column G: Column Heading - Decimal; Key Priority - 0;
Display - Hide
• Column H: Column Heading - Percentage; Key Priority - 0;
Display - Show
Columns F, G and H can not be set with an Order because they have not
been set to a Key Priority. An Allowable Range may also be set for each
column, regulating the data it displays. No Allowable Range has been set
for this sample.
PeriReporter’s User Guide P0988093
July 2010
114
•
Check to see if the Display Filters are correct.
To see how each individual column is filtered, open the Column Filters
window from the Setup menu. For this sample, it should look like this:
•
Define Subtotals
Scroll down to the Subtotal row. Unless the color has been changed in the
Screen Colors window, this row will appear green. Choose one column to
represent the heading of this row. This will typically be the first column.
• Column A : Highlight the cell. Label it by entering lSubtotal.
Update the rest of the Subtotal row in the following manner.
• Column B : Highlight the cell. Map it to gather Subtotal information
by entering @SUM(B).
Do the same for each successive column, incrementing the column letter
to match.
•
Define Totals
Scroll down to the Total row. Unless the color has been changed in the
Screen Colors window, this row will appear blue. Choose one column to
represent the heading of this row. This will typically be the first column.
• Column A : Highlight the cell. Label it by entering lTotal.
Update the rest of the Total row in the following manner.
• Column B : Highlight the cell. Map it to gather Total information by
entering @TOT(B).
Do the same for each successive column, incrementing the column letter
to match.
PeriReporter’s User Guide P0988093
July 2010
115
•
Column Appearance
Open the Column Appearance window from the Column menu. For each
column, highlight the column, so that the Column menu is enabled, and
select Appearance.
For the column which is mapped to display the date and time intervals, it
may be necessary to expand the width. If this is not done the data may not
fit and a series of question marks will be displayed in its place. For this
sample, we have set the following.
• Column A: Column Width - 130
For columns which are set to compute mathematical expressions, decimal
places may be desired. For this sample we have set the following.
• Column G : Number of Decimals - 3
• Column H : Number of Decimals - 2
You may also change the look of the displayed data by adjusting the Font
and Style, along with the Justification within each cell. For this sample,
we have left these parameters to the defaults.
•
Look at the Report Definition
Columns F and G will appear black because they are mapped to Hide.
Since these columns are mapped to Functions and Formulas, these two
columns, along with column H and the Subtotal and Total rows, will have
0 in their cells. The report definition for this sample should look like this:
PeriReporter’s User Guide P0988093
July 2010
116
•
Fill the Report
To verify all the column and cell Mappings and Formulas are entered
correctly choose Fill Report from the File menu. Taking into account the
fact that Fill Report uses random data, and it will be different every time,
the filled report of this sample should look like this.
Because Fill Report only shows one page of what the report will look like,
the Subtotal and Total rows contain the same data. In a real report the
Subtotal rows would appear at the bottom of each page and the Total row
would appear only at the end of the report.
•
Update Global Settings
To specify the maximum number of rows and columns for the generated
report, select Global Settings.
Open the Global Settings window from the Setup menu. Choose Global
Settings and then Configuration. For this sample, we have set the
following.
• Number of Rows - 100
• Number of Columns - 8
•
Close the Report Definition
From the File menu, choose Quit. This will bring you back to the empty
PeriReporter report screen.
PeriReporter’s User Guide P0988093
July 2010
117
3. Generate the Report
•
Open the Report Definition
Click on the Open icon on the tool bar. This will bring up the Open
PeriReporter Report Definition window. Scroll down in the Files window
until you find the report definition you have created. For this sample we
will use the definition we created in PeriDefiner, sample.prd.
Double-click on the name to open it. The PeriReporter Generation
window for our sample report should look like this:
Columns F and G will not be visible here because they are set to Hide.
The calculations they perform will be reflected in Column H.
•
Set the Report Scope
Open the Report Scope window by clicking on the Report Scope icon on
the tool bar.
Enter the Start Date, End Date, Start Time, and End Time.
You may also choose to override the Avaya MPS/VPS numbers chosen in
PeriDefiner.
Click the List Files in Range button to see which files correspond to the
dates specified in the report scope.
For this sample we have used a Start Date of 12/25/1998. We have left
the End Date blank, so the report will only generate for the one day.
We have left the Start Time and End Time set to the defaults.
PeriReporter’s User Guide P0988093
July 2010
118
•
Generate Report
Click the Generate Report button on the tool bar.
The Report Generation of our sample report should look like this:
•
Print Report
Open the Print Setup window from the tool bar by clicking on the Print
icon.
Set the Print Command line to specify your destination printer.
Select Print.
You may want to print the report several times, each time changing an
option within the Print Setup window, to see which best suits your needs.
For additional information on printing reports, refer to the Print a
Generated Report section of this manual.
PeriReporter’s User Guide P0988093
July 2010
119
This page has been intentionally left blank.
PeriReporter’s User Guide P0988093
July 2010
120
PeriReporter’s User Guide P0988093
July 2010
Index
122
Symbols
$ASEHOME/copy 34, 57
$ASEHOME/stats 20, 22, 23, 25, 44
$VPSHOME/common/etc/vpshosts 20, 40
$VPSHOME/common/stats 20
.conspr 43
.perireporter 14
.rhosts 16
A
accstats 25
accumulated summary phone line statistics report 29
allowable range 60
application statistics 27, 28, 33–34, 42
defining stat events 34
multi-node environment 23–24
PeriProducer 35
single node environment 22
application variables 57
appstats 27, 34
appstats files 41
area graph 84
AVG function 54
B
bar graph 83
C
candle graph 85
cells
update 58, 61
colors
PeriDefiner 66
PeriReporter component 92
column
heading 58
update 58
width 61
column appearance 60–61
column width 61
font 61
justification 61
number of decimals 61
style 61
update cells 61
column filters 63
clear all keys
PeriReporter’s User Guide P0988093
July 2010
123
key priority 64
clear all ranges
allowable range 64
show all columns 64
column formulas 54–55
examples 55
functions 54
mathematical expression 54
text label 54
column heading rows 53
column mappings 63
column type 56
command line options
-b 98
-d MMDDCCYY 45
-edate 98
-etime 98
-h 45, 71, 98
-n 45
PeriConsolidator 45
PeriDefiner 71
PeriReporter component 98
-ps 98
-s 45
-sdate 98
-stime 98
-t 98
-v 98
-version 45, 71, 98
configuration
PeriConsolidator 41
PeriDefiner 65
PeriReporter component 91
consolidation level 40, 80
counters 36
crontab 40
D
data maintenance 42
data mapping 55–56
application variables 56
column type 56
datacard name 56
folder name 56
MPS/VPS number 56
system variables 56
VPS number 56
datacard name 56
decimals 61
PeriReporter’s User Guide P0988093
July 2010
124
default detail level 53
default end time 53
default start time 53
detail level 80
detail phone line statistics report 29
detail span statistics report 29
detail system statistics report 29
display filters 58–60
allowable range 60
column heading 58
display 59
key priority 59
order 59
E
empty report 67
end date 78
end time 79
export 94
F
fill report 67
folder name 56
font 61
function 54
AVG 54
MAX 54
MIN 54
SUM 54
TAVG 54
TMAX 54
TMIN 54
TOT 54
G
generate report 76–80
global settings
PeriDefiner 65
PeriReporter component 91
graphs 81
area 84
bar 83
candle 85
hilo 86
pie 87
plot 82
scatter 88
PeriReporter’s User Guide P0988093
July 2010
125
stacking 89
H
help
PeriDefiner 71
PeriReporter component 99
hidden columns 59, 64
hide 59, 64
hilo graph 86
HostDetail.prd 29
HostSum.prd 29
I
import 94
installation site
PeriDefiner 65
PeriReporter component 91
integer 54
J
justification 49, 61
K
key priority 59, 64
L
launch
PeriDefiner
from command line 48
from PeriReporter component 48, 49
PeriReporter component
from command line 74
lines for report title 52
list files in range 80
M
maintainStats 43
mathematical expression 54
MAX function 54
MIN function 54
MPS network
statistics reports 25
MPS number 56, 79
mps range 80
multi-node environment 23–24
PeriReporter’s User Guide P0988093
July 2010
126
O
open
PeriPro folder
PeriDefiner 50
PeriReporter component 76–77
report definition
PeriDefiner 50
PeriReporter component 76–77
options
PeriReporter component 91
override MPS number 79
override VPS number 79
overview
PeriConsolidator 15
PeriDefiner 15, 48
PeriReporter component 15, 74
PeriReporter tool 14
P
page layout
fit to page 70
full size 70
horizontal adjustment 70
parameters
PeriConsolidator 43
pchistory.log 44
pericons.log 44
PeriConsolidator 40
command line options 45
configuration 41
consolidation level 40
log
pericons.log 44
overview 15
parameters 43
setup 40
PeriDefiner 48
column filters 63
column mappings 63
command line options 71
empty report 67
fill report 67
global settings 65
installation site 65
number of columns 65
number of rows 65
preview intervals 65
help 71
PeriReporter’s User Guide P0988093
July 2010
127
launch
from command line 48
from PeriReporter component 48, 49
open
PeriPro folder 50
report definition
existing 50
new 50
overview 15, 48
print 68–71
filled report 69
grid lines 70
layout 70
leading size 69
page orientation 70
paper size 70
point size 68
postscript 70
print command 68
report definition 69
scope 70
save 51
screen colors 66
tool bar 49
update
cells 58
column 58
report settings 52
PeriProducer 35
PeriPro folder 50, 76
PeriReporter
component 74
column appearance 98
column filters 98
column mappings 98
command line options 98
data mapping 98
display filters 98
export 94
generate 80
global settings 91
installation site 91
number of columns 91
number of rows 91
preview intervals 91
help 99
import 94
launch
from command line 74
open
PeriReporter’s User Guide P0988093
July 2010
128
PeriPro folder 76–77
report definition 76–77
options 91
overview 15, 74
preview 93
print 95–97
grid lines 97
layout 97
leading size 96
page orientation 97
paper size 96
point size 95
postscript 97
print command 95
report definition 96
scope 97
report scope 78
report settings 98
screen colors 92
tool bar 75
tool
overview 14
phone line reports 31
MPSPhoneAcc.prd 31
MPSPhoneDetail.prd 31
MPSPhoneSum.prd 31
System.ACS 31
System.ARS 31
System.Calls 31
System.CR 31
System.FR 32
System.MIS 31
System.SAB 31
System.UAB 31
System.UAR 32
System.Utilized 31
phone line statistics 42
MPSPhoneAcc.prd 29
MPSPhoneDetail.prd 29
MPSPhoneSum.prd 29
pie graph 87
plot graph 82
postscript file
PeriDefiner 70
PeriReporter component 97
predefined reports 29
preview 93
preview intervals 65, 91
print
PeriDefiner 68–71
PeriReporter’s User Guide P0988093
July 2010
129
PeriReporter component 95–97
R
report
generate 76–80
predefined 29
report mode
standard 53, 79
summary 53, 79
report scope 78–80
detail level 80
end date 78
end time 79
list files 80
mps/vps range 80
override MPS/VPS number 79
start date 78
start time 79
report settings 52
column heading rows 53
default detail level 53
default end time 53
default start time 53
lines for report title 52
report mode 53
report title 52
rows for subtotal 53
rows for total 53
rows per page 53
report title 52
rows for subtotal 53
rows for total 53
rows per page 53
S
save
PeriDefiner 51
save symbol 51
scatter graph 88
scope 78
screen colors
PeriDefiner 66
PeriReporter component 92
sharing data 16
single node environment 22
span reports 30
System.SpanBusy 30
System.SpanDegraded 30
PeriReporter’s User Guide P0988093
July 2010
130
System.SpanError 30
System.SpanFailed 30
System.SpanMaxBit 30
System.SpanSevere 30
System.SpanYellow 30
span statistics 42
SpanDetail.prd 29, 30
SpanSum.prd 29, 30
stacking graph 89
standard mode 53, 79
start date 78
start time 79
stat events 34, 36
definition 34
multi-node environment 23–24
PeriProducer 35
single node environment 22
statistics
application 27, 28, 33–34, 42
defining stat events 34
collection 20
maintenance 20
system 25–32, 42
predefined reports 29
statistics reports
MPS network 25
system statistics 28–32
Step-by-Step Report 102
subtotal
define rows 62
rows for 53
SUM function 54
summary mode 53, 79
summary phone line statistics report 29
summary span statistics report 29
summary system statistics report 29
sysstats 25
system reports 30, 32
HostDetail.prd 32
HostSum.prd 32
phone line reports 31
MPSPhoneAcc.prd 31
MPSPhoneDetail.prd 31
MPSPhoneSum.prd 31
System.ACS 31
System.ARS 32
System.Calls 31
System.CR 31
System.FR 32
System.MIS 31
PeriReporter’s User Guide P0988093
July 2010
131
System.SAB 31
System.UAB 31
System.UAR 32
System.Utilized 31
predefined 29
span reports 30
SpanDetail.prd 30
SpanSum.prd 30
System.SpanBusy 30
System.SpanDegraded 30
System.SpanError 30
System.SpanFailed 30
System.SpanMaxBit 30
System.SpanSevere 30
System.SpanYellow 30
System.AllBusy 32
System.MessagesFrom 32
System.MessagesTo 32
System.TotalCalls 32
system statistics 25–32, 42
reports 28–32
predefined 29
system variables 57
T
TAVG function 54
text label 54
time zones 17
TMAX function 54
TMIN function 54
tool bar
PeriDefiner 49
PeriReporter component 75
TOT function 54
total
define rows 62
rows for 53
U
update
cells 58
column 58
report settings 52
V
vexdump 34, 35
VPS number 56, 79
PeriReporter’s User Guide P0988093
July 2010
132
vps range 80
VSUPD 33–34
PeriReporter’s User Guide P0988093
July 2010
133
This page has been intentionally left blank.
PeriReporter’s User Guide P0988093
July 2010