1
Part I: Integrated Development Environment
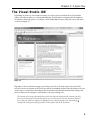
Before we launch into building our first application, it’s important that we take a step back and look at
the components that make up the Visual Studio 2008 IDE. Menus and toolbars are positioned along the
top of the environment (as in most Windows applications), and a selection of sub-windows, or panes,
appears on the left and right of the main window area. In the center is the main editor space: Whenever
you open a code file, an XML document, a form, or some other file, it will appear in this space for
editing. With each file you open, a new tab is created so that you can toggle among opened files.
On either side of the editor space is a set of tool windows: These areas provide additional contextual
information and functionality. In the case of the general developer settings, the default layout includes
the Solution Explorer and Class View on the right, and the Server Explorer and Toolbox on the left. The
tool windows on the left are in their collapsed, or unpinned, state. If you click on a tool window’s title, it
will expand; it will collapse again when it no longer has focus or you move the cursor to another area of
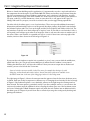
the screen. When a tool window is expanded you will see a series of three icons at the top right of the
window, similar to those shown in the left image of Figure 1-4.
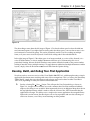
Figure 1-4
If you want the tool window to remain in its expanded, or pinned, state, you can click the middle icon,
which looks like a pin. The pin will rotate 90 degrees to indicate that the window is now pinned.
Clicking the third icon, the X, will close the window. If later you want to reopen this or another tool
window, you can select it from the View menu.
Some tool windows are not accessible via the View menu, for example those having to do with
debugging, such as threads and watch windows. In most cases these windows are available via an
alternative menu item: in the case of the debugging windows it is the Debug menu.
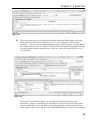
The right image in Figure 1-4 shows the context menu that appears when the first icon, the down arrow,
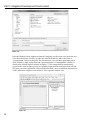
is clicked. Each item in this list represents a different way of arranging the tool window. In the left image
of Figure 1-5 the Solution Explorer is set as dockable, whereas in the right image the floating item has
been selected. The latter option is particularly useful if you have multiple screens, as you can move the
various tool windows onto the additional screen, allowing the editor space to use the maximum screen
real estate. Selecting the Tabbed Document option will make the tool window into an additional tab in
the editor space. In Chapter 4 you will learn how to effectively manage the workspace by docking and
pinning tool windows.
6