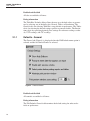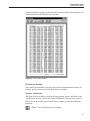
1
Hart Scientific
9933 TableWare
User’s Guide
Rev. 592101
Fluke Corporation, Hart Scientific Division (Hart) warrants this product to be free
from defects in material and workmanship under normal use and service for a period as stated in our current product catalog from the date of shipment. This warranty extends only to the original purchaser and shall not apply to any product
which, in Hart’s sole opinion, has been subject to misuse, alteration, abuse or abnormal conditions of operation or handling.
Software is warranted to operate in accordance with its programmed instructions on
appropriate Hart products. It is not warranted to be error free.
Hart’s obligation under this warranty is limited to repair or replacement of a product
which is returned to Hart within the warranty period and is determined, upon examination by Hart, to be defective. If Hart determines that the defect or malfunction
has been caused by misuse, alteration, abuse or abnormal conditions or operation or
handling, Hart will repair the product and bill the purchaser for the reasonable cost
of repair.
To exercise this warranty, the purchaser must forward the product after calling or
writing Hart for authorization. Hart assumes NO risk for in-transit damage.
For service or assistance, please contact the manufacturer.
THE FOREGOING WARRANTY IS PURCHASER’S SOLE AND EXCLUSIVE
REMEDY AND IS IN LIEU OF ALL OTHER WARRANTIES, EXPRESS OR IMPLIED, INCLUDING BUT NOT LIMITED TO ANY IMPLIED WARRANTY OR
MECHANTABILITY, OR FITNESS FOR ANY PARTICULAR PURPOSE OR
USE. HART SHALL NOT BE LIABLE FOR ANY SPECIAL, INDIRECT, INCIDENTAL, OR CONSEQUENTIAL DAMAGES OR LOSS WHETHER IN CONTRACT, TORT, OR OTHERWISE.
Microsoft, MS-DOS, Windows, Window for Workgroups, and Windows 95, 98,
ME, NT, 2000, and XP are either registered trademarks or trademarks of Microsoft
Corporation.
Fluke Corporation
Hart Scientific Division
799 E. Utah Valley Drive American Fork, UT 84003-9775 USA
Phone: +1.801.763.1600
Telefax: +1.801.763.1010
Email: [email protected]
www.hartscientific.com
Subject to change without notice. Copyright © 2005 Printed in USA
Rev. 592101
Table of Contents
1 Introduction . . . . . . . . . . . . . . . . . . . . . . . . . . . . 1
1.1
1.2
What is TableWare?. . . . . . . . . . . . . . . . . . . . . . . . . . 1
License agreement . . . . . . . . . . . . . . . . . . . . . . . . . . 1
1.3
1.4
Features . . . . . . . . . . . . . . . . . . . . . . . . . . . . . . . . 1
Requirements . . . . . . . . . . . . . . . . . . . . . . . . . . . . . 4
1.4.1
1.4.2
Computer hardware. . . . . . . . . . . . . . . . . . . . . . . . . . . . . . . . 4
Computer software . . . . . . . . . . . . . . . . . . . . . . . . . . . . . . . . 4
1.5
1.6
Installation . . . . . . . . . . . . . . . . . . . . . . . . . . . . . . 4
International settings . . . . . . . . . . . . . . . . . . . . . . . . . 5
1.7
1.8
Running TableWare . . . . . . . . . . . . . . . . . . . . . . . . . . 5
TableWare main display . . . . . . . . . . . . . . . . . . . . . . . 5
1.8.1
TableWare toolbar . . . . . . . . . . . . . . . . . . . . . . . . . . . . . . . . 6
2 File menu . . . . . . . . . . . . . . . . . . . . . . . . . . . . . . 9
2.1
Defaults . . . . . . . . . . . . . . . . . . . . . . . . . . . . . . . . 9
2.1.1
2.1.2
2.1.3
2.2
2.3
Defaults - General . . . . . . . . . . . . . . . . . . . . . . . . . . . . . . . 10
Defaults - Tables . . . . . . . . . . . . . . . . . . . . . . . . . . . . . . . . 12
Defaults - Resolutions . . . . . . . . . . . . . . . . . . . . . . . . . . . . . 13
Setup printer . . . . . . . . . . . . . . . . . . . . . . . . . . . . . 14
Exit . . . . . . . . . . . . . . . . . . . . . . . . . . . . . . . . . 14
3 Coefficients menu. . . . . . . . . . . . . . . . . . . . . . . . . 15
3.1
3.2
Probe information . . . . . . . . . . . . . . . . . . . . . . . . . . 15
Coefficients . . . . . . . . . . . . . . . . . . . . . . . . . . . . . 16
3.2.1
3.2.2
3.2.3
3.3
Raw data. . . . . . . . . . . . . . . . . . . . . . . . . . . . . . . 19
3.3.1
3.3.2
3.3.3
3.4
ITS-90 coefficients . . . . . . . . . . . . . . . . . . . . . . . . . . . . . . . 19
Polynomial, CVD, and IPTS-68 coefficients . . . . . . . . . . . . . . . . . . 20
Thermocouple coefficients . . . . . . . . . . . . . . . . . . . . . . . . . . . 23
Import/export file format . . . . . . . . . . . . . . . . . . . . . . 24
3.4.1
3.4.2
3.4.3
3.5
Platinum probe . . . . . . . . . . . . . . . . . . . . . . . . . . . . . . . . . 16
Thermistor probe . . . . . . . . . . . . . . . . . . . . . . . . . . . . . . . . 17
Thermocouple probe . . . . . . . . . . . . . . . . . . . . . . . . . . . . . . 18
ITS-90 coefficients . . . . . . . . . . . . . . . . . . . . . . . . . . . . . . . 24
Polynomial, CVD, and IPTS-68 coefficients . . . . . . . . . . . . . . . . . . 27
Thermocouple coefficients . . . . . . . . . . . . . . . . . . . . . . . . . . . 28
Coefficients and residuals . . . . . . . . . . . . . . . . . . . . . . 29
3.5.1
Table options . . . . . . . . . . . . . . . . . . . . . . . . . . . . . . . . . . 31
3.5.1.1
3.5.1.2
Table options—type and range . . . . . . . . . . . . . . . . . . . . . . . . . . . . . 33
Table options—resolutions . . . . . . . . . . . . . . . . . . . . . . . . . . . . . . . 34
i
3.5.1.3
3.6
3.7
Requirements for calculating coefficients . . . . . . . . . . . . . . 38
3.7.1
3.7.2
3.7.3
3.7.4
3.7.5
3.8
.
.
.
.
.
.
.
.
.
.
.
.
.
.
.
.
.
.
.
.
.
.
.
.
.
.
.
.
.
.
.
.
.
.
.
.
.
.
.
.
.
.
.
.
.
.
.
.
.
.
.
.
.
.
.
.
.
.
.
.
.
.
.
.
.
.
.
.
.
.
.
.
.
.
.
.
.
.
.
.
.
.
.
.
.
.
.
.
.
.
.
.
.
.
.
.
.
.
.
.
.
.
.
.
.
.
.
.
.
.
.
.
.
.
.
38
39
40
41
42
ITS-90 . . . . . . . . . . . . .
IPTS-68 . . . . . . . . . . . .
Callendar-Van Dusen . . . . .
Polynomial and thermocouple
.
.
.
.
.
.
.
.
.
.
.
.
.
.
.
.
.
.
.
.
.
.
.
.
.
.
.
.
.
.
.
.
.
.
.
.
.
.
.
.
.
.
.
.
.
.
.
.
.
.
.
.
.
.
.
.
.
.
.
.
.
.
.
.
.
.
.
.
.
.
.
.
.
.
.
.
.
.
.
.
.
.
.
.
.
.
.
.
.
.
.
.
.
.
.
.
. 44
. 45
. 45
. 45
Software output . . . . . . . . . . . . . . . . . . . . . . . . . . . 46
3.9.1
3.9.2
3.10
ITS-90 coefficients . . . . . . . .
IPTS-68 coefficients . . . . . . .
Callendar-Van Dusen coefficients.
Polynomial Coefficients . . . . .
Thermocouple coefficients . . . .
Methods used for calculating coefficients. . . . . . . . . . . . . . 44
3.8.1
3.8.2
3.8.3
3.8.4
3.9
Table options—other settings. . . . . . . . . . . . . . . . . . . . . . . . . . . . . . 36
Table temperature range chart . . . . . . . . . . . . . . . . . . . . 36
Report or ASCII text file . . . . . . . . . . . . . . . . . . . . . . . . . . . . 46
Table. . . . . . . . . . . . . . . . . . . . . . . . . . . . . . . . . . . . . . . 46
Print preview window . . . . . . . . . . . . . . . . . . . . . . . . 46
4 Table menu . . . . . . . . . . . . . . . . . . . . . . . . . . . . 51
4.1
Enter coefficients . . . . . . . . . . . . . . . . . . . . . . . . . . 51
5 Help Menu . . . . . . . . . . . . . . . . . . . . . . . . . . . . 53
5.1
5.2
Contents . . . . . . . . . . . . . . . . . . . . . . . . . . . . . . . 53
Search for help on . . . . . . . . . . . . . . . . . . . . . . . . . . 53
5.3
5.4
Getting started . . . . . . . . . . . . . . . . . . . . . . . . . . . . 53
Technical support . . . . . . . . . . . . . . . . . . . . . . . . . . 54
5.5
About . . . . . . . . . . . . . . . . . . . . . . . . . . . . . . . . 55
6 Messages . . . . . . . . . . . . . . . . . . . . . . . . . . . . . 57
6.1
TableWare Messages . . . . . . . . . . . . . . . . . . . . . . . . 57
6.2
TableWare Error Messages . . . . . . . . . . . . . . . . . . . . . 58
7 Glossary . . . . . . . . . . . . . . . . . . . . . . . . . . . . . . 61
ii
Figures
Figure 1
Figure 2
Figure 3
Figure 4
Figure 5
Figure 6
Figure 7
Figure 8
Figure 9
Figure 10
Figure 11
Figure 12
Figure 13
Figure 14
Figure 15
Figure 16
Figure 17
Figure 18
Figure 19
Figure 20
Figure 21
Figure 22
Figure 23
Figure 24
Figure 25
Figure 26
Figure 27
Figure 28
Figure 29
Figure 30
Figure 31
Figure 32
TableWare Main Display Screen . . . . . . . . . . . . . . . . . . . . . 6
File Menu . . . . . . . . . . . . . . . . . . . . . . . . . . . . . . . . . 9
TableWare Defaults dialog . . . . . . . . . . . . . . . . . . . . . . . . 9
Defaults-General . . . . . . . . . . . . . . . . . . . . . . . . . . . . 10
Defaults-Tables. . . . . . . . . . . . . . . . . . . . . . . . . . . . . . 12
Defaults-Resolutions . . . . . . . . . . . . . . . . . . . . . . . . . . . 13
Coefficients menu . . . . . . . . . . . . . . . . . . . . . . . . . . . . 15
Probe Information dialog . . . . . . . . . . . . . . . . . . . . . . . . 15
Platinum Probe Coefficients dialog (ITS-90 selected) . . . . . . . . . . 16
Thermistor Probe Coefficients dialog . . . . . . . . . . . . . . . . . . 17
Thermocouple Probe Coefficients dialog . . . . . . . . . . . . . . . . 18
Raw Data dialog for ITS-90 coefficients. . . . . . . . . . . . . . . . . 19
Raw Data dialog for polynomial, CVD, and IPTS-68 coefficients . . . 21
Select Calculation Scale dialog . . . . . . . . . . . . . . . . . . . . . 22
Raw Data dialog for thermocouple coefficients . . . . . . . . . . . . . 23
Import file format for ITS-90 coefficients . . . . . . . . . . . . . . . . 25
Import file format for polynomial, CVD, and IPTS-68 coefficients . . . 27
Import file format for thermocouple coefficients . . . . . . . . . . . . 28
Coefficients and Residuals dialog . . . . . . . . . . . . . . . . . . . . 29
Enter Date dialog. . . . . . . . . . . . . . . . . . . . . . . . . . . . . 30
Page Numbering dialog . . . . . . . . . . . . . . . . . . . . . . . . . 31
Table Options dialog . . . . . . . . . . . . . . . . . . . . . . . . . . . 32
Table Options - Type and Range . . . . . . . . . . . . . . . . . . . . . 33
Table Options - Resolutions . . . . . . . . . . . . . . . . . . . . . . . 35
Table Options - Other Settings . . . . . . . . . . . . . . . . . . . . . . 36
Print Preview window . . . . . . . . . . . . . . . . . . . . . . . . . . 47
Sample report or exported ASCII text file . . . . . . . . . . . . . . . . 49
Sample table . . . . . . . . . . . . . . . . . . . . . . . . . . . . . . . 50
Table menu . . . . . . . . . . . . . . . . . . . . . . . . . . . . . . . . 51
Enter Coefficients dialog for ITS-90 coefficients . . . . . . . . . . . . 51
Help menu . . . . . . . . . . . . . . . . . . . . . . . . . . . . . . . . 53
About TableWare dialog . . . . . . . . . . . . . . . . . . . . . . . . . 56
iii
1 Introduction
What is TableWare?
1
1.1
Introduction
What is TableWare?
TableWare is designed to calculate characterization coefficients for platinum,
thermistor, and thermocouple probes. The types of coefficients that can be calculated are: ITS-90 for platinum probes; IPTS-68 for platinum probes;
Callendar-Van Dusen for platinum probes; Polynomial for platinum and thermistor probes; and coefficients for thermocouple probes types B, E, J, K, N, R, S,
T, and AuPt.
The raw data used to calculate coefficients may be entered into the software directly or imported into the software from an ASCII text file. TableWare creates
a report that can be either printed to a printer or exported to an ASCII text file.
TableWare also generates Temperature vs. Resistance, Temperature vs. Ratio,
and Temperature vs. EMF tables based on ITS-90, IPTS-68, Callendar-Van
Dusen, Polynomial or Thermocouple coefficients.
1.2
License agreement
For information and details regarding the software End User License Agreement (EULA), refer to the online help file’s License Agreement topic.
1.3
Features
A list of new features and enhancements in version 2 of the TableWare follows:
Version 2.4
1.
The logos and graphics displayed in TableWare have been updated.
Version 2.3
1.
Prior to this version, the Shared Files Conflict dialog always appeared
when running the software in Windows NT with the file
COMMDLG.DLL listed. Even though the software works fine despite
this file conflict, this dialog no longer appears.
2.
When generating Temperature vs. Ratio tables, the Inverse Difference
column was incorrectly labeled “dT/dr”. The label has been changed to
correctly read “dT/dW”.
3.
When generating Temperature vs. Resistance tables or Temperature vs.
Ratio tables in °F, the values in the First Derivative (dr/dT) column and
Inverse Difference column (dT/dW) displayed the values as if the table
was in °C.
4.
The Extrapolating message incorrectly appeared when generating a table
when; a) the Table Scale was set to °F or K and, b) the Minimum Temp.
1
9933 TableWare
User’s Guide
and/or Maximum Temp. setting fell outside the recommended temperature range in °C.
5.
In version 2.2, an Overflow error sometimes occurred when attempting
to generate tables from thermistor polynomial coefficients that TableWare calculated. This problem has been fixed.
6.
A new range setting has been added for Type R and Type S Thermocouple probes. This range is named “-50.0°C to 1768.1°C (using extrapolation)”. Selecting this range allows TableWare to automatically determine
which reference function to use when calculating coefficients and table
values based on the temperature value. Selecting one of the other available ranges forces TableWare to use only the reference function for that
range.
7.
Temperature vs. EMF (mV) tables can now be generated as well as Temperature vs. EMF (μV) for thermocouple probes.
8.
Residuals for thermocouple probes are now displayed/printed in the scale
that the UUT readings were entered in instead of always being displayed/printed in Vμ.
9.
An Export button has been added to the Raw Data dialog, which allows
raw data to be saved to an ASCII text file in comma, delimited format.
Version 2.2:
2
1.
A warning message will appear when calculating thermocouple coefficients if one of the selected set-points is within ±5° of 0°C. The algorithm used to calculate thermocouple coefficients forces the EMF at 0°C
to 0.0µV. Therefore, using a set-point at or near 0°C when calculating
thermocouple coefficients may cause erroneous results. For best results,
use at least two set-points that are not near 0°C.
2.
The model and serial number labels used on the report and table are now
editable. These labels can be changed to display whatever information
your process requires. Simply enter the appropriate text in the Caption
and Value boxes on the Probe Information dialog. This information will
print on the report and table exactly as it is entered.
3.
The report and table now support page numbering in the “Page x of y”
format. For reports, Page Numbering dialog appears when the Print Report button is selected asking for the page number of the report and the
total number of pages. The report itself always fits on one letter-size
page. For tables, the starting page number is selected from the Table Options dialog. The number of pages depends on the temperature range as
well as the font size and is determined automatically by the software.
Adding this feature to the software made it necessary to create the table
twice: first to determine the number of pages, then to print the page numbers on each page. For this reason, it now takes twice as long to generate
a table.
1 Introduction
Features
If you want to create a document that includes the report and table, follow the
steps below:
a. Set the starting page for the table to “2”.
b. Print the table.
c. Print the report, setting the page number to “1” and the number of
pages to the same value that appears on the table.
d. If other pages need to included in the document, they may be inserted either before or after the report. Adjust the starting page number for the table and/or report accordingly.
4.
The table can now be printed in increments of 0.01°. Prior to version 2.2,
the minimum allowable increment was 0.1°.
Note: Generating tables over a large range using a small increment may
take a few minutes, especially on 386 and some 486 PCs.
5.
In conjunction with item 4 above, the default resolution for temperature
values on tables is now two decimal places.
Version 2.1.0.1
1.
Version 2.1 build 2.1.0.1 fixed a bug with the calculation of coefficients
and table values for ITS-90 Range 6.
2.
The resolutions that can be used now include up to 9 decimal places.
Prior to this version, the maximum number of decimal places was 7.
Version 2.1:
1.
Version 2.1 of TableWare has added the capability to calculate Polynomial coefficients for Platinum probes using a scale other than the scale of
the Reference readings. TableWare will automatically convert the Reference readings to the selected scale.
Version 2.0:
1.
A Print Preview window has been added so that reports and tables can be
viewed on-screen before printing.
2.
TableWare now allows tables to be exported to an ASCII text file. This
makes it possible to import the table into a spreadsheet or other
application.
3.
TableWare now has the capability of generating a table from coefficients
entered by the user. No raw data is required.
4.
The default printer may now be selected from the File menu. This option
allows the user to determine which printer (if more than one printer can
3
9933 TableWare
User’s Guide
be used) the reports and tables are printed to, or which printer driver is
used.
5.
1.4
The date that prints on the report and table can now be set by the user.
Requirements
TableWare requires certain computer hardware and software configurations in
order to execute properly.
1.4.1
Computer hardware
The following minimum computer configuration is required to use the
TableWare .
• IBM Compatible 386 PC with 4MB RAM minimum (IBM Compatible
486 PC with minimum 4MB RAM or later is recommended)
• VGA monitor or better
• 1 - CD-ROM/DVD drive for installation
• 1.5MB hard disk space for installation
1.4.2
Computer software
TableWare requires the following operating system:
• Windows® 95/98/NT
• Windows® 2000/XP
1.5
Installation
Note: Before installing TableWare, be sure to read the License Agreement
and Warranty.
A backup should always be made of your hard disk drive and registry before installing any software, and all running applications should be closed.
Note: To successfully install TableWare, you must be logged into Windows® as a Power User or an Administrator.
Installing TableWare
4
1.
Insert the TableWare CD-ROM into your CD-ROM drive. The Setup program should run automatically.
2.
Follow the on-screen instructions to install TableWare.
1 Introduction
International settings
3.
When prompted, enter the product serial number. The serial number is
provided on a sticker typically located on the CD pouch on the inside
back cover of the TableWare User’s Guide.
4.
After all files have been installed, a program group is created with icons
for the software, the Help file, the README.TXT file, and an icon to
uninstall the software. The installation process is complete.
5.
The README.TXT file can be displayed by checking the appropriate
check box before the setup program finishes. Read this file for important
information that was not available when the User Guide was printed.
Uninstalling TableWare
To uninstall the software, use the Windows® Add/Remove Programs icon in
the Control Panel. Follow the instructions given. The program files that were
installed to your system are removed. Any files that were created or saved by
users will not be removed from the system. These files, along with the folders
that these files are in, must be manually deleted using Windows® Explorer to
remove them from your system.
1.6
International settings
TableWare requires the following number settings to be set:
• The International Number format thousands separator must be set to a
comma (,)
• The International Number format decimal separator must be set to a period (.)
If your system does not use these settings by default, you must change your
system to use these settings using the Regional Settings or Regional Options
icon in the Control Panel.
1.7
Running TableWare
To launch TableWare, locate and click the icon created by the setup process.
The TableWare Main Display will be displayed.
1.8
TableWare main display
5
9933 TableWare
User’s Guide
The TableWare main display screen (Figure 1) displays the software menu and
toolbar.
Figure 1 TableWare Main Display Screen
Enabled and disabled
All menu items and toolbar icons are enabled.
Screen information
The TableWare screen is the main display for the software. The display area remains blank until a menu option or toolbar icon is selected.
To change TableWare default settings or exit the software, select the File menu.
To calculate coefficients, select the Coefficients menu. To generate a table, select the Table menu. To display the About screen or to get help, select the Help
menu.
1.8.1
TableWare toolbar
The toolbar provides quick access to the most common functions such as default settings, calculating the different types of probe coefficients, generating
tables, and help.
A description of the function of each toolbar button can be seen by placing the
mouse pointer over the button and waiting for approximately 1/2 second. A
help balloon appears indicating the function of the button. If a balloon does not
appear, make sure the “Show help balloons” check box on the File|Defaults
General tab is selected.
6
1 Introduction
TableWare main display
The following icons are available on the toolbar:
Defaults - Setup default settings
Platinum probe coefficient calculation - Calculate platinum probe
coefficients
Thermistor probe coefficient calculation - Calculate thermistor
probe coefficients
Thermocouple probe coefficient calculation - Calculate thermocouple probe coefficients
Platinum probe table generation - Generate a table for a platinum
probe
Thermistor probe table generation - Generate a table for a thermistor
probe
Thermocouple probe table generation - Generate a table for a thermocouple probe
Help - Opens the help file search dialog
7
2 File menu
Defaults
2
File menu
Figure 2 File Menu
The File menu (Figure 2) provides options for setting program defaults, selecting the default printer, and exiting the software.
Enabled and disabled
All menu options are enabled.
2.1
Defaults
The Defaults menu option displays the TableWare Defaults dialog (Figure 3)
for selecting or modifying program default settings.
Figure 3 TableWare Defaults dialog
9
9933 TableWare
User’s Guide
Enabled and disabled
All tabs are enabled at all times.
Dialog information
The TableWare Defaults dialog allows the user to set default values or parameters by selecting any of the three tabs; General, Tables, or Resolutions. The
General tab is for selecting TableWare setup defaults or preferences. The Tables
tab is for selecting the default settings specific to generated tables. The Resolutions tab is for specifying decimal place settings for reference readings, residuals, UUT readings, and CJC readings.
2.1.1
Defaults - General
The General tab (Figure 4) is displayed when the File|Defaults menu option is
selected and the tab labeled General is selected.
Figure 4
Defaults-General
Enabled and disabled
All controls are enabled at all times.
Dialog information
The File|Defaults General tab determines the default setting for software defaults or preferences.
10
2 File menu
Defaults
The “Show help balloons” check box toggles the display of the help balloons.
The default is selected which means the yellow help balloons are displayed
when the mouse pointer is placed over a button on the toolbar.
The “Prompt to enter date that appears on report” check box allows the user to
manually type in a date to appear on the report and/or table when printed.
Check this option if the data you are entering is from a calibration performed
previously. If this option is unchecked, the current date is printed on the report
and/or table.
The “Enable print preview window” check box forces the reports and tables to
be displayed in a preview window on-screen when printing. If this check box is
not selected, reports and tables are printed directly to the printer when the print
button is selected.
The “Select printer before printing reports and tables” check box forces the
software to display the Select Printer dialog when printing. The user can then
select the printer to which reports and tables are printed. If this check box is not
selected, reports and tables are printed on the default printer. To change the default printer, use the File|Setup Printer menu option.
The “Maximize print preview window” check box determines the size of the
Print Preview window. If this check box is selected, the Print Preview window
fills the entire screen.
The “Print preview window zoom setting” determines the default size of the report or table within the Print Preview window. The zoom setting is limited to
40% to 190%. The zoom setting can also be changed from the Print Preview
window once it is displayed.
11
9933 TableWare
User’s Guide
2.1.2
Defaults - Tables
The Tables tab (Figure 5) is displayed when the File|Defaults menu option is
selected and the tab labeled Tables is selected.
Figure 5 Defaults-Tables
Enabled and disabled
All controls are enabled at all times.
Dialog information
The File|Defaults Tables tab determines the default settings to use when generating tables.
The “Export delimiter” allows the user to specify the delimiter used to separate
values when exporting a table to an ASCII text file. The user may select either
a tab or a comma as the delimiter.
The “Starting page number” allows the user to select or enter a number for the
starting page number of the printed table. The starting page number must be between 1 and 10.
The “Font to use” allows the user to specify the font to use when printing the
table values. The list of fonts consists of all fonts supported by the default
printer. The font size can also be selected. The allowable font sizes are from 6
point to 12 point. A sample of the selected font is displayed below the font
selection.
12
2 File menu
Defaults
2.1.3
Defaults - Resolutions
The Resolutions tab (Figure 6) is displayed when the File|Defaults menu option
is selected and the tab labeled Resolutions is selected.
Figure 6 Defaults-Resolutions
Enabled and disabled
All controls are enabled at all times.
Dialog information
The File|Defaults Resolution tabs allows the user to select the decimal place
setting for the reference readings, residuals, UUT readings, and CJC readings.
The resolutions are selectable from 1 decimal place to 9 decimal places.
These settings are used when:
• The user enters data on the Raw Data dialogs (i.e. Raw Data for ITS-90
coefficients, Raw Data for Polynomial, CVD, IPTS-68 coefficients, Raw
Data for Thermocouple coefficients).
• The coefficients and residuals are previewed on the Coefficients and Residuals dialog.
• A report is printed.
• The data is exported to a text file.
13
9933 TableWare
User’s Guide
2.2
Setup printer
The setup printer menu option allows the user to select and configure the default printer. For TableWare, the orientation should always be set to “Portrait”
and the paper size should always be set to “Letter 8 ½ x 11 in” or “A4 210 x
297 mm”.
2.3
Exit
The Exit menu option exits TableWare.
14
3 Coefficients menu
Probe information
3
Coefficients menu
Figure 7 Coefficients menu
The Coefficients Menu (Figure 7) provides options for calculating coefficients
for Platinum, Thermistor, or Thermocouple probes.
Selecting one of the menu options displays the Probe Information dialog.
Enabled and disabled
All options are enabled at all times.
3.1
Probe information
The Probe Information dialog (Figure 8) is displayed from any of the Coefficients menu options.
Figure 8 Probe Information dialog
Enabled and disabled
The Continue button is enabled once both captions and values are entered.
15
9933 TableWare
User’s Guide
Dialog information
The Probe Information dialog allows the user to enter two captions and values
to identify the test probe or UUT (Unit Under Test) for which coefficients are
calculated. The captions default to “Model:” and “Serial:” but may be changed
as needed. Any text may be entered into the boxes provided. However, there is
limited space on the report and table to display this information.
3.2
Coefficients
The coefficient dialog which is displayed after the Continue button is selected
from the Probe Information dialog, is dependent on the Coefficients menu option selected.
3.2.1
Platinum probe
The Platinum Probe Coefficients dialog (Figure 9) is displayed when the Continue button is selected from the Probe Information dialog and the coefficients
being calculated are for a platinum probe.
Figure 9 Platinum Probe Coefficients dialog (ITS-90 selected)
Enabled and disabled
All options are enabled at all times.
Dialog information
The choices for platinum probes are ITS-90, IPTS-68, Callendar-Van Dusen,
and Polynomial. Depending on the coefficient type, additional information may
or may not be required.
• If the type selected is ITS-90, the low range and high range selection are
required. The choices for low range are Range 4, Range 5, or None. The
16
3 Coefficients menu
Coefficients
default is Range 4. The choices for high range are Range 6 through Range
11, or None. The default is Range 8.
• If the type selected is Polynomial, the order of the polynomial is required.
The order is selectable from 3rd to 9th order. The default for platinum
probes is 4th order. The number of coefficients calculated is one more
than the order of the polynomial (i.e. for a 4th order polynomial, 5 coefficients are calculated). The minimum number of set-points needed must
exceed the order by 1 or more.
• If the type selected is IPTS-68 or Callendar-Van Dusen, additional information is not required.
The Continue button displays the Raw Data dialog for the selected type of
coefficients.
The Cancel button returns to the TableWare main display.
3.2.2
Thermistor probe
The Thermistor Probe Coefficients dialog (Figure 10) is displayed when the
Continue button is selected from the Probe Information dialog and the coefficients being calculated are for a thermistor probe.
Figure 10 Thermistor Probe Coefficients dialog
Enabled and disabled
All options are enabled at all times.
Dialog information
The only type of coefficients that can be calculated for thermistor probes is
polynomial. Both T(R) and R(T) polynomial coefficients are calculated.
17
9933 TableWare
User’s Guide
Note: The accepted thermistor model is based upon the logarithmic resistance-temperature characteristic in terms of absolute temperature (Kelvin). The accuracy of a model based upon °F or °C has not been tested.
Therefore, TableWare always calculates polynomial coefficients for thermistor probes using Kelvin. If Reference readings are entered in °F or °C,
TableWare converts the readings to their Kelvin equivalent values before
the fit is computed.
Valid orders of the polynomial are from 3rd to 6th order. The default for thermistor probes is 3rd order. The number of coefficients calculated is one more
than the order of the polynomial (i.e. for a 3rd order polynomial, 4 coefficients
are calculated). The minimum number of set-points needed must exceed the order by 1 or more.
The user is allowed to select whether or not the Steinhart-Hart method is used
when the coefficients are calculated. When Steinhart-Hart is selected, the third
coefficient (squared term) is set to 0.0. Refer to Section 3.7.4, Polynomial Coefficients for more information about the Steinhart-Hart method.
The Continue button displays the Raw Data for Polynomial dialog.
The Cancel button returns to the TableWare main display.
3.2.3
Thermocouple probe
The Thermocouple Probe Coefficients dialog (Figure 11) is displayed when the
Continue button is selected from the Probe Information dialog and the coefficients being calculated are for a thermocouple probe.
Figure 11 Thermocouple Probe Coefficients dialog
Enabled and disabled
All options are enabled at all times.
18
3 Coefficients menu
Raw data
Dialog information
The type of coefficient choices are: B, E, J, K, N, R, S, T, and Gold-Platinum.
The default is Type K.
The temperature range is dependent on the thermocouple type. Thermocouple
Requirements are explained in Section 3.7.5.
The Continue button displays the Raw Data dialog for Thermocouple
coefficients.
The Cancel button returns to the TableWare main display.
3.3
Raw data
The Raw Data dialog is formatted for either ITS-90, Polynomial, CVD,
IPTS-68, or Thermocouples depending on the type of coefficients selected.
3.3.1
ITS-90 coefficients
This Raw Data dialog (Figure 12) is displayed when the Continue button is selected from the Platinum Probe Coefficients dialog and ITS-90 is selected as
the type of coefficients to calculate.
Figure 12 Raw Data dialog for ITS-90 coefficients
19
9933 TableWare
User’s Guide
Enabled and disabled
The Calculate button is not enabled until the required data is entered and the
scales are selected.
Dialog information
The user must select the Reference Scale and UUT Scale and enter Reference
Temperatures and UUT Resistances for the Triple Point of Water, Low Range,
and High Range, as applicable.
The choices for the reference scale are °C, °F, or K. The choices for the UUT
scale are Ohms or KOhms.
The reference temperatures are the temperature readings taken from the reference probe at the nominal temperatures. The UUT resistances are the readings
taken from the test probes at the nominal temperatures.
The yellow boxes designate the values that must be filled in for the type of coefficients being calculated to produce an exact solution. Entering values into
the white boxes is optional and produces an overdetermined solution. Section
3.8, Methods Used for Calculating Coefficients, contains additional
information.
The Import button reads raw data in from an ASCII text file. The data must be
stored in the text file in the format required for calculating ITS-90 coefficients.
The import file format for ITS-90 coefficients is discussed in Section 3.4.1.
The Export button saves the current raw data to an ASCII text file.
The Calculate button calculates the coefficients and displays the Coefficients
and Residuals dialog.
The Cancel button returns to the Platinum Probe Coefficients dialog.
3.3.2
Polynomial, CVD, and IPTS-68 coefficients
This Raw Data dialog (Figure 13) is displayed when the Continue button is selected from the Platinum Probe Coefficients dialog and either Polynomial,
20
3 Coefficients menu
Raw data
Callendar-Van Dusen (CVD), or IPTS-68 is selected as the type of coefficients
to calculate or from the Thermistor Probe Coefficients dialog.
Figure 13 Raw Data dialog for polynomial, CVD, and IPTS-68
coefficients
Enabled and disabled
The Calculate button is not enabled until the required data is entered and the
scales are selected.
Dialog information
The user must select the Reference Scale and UUT Scale and enter Reference
Temperatures and UUT Resistances.
The choices for the reference scale are °C, °F, or K. The choices for the UUT
scale are Ohms or KOhms.
The reference temperatures are the temperature readings taken from the reference probe at the nominal temperatures. The UUT resistances are the readings
taken from the test probes at the nominal temperatures.
The yellow boxes designate the values that must be filled in for the type of coefficients being calculated to produce an exact solution. Entering values into
the white boxes is optional and produces an overdetermined solution. Section
21
9933 TableWare
User’s Guide
3.8, Methods Used for Calculating Coefficients, contains additional
information.
The Import button reads raw data in from an ASCII text file. The data must be
stored in the text file in the format required for calculating Polynomial, CVD,
or IPTS-68 coefficients. The import file format for Polynomial, CVD, or
IPTS-68 coefficients is discussed in Section 3.4.2.
The Export button saves the current raw data to an ASCII text file.
The Calculate button calculates the coefficients and displays the Coefficients
and Residuals dialog.
The Cancel button returns to the Platinum Probe Coefficients or Thermistor
Probe Coefficients dialog.
When calculating Polynomial coefficients for Platinum probes, the Select Calculation Scale dialog (Figure 14) is displayed.
Figure 14 Select Calculation Scale dialog
Many readout instruments that accept Polynomial coefficients require that the
coefficients be calculated using Reference readings in a particular temperature
scale. This feature allows Reference readings to be used as entered on the Raw
Data dialog (with no conversion) or to be converted automatically to Kelvin by
TableWare. Prior to version 2.1, TableWare always calculated Polynomial coefficients after converting the Reference readings to Kelvin.
Note1: TableWare does not provide the option of converting Reference readings from °F to °C nor vice-versa. Also, if Reference readings were entered in
Kelvin, the Select Calculation Scale dialog will not appear and Polynomial coefficients will automatically be calculated using Kelvin.
Note2: The accepted thermistor model is based upon the logarithmic resistance-temperature characteristic in terms of absolute temperature (Kelvin). The
accuracy of a model based upon °F or °C has not been tested. Therefore, TableWare always calculates polynomial coefficients for thermistor probes using
Kelvin. If Reference readings are entered in °F or °C, TableWare converts the
readings to their Kelvin equivalent values before the fit is computed.
22
3 Coefficients menu
Raw data
3.3.3
Thermocouple coefficients
This Raw Data dialog (Figure 15) is displayed when the Continue button is selected from the Thermocouple Probe Coefficients dialog.
Figure 15 Raw Data dialog for thermocouple coefficients
Enabled and disabled
The Calculate button is not enabled until the required data is entered and the
scales are selected.
Dialog information
The user must select the Reference Scale and UUT Scale, and enter Reference
Temperatures and UUT Voltages. The CJC Scale and CJC Readings are
optional.
The choices for the reference scale are °C, °F, or K. The choices for the UUT
scale are mV or μV. The choices for the CJC scale are °C, °F, mV, or μV. If
CJC readings are not entered, a scale does not need to be selected.
The reference temperatures are the temperature readings taken from the reference probe at the nominal temperatures. The UUT voltages are the readings
taken from the test probes at the nominal temperatures. The Cold Junction
Compensation (CJC) readings are taken from the test probe at the nominal temperatures. The CJC readings are optional (see Section 3.4.3).
23
9933 TableWare
User’s Guide
Note: If CJC readings are entered in temperature, the standard thermocouple coefficients for the selected thermocouple type are used to calculate the voltage at each reading. The calculated voltages are then added to
each corresponding UUT reading before calculating characterization coefficients for the UUT. If CJC readings are entered in voltage, they are
converted to the correct scale (i.e. mV or µV) and added to each corresponding UUT reading.
The yellow boxes designate the values that must be filled in for the type of coefficients being calculated to produce an exact solution. Entering values into
the white boxes is optional and produces an overdetermined solution. Section
3.8, Methods Used for Calculating Coefficients, contains additional
information.
Note: The algorithm used to calculate thermocouple coefficients forces
the EMF at 0°C to 0.0µV. Therefore, using a set-point at or near 0°C when
calculating thermocouple coefficients may cause erroneous results. For
best results, use at least two set-points that are not near 0°C (more than
±5°C).
The Import button reads raw data in from an ASCII text file. The data must be
stored in the text file in the format required for calculating Thermocouple coefficients. The import file format for thermocouple coefficients is discussed in
Section 3.4.3.
The Export button saves the current raw data to an ASCII text file.
The Calculate button calculates the coefficients and displays the Coefficients
and Residuals dialog.
A warning message will appear when calculating thermocouple coefficients if
one of the selected set-points is within 5° of 0°C. Selecting the OK button will
attempt to calculate the coefficients. For best results, use at least two set-points
that are not near 0°C (more than ±5°C).
The Cancel button returns to the Thermocouple Probe Coefficients dialog.
3.4
Import/export file format
The format of the import/export ASCII text file is dependent upon the type of
coefficients to be calculated. The following sections explain the required format
for each type of import/export file.
3.4.1
ITS-90 coefficients
The raw data for calculating ITS-90 coefficients can be imported from an
ASCII text file or exported to an ASCII text file by selecting the Import or Export button respectively on the Raw Data dialog. The file containing the import/export raw data should be saved with a .TXT extension.
24
3 Coefficients menu
Import/export file format
Note: The International Settings must be set according to the information
in the Installation section before attempting to import or export raw data.
For ITS-90 coefficients, the file must follow the format outlined in Figure 16.
A comma “,” should only be used to separate two distinct values. Do not
use the comma as a thousands separator.
The first and second lines consist of the temperature and corresponding resistance at the Triple-Point of Water (TPW). There can be only one value on each
of these lines. Other values, if any, are ignored.
The third line must be blank.
The fourth and fifth lines consist of each temperature and corresponding
resistances used to calculate the low range coefficients. There may be up to 10
values on each line and the values must be separated by commas. Additional
values, if any, are ignored. When calculating only high range coefficients, the
fourth and fifth lines must contain only the letters “N/A”.
The sixth line must be blank.
The seventh and eighth lines consist of each temperature and corresponding
resistances used to calculate the high range coefficients. There may be up to 10
values on each line and the values must be separated by commas. Additional
values, if any, are ignored. When calculating only low range coefficients, the
seventh and eighth lines must contain only the letters “N/A”.
temperature1TPW
resistance1TPW
temperature1Low,temperature2Low,temperature3Low,...,temperatureNLow
resistance1Low,resistance2Low,resistance3Low,...,resistanceNLow
temperature1High,temperature2High,temperature3High,...,temperatureNHigh
resistance1High,resistance2High,resistance3High, ...,resistanceNHigh
Figure 16 Import file format for ITS-90 coefficients
25
9933 TableWare
User’s Guide
Example: ASCII text file for ITS-90 (both low and high range) coefficients.
0.010
100.025
–100.00,-38.843
59.2564,83.2587
156.6056,232.0110,419.4314,660.4325
160.2546, 88.6534,256.1023,356.1245
Example: ASCII text file for ITS-90 (low range only) coefficients.
0.010
100.025
–100.00,-38.843
59.2564,83.2587
N/A
N/A
Example: ASCII text file for ITS-90 (high range only) coefficients.
0.010
100.025
N/A
N/A
156.6056,232.0110,419.4314,660.4325
160.2546, 88.6534,256.1023,356.1245
Note: If a specific set of temperature set-points are used repeatedly, an
import/export file can be created which contains only the temperatures.
The line(s) that normally contain the resistance or voltage information can
be left blank. From the Raw Data dialog, select the Import button to import the file, then enter the resistance data.
26
3 Coefficients menu
Import/export file format
3.4.2
Polynomial, CVD, and IPTS-68 coefficients
The raw data for calculating Polynomial, CVD and IPTS-68 coefficients can be
imported from an ASCII text file or exported to and ASCII file by selecting the
Import or export button on the Raw Data dialog.The file containing the import/export raw data should be saved with a .TXT extension.
Note: The International Settings must be set according to the information
in the Installation section before attempting to import or export raw data.
For Polynomial, Callendar-Van Dusen, and IPTS-68 coefficients, the file must
follow the format outlined below in Figure 17.
A comma “,” should only be used to separate two distinct values. Do not
use the comma as a thousands separator.
The first line consists of each temperature to be used to calculate the coefficients. The temperatures do not need to be in any specific order.
The second line consists of the resistances corresponding to each of the temperatures in line 1. The order of the resistances must match the order of the temperatures (i.e. resistance1 must be the resistance at temperature1, resistance4
must be the resistance at temperature4, etc.)
temperature1,temperature2,temperature3,temperature4,...,temperatureN
resistance1,resistance2,resistance3,resistance4,...,resistanceN
Figure 17 Import file format for polynomial, CVD, and IPTS-68 coefficients
Example: ASCII text file for Polynomial coefficients (Platinum probes).
–100.00,0.000,100.000,200.000
59.2564,100.043,139.2545,177.2587
Example: ASCII text file for Polynomial coefficients (Thermistor probes).
0.000,20.000,40.000,60.000
75427.01,43348.02,25781.14,15830.95
Example: ASCII text file for Callendar-Van Dusen coefficients.
–100.00,-40.000,0.000,200.000,400.00
59.2564,82.2547,100.043,177.2587,249.4801
27
9933 TableWare
User’s Guide
Example: ASCII text file for IPTS-68 coefficients.
–100.00,0.000,232.0110,419.4314
59.2564,100.025,188.6534,256.1023
Note: If a specific set of temperature set-points are used repeatedly, an
import/export file can be created which contains only the temperatures.
The line(s) that normally contain the resistance or voltage information can
be left blank. From the Raw Data dialog, select the Import button to import the file, then enter the resistance data.
3.4.3
Thermocouple coefficients
The raw data for calculating Thermocouple coefficients can be imported from
an ASCII text file or exported to an ASCII text file by selecting the Import or
export button respectively on the Raw Data dialog. The file containing the import/export raw data should be saved with a .TXT extension.
Note: The International Settings must be set according to the information
in the Installation section before attempting to import or export raw data.
For Thermocouple coefficients, the file must follow the format outlined in Figure 18.
A comma “,” should only be used to separate two distinct values. Do not
use the comma as a thousands separator.
The first line consists of each temperature to be used to calculate the coefficients. The temperatures do not need to be in any specific order.
The second line consists of the voltages corresponding to each of the temperatures in line 1. The order of the voltages must match the order of the temperatures (i.e. voltage1 must be the voltage at temperature1, voltage4 must be the
voltage at temperature4, etc.)
The third line is optional and contains the CJC values corresponding to each of
the temperature/voltage pairs. Each voltage reading is compensated according
to the corresponding CJC value before coefficients are calculated.
temperature1,temperature2,temperature3,temperature4,...,temperatureN
voltage1,voltage2,voltage3,voltage4,...,voltageN
[cjc1,cjc2,cjc3,...,cjcN]
Figure 18 Import file format for thermocouple coefficients
28
3 Coefficients menu
Coefficients and residuals
If the third line does not exist, this software does not compensate the voltage
readings.
Example: ASCII text file for Thermocouple coefficients.
–100.0,0.0,100.0,200.0,300.0
–5506.65,0.02,6322.54,13413.47
–0.02,–0.02,0.01,–0.02,–0.02
Note: If a specific set of temperature set-points are used repeatedly, an
import/export file can be created which contains only the temperatures.
The line(s) that normally contain the resistance or voltage information can
be left blank. From the Raw Data dialog, select the Import button to import the file, then enter the resistance data.
3.5
Coefficients and residuals
The Coefficients and Residuals dialog (Figure 19) is displayed when the Calculate button is selected from the Raw Data dialog.
Figure 19 Coefficients and Residuals dialog
Enabled and disabled
The Set-points and Residuals list is disabled when calculating IPTS-68 coefficients because residuals are not calculated.
29
9933 TableWare
User’s Guide
Dialog information
The calculated coefficients are displayed in the Coefficients list. Use the scroll
bar, if necessary, to view the coefficients. The set-points used to calculate the
coefficients and the resulting residuals are displayed in the Set-points and Residuals list. Use the scroll bar, if necessary, to view the set-points and residuals.
If ITS-90 coefficients were calculated, the set-points used for the low and the
high ranges (as applicable) are displayed in separate sections. The Triple-Point
of Water set-point does not appear in the Set-points and Residuals list because
the residual at the Triple-Point of Water is always 0.0.
The Export button writes the identifying information that was entered on the
Probe Information dialog, date, raw data, and coefficients to an ASCII text file.
The format of this file is similar to the printed report.
The Print Report button displays the Enter Date and the Page Numbering
dialogs before printing the report. See descriptions of these two dialogs below.
The report is then printed. The report consists of the identifying information
that was entered on the Probe Information dialog, the date, raw data and
coefficients.
To view the report in a preview window before sending it to the printer, or to
select the printer before printing the report, see the File|Defaults General tab.
The Print Preview window is discussed in section 3.10.
If the “Prompt to enter date that appears on report” check box on the File|Defaults General tab is checked, the Enter Date dialog appears (Figure 20). Enter
the date exactly as it is to appear on the report. No formatting or validation is
performed on the text entered on this dialog. Checking the “Use current date by
default” check box disables the display of this dialog and uses the current date.
Figure 20 Enter Date dialog
The Page Numbering dialog is displayed before the report is printed. Enter the
starting page and total number of pages in the boxes provided. The report
30
3 Coefficients menu
Coefficients and residuals
should always fit on one letter-size (A4) sheet of paper. Select the OK button to
print the report.
Figure 21 Page Numbering dialog
The Table Options button displays the Table Options dialog for generating a
Table.
The Back button displays the Raw Data dialog.
The Close button returns to the TableWare main display.
3.5.1
Table options
The Table Options dialog (Figure 22) is displayed when the Table Options but-
31
9933 TableWare
User’s Guide
ton is selected on the Coefficients and Residuals dialog or when the OK button
is selected on the Enter Coefficients dialog.
Figure 22 Table Options dialog
Enabled and disabled
Controls on the Resolutions tab are disabled unless the “Use custom resolutions” option is selected.
Dialog information
The Table Options dialog allows the user to set parameters for generating a table by selecting any of the three tabs; Type and Range, Resolutions, and Other
Settings. The Type and Range tab is for selecting the type of table, temperature
scale, range of temperatures and step size. The Resolutions tab is for specifying
decimal settings for temperature, calculated values, and other resolutions. The
Other Settings tab is for setting the export delimiter, starting page number, font
and font size.
The Export button writes the identifying information that was entered on the
Probe Information dialog, coefficient type, table type and table data to an
ASCII text file. The table data is separated by the delimiter specified on the
Other Settings tab.
The Print Table button generates and prints the table to the default printer.
When you select the Print Table button, your ranges are checked against the Table Temperature Ranges chart (see Section 3.6). If your selected temperatures
exceed the values on the table, a warning message is displayed stating that values beyond the table values will be extrapolated.
If the “Prompt to enter date that appears on report” check box on the File|Defaults General tab is checked, the Enter Date dialog (Figure 20) appears after
32
3 Coefficients menu
Coefficients and residuals
selecting either the Export or Print Table button.Enter the date exactly as it is to
appear on the report. No formatting or validation is performed on the text entered on this dialog. Checking the “Use current date by default” check box disables the display of this dialog and uses the current date.
To view the report in a Print Preview window before sending it to the printer, or
to select the printer before printing the report, see the File|Defaults General tab.
The Print Preview window is discussed in Section 3.10.
Note: If the values in the table columns overlap when displayed in the
Print Preview window or when printed, reduce the number of decimal
places used (see Table Options – Resolutions tab) or reduce the font point
size used (see Table Options – Other Settings tab).
The Close button returns to the Coefficients and Residuals dialog if coefficients
were generated or to the TableWare main display if coefficients were entered
manually.
3.5.1.1
Table options—type and range
The Type and Range tab is displayed after selecting the Type and Range tab on
the Table Options dialog.
Figure 23 Table Options - Type and Range
Enabled and disabled
All controls are enabled at all times.
33
9933 TableWare
User’s Guide
Dialog information
The Type and Range tab allows the user to select the type of table to generate
and the temperature range for the table. The choices for the type of table are:
• Temperature vs. Resistance - For ITS-90, IPTS-68, Callendar-Van Dusen,
and Polynomial coefficients
• Temperature vs. Ratio - For ITS-90 and IPTS-68 coefficients only
• Temperature vs. EMF (μV) - For Thermocouple coefficients only
• Temperature vs. EMF (mV) - For Thermocouple coefficients only
The choices for temperature scales are °C, °F, and K. The temperature scale
defaults to the Reference Scale selected on the Raw Data dialog when coefficients are calculated or to °C when generating a table after entering
coefficients.
The minimum temperature, maximum temperature and step size must be entered. These values are in the currently selected temperature scale. The minimum temperature and maximum temperature values are limited to –270°C and
2650°C (–454°F and 4802°F) respectively. However, the equations used to generate table values may not be able to calculate values over the full range. If a
message is displayed during calculations stating that a calculation error occurred, you may need to increase the minimum temperature or decrease the
maximum temperature. The Table Temperature Ranges chart in Section 3.6 lists
the recommended ranges for generating tables.
Note: Changing the selected temperature scale converts the minimum and
maximum temperature values to that scale.
The step size is the increment between each temperature value on the table. The
step size must be between 0.01 and 100.00. The step size defaults to 1.00.
Below the temperature settings are various options for the selected type of
table.
• For Temperature vs. Resistance tables, the first derivative value can be
printed by selecting the “Print first derivative (dr/dT)” option.
• For Temperature vs. Ratio tables, the inverse difference value can be
printed by selecting the “Print inverse difference (dT/dW)” option.
• For Temperature vs. EMF (μV) tables, the error value can be printed by
selecting the “Print Error (μV)” option.
• For Temperature vs. EMF (mV) tables, selecting the “Print Error (mV)”
option can print the error value.
3.5.1.2
Table options—resolutions
The Resolutions tab is displayed after selecting the Resolutions tab on the Table Options dialog.
34
3 Coefficients menu
Coefficients and residuals
Enabled and disabled
The resolution selection boxes are disabled unless the “Use custom resolutions”
option is selected.
Dialog information
The Resolutions tab allows the user to specify the resolutions to use when
printing table values. There are two options: “Use default resolutions” and “Use
custom resolutions”.
Figure 24 Table Options - Resolutions
When the “Use default resolutions” option is selected, the values on the table
are printed using the default method: temperature values are always 2 decimal
places and all other values depend upon the magnitude of the value:
For values between –10 and 10: seven decimal places
For values between –100 and 100: six decimal places
For values between –1,000 and 1,000: five decimal places
For values between –10,000 and 10,000: four decimal places
For values between –100,000 and 100,000: three decimal places
All other values: two decimal places
When the “Use custom resolutions” option is selected, the values on the table
are printed using the formats selected by the user. Select the format for temperature readings with the Temperature drop-down list. Select the format for resistance, ratio or voltage readings with the appropriate drop-down list. Select the
format for the first derivative, inverse difference or error readings with the appropriate drop-down list.
35
9933 TableWare
User’s Guide
3.5.1.3
Table options—other settings
The Other Settings tab is displayed after selecting the Other Settings tab on the
Table Options dialog.
Figure 25 Table Options - Other Settings
Enabled and disabled
All controls are enabled at all times.
Dialog information
The Other Settings tab allows the user to select the delimiter for exporting tables and the starting page number and font for printing tables. These values default to the values specified on the File|Defaults Tables tab.
The Export delimiter allows the user to specify the delimiter used to separate
values when exporting a table to an ASCII text file. The user may select either
a Tab or a Comma as the delimiter.
The Starting page number allows the user to specify the page numbers printed
on the table report. The starting page number must be between 1 and 10.
The font type and size can also be selected by the user. The list of fonts consists
of all fonts supported by the default printer. Allowable font sizes are from 6
point to 12 point. A sample of the selected font is displayed below the font
selection.
3.6
Table temperature range chart
Due to the nature of the equations used to generate tables, the temperature
range that can or should be used to generate a table depends on the type of co-
36
3 Coefficients menu
Table temperature range chart
efficients used. See Table 1 on page 37 for details on the temperature range for
specific coefficients.
Table 1
Recommended table temperature ranges
ITS-90
°F
°C
Range
K
0.0
0.0
Max Temp
0.0
30.0
962.0
660.0
420.0
232.0
157.0
30.0
Min Temp
-308.2
–38.2
32.0
32.0
32.0
32.0
32.0
32.0
Max Temp
32.0
86.0
1763.6
1220.0
788.0
449.6
314.0
86.0
Min Temp
84.2
234.2
273.2
273.2
273.2
273.2
273.2
273.2
Max Temp
273.2
303.2
1235.2
933.2
693.2
505.2
430.2
303.2
Min Temp
–230.0
Max Temp
2650.0
Min Temp
–382.0
Max Temp
4802.0
Min Temp
43.2
Max Temp
2923.2
Min Temp
0.0
–260.0
Max Temp
2650.0
2650.0
Min Temp
32.0
–436.0
Max Temp
4802.0
4802.0
Min Temp
273.2
13.2
Max Temp
2923.2
2923.2
Polynomial
Probe Type
Platinum
Thermistor
Min Temp
–260.0
–10.0
Max Temp
1480.0
200.0
Min Temp
–436.0
14.0
Max Temp
2696.0
392.0
Min Temp
13.2
263.2
Max Temp
1753.2
473.2
Thermocouple
Type Range
B
1
B
2
E
1
E
2
J
1
J
2
K
1
K
2
N
1
N
2
R
1
R
2
R
3
R
N/A*
S
1
S
2
S
3
S
N/A*
T
1
T
2
th
AuPt 8 Order
AuPt 9th Order
Min Temp
0.0
631.0
–270.0
0.0
–210.0
760.0
–270.0
0.0
–270.0
0.0
–50.0
1064.0
1664.0
-50.0
–50.0
1064.0
1664.0
–50.0
–270.0
0.0
0.0
0.0
Max Temp
631.0
1820.0
0.0
1000.0
760.0
1200.0
0.0
1372.0
0.0
1300.0
1064.0
1664.0
1768.0
1768.0
1064.0
1664.0
1768.0
1768.0
0.0
400.0
1000.0
1000.0
Min Temp
32.0
1167.8
–454.0
32.0
–346.0
1400.0
–454.0
32.0
–454.0
32.0
–58.0
1947.2
3027.2
–58.0
–58.0
1947.2
3027.2
–58.0
–454.0
32.0
32.0
32.0
Max Temp
1167.8
3308.0
32.0
1832.0
1400.0
2192.0
32.0
2501.6
32.0
2372.0
1947.2
3027.2
3214.4
3214.4
1947.2
3027.2
3214.4
3214.4
32.0
752.0
1832.0
1832.0
Min Temp
273.2
904.2
3.1
273.2
63.2
1033.2
3.1
273.2
3.1
273.2
223.2
1337.2
1937.2
223.2
223.2
1337.2
1937.2
223.2
3.1
273.2
273.2
273.2
Max Temp
904.2
2093.2
273.2
1273.2
1033.2
1473.2
273.2
1645.2
273.2
1573.2
1337.2
1937.2
2041.2
2041.2
1337.2
1937.2
2041.2
2041.2
273.2
673.2
1273.2
1273.2
4
5
6
7
8
9
10
11
Min Temp
–189.0
–39.0
0.0
0.0
0.0
0.0
IPTS-68
CVD
BETA
No
Yes
*This range can be selected by choosing the “–50.0°C to 1768.1°C (using extrapolation)” option.
37
9933 TableWare
User’s Guide
3.7
Requirements for calculating coefficients
Certain requirements apply depending on the type of coefficients being
calculated.
3.7.1
ITS-90 coefficients
The following requirements must be met when ITS-90 is selected as the type of
coefficients to calculate for Platinum probes. For more information concerning
the method used to calculate the ITS-90 coefficients, see Section 3.8, Methods
Used for Calculating Coefficients.
1.
The reference probe readings must be in temperature (°C, °F or K).
2.
The UUT (test probe) readings must be in resistance (Ohms or KOhms).
3.
At least 2 set-points must be used, but no more than 21 set-points can be
used. The actual minimum and maximum number of set-points that can
be used depends on the selected Low Range and High Range.
4.
There must be one set-point within a few degrees of the Triple Point of
Water (preferably as close to it as possible).
5.
Low Range criteria:
a) The following Low Ranges can be selected
i)
None
ii) ange 4 (-189.3442°C to 0.01°C)
iii) Range 5 (-38.8344°C to 29.7646°C)
b) Both Ranges 4 and 5 require the Triple Point of Water set-point and
at least 2 and no more than 10 additional set-points.
c) All set-points should fall within the temperature range of the selected Low Range.
6.
High Range criteria:
a) The following High Ranges can be selected
i)
None
ii) Range 6 (0.0°C to 961.78°C)
iii) Range 7 (0.0°C to 660.323°C)
iv) Range 8 (0.0°C to 419.527°C)
v) Range 9 (0.0°C to 231.928°C)
vi) Range 10 (0.0°C to 156.5985°C)
vii) Range 11 (0.0°C to 29.7646°C)
38
3 Coefficients menu
Requirements for calculating coefficients
b) All Ranges require the Triple Point of Water set-point and the
following:
i)
Range 6 requires at least 4 and no more than 10 set-points.
ii) Range 7 requires at least 3 and no more than 10 set-points.
iii) Ranges 8 and 9 require at least 2 but no more than 10 set-points.
iv) Ranges 10 and 11 require at least 1 but no more than 10
set-points.
c) All set-points should fall within the temperature range of the selected High Range.
7.
Selecting None for both the Low Range and the High Range is not
permitted.
8.
The following ITS-90 coefficients are calculated for each range:
a) RTPW (always calculated)
b) Low Ranges
i)
Range 4: a4 and b4
ii) Range 5: a5 and b5
c) High Ranges
i)
Range 6: a6, b6, c6 and d
ii) Range 7: a7, b7 and c7
iii) Range 8: a8 and b8
iv) Range 9: a9 and b9
v) Range 10: a10
vi) Range 11: a11
9.
3.7.2
Residuals are calculated for each set-point used in calculating the coefficients with the exception of the Triple Point of Water set-point. Residuals
are always in the same scale as the Reference Probe readings.
IPTS-68 coefficients
The following requirements must be met when IPTS-68 is selected as the type
of coefficients to calculate for Platinum probes. For more information concerning the method used to calculate the IPTS-68 coefficients, see Section 3.8,
Methods Used for Calculating Coefficients.
1.
The Reference Probe readings must be in temperature (°C, °F or K).
2.
The UUT (test probe) readings must be in resistance (Ohms or KOhms).
3.
Exactly 4 set-points must be used:
39
9933 TableWare
User’s Guide
a) One set-point must be within a few degrees of 0°C (32°F or
273.15K) (preferably as close to 0°C as possible).
b) One set-point must be below 0°C.
c) Two set-points must be above 0°C.
4.
The following IPTS-68 coefficients are always calculated:
a) R0
b) ALPHA
c) DELTA
d) a4
e) c4
5.
3.7.3
Residuals are not calculated when calculating IPTS-68 coefficients.
Callendar-Van Dusen coefficients
The following requirements must be met when Callendar-Van Dusen is selected
as the type of coefficients to calculate for Platinum probes. For more information concerning the method used to calculate the Callendar-Van Dusen coefficients, see Section 3.8, Methods Used for Calculating Coefficients.
1.
The Reference Probe readings must be in temperature (°C, °F or K).
2.
The UUT (test probe) readings must be in resistance (Ohms or KOhms).
3.
At least 3 set-points must be used but no more than 10 set-points can be
used. If any one of the set-points is below 0°C (32°F or 273.15K), at
least 4 set-points must be used.
Note: This software automatically determines if the BETA coefficient
needs to be calculated based on the following criteria:
• The Reference reading closest to 0°C is not used to determine whether
BETA is calculated.
• If any other Reference reading is below 0°C, BETA will be calculated.
• Otherwise, BETA will not be calculated.
4.
One of the set-points used should be close to 0°C. This is not a requirement, however results of the calculations become less reliable when no
reading is near 0°C because the software must interpolate the reading at
0°C based on the readings provided.
5.
The following Callendar-Van Dusen coefficients are calculated:
a) R0
b) ALPHA
40
3 Coefficients menu
Requirements for calculating coefficients
c) DELTA
d) BETA (only calculated if criteria explained above is met)
6.
3.7.4
Residuals are calculated for each set-point used in calculating the coefficients. Residuals are always in the same scale as the Reference Probe
readings.
Polynomial Coefficients
The following requirements must be met when Polynomial is selected as the
type of coefficients to calculate for Platinum or Thermistor probes. For more
information concerning the method used to calculate the Polynomial coefficients, see Section 3.8, Methods Used for Calculating Coefficients.
1.
The Reference Probe readings must be in temperature (°C, °F or K).
Note: The accepted thermistor model is based upon the logarithmic resistance-temperature characteristic in terms of absolute temperature (Kelvin). The accuracy of a model based upon °F or °C has not been tested.
Therefore, TableWare always calculates polynomial coefficients for thermistor probes using Kelvin. If Reference readings are entered in °F or °C,
TableWare converts the readings to their Kelvin equivalent values before
the fit is computed.
2.
The UUT (test probe) readings must be in resistance (Ohms or KOhms).
3.
The order of the polynomial must be selected. Allowable choices are
from 3rd order to 9th order for platinum probes, and from 3rd to 6th or der for thermistor probes.
4.
For thermistor probes, the Steinhart-Hart method may be selected. Studies have indicated no significant loss in accuracy when using the
Steinhart-Hart method (eliminating the squared term) over the range of
–2°C to 70°C (28°F to 158°F). The formula used when the
Steinhart-Hart method is selected is:
1
= a + bln( RT ) + dln( RT )
T
For more information on this topic, refer to “Worldwide Capability in Thermistors”, Thermometrics, Inc., 1993, pages 14–15.
5.
For normal calculations, at least 4 set-points must be used but no more
than 10 set-points can be used.
6.
For Steinhart-Hart calculations, only 3 set-points should be used.
7.
The minimum number of set-points used must exceed the order of the
polynomial by at least 1 (i.e. for a 5th order polynomial, at least 6
set-points must be used).
8.
The following Polynomial coefficients are calculated:
41
9933 TableWare
User’s Guide
a) T(R)—Temperature as a function of Resistance: A, B, ... N (depending on the order of the polynomial)
b) R(T)—Resistance as a function of Temperature: a, b, ... n (depending on the order of the polynomial)
9.
3.7.5
Residuals are calculated for each set-point used in calculating the coefficients. Residuals are always in the same scale as the reference probe
readings. For Platinum probes, the residuals are in degrees. For Thermistor probes, residuals are in millidegrees.
Thermocouple coefficients
The following requirements must be met when calculating coefficients for
Thermocouple probes. For more information concerning the method used to
calculate the Thermocouple coefficients, see Section 3.8, Methods Used for
Calculating Coefficients.
1.
The Reference Probe readings must be in temperature (°C, °F or K).
2.
The UUT (test probe) readings must be in Voltage (mV or μV). At least
2 set-points must be used, but no more than 10 set-points can be used.
Note: The algorithm used to calculate thermocouple coefficients forces
the EMF at 0°C to 0.0µV. Therefore, using a set-point at or near 0°C when
calculating thermocouple coefficients may cause erroneous results. For
best results, use at least two set-points that are not near 0°C (more than
±5°C).
3.
The CJC readings, if used, can be in either temperature (°C or °F) or
voltage (mV or μV). If no CJC readings are needed, a scale does not
need to be selected.
Note: If CJC readings are entered in temperature, the standard thermocouple coefficients for the selected thermocouple type are used to calculate the voltage at each reading. The calculated voltages are then added to
each corresponding UUT reading before calculating characterization coefficients for the UUT. If CJC readings are entered in voltage, they are
converted to the correct scale (i.e. mV or µV) and added to each corresponding UUT reading
4.
The Thermocouple type must be selected. The following types can be
selected:
a) Type B
b) Type E
c) Type J
d) Type K
42
3 Coefficients menu
Requirements for calculating coefficients
e) Type N
f) Type R
g) Type S
h) Type T
i) Type AuPt (Gold-Platinum)
5.
The temperature range for the Thermocouple type must be selected. The
following ranges can be selected:
Type
Range 1
Range 2
Range 3
Other
Type B
0 to 630.615°C
630.615 to 1820°C
N/A
N/A
Type E
-270 to 0°C
0 to 1000°C
N/A
N/A
Type J
-210 to 760°C
760 to 1200°C
N/A
N/A
Type K
-270 to 0°C
0 to 1372°C
N/A
N/A
Type N
-270 to 0°C
0 to 1300°C
N/A
N/A
Type R
-50 to 1064.18°C
1064.18 to 1664.5°C
1664.5 to 1768.1°C
–50°C to 1768.1°C (using
extrapolation)*
Type S
-50 to 1064.18°C
1064.18 to 1664.5°C
1664.5 to 1768.1°C
–50°C to 1768.1°C (using
extrapolation)*
Type T
-270 to 0°C
0 to 400°C
N/A
N/A
Type AuPt
0 to 1000°C
(8th order Canadian
Polynomial)
0 to 1000°C
(9th order American
Polynomial)
N/A
N/A
*Selecting this range allows TableWare to automatically select the appropriate reference function to use to calculate the EMF at each temperature. Selecting one of the other ranges forces TableWare to use the reference function for the selected range to calculate the EMF for
ALL temperatures.
6.
Each set-point for Thermocouple probes can have an associated Cold
Junction Compensation (CJC) reading. If CJC values are not needed,
leave the CJC boxes blank. The UUT reading at each set-point is adjusted according the CJC reading for that set-point prior to calculating
coefficients. The UUT readings are not adjusted prior to calculating coefficients if values are not entered in the CJC boxes.
7.
Residuals are calculated for each set-point used in calculating the coefficients. For Thermocouple probes, the residuals are in the scale that the
UUT readings were entered in (mV or μV).
8.
The following Thermocouple coefficients are calculated: (The values of
these coefficients are the sum of the standard coefficients and the deviation calculated using the selected set-points.)
a) c1
43
9933 TableWare
User’s Guide
b) c2
9.
The following standard Thermocouple coefficients are also produced
unaltered:
Range 1 Coefficients
Range 2 Coefficients
Range 3 Coefficients
Other
(see above)
Type B
c3...c6
c0, c3...c8
N/A
N/A
Type E
c3...c13
c3...c10
N/A
N/A
Type J
c3...c8
c0, c3...c5
N/A
N/A
Type K
c3...c10
c0, c3...c9
N/A
N/A
Type N
c3...c8
c3...c10
N/A
N/A
Type R
c3...c9
c0, c3...c5
c0, c3...c4
c3...c9
Type S
c3...c8
c0, c3...c4
c0, c3...c4
c3...c8
Type T
c3...c14
c3...c8
N/A
N/A
Type AuPt
c3...c8
c3..c9
N/A
N/A
Type
3.8
Methods used for calculating coefficients
The thermometric expressions used by this software are well known expressions and as such are described in detail elsewhere. This section touches on
some specifics as they relate to the methods used to arrive at solutions.
The coefficients for all solutions with the exception of the IPTS-68 platinum
probe are calculated using matrix methods. The IPTS-68 platinum probe solution is calculated using iteration. The solutions are either exact solutions or
overdetermined solutions depending on the number of set-points used in relation to the number of set-points required. Exact solutions result when the exact
number of set-points required for simultaneous solution of sets of equations are
used (i.e., two coefficients from two set-points). Overdetermined solutions result when more set-points are used than the unknowns require (i.e., two coefficients from three or more set-points).
3.8.1
ITS-90
The ITS-90 is expressed in terms of resistance ratio(W) vs. temperature (K)
rather than resistance (R) vs. temperature. The resistance ratio is defined as the
resistance at a temperature divided by the resistance at the triple point of water,
or:
W =
Rt
Rtpw
Because ratios are used in the ITS-90, the Rtpw is required in addition to the resistance values at the test temperatures, thus, three set-points are required to
44
3 Coefficients menu
Methods used for calculating coefficients
solve for two coefficients. The example below shows a set of four equations
representing data at five temperatures ( Rtpw and resistance at four test temperatures) along with the matrix method used to solve the overdetermined set.
A
ΔWT 1 = [ a(WT 1 − 1) + b(WT 1 − 1) 2 ]
ΔWT 2 = [ a(WT 2 − 1) + b(WT 2 − 1) 2 ]
ΔWT 3 = [ a(WT 3 − 1) + b(WT 3 − 1) 2 ]
ΔWT 4 = [ a(WT 4 − 1) + b(WT 4 − 1) 2 ]
B
⎡ ΔW T 1 ⎤
⎢ ΔW ⎥
T2 ⎥
Matrix 1 = ⎢
⎢ ΔW T 3 ⎥
⎢
⎥
⎣ ΔW T 4 ⎦
C
Solution = ( Matrix 2T ⋅ Matrix 2 ) –1 ⋅ Matrix 2T ⋅ Matrix 1
⎡ (WT 1
⎢
(W
Matrix 2 = ⎢ T 2
⎢(WT 3
⎢
⎢⎣(WT 4
− 1) (WT 1 − 1) 2 ⎤
⎥
− 1) (WT 2 − 1) 2 ⎥
− 1) (WT 3 − 1) 2 ⎥
⎥
− 1) (WT 4 − 1) 2 ⎥⎦
An exact solution (i.e., two unknowns in two equations) would be arrived at
with the following operation:
C′
3.8.2
Solution = Matrix 2–1 ⋅ Matrix 1
IPTS-68
IPTS-68 Like the ITS-90, the IPTS-68 is expressed in terms of resistance ratios. The denominator, however, is the resistance at the ice point (0.000C)
rather than the resistance at the triple point of water (0.010C). This software allows only exact solutions for the IPTS-68 and uses iteration or simple algebra
for the solutions.
3.8.3
Callendar-Van Dusen
The Callendar-Van Dusen expression is basically a third order polynomial with
the third coefficient (β) set to zero above 0°C. The polynomial is expressed in
terms of resistance vs. temperature in °C. It is solved by matrix methods in a
similar manner as the ITS-90 expression shown above with temperature on the
left of the equal sign and the polynomial on the right. The software allows for
overdetermined solutions. Only data above 0°C is used for solution of the first
two coefficients (α and δ). Data both above and below 0°C is used for solution
of β.
3.8.4
Polynomial and thermocouple
Polynomial solutions are arrived at using matrix methods as with the ITS-90
and the Callendar-Van Dusen. Platinum probes require polynomials expressed
in terms of resistance vs. temperature. Thermistor probes exhibit exponential
resistance vs. temperature relationships and the polynomials used are exponential expressions in terms of resistance vs. temperature. The polynomials can be
of any order up to 9th for platinum probes and up to 6th for thermistor probes.
45
9933 TableWare
User’s Guide
The software allows for over determined solutions. Thermocouple probes require polynomials expressed in terms of μV vs. temperature.
3.9
Software output
TableWare produces as output a report and a table. Both the report and the table
can be printed to a printer or saved as an ASCII text file.
3.9.1
Report or ASCII text file
The report or exported ASCII text file (Figure 27) contains the identifying information, the raw data, the coefficients, and the page number. The report can
be printed or exported from the Coefficients and Residuals dialog (see Section
3.5).
3.9.2
Table
The table (Figure 28) contains the probe identifying information, the page
number, and the date. The table can be printed or exported from the Table Options dialog (see Section 3.5.1).
3.10
Print preview window
The Print Preview window (Figure 26) is used to view reports and tables on the
screen without having to print a hard copy. The Print Preview window is activated by selecting the “Enable print preview” check box on the File|Defaults
46
3 Coefficients menu
Print preview window
General tab. Other settings on the General tab can be changed to manipulate the
default behavior of the Print Preview window.
Figure 26 Print Preview window
Enabled and disabled
The enabled and disabled state of the navigation and zoom buttons change depending on the current state of the Print Preview window.
Window information
The Print Preview window is displayed when printing reports and tables if the
“Enable print preview” check box on the File|Defaults General tab is selected.
The icons on the toolbar of the Print Preview window perform the following
functions:
Close - Closes the Print Preview window
47
9933 TableWare
User’s Guide
Print - Prints all pages of the document in the Print Preview window
First page - Navigates to the first page of the document (if more than
one page)
Previous page - Navigates to the previous page of the document (if
more than one page)
Next page - Navigates to the next page of the document (if more than
one page)
Last page - Navigates to the last page of the document (if more than
one page)
Zoom in - Zooms in to (enlarge) the document
Zoom out - Zooms out from (reduce) the document
The toolbar also indicates the current page and the number of pages in the current document.
48
3 Coefficients menu
Print preview window
Figure 27 Sample report or exported ASCII text file
49
9933 TableWare
User’s Guide
Figure 28 Sample table
50
4 Table menu
Enter coefficients
4
Table menu
Figure 29 Table menu
The Table menu (Figure 29) provides options for generating Temperature vs.
Resistance, Temperature vs. Ratio and Temperature vs. EMF tables based on
coefficients that can be entered manually. Selecting any one of the menu options displays the Probe Information dialog and then the appropriate Coefficient dialog as discussed in Sections 3.1 through 3.2. Selecting the Continue
button on the coefficients dialog displays the Enter Coefficients dialog.
Enabled and disabled
All options are enabled at all times.
4.1
Enter coefficients
The Enter Coefficients dialog (Figure 30) is formatted for either ITS-90,
IPTS-68, CVD, Polynomial or Thermocouples depending on the type of coefficients selected.
Figure 30 Enter Coefficients dialog for ITS-90 coefficients
Enabled and disabled
The OK button is disabled until coefficients have been entered into all required
boxes.
51
9933 TableWare
User’s Guide
Dialog information
Enter the coefficients to be used to generate the table. A value must be entered
into each of the boxes provided.
• For ITS-90, RTPW is always required. Low range coefficients must be
entered if an ITS-90 low range was selected. High range coefficients must
be entered if an ITS-90 high range was selected.
• For IPTS-68, enter values for R0, ALPHA, DELTA, A4 and C4.
• For Callendar-Van Dusen, enter values for R0, ALPHA, and DELTA. The
BETA coefficient is optional.
• For Polynomials, enter values for all R(T) coefficients a, b, c, etc. If the
Steinhart-Hart option was selected, the third coefficient (squared term) is
set to 0.0 and cannot be changed.
• For Thermocouples, enter the deviations for coefficients c1 and c2. These
values are added to the standard coefficients for the type of thermocouple
and range selected.
When the Continue button is selected and the type of coefficients is Polynomial
for Platinum probes, the Select Calculation Scale dialog (see Figure 14 on page
22) is displayed. Select the temperature scale that the polynomial coefficients
were calculated in. Select the OK button to continue. The Table Options dialog
is displayed. Section 3.5.1 discusses the Table Options dialog.
The Cancel button returns to the Select Coefficients dialog.
52
5 Help Menu
Contents
5
Help Menu
Figure 31 Help menu
The Help Menu (Figure 31) provides a method for accessing help through the
help file contents, search on a specific topic of the software, and on how to get
started. The Technical Support phone numbers and software version number
are also available from the Help menu.
Enabled and disabled
All menu options are enabled.
5.1
Contents
The Contents menu option displays TableWare’s on-line help file contents
topic.
5.2
Search for help on
The Search for Help On menu option opens the TableWare help file with the
Windows® Help Search dialog open. Select or enter a keyword to search for a
topic or select Cancel to exit to the help file.
5.3
Getting started
The Getting Started menu option opens the Help file to the Getting Started
topic and explains how to begin using TableWare.
TableWare requires the user to select the type of probe for which coefficients
are to be calculated and then to enter the raw data. To select the type of probe,
use the Coefficients menu. The software guides you through the next steps.
53
9933 TableWare
User’s Guide
5.4
Technical support
The Technical Support menu option displays the Technical Support topic in the
help file.
Please contact one of the following authorized Service Centers to coordinate
service on your product:
Fluke Corporation, Hart Scientific Division
799 E. Utah Valley Drive
American Fork, UT 84003-9775
USA
Phone: +1.801.763.1600
Telefax: +1.801.763.1010
E-mail: [email protected]
Fluke Nederland B.V.
Customer Support Services
Science Park Eindhoven 5108
5692 EC Son
NETHERLANDS
Phone: +31-402-675300
Telefax: +31-402-675321
E-mail: [email protected]
Fluke Int'l Corporation
Service Center - Instrimpex
Room 2301 Sciteck Tower
22 Jianguomenwai Dajie
Chao Yang District
Beijing 100004, PRC
CHINA
Phone: +86-10-6-512-3436
Telefax: +86-10-6-512-3437
E-mail: [email protected]
54
5 Help Menu
About
Fluke South East Asia Pte Ltd.
Fluke ASEAN Regional Office
Service Center
60 Alexandra Terrace #03-16
The Comtech (Lobby D)
118502
SINGAPORE
Phone: +65 6799-5588
Telefax: +65 6799-5588
E-mail: [email protected]
Check our website on the Internet regularly for answers to Frequently Asked
Questions, software updates, and Service Releases.
Before calling for Technical Support, check the Help file topics listed below to
see if the problem you are having is described there:
• Requirements
• Installation
• International Settings
• TableWare Messages
• TableWare Error Messages
When calling or sending a fax, please send or have the following information
ready:
• Name of Software (TableWare)
• Software version and build as found on the About TableWare dialog
• Detailed description of the problem
• What you were doing when the problem arose
• The exact wording of any error message you received
• Any other information that may help to solve the problem
5.5
About
The About menu option displays the About TableWare dialog (Figure 32). The
55
9933 TableWare
User’s Guide
software version number, the year the version was released, and specific information about the computer are displayed on this dialog.
Figure 32 About TableWare dialog
56
6 Messages
TableWare Messages
6
6.1
Messages
TableWare Messages
Message “The [report][table] was successfully exported to filename.”
Message “The raw data that was entered may contain errors or may be inappropriate for the selected type of coefficients. Carefully check the raw data for errors before attempting to calculate coefficients again.”
Remarks TableWare was not able to calculate coefficients based on the raw
data that was entered. Check the raw data for mistakes and attempt to calculate
the coefficients again.
Message “At least one ITS-90 range must be selected to calculate ITS-90
coefficients.”
Remarks When calculating ITS-90 coefficients, a low range, high range or
both must be selected. Selecting None for both the low and high range is not
permitted.
Message “Every coefficient must have a value. [Other information.] Finish filling in the coefficient values then select Continue.”
Remarks When entering coefficients to generate a table, all listed coefficients
must have a value entered into the box. Enter values for all coefficients.
Message “Coefficients R0, ALPHA and DELTA must have values. BETA can
be left blank. Finish filling in the coefficient values then select Continue.”
Remarks When entering Callendar-Van Dusen coefficients to generate a table,
the R0, ALPHA and DELTA coefficients must have a value entered into the
boxes. Enter values for these coefficients.
Message “Unable to retrieve standard thermocouple coefficients. Cannot
continue.”
Remarks To generate a thermocouple table, the standard coefficients must be
read in from the CALCCOEF.DLL file. Make sure the CALCCOEF.DLL file is
located in the \WINDOWS\SYSTEM or \WINNT\SYSTEM directory. Alternatively, this file can be placed in the directory where the application is installed.
Message “Warning: The selected temperature range exceeds the recommended
range for the coefficients. Calculations for any temperatures below minimum
temperature and above maximum temperature will be extrapolated. Select OK
to continue or select Cancel to abort.”
Remarks The selected minimum and maximum temperatures for generating a
table exceed the lowest and highest set-points used to calculate the coefficients
or exceed the recommended temperature range for the coefficients being used.
In order to generate a table over the range specified, TableWare must use extrapolation. For recommended temperature ranges for generating tables, see
57
9933 TableWare
User’s Guide
Section 3.6, Table Temperature Range Chart. If the selected minimum and
maximum temperatures are too extreme, the algorithms used to calculate the table values may not produce correct results. TableWare has been throughly
tested over the recommended temperature ranges and found to produce correct
results.
6.2
TableWare Error Messages
Message “An error occurred while calculating coefficient type table values at
temperature. The algorithms used may not be able to solve for this value.
Changing the minimum or maximum temperature for the table may solve this
problem.
[Error: error number - description]"
Remarks The minimum and/or maximum temperatures selected may exceed
the recommended minimum or maximum temperatures for generating the table.
The algorithms used to generate table values cannot always solve for extreme
values. For recommended temperature ranges for generating tables, see Section
3.6, Table Temperature Range Chart.
Message “There was an error writing to the .INI file:
File: filename
Section: section
Entry: entry
Value: value
[Error: error number – description]”
Remarks TableWare was not able to write to the .INI file. The error number-description message gives an indication of the reason for this error
message.
Message “All of the required data for coefficient type coefficients has not been
entered.
Reasons:
Reason 1
Reason 2
.
.
.
Reason n
Remarks The raw data entered by the user is not complete. Make sure all of
the required data has been entered according to the reasons listed.
58
6 Messages
TableWare Error Messages
Message “An error occurred while calculating coefficient type coefficients.
Make sure the CALCCOEF.DLL file is located in the \WINDOWS\SYSTEM
or \WINNT\SYSTEM directory.
[Error: error number - description]"
Remarks The selected coefficients could not be calculated. The reason is described by the error number - description message. Check the raw data for mistakes or change the type of coefficients to calculate and try again.
Message “An error occurred while printing the [table][raw data]: Message.”
Remarks TableWare was not able to print the table or raw data on the report
because of the problem described in the Message.
Message “An error occurred while exporting coefficient type report data to
filename.
[Error: error number - description]"
Remarks The report could not be exported to the file filename because of the
problem described by the error number - description message.
Message “An error occurred while importing [coefficient type] raw data from
filename.
[Error: error number - description]"
Remarks The raw data file filename could not be imported because of the
problem described by the error number - description message.
Message “An error occurred while calculating coefficient type coefficients.
Error: error number - description“
Remarks The selected coefficients could not be calculated. The reason is described by the error number - description message. Check the raw data for mistakes or change the type of coefficients to calculate and try again.
Message “An error occurred while calculating coefficient type table values.
Error: error number - description“
Remarks The selected table could not be generated. The reason is described by
the error number - description message. Check the raw data and/or coefficients
for mistakes and try again.
Message “An error occurred while retrieving standard Thermocouple coefficients. Make sure the CALCCOEF.DLL file is located in the \WINDOWS\SYSTEM or \WINNT\SYSTEM directory.”
Remarks In order to generate a table using Thermocouple coefficients, the software must retrieve the standard coefficients from the CALCCOEF.DLL file. This
file was most likely either not found or may not be the correct version. Make sure
this file exists in the \WINDOWS\SYSTEM or \WINNT\SYSTEM directory.
59
7 Glossary
7
Glossary
coefficients - Values used to define characteristics of a probe.
help balloons - The yellow boxes with words that appear below and to the side
of the toolbar icons when the mouse is passed over them.
model number - The model number of the probe.
RTPW - The resistance of a platinum probe at the Triple Point of Water, which
is 0.01°C.
raw data - The reference probe readings, test probe readings, and CJC readings
(if applicable) used to calculated the coefficients.
reference probe readings -The temperature readings taken from the reference
readout device to which the reference probe is connected.
residuals - The difference between the measured and actual values at the
set-points used to calculate coefficients.
serial number - The serial number of the probe.
test date - The date the test was performed.
Toolbar - The strip of icons across the top of the screen on the TableWare main
display screen.
Triple Point of Water - The temperature at which the 3 states of water are all
present (0.01°C).
UUT - Stands for Unit Under Test. UUT refers to the test probe.
61