1
Creating and Using Report Templates
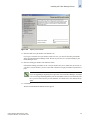
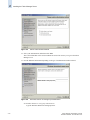
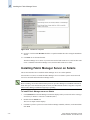
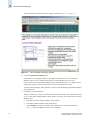
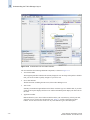
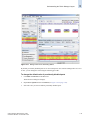
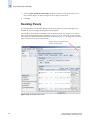
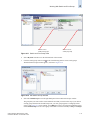
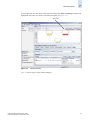
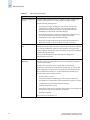
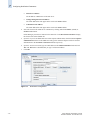
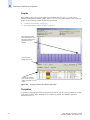
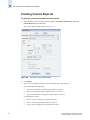
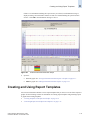
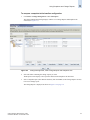
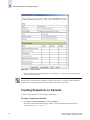
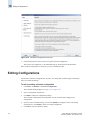
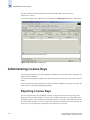
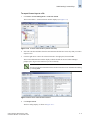
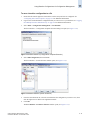
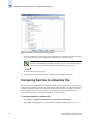
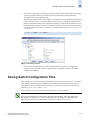
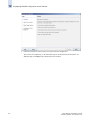
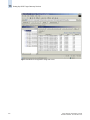
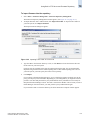
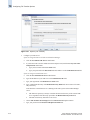
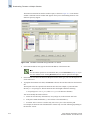
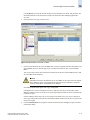
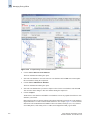
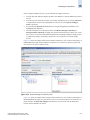
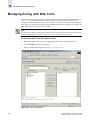
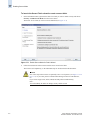
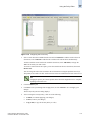
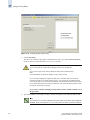
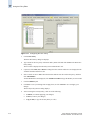
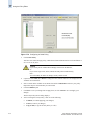
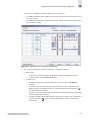
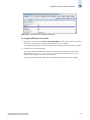
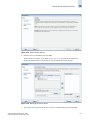
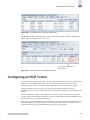
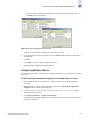
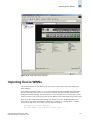
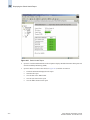
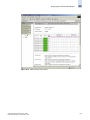
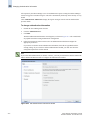
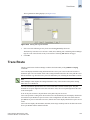
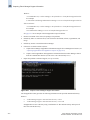
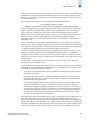
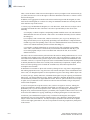
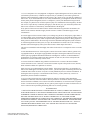
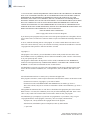
Figure 8-9
8
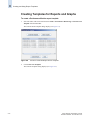
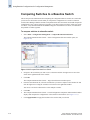
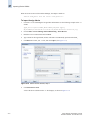
Creating a Report or Graph Template
3.
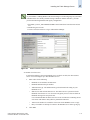
Click Report or Graph.
4.
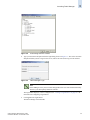
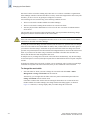
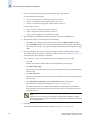
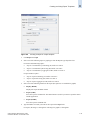
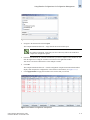
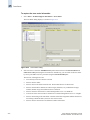
Select one of the following report or graph types from the Report Type drop-down list:
For end-to-end monitoring reports...
•
•
•
“Top N” Conversations by Generating (Tx) traffic over time T
“Top N” Conversations by Receiving (Rx) traffic over time T
“Top N” Conversations by Aggregate (Tx/Rx) traffic over time T
For port statistics reports...
•
•
•
5.
“Top N” of ports Generating (Tx) traffic over time T
“Top N” of ports Receiving (Rx) traffic over time T
“Top N” of ports Aggregate (Tx/Rx) traffic over time T
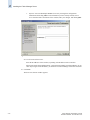
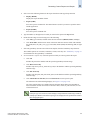
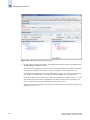
Select one of the following formats for the report (this option is not available for graphs):
•
Display (HTML)
Displays the report in HTML format.
•
Export (XML)
Saves the report as an XML file. The XML format is useful if you want to export the data to
another application.
•
Export (HTML)
Saves the report as an HTML file.
6.
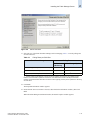
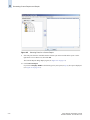
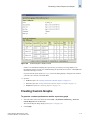
Type the number of results you want for the report in the Top N field.
For reports, the range is 1 through 100. The range for graphs is 1 through 20.
Fabric Manager Administrator’s Guide
Publication Number: 53-1000196-01-HP
8-15