1
Note 1C • Box Plots (continued)
CFX-9850GB Plus
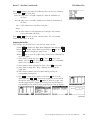
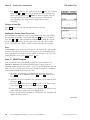
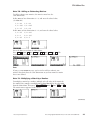
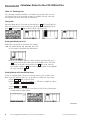
Press SHIFT [V-Window] and input the following values on the View Window
screen. Press EXE after each entry.
Xmin: 300
max: 500
scale: 1
(This value is a number slightly less than the minimum of
the data.)
(This value is a number slightly greater than the maximum of
the data.)
(This number does not affect a box plot.)
Ymin: 0
max: 10
(This number is not important for a box plot. Any number
greater than Ymin will work.)
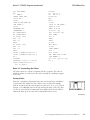
Press EXIT or EXE when you are done entering values. The view window
shown is [300, 500, 1, 0, 10, 0].
Displaying the Box Plot
This example uses the data in List 1, but you can choose any list.
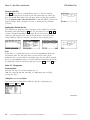
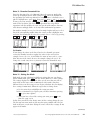
a. Press MENU to display the Main Menu. Highlight STAT and press EXE .
b. Press SHIFT [SET UP]. Arrow down to Grid and press F2 (Off). Press EXE .
c. Press F1 (GRPH) to display the graph menu.
d. Press F6 (SET) to enter the graph settings menu. Press a function key
to select a graph.
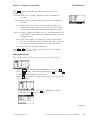
e. Arrow down to Graph Type. Press F6 (¤). Press F2 (Box) to select
MedBox. (Pressing F3 (Box) also gives a box plot; but it is a MeanBox,
which is not used in this course.)
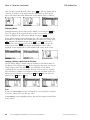
f. Arrow down to XList to display list choices. Press F1 to select List 1.
g. Arrow down to Graph Color. Press a function key to select the
graph color.
h. Arrow down to Outliers and select On or Off by pressing the
corresponding function key.
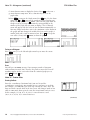
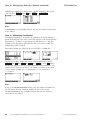
i. Press EXIT to return to the Graph screen. Press F4 (SEL). Use the
down arrow and F1 or F2 to turn on the graph you selected and to
turn off the other graphs. Press F6 (DRAW) to draw the graph. (You
can also graph from the Graph screen by pressing the function key
corresponding to the number of the graph that you want to display.)
(continued)
©2003 Key Curriculum Press
Discovering Algebra Calculator Notes for the Casio CFX-9850GB Plus
11